rbc capital markets global ... - flowserve corporation
TRANSCRIPT
FLOWSERVE CORPORATION (NYSE: FLS)
RBC Capital Markets Global Industrials Conference
September 10, 2013
Safe Harbor Statement
Page 2
Safe Harbor Statement: This presentation includes forward-looking statements within the meaning of Section 27A of the Securities Act of 1933 and Section 21E of the Securities Exchange Act of 1934, which are made pursuant to the safe harbor provisions of the Private Securities Litigation Reform Act of 1995, as amended. Words or phrases such as, “may,” “should,” “expects,” “could,” “intends,” “plans,” “anticipates,” “estimates,” “believes,” “forecasts,” “predicts” or other similar expressions are intended to identify forward-looking statements, which include, without limitation, earnings forecasts, statements relating to our business strategy and statements of expectations, beliefs, future plans and strategies and anticipated developments concerning our industry, business, operations and financial performance and condition. The forward-looking statements included in this presentation are based on our current expectations, projections, estimates and assumptions. These statements are only predictions, not guarantees. Such forward-looking statements are subject to numerous risks and uncertainties that are difficult to predict. These risks and uncertainties may cause actual results to differ materially from what is forecast in such forward-looking statements, and include, without limitation, the following: a portion of our bookings may not lead to completed sales, and our ability to convert bookings into revenues at acceptable profit margins; changes in the global financial markets and the availability of capital and the potential for unexpected cancellations or delays of customer orders in our reported backlog; our dependence on our customers’ ability to make required capital investment and maintenance expenditures; risks associated with cost overruns on fixed-fee projects and in taking customer orders for large complex custom engineered products; the substantial dependence of our sales on the success of the oil and gas, chemical, power generation and water management industries; the adverse impact of volatile raw materials prices on our products and operating margins; our ability to execute and realize the expected financial benefits from our strategic realignment initiatives; economic, political and other risks associated with our international operations, including military actions or trade embargoes that could affect customer markets, particularly Middle Eastern markets and global oil and gas producers, and non-compliance with U.S. export/re-export control, foreign corrupt practice laws, economic sanctions and import laws and regulations; our exposure to fluctuations in foreign currency exchange rates, including in hyperinflationary countries such as Venezuela; our furnishing of products and services to nuclear power plant facilities and other critical processes; potential adverse consequences resulting from litigation to which we are a party, such as litigation involving asbestos-containing material claims; a foreign government investigation regarding our participation in the United Nations Oil-for-Food Program; expectations regarding acquisitions and the integration of acquired businesses; our relative geographical profitability and its impact on our utilization of deferred tax assets, including foreign tax credits; the potential adverse impact of an impairment in the carrying value of goodwill or other intangible assets; our dependence upon third-party suppliers whose failure to perform timely could adversely affect our business operations; the highly competitive nature of the markets in which we operate; environmental compliance costs and liabilities; potential work stoppages and other labor matters; our inability to protect our intellectual property in the U.S., as well as in foreign countries; obligations under our defined benefit pension plans; and other factors described from time to time in our filings with the Securities and Exchange Commission. All forward-looking statements included in this presentation are based on information available to us on the date hereof, and we assume no obligation to update any forward-looking statement.
Page 3
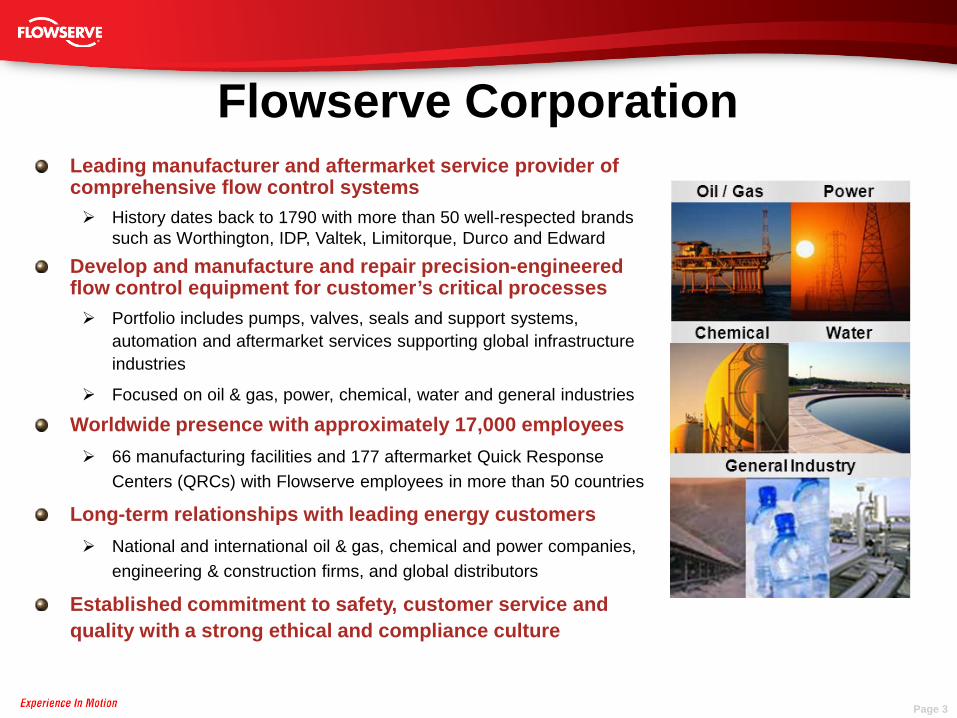
Flowserve Corporation Leading manufacturer and aftermarket service provider of comprehensive flow control systems History dates back to 1790 with more than 50 well-respected brands
such as Worthington, IDP, Valtek, Limitorque, Durco and Edward
Develop and manufacture and repair precision-engineered flow control equipment for customer’s critical processes Portfolio includes pumps, valves, seals and support systems,
automation and aftermarket services supporting global infrastructure industries
Focused on oil & gas, power, chemical, water and general industries
Worldwide presence with approximately 17,000 employees 66 manufacturing facilities and 177 aftermarket Quick Response
Centers (QRCs) with Flowserve employees in more than 50 countries
Long-term relationships with leading energy customers National and international oil & gas, chemical and power companies,
engineering & construction firms, and global distributors
Established commitment to safety, customer service and quality with a strong ethical and compliance culture
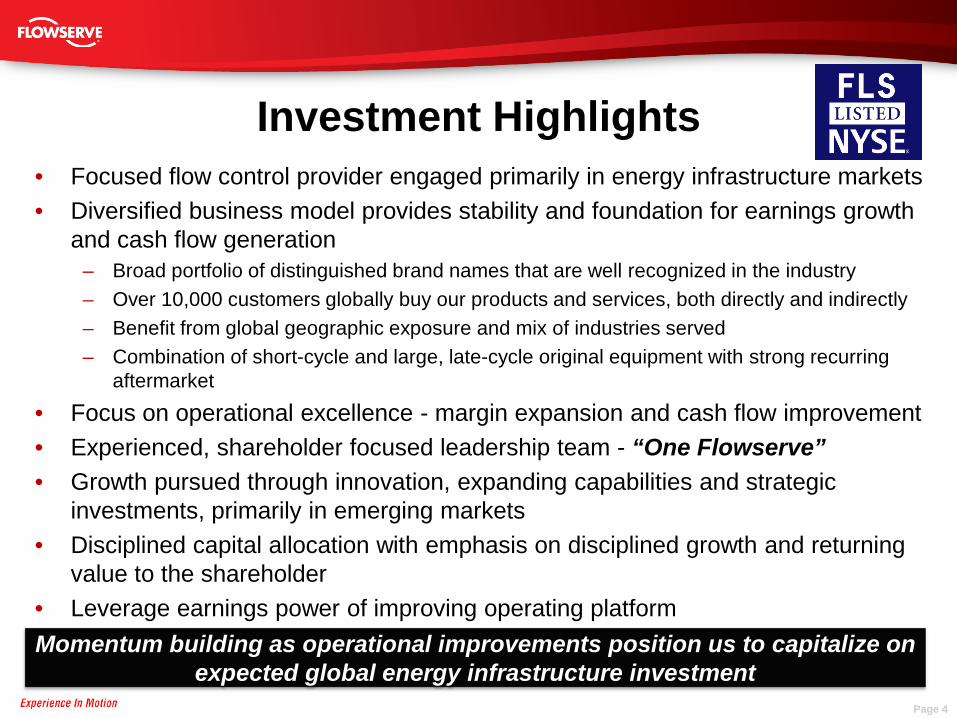
Investment Highlights
Page 4
Momentum building as operational improvements position us to capitalize on expected global energy infrastructure investment
• Focused flow control provider engaged primarily in energy infrastructure markets • Diversified business model provides stability and foundation for earnings growth
and cash flow generation – Broad portfolio of distinguished brand names that are well recognized in the industry – Over 10,000 customers globally buy our products and services, both directly and indirectly – Benefit from global geographic exposure and mix of industries served – Combination of short-cycle and large, late-cycle original equipment with strong recurring
aftermarket
• Focus on operational excellence - margin expansion and cash flow improvement • Experienced, shareholder focused leadership team - “One Flowserve” • Growth pursued through innovation, expanding capabilities and strategic
investments, primarily in emerging markets • Disciplined capital allocation with emphasis on disciplined growth and returning
value to the shareholder • Leverage earnings power of improving operating platform
Page 5
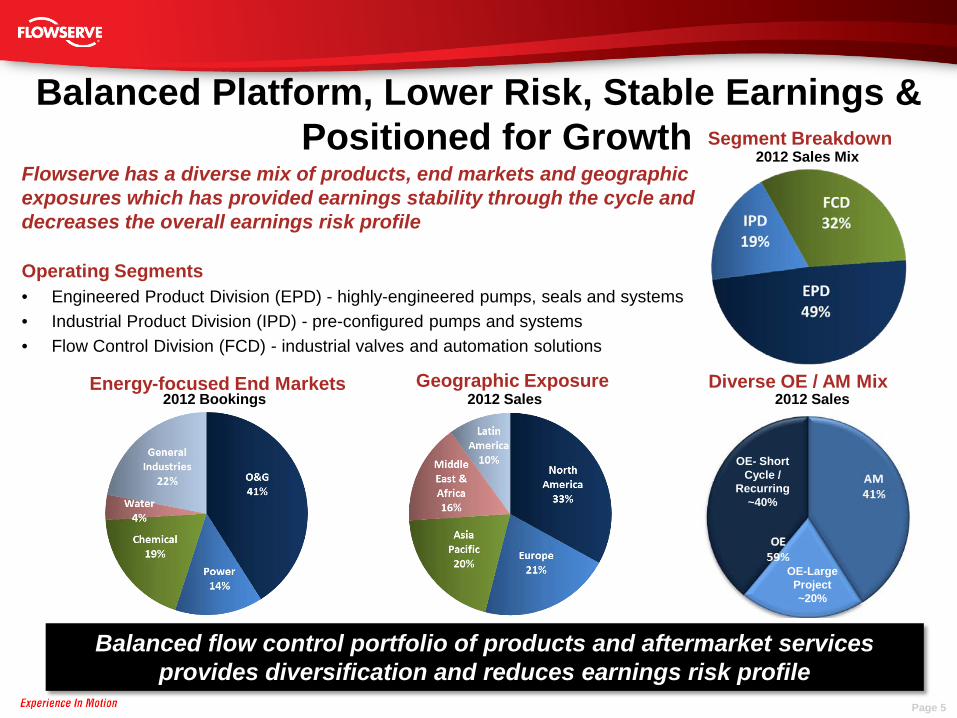
Balanced Platform, Lower Risk, Stable Earnings & Positioned for Growth
Flowserve has a diverse mix of products, end markets and geographic exposures which has provided earnings stability through the cycle and decreases the overall earnings risk profile Operating Segments • Engineered Product Division (EPD) - highly-engineered pumps, seals and systems • Industrial Product Division (IPD) - pre-configured pumps and systems • Flow Control Division (FCD) - industrial valves and automation solutions
2012 Bookings Energy-focused End Markets Geographic Exposure Diverse OE / AM Mix
2012 Sales 2012 Sales
2012 Sales Mix Segment Breakdown
OE-Large Project ~20%
OE- Short Cycle /
Recurring ~40%
Balanced flow control portfolio of products and aftermarket services provides diversification and reduces earnings risk profile
Page 6
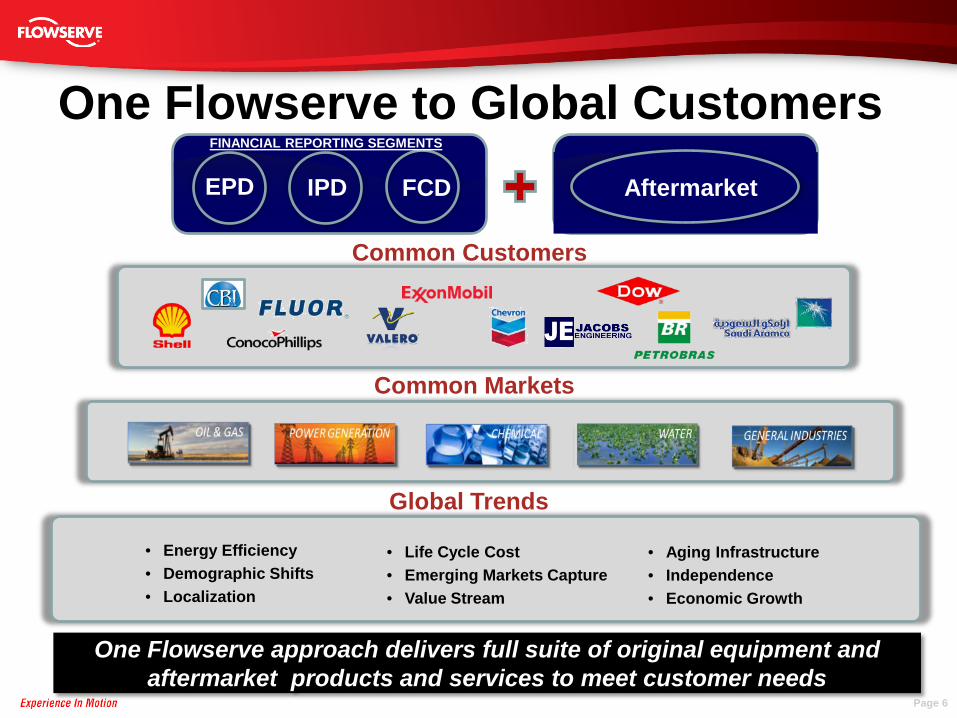
Common Markets
Common Customers
Global Trends
FCD IPD EPD
• Aging Infrastructure • Independence • Economic Growth
• Energy Efficiency • Demographic Shifts • Localization
• Life Cycle Cost • Emerging Markets Capture • Value Stream
Aftermarket
FINANCIAL REPORTING SEGMENTS
One Flowserve to Global Customers
One Flowserve approach delivers full suite of original equipment and aftermarket products and services to meet customer needs
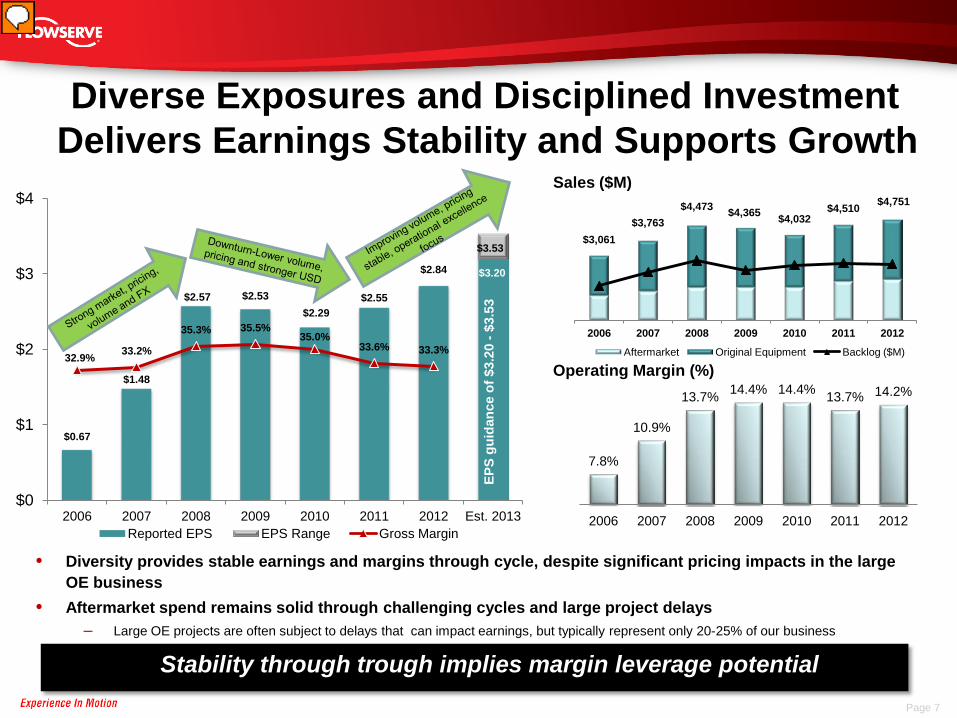
Diverse Exposures and Disciplined Investment Delivers Earnings Stability and Supports Growth
• Diversity provides stable earnings and margins through cycle, despite significant pricing impacts in the large OE business
• Aftermarket spend remains solid through challenging cycles and large project delays – Large OE projects are often subject to delays that can impact earnings, but typically represent only 20-25% of our business
7.8%
10.9%
13.7% 14.4% 14.4% 13.7% 14.2%
2006 2007 2008 2009 2010 2011 2012
Operating Margin (%)
$0.67
$1.48
$2.57 $2.53 $2.29
$2.55
$2.84 $3.20
32.9% 33.2%
35.3% 35.5% 35.0%
33.6% 33.3%
$0
$1
$2
$3
$4
2006 2007 2008 2009 2010 2011 2012 Est. 2013 Reported EPS EPS Range Gross Margin
EPS
guid
ance
of $
3.20
- $3
.53
$3.53
Sales ($M)
Page 7
$3,061 $3,763
$4,473 $4,365 $4,032 $4,510 $4,751
2006 2007 2008 2009 2010 2011 2012
Aftermarket Original Equipment Backlog ($M)
Stability through trough implies margin leverage potential
Page 8
P a g e 7
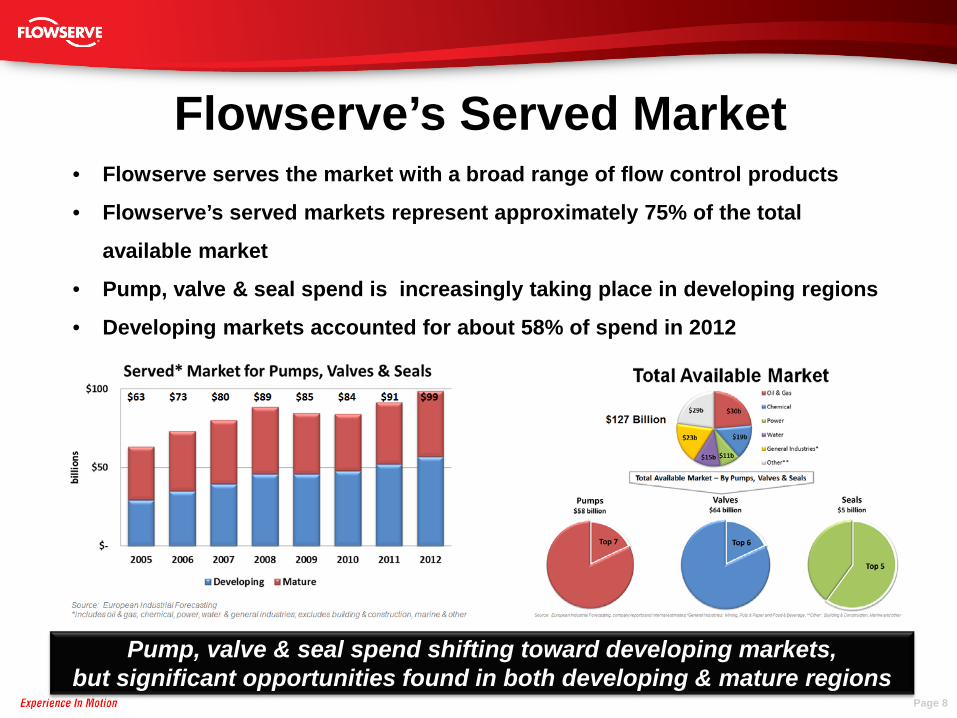
Pump, valve & seal spend shifting toward developing markets, but significant opportunities found in both developing & mature regions
Flowserve’s Served Market • Flowserve serves the market with a broad range of flow control products
• Flowserve’s served markets represent approximately 75% of the total
available market
• Pump, valve & seal spend is increasingly taking place in developing regions
• Developing markets accounted for about 58% of spend in 2012
Page 9
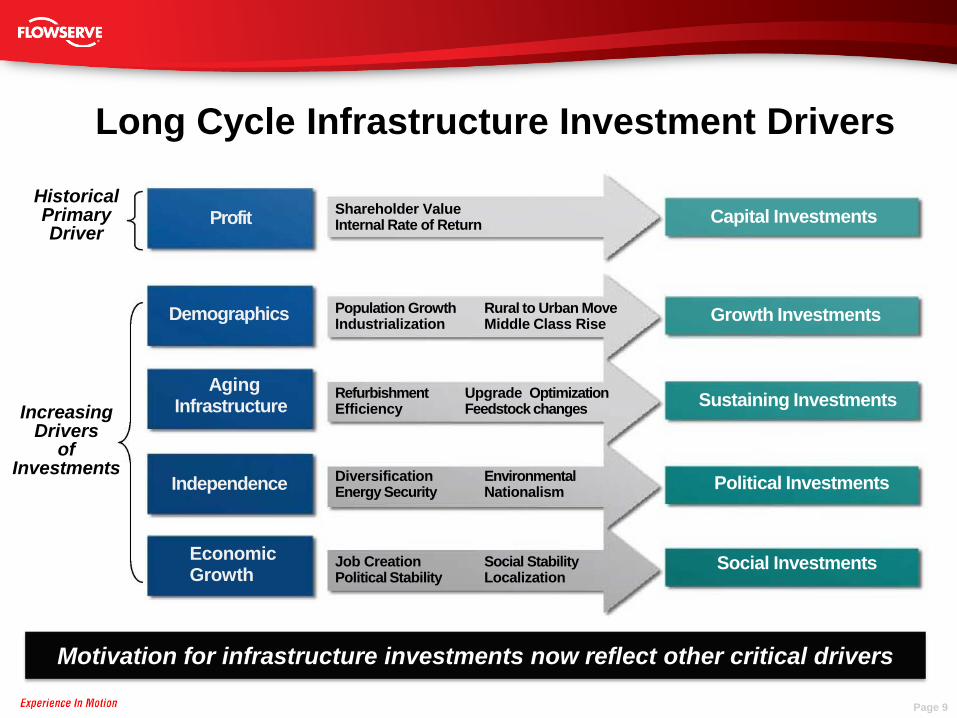
Long Cycle Infrastructure Investment Drivers
Historical Primary Driver
Capital Investments Profit
Aging Infrastructure
Independence
Economic Growth
Refurbishment Efficiency
Diversification Energy Security
Job Creation Political Stability
Rural to Urban Move Middle Class Rise
Increasing Drivers
of Investments
Upgrade Optimization Feedstock changes
Environmental Nationalism
Social Stability Localization
Shareholder Value Internal Rate of Return
Demographics Population Growth Industrialization Growth Investments
Sustaining Investments
Political Investments
Social Investments
Motivation for infrastructure investments now reflect other critical drivers
Page 10
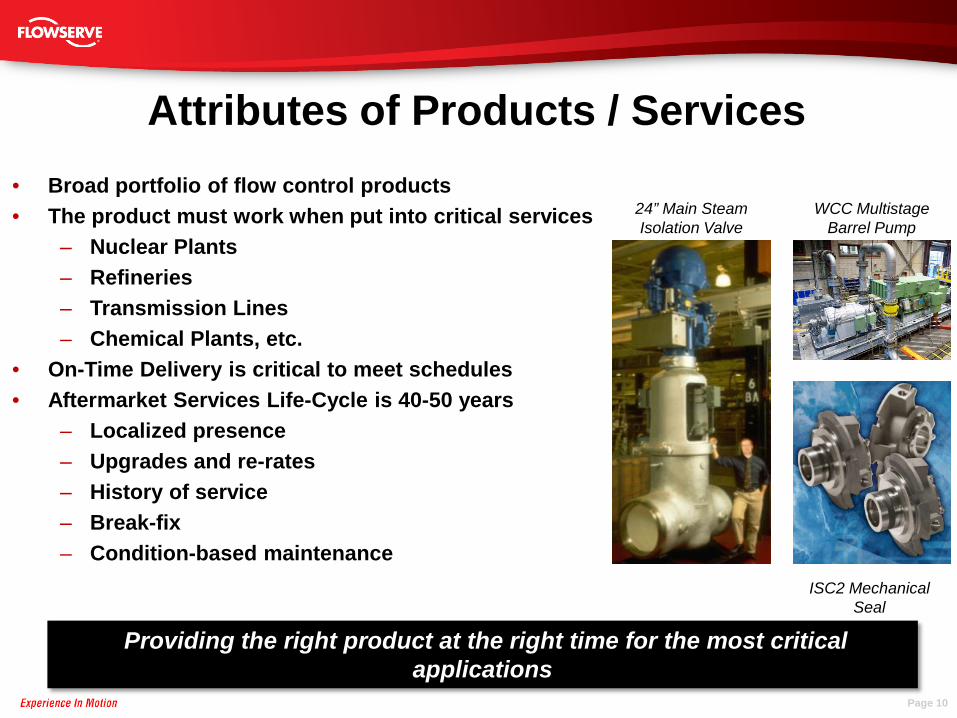
Attributes of Products / Services • Broad portfolio of flow control products • The product must work when put into critical services
– Nuclear Plants – Refineries – Transmission Lines – Chemical Plants, etc.
• On-Time Delivery is critical to meet schedules • Aftermarket Services Life-Cycle is 40-50 years
– Localized presence – Upgrades and re-rates – History of service – Break-fix – Condition-based maintenance
24” Main Steam Isolation Valve
WCC Multistage Barrel Pump
ISC2 Mechanical Seal
Providing the right product at the right time for the most critical applications
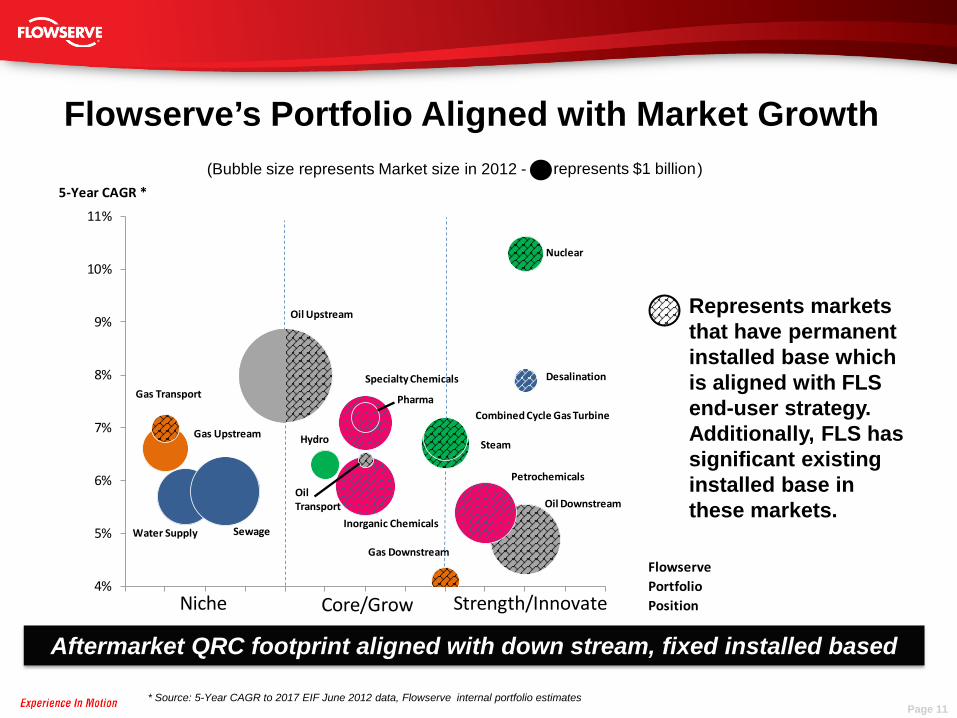
5-Year CAGR *
FlowservePortfolioPosition
4%
5%
6%
7%
8%
9%
10%
11%
Oil Upstream
Gas Transport
Gas Upstream
SewageWater Supply
Nuclear
Desalination
Combined Cycle Gas Turbine
Steam
Petrochemicals
Oil Downstream
Gas Downstream
Inorganic Chemicals
Hydro
OilTransport
Specialty Chemicals
Pharma
Niche Core/Grow Strength/Innovate
Page 11 * Source: 5-Year CAGR to 2017 EIF June 2012 data, Flowserve internal portfolio estimates
(Bubble size represents Market size in 2012 - ) represents $1 billion
Flowserve’s Portfolio Aligned with Market Growth
Aftermarket QRC footprint aligned with down stream, fixed installed based
Represents markets that have permanent installed base which is aligned with FLS end-user strategy. Additionally, FLS has significant existing installed base in these markets.
Page 12
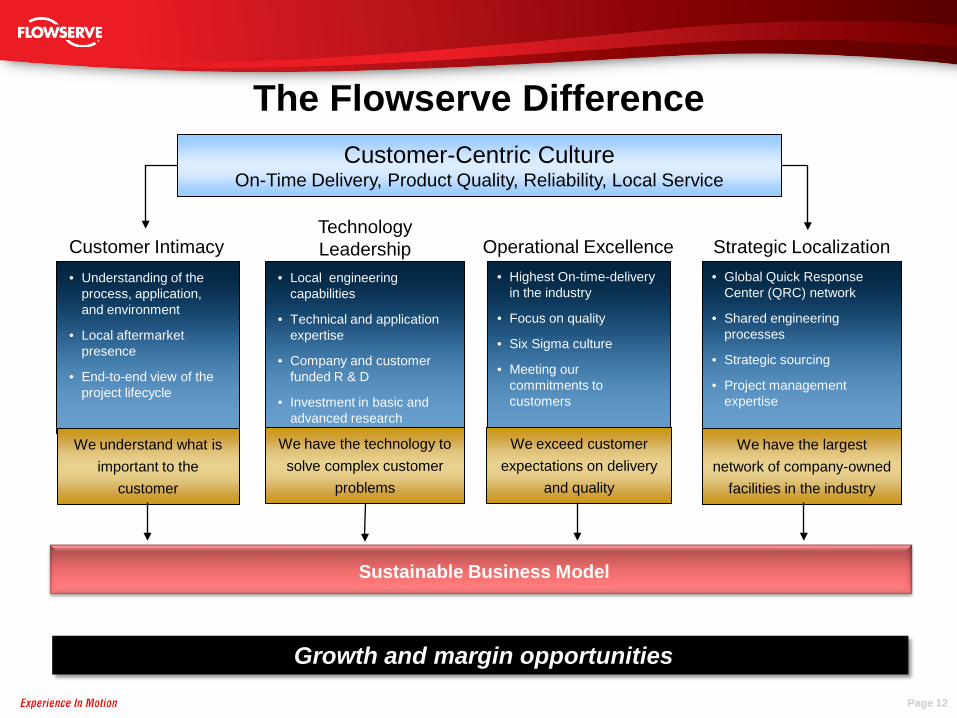
The Flowserve Difference
• Global Quick Response Center (QRC) network
• Shared engineering processes
• Strategic sourcing
• Project management expertise
• Local engineering capabilities
• Technical and application expertise
• Company and customer funded R & D
• Investment in basic and advanced research
• Understanding of the process, application, and environment
• Local aftermarket presence
• End-to-end view of the project lifecycle
Customer-Centric Culture On-Time Delivery, Product Quality, Reliability, Local Service
Customer Intimacy Technology Leadership Strategic Localization
We understand what is important to the
customer
We have the technology to solve complex customer
problems
We have the largest network of company-owned
facilities in the industry
• Highest On-time-delivery in the industry
• Focus on quality
• Six Sigma culture
• Meeting our commitments to customers
We exceed customer expectations on delivery
and quality
Operational Excellence
Sustainable Business Model
Growth and margin opportunities
Page 13
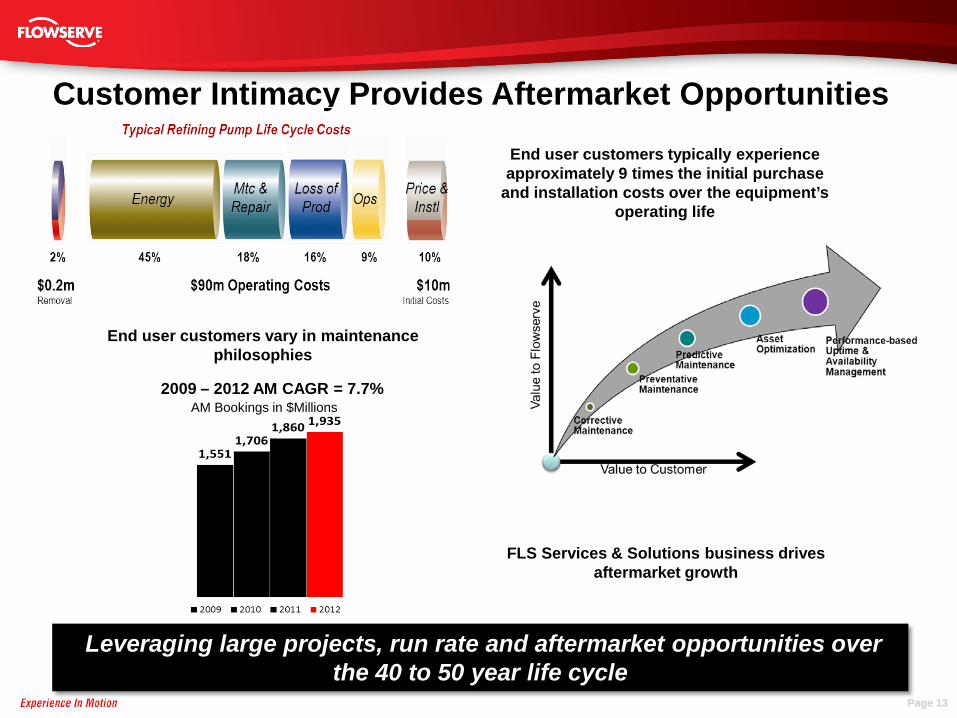
Customer Intimacy Provides Aftermarket Opportunities End user customers typically experience approximately 9 times the initial purchase
and installation costs over the equipment’s operating life
End user customers vary in maintenance philosophies
FLS Services & Solutions business drives aftermarket growth
AM Bookings in $Millions 2009 – 2012 AM CAGR = 7.7%
Leveraging large projects, run rate and aftermarket opportunities over the 40 to 50 year life cycle
Page 14
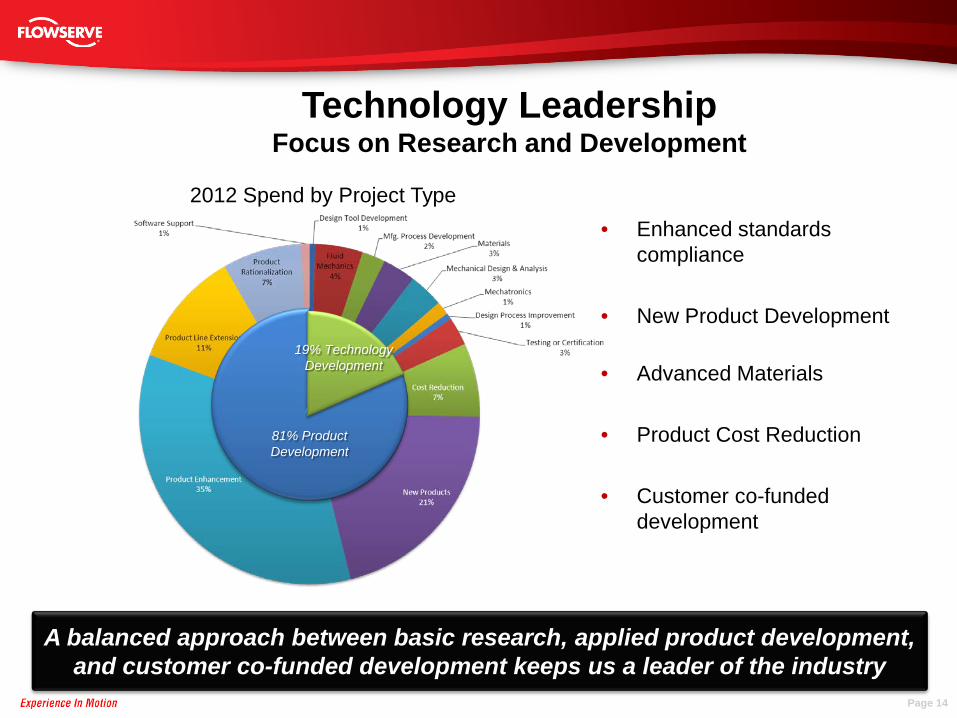
81% Product Development
19% Technology Development
2012 Spend by Project Type
Technology Leadership Focus on Research and Development
• Enhanced standards compliance
• New Product Development
• Advanced Materials
• Product Cost Reduction
• Customer co-funded development
A balanced approach between basic research, applied product development, and customer co-funded development keeps us a leader of the industry
Page 15
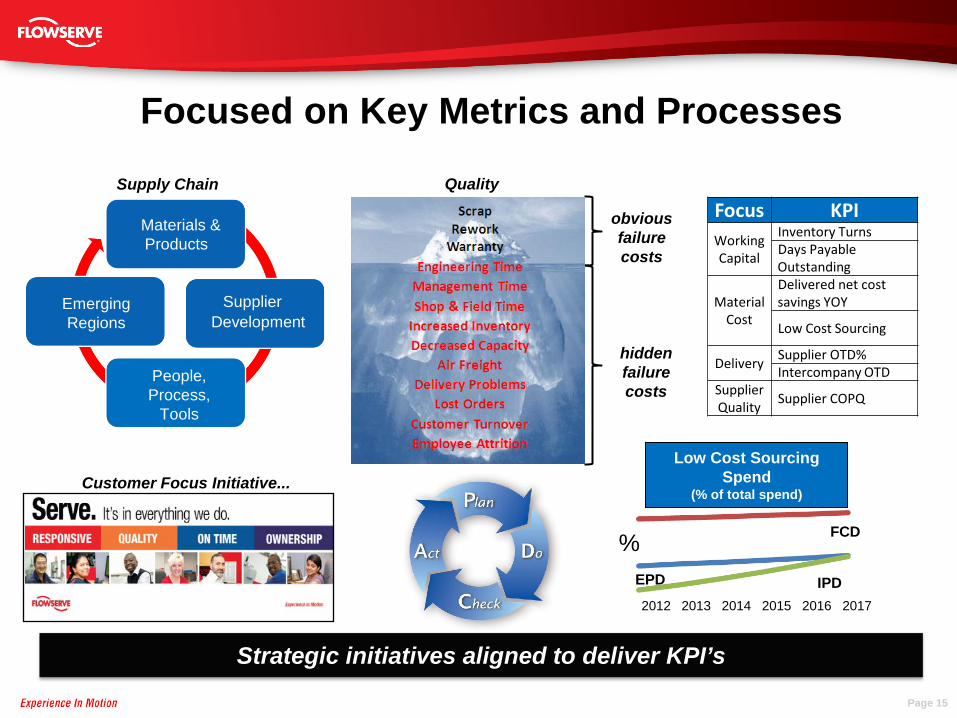
Focused on Key Metrics and Processes
Focus KPI Working Capital
Inventory Turns Days Payable Outstanding
Material Cost
Delivered net cost savings YOY
Low Cost Sourcing
Delivery Supplier OTD% Intercompany OTD
Supplier Quality
Supplier COPQ
Strategic initiatives aligned to deliver KPI’s
People Process Tools
Materials & Products
Emerging Regions
People, Process,
Tools
Supply Chain
Supplier Development
FCD
EPD IPD
Low Cost Sourcing Spend
(% of total spend)
%
2012 2013 2014 2015 2016 2017
obvious failure costs
hidden failure costs
Customer Focus Initiative...
Quality
Page 16
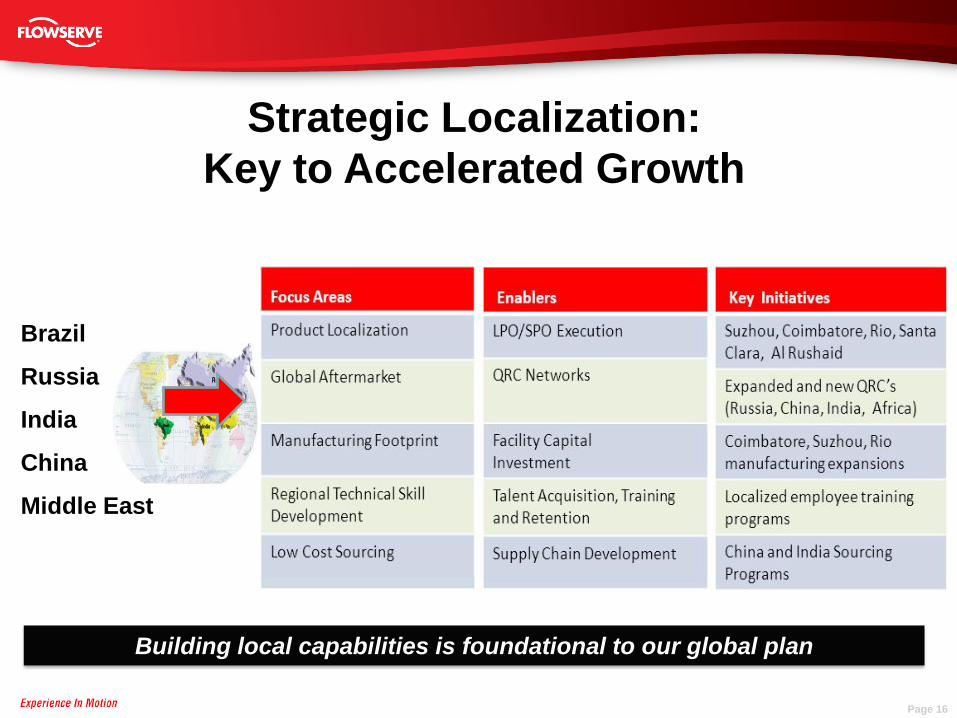
Strategic Localization: Key to Accelerated Growth
Building local capabilities is foundational to our global plan
Brazil
Russia
India
China
Middle East
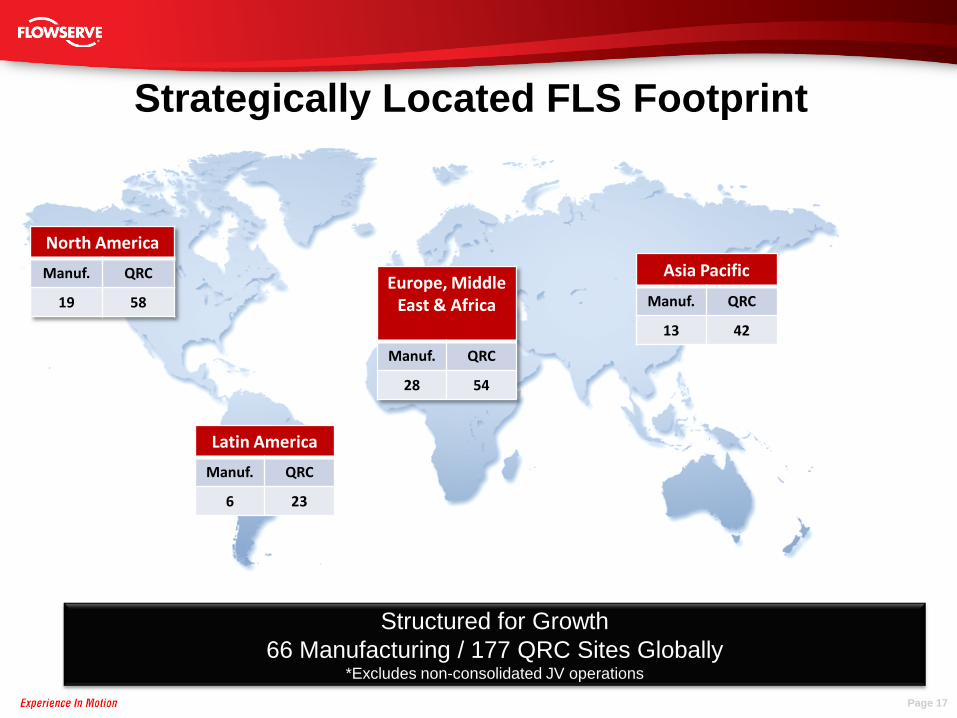
Page 17
North America
Manuf. QRC
19 58
Latin America
Manuf. QRC
6 23
Europe, Middle East & Africa
Manuf. QRC
28 54
Asia Pacific
Manuf. QRC
13 42
Structured for Growth 66 Manufacturing / 177 QRC Sites Globally
*Excludes non-consolidated JV operations
Strategically Located FLS Footprint
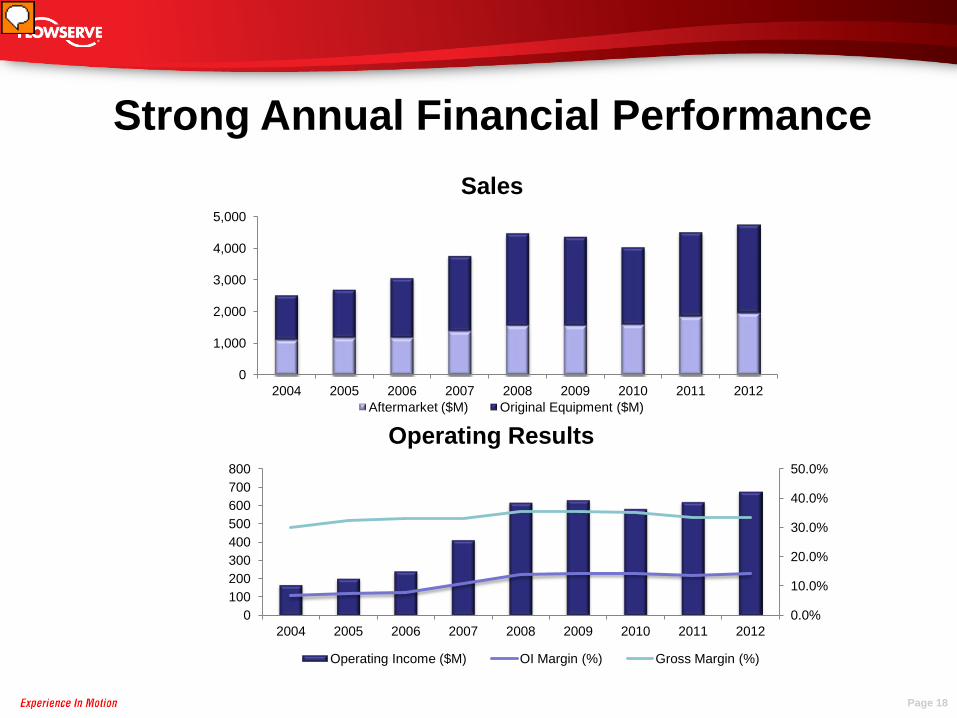
Strong Annual Financial Performance
Operating Results
Sales
0
1,000
2,000
3,000
4,000
5,000
2004 2005 2006 2007 2008 2009 2010 2011 2012 Aftermarket ($M) Original Equipment ($M)
0.0%
10.0%
20.0%
30.0%
40.0%
50.0%
0 100 200 300 400 500 600 700 800
2004 2005 2006 2007 2008 2009 2010 2011 2012
Operating Income ($M) OI Margin (%) Gross Margin (%)
Page 18
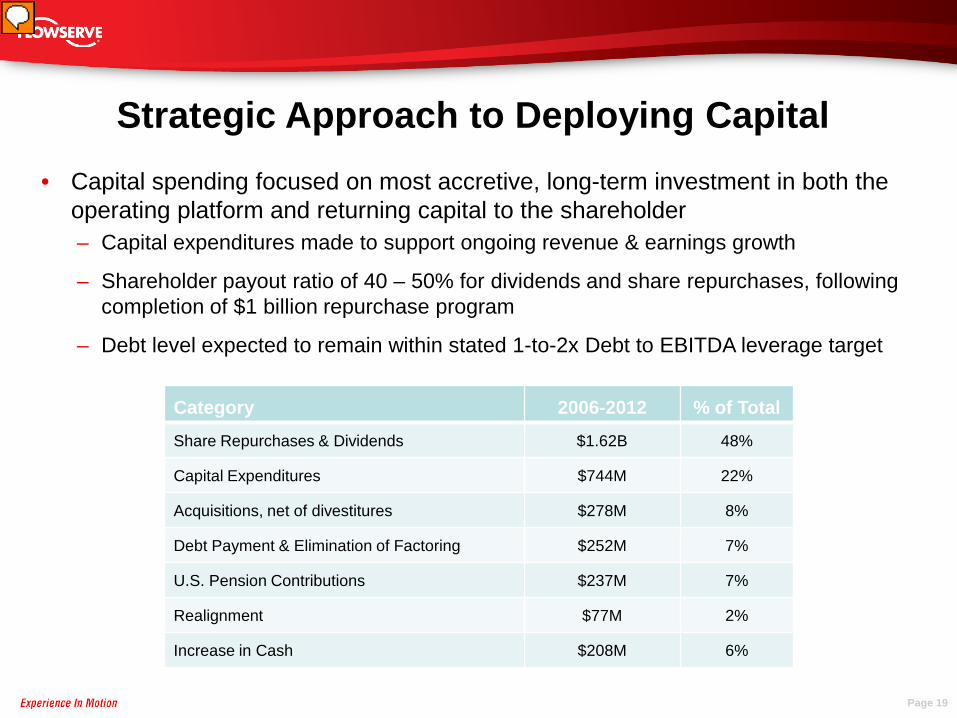
• Capital spending focused on most accretive, long-term investment in both the operating platform and returning capital to the shareholder – Capital expenditures made to support ongoing revenue & earnings growth
– Shareholder payout ratio of 40 – 50% for dividends and share repurchases, following completion of $1 billion repurchase program
– Debt level expected to remain within stated 1-to-2x Debt to EBITDA leverage target
Strategic Approach to Deploying Capital
Category 2006-2012 % of Total
Share Repurchases & Dividends $1.62B 48%
Capital Expenditures $744M 22%
Acquisitions, net of divestitures $278M 8%
Debt Payment & Elimination of Factoring $252M 7%
U.S. Pension Contributions $237M 7%
Realignment $77M 2%
Increase in Cash $208M 6%
Page 19
Page 20
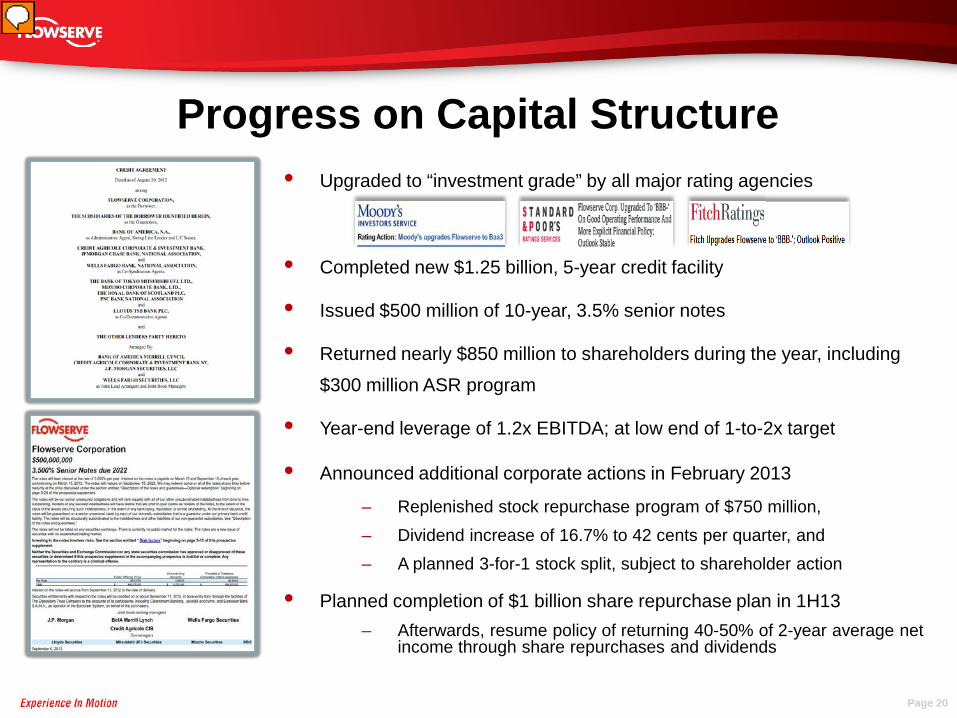
Progress on Capital Structure • Upgraded to “investment grade” by all major rating agencies
• Completed new $1.25 billion, 5-year credit facility
• Issued $500 million of 10-year, 3.5% senior notes
• Returned nearly $850 million to shareholders during the year, including
$300 million ASR program
• Year-end leverage of 1.2x EBITDA; at low end of 1-to-2x target
• Announced additional corporate actions in February 2013
– Replenished stock repurchase program of $750 million, – Dividend increase of 16.7% to 42 cents per quarter, and – A planned 3-for-1 stock split, subject to shareholder action
• Planned completion of $1 billion share repurchase plan in 1H13 – Afterwards, resume policy of returning 40-50% of 2-year average net
income through share repurchases and dividends
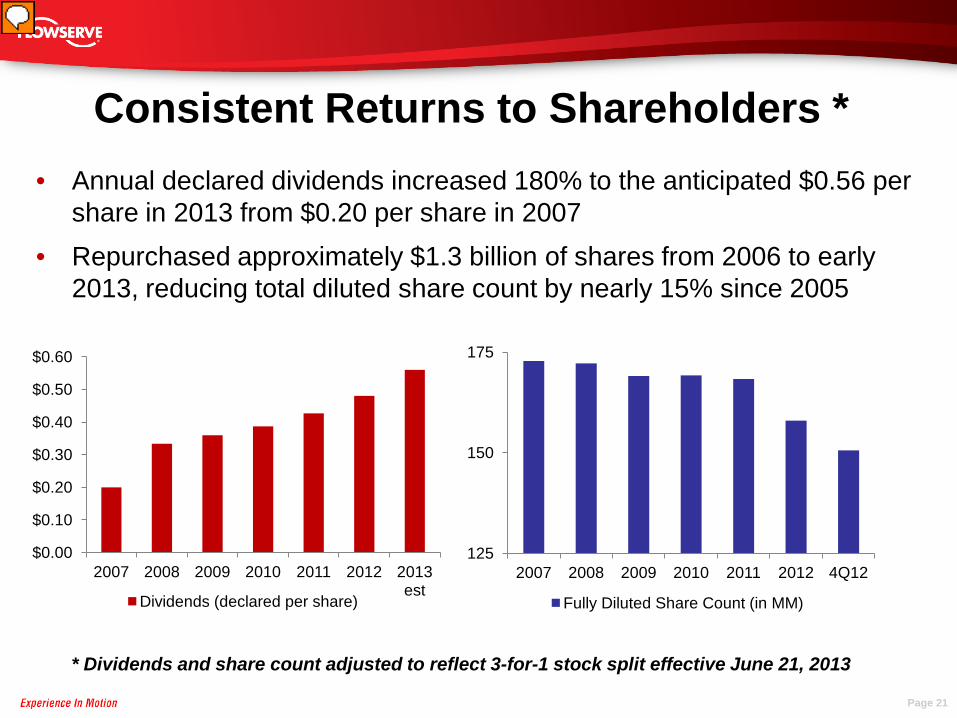
Consistent Returns to Shareholders * • Annual declared dividends increased 180% to the anticipated $0.56 per
share in 2013 from $0.20 per share in 2007 • Repurchased approximately $1.3 billion of shares from 2006 to early
2013, reducing total diluted share count by nearly 15% since 2005
$0.00
$0.10
$0.20
$0.30
$0.40
$0.50
$0.60
2007 2008 2009 2010 2011 2012 2013 est
Dividends (declared per share)
125
150
175
2007 2008 2009 2010 2011 2012 4Q12
Fully Diluted Share Count (in MM)
Page 21
* Dividends and share count adjusted to reflect 3-for-1 stock split effective June 21, 2013
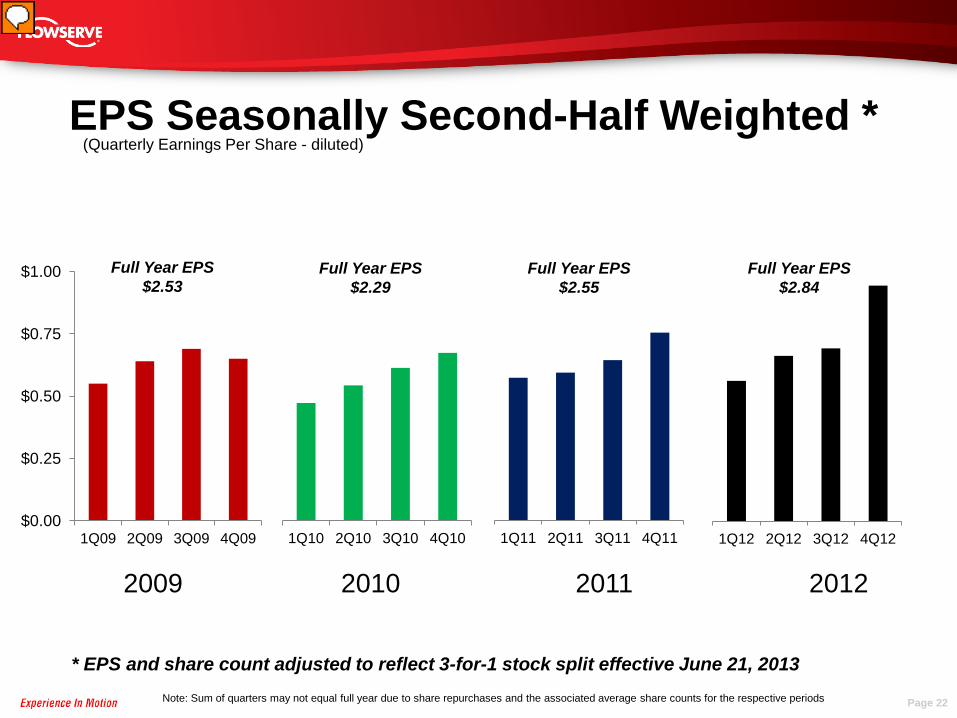
EPS Seasonally Second-Half Weighted *
2009 2010 2011 2012
(Quarterly Earnings Per Share - diluted)
Full Year EPS $2.53
Full Year EPS $2.29
Full Year EPS $2.55
Full Year EPS $2.84
Note: Sum of quarters may not equal full year due to share repurchases and the associated average share counts for the respective periods Page 22
$0.00
$0.25
$0.50
$0.75
$1.00
1Q09 2Q09 3Q09 4Q09 1Q10 2Q10 3Q10 4Q10 1Q11 2Q11 3Q11 4Q11 1Q12 2Q12 3Q12 4Q12
* EPS and share count adjusted to reflect 3-for-1 stock split effective June 21, 2013
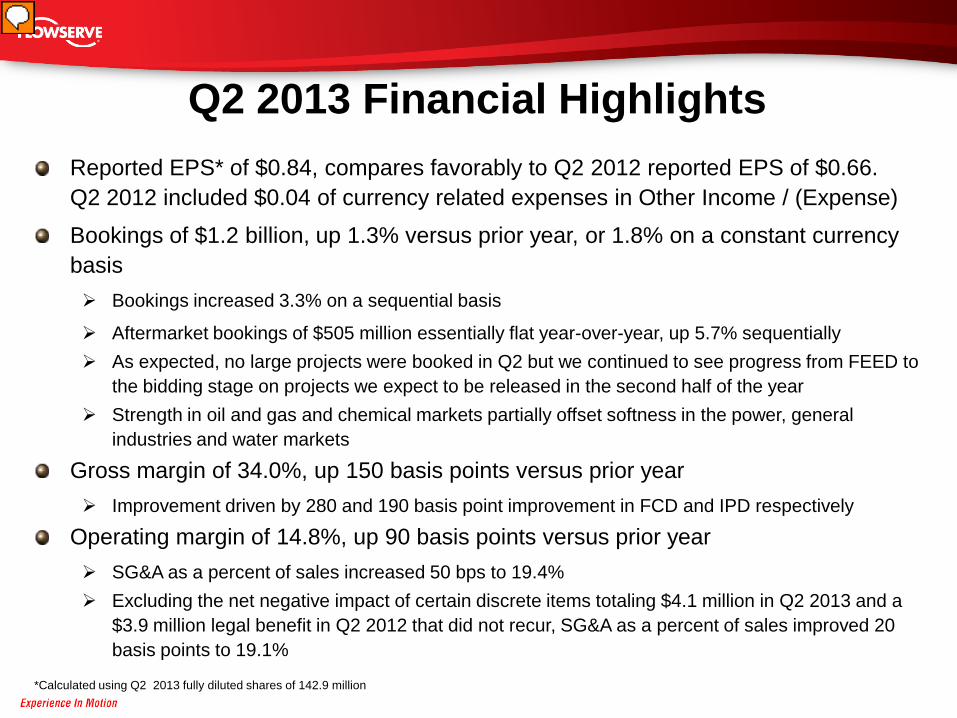
*Calculated using Q2 2013 fully diluted shares of 142.9 million
Q2 2013 Financial Highlights Reported EPS* of $0.84, compares favorably to Q2 2012 reported EPS of $0.66. Q2 2012 included $0.04 of currency related expenses in Other Income / (Expense)
Bookings of $1.2 billion, up 1.3% versus prior year, or 1.8% on a constant currency basis Bookings increased 3.3% on a sequential basis
Aftermarket bookings of $505 million essentially flat year-over-year, up 5.7% sequentially As expected, no large projects were booked in Q2 but we continued to see progress from FEED to
the bidding stage on projects we expect to be released in the second half of the year Strength in oil and gas and chemical markets partially offset softness in the power, general
industries and water markets
Gross margin of 34.0%, up 150 basis points versus prior year Improvement driven by 280 and 190 basis point improvement in FCD and IPD respectively
Operating margin of 14.8%, up 90 basis points versus prior year SG&A as a percent of sales increased 50 bps to 19.4% Excluding the net negative impact of certain discrete items totaling $4.1 million in Q2 2013 and a
$3.9 million legal benefit in Q2 2012 that did not recur, SG&A as a percent of sales improved 20 basis points to 19.1%
Business Outlook Continued progress on driving internal improvement with One Flowserve leadership structure and leveraging best practices across our business Internal focus since 2012 delivering operational and margin improvement
Improved platform efficiency has us well positioned to meet customer requirements and capture expected increase in large project activity in the second half of 2013
Better positioned to leverage bolt-on acquisitions across manufacturing and QRC footprint
Strong first half of 2013 provides momentum to deliver on the remainder of the year
Diverse end market and geographic exposures continue to dampen risk and volatility as improved project activity is anticipated to begin in the second half of the year, particularly in North America
FCD is focused on top-line growth and high levels of operating performance while encouraging operating improvements in EPD and IPD drive future profitable growth
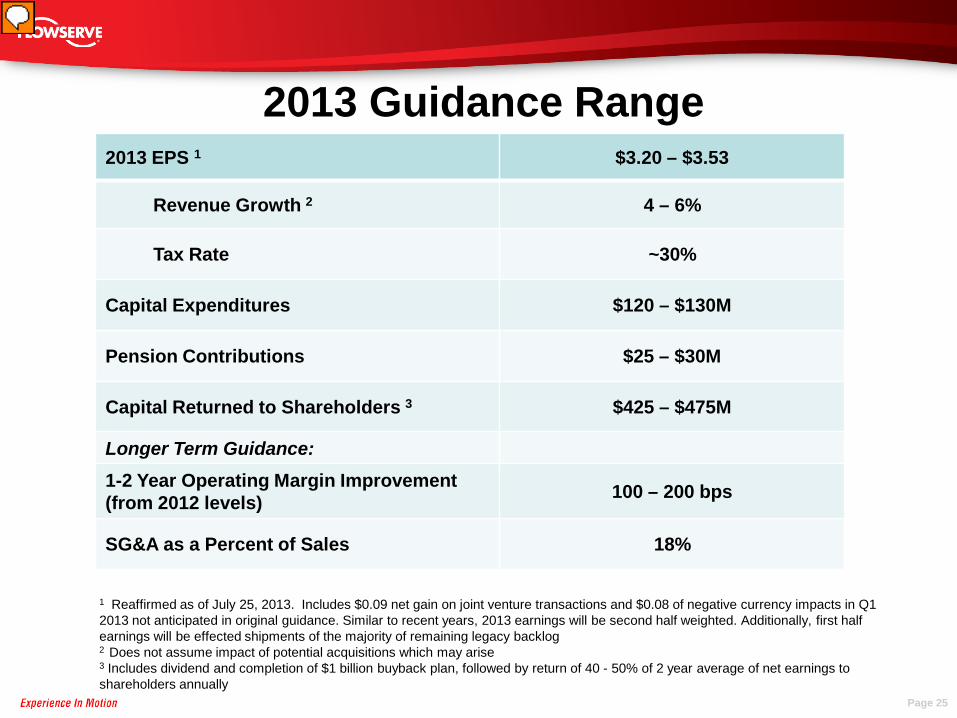
2013 Guidance Range 2013 EPS 1 $3.20 – $3.53
Revenue Growth 2 4 – 6%
Tax Rate ~30%
Capital Expenditures $120 – $130M
Pension Contributions $25 – $30M
Capital Returned to Shareholders 3 $425 – $475M
Longer Term Guidance: 1-2 Year Operating Margin Improvement (from 2012 levels) 100 – 200 bps
SG&A as a Percent of Sales 18%
1 Reaffirmed as of July 25, 2013. Includes $0.09 net gain on joint venture transactions and $0.08 of negative currency impacts in Q1 2013 not anticipated in original guidance. Similar to recent years, 2013 earnings will be second half weighted. Additionally, first half earnings will be effected shipments of the majority of remaining legacy backlog 2 Does not assume impact of potential acquisitions which may arise 3 Includes dividend and completion of $1 billion buyback plan, followed by return of 40 - 50% of 2 year average of net earnings to shareholders annually
Page 25
Page 26
Disciplined Profitable Growth and Long Term Shareholder Value Creation
• Unified, “One Flowserve” leadership drives disciplined growth and operational excellence across platform
• Demonstrated growth and stable earnings, through the cycle, is a result of our diversity: products, services and geographic exposures
• Business model focused upon: – Disciplined approach to top-line growth – organic & bolt-on acquisitions
– Cost control – both in COGS and SG&A
– Driving significant margin opportunities and realizing propensity of this business
– Enhanced by consistent capital allocation policy
– Delivers powerful EPS potential
• Flowserve is committed to creating shareholder value

Flowserve Investor Relations Contacts:
Jay Roueche 972.443.6560 [email protected]
Mike Mullin 972.443.6636 [email protected]

APPENDIX
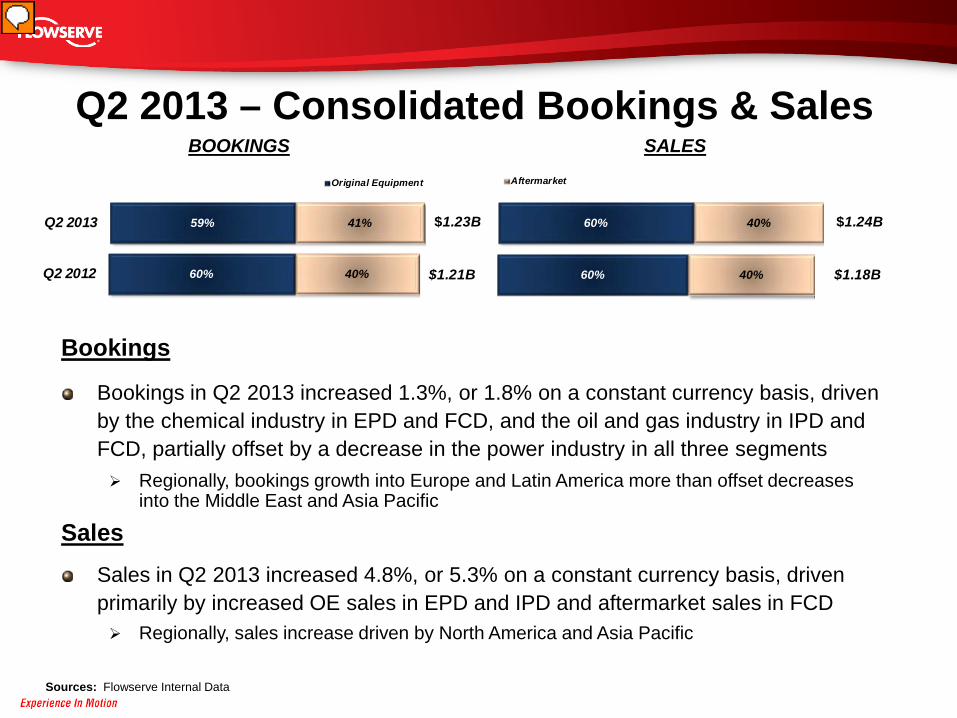
Q2 2013 – Consolidated Bookings & Sales
Sources: Flowserve Internal Data
BOOKINGS SALES
Bookings
Bookings in Q2 2013 increased 1.3%, or 1.8% on a constant currency basis, driven by the chemical industry in EPD and FCD, and the oil and gas industry in IPD and FCD, partially offset by a decrease in the power industry in all three segments Regionally, bookings growth into Europe and Latin America more than offset decreases
into the Middle East and Asia Pacific
Sales Sales in Q2 2013 increased 4.8%, or 5.3% on a constant currency basis, driven primarily by increased OE sales in EPD and IPD and aftermarket sales in FCD Regionally, sales increase driven by North America and Asia Pacific
59% 41%Q2 2013
Original Equipment
60% 40%Q2 2012
$1.23B
$1.21B
60% 40%
Aftermarket
60% 40%
$1.24B
$1.18B
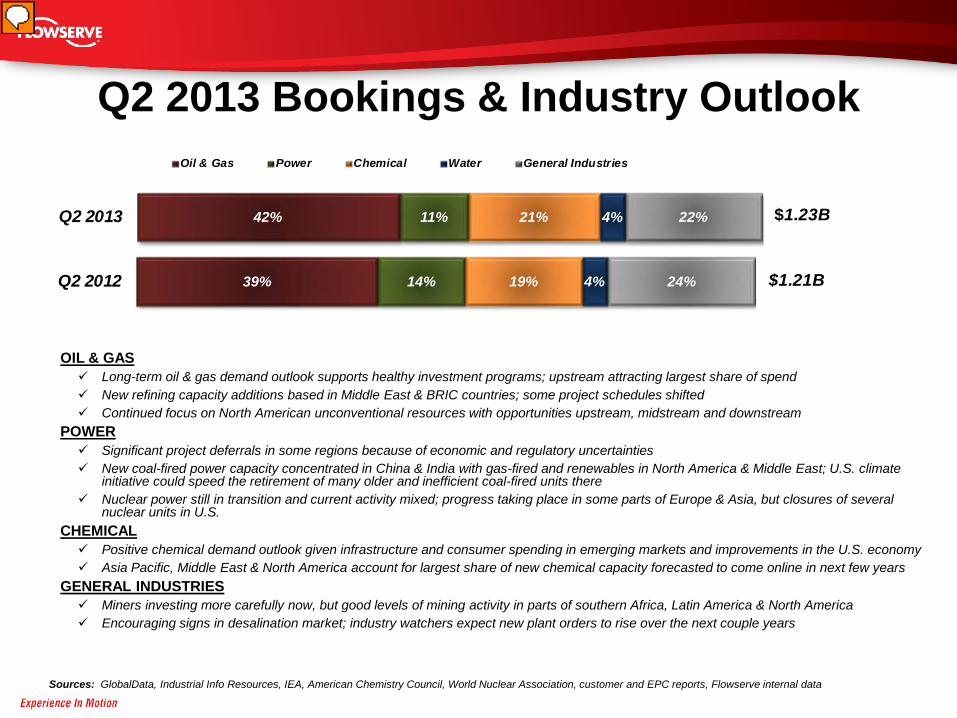
Q2 2013 Bookings & Industry Outlook
Sources: GlobalData, Industrial Info Resources, IEA, American Chemistry Council, World Nuclear Association, customer and EPC reports, Flowserve internal data
42% 18% 5%
40% 15% 5%
OIL & GAS Long-term oil & gas demand outlook supports healthy investment programs; upstream attracting largest share of spend New refining capacity additions based in Middle East & BRIC countries; some project schedules shifted Continued focus on North American unconventional resources with opportunities upstream, midstream and downstream
POWER Significant project deferrals in some regions because of economic and regulatory uncertainties New coal-fired power capacity concentrated in China & India with gas-fired and renewables in North America & Middle East; U.S. climate
initiative could speed the retirement of many older and inefficient coal-fired units there Nuclear power still in transition and current activity mixed; progress taking place in some parts of Europe & Asia, but closures of several
nuclear units in U.S. CHEMICAL Positive chemical demand outlook given infrastructure and consumer spending in emerging markets and improvements in the U.S. economy Asia Pacific, Middle East & North America account for largest share of new chemical capacity forecasted to come online in next few years
GENERAL INDUSTRIES Miners investing more carefully now, but good levels of mining activity in parts of southern Africa, Latin America & North America Encouraging signs in desalination market; industry watchers expect new plant orders to rise over the next couple years
42% 11% 21% 4% 22%Q2 2013
Oil & Gas Power Chemical Water General Industries
39% 14% 19% 4% 24%Q2 2012
$1.23B
$1.21B
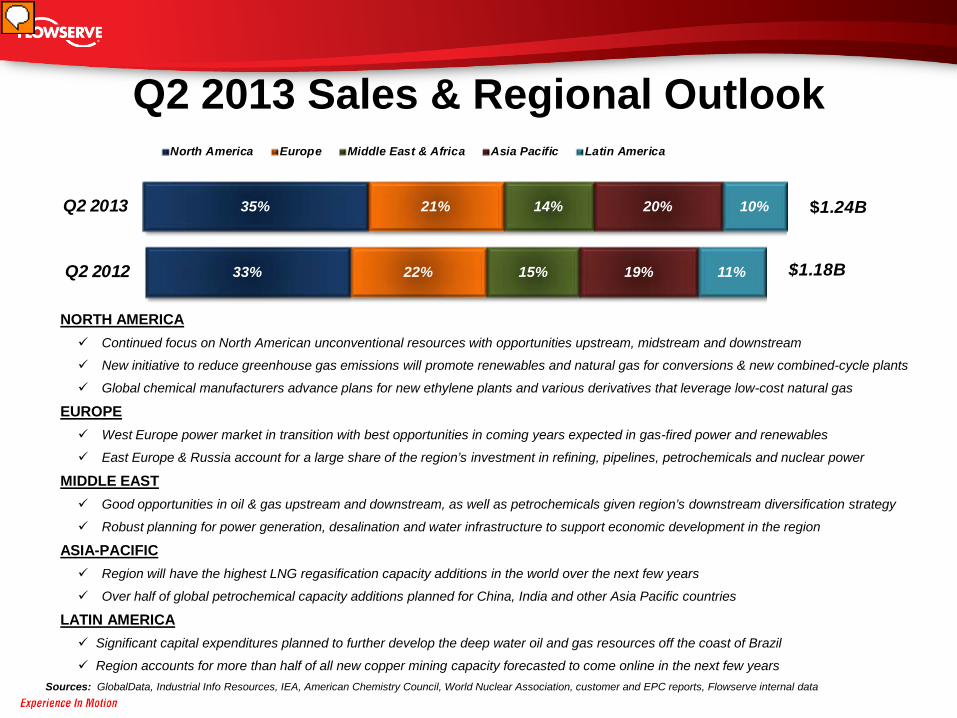
Q2 2013 Sales & Regional Outlook
Sources: GlobalData, Industrial Info Resources, IEA, American Chemistry Council, World Nuclear Association, customer and EPC reports, Flowserve internal data
32% 24% 17% 9%
26% 10% 17% 14%
18%
35% 21% 14% 20% 10%Q2 2013
North America Europe Middle East & Africa Asia Pacific Latin America
33% 22% 15% 19% 11%Q2 2012
$1.24B
$1.18B
NORTH AMERICA Continued focus on North American unconventional resources with opportunities upstream, midstream and downstream
New initiative to reduce greenhouse gas emissions will promote renewables and natural gas for conversions & new combined-cycle plants
Global chemical manufacturers advance plans for new ethylene plants and various derivatives that leverage low-cost natural gas
EUROPE West Europe power market in transition with best opportunities in coming years expected in gas-fired power and renewables
East Europe & Russia account for a large share of the region’s investment in refining, pipelines, petrochemicals and nuclear power
MIDDLE EAST Good opportunities in oil & gas upstream and downstream, as well as petrochemicals given region’s downstream diversification strategy
Robust planning for power generation, desalination and water infrastructure to support economic development in the region
ASIA-PACIFIC Region will have the highest LNG regasification capacity additions in the world over the next few years
Over half of global petrochemical capacity additions planned for China, India and other Asia Pacific countries
LATIN AMERICA Significant capital expenditures planned to further develop the deep water oil and gas resources off the coast of Brazil
Region accounts for more than half of all new copper mining capacity forecasted to come online in the next few years
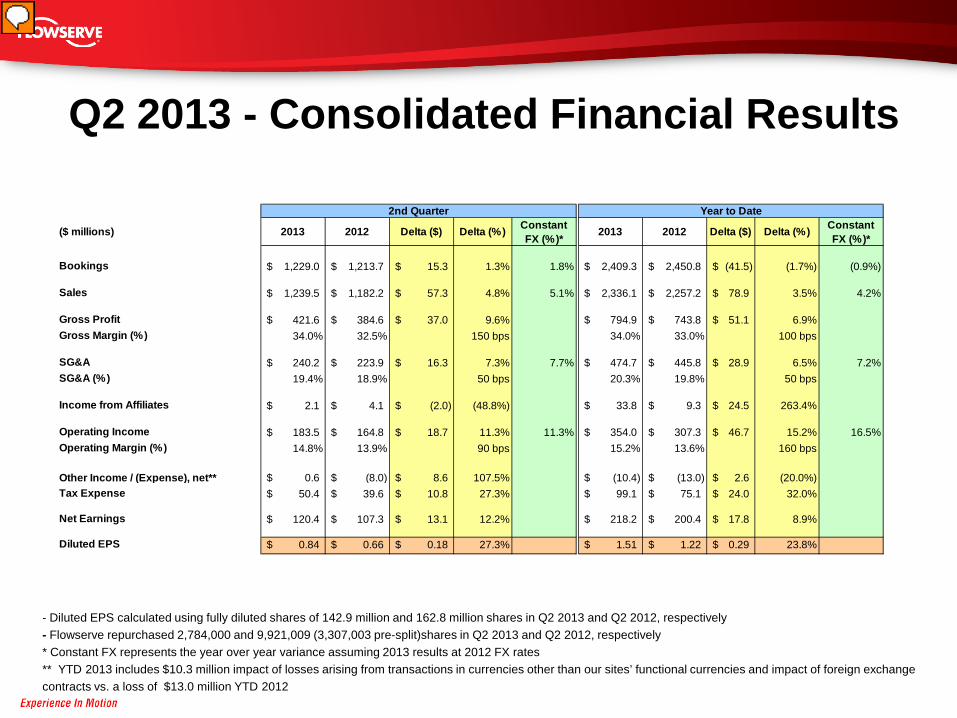
Q2 2013 - Consolidated Financial Results
2013 2012 Delta ($) Delta (%) Constant FX (%)*
2,409.3$ 2,450.8$ (41.5)$ (1.7%) (0.9%)
2,336.1$ 2,257.2$ 78.9$ 3.5% 4.2%
794.9$ 743.8$ 51.1$ 6.9%34.0% 33.0% 100 bps
474.7$ 445.8$ 28.9$ 6.5% 7.2%20.3% 19.8% 50 bps
33.8$ 9.3$ 24.5$ 263.4%
354.0$ 307.3$ 46.7$ 15.2% 16.5%15.2% 13.6% 160 bps
(10.4)$ (13.0)$ 2.6$ (20.0%)99.1$ 75.1$ 24.0$ 32.0%
218.2$ 200.4$ 17.8$ 8.9%
1.51$ 1.22$ 0.29$ 23.8%
Year to Date
- Diluted EPS calculated using fully diluted shares of 142.9 million and 162.8 million shares in Q2 2013 and Q2 2012, respectively - Flowserve repurchased 2,784,000 and 9,921,009 (3,307,003 pre-split)shares in Q2 2013 and Q2 2012, respectively * Constant FX represents the year over year variance assuming 2013 results at 2012 FX rates ** YTD 2013 includes $10.3 million impact of losses arising from transactions in currencies other than our sites’ functional currencies and impact of foreign exchange contracts vs. a loss of $13.0 million YTD 2012
($ millions) 2013 2012 Delta ($) Delta (%) Constant FX (%)*
Bookings 1,229.0$ 1,213.7$ 15.3$ 1.3% 1.8%
Sales 1,239.5$ 1,182.2$ 57.3$ 4.8% 5.1%
Gross Profit 421.6$ 384.6$ 37.0$ 9.6%Gross Margin (%) 34.0% 32.5% 150 bps
SG&A 240.2$ 223.9$ 16.3$ 7.3% 7.7%SG&A (%) 19.4% 18.9% 50 bps
Income from Affiliates 2.1$ 4.1$ (2.0)$ (48.8%)
Operating Income 183.5$ 164.8$ 18.7$ 11.3% 11.3%Operating Margin (%) 14.8% 13.9% 90 bps
Other Income / (Expense), net** 0.6$ (8.0)$ 8.6$ 107.5%Tax Expense 50.4$ 39.6$ 10.8$ 27.3%
Net Earnings 120.4$ 107.3$ 13.1$ 12.2%
Diluted EPS 0.84$ 0.66$ 0.18$ 27.3%
2nd Quarter
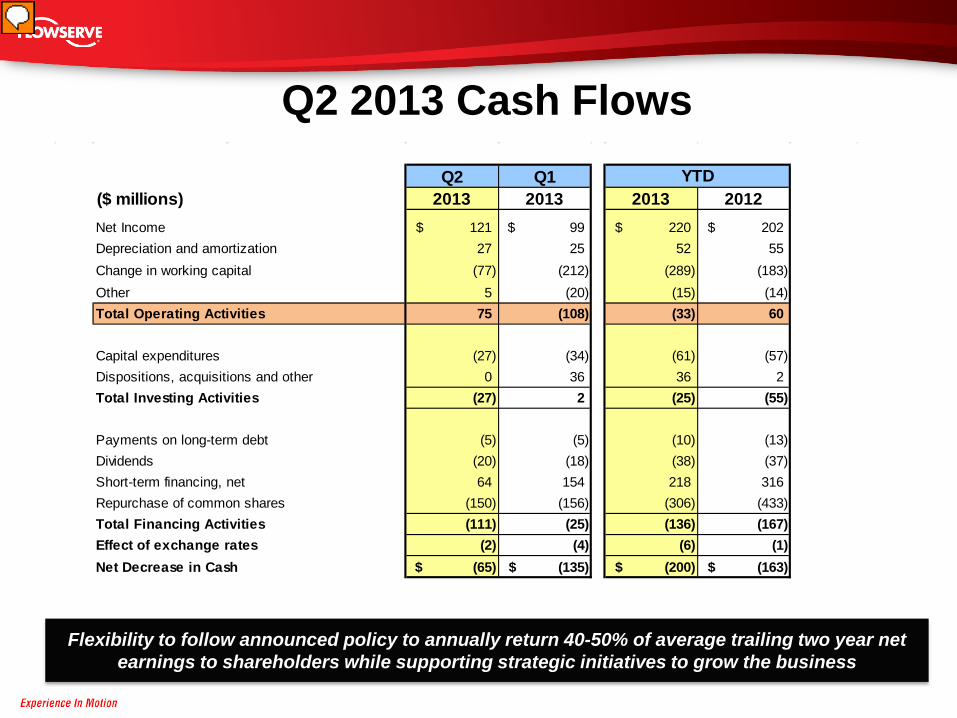
Q2 2013 Cash Flows
Flexibility to follow announced policy to annually return 40-50% of average trailing two year net earnings to shareholders while supporting strategic initiatives to grow the business
Q2 Q1($ millions) 2013 2013 2013 2012Net Income 121$ 99$ 220$ 202$ Depreciation and amortization 27 25 52 55 Change in working capital (77) (212) (289) (183) Other 5 (20) (15) (14) Total Operating Activities 75 (108) (33) 60
Capital expenditures (27) (34) (61) (57) Dispositions, acquisitions and other 0 36 36 2 Total Investing Activities (27) 2 (25) (55)
Payments on long-term debt (5) (5) (10) (13) Dividends (20) (18) (38) (37) Short-term financing, net 64 154 218 316 Repurchase of common shares (150) (156) (306) (433) Total Financing Activities (111) (25) (136) (167) Effect of exchange rates (2) (4) (6) (1) Net Decrease in Cash (65)$ (135)$ (200)$ (163)$
YTD