rbi retail loan loss provisioning - wb 2014 - world...
TRANSCRIPT
Loan loss provisioning of a retail portfolio -
an example from RBI AG Deyan IVANOV Retail Risk Methodology and Validation Raiffeisen Bank International AG
Slide no.2
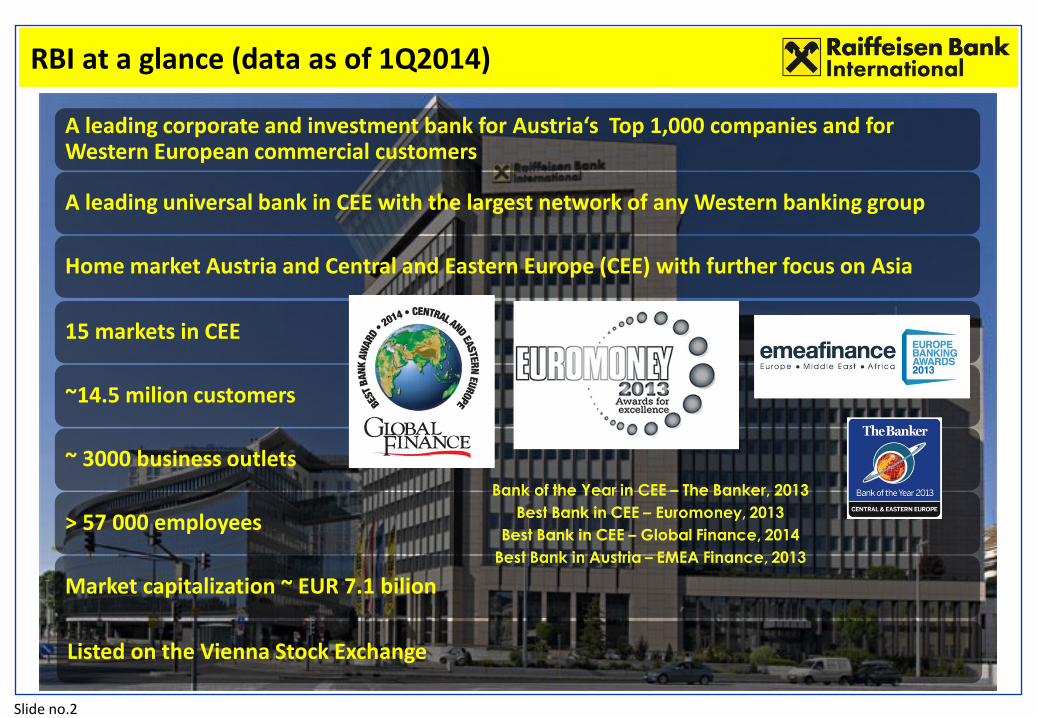
A leading corporate and investment bank for Austria‘s Top 1,000 companies and for Western European commercial customers
A leading universal bank in CEE with the largest network of any Western banking group
Home market Austria and Central and Eastern Europe (CEE) with further focus on Asia
15 markets in CEE
~14.5 milion customers
~ 3000 business outlets
> 57 000 employees
Market capitalization ~ EUR 7.1 bilion
RBI at a glance (data as of 1Q2014)
Listed on the Vienna Stock Exchange
Slide no.3
Agenda
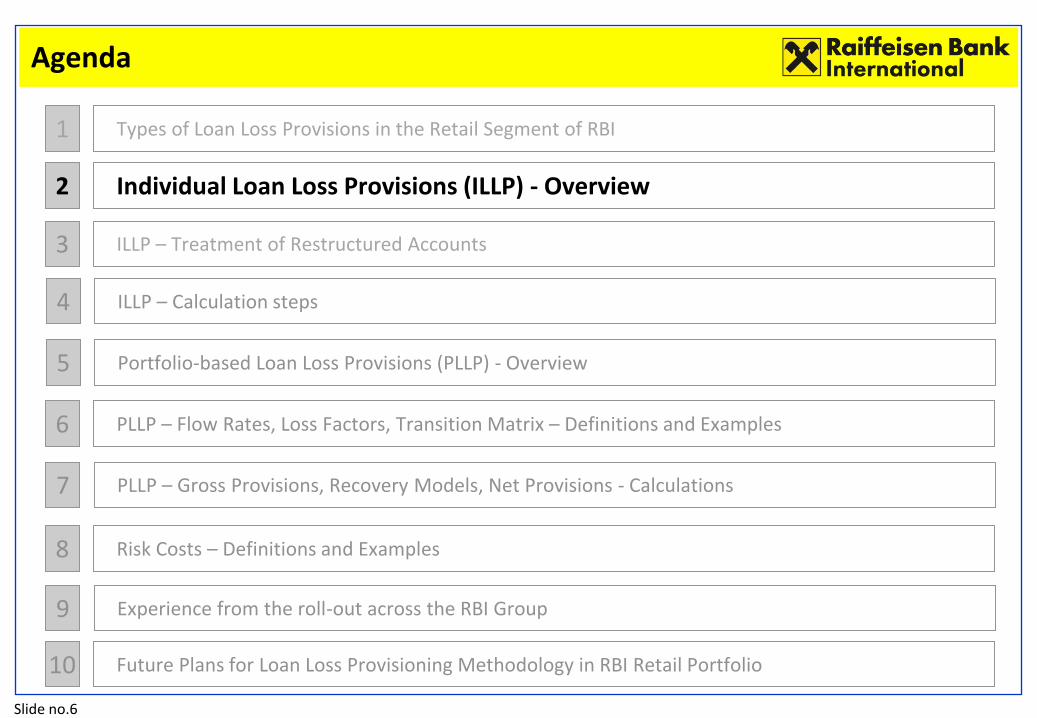
1 Types of Loan Loss Provisions in the Retail Segment of RBI
2 Individual Loan Loss Provisions (ILLP) - Overview
3 ILLP – Treatment of Restructured Accounts
4 ILLP – Calculation steps
5 Portfolio-based Loan Loss Provisions (PLLP) - Overview
6 PLLP – Flow Rates, Loss Factors, Transition Matrix – Definitions and Examples
7 PLLP – Gross Provisions, Recovery Models, Net Provisions - Calculations
8 Risk Costs – Definitions and Examples
9 Experience from the roll-out across the RBI Group
10 Future Plans for Loan Loss Provisioning Methodology in RBI Retail Portfolio
Slide no.4
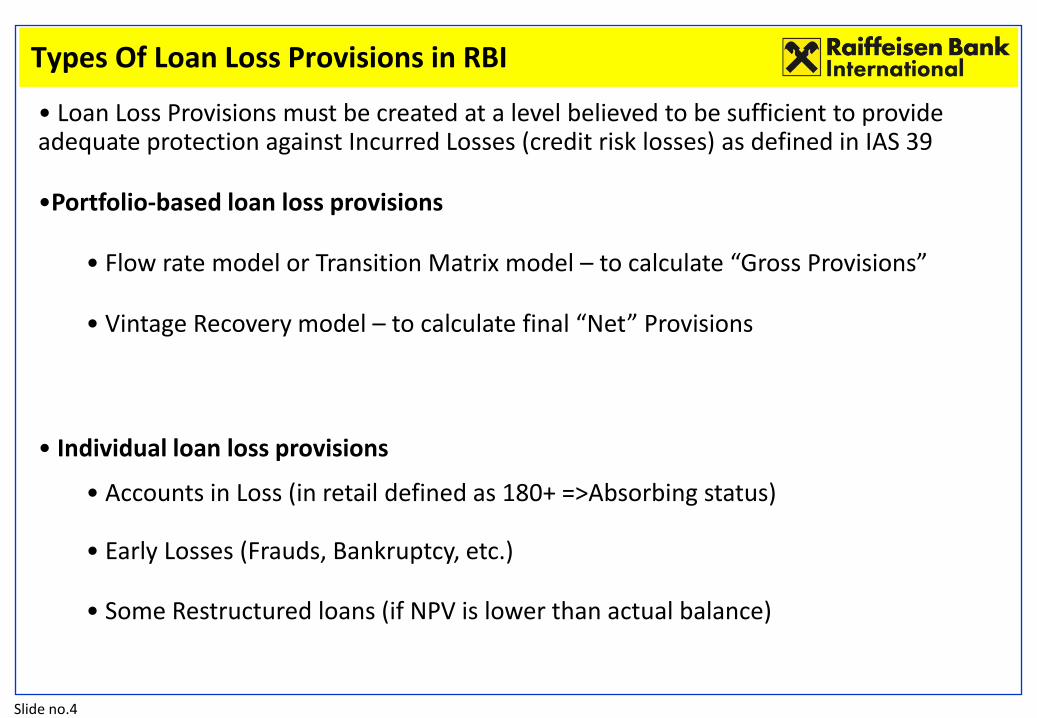
• Loan Loss Provisions must be created at a level believed to be sufficient to provide adequate protection against Incurred Losses (credit risk losses) as defined in IAS 39
•Portfolio-based loan loss provisions
• Flow rate model or Transition Matrix model – to calculate “Gross Provisions”
• Vintage Recovery model – to calculate final “Net” Provisions
• Individual loan loss provisions
• Accounts in Loss (in retail defined as 180+ =>Absorbing status)
• Early Losses (Frauds, Bankruptcy, etc.)
• Some Restructured loans (if NPV is lower than actual balance)
Types Of Loan Loss Provisions in RBI

Slide no.5
180+ accounts
90_180 accounts
Accounts with no
delinquencies
1_90 accounts
360+ accounts
180+ accounts
90_180
accounts
Accounts with
no
delinquencies
1_90 accounts
360+ accounts
Balance Provisions
NPL
PLLP
ILLP
New volume No provisions
Types Of Loan Loss Provisions in RBI (cont’d)
Slide no.6
Agenda
1 Types of Loan Loss Provisions in the Retail Segment of RBI
2 Individual Loan Loss Provisions (ILLP) - Overview
3 ILLP – Treatment of Restructured Accounts
4 ILLP – Calculation steps
5 Portfolio-based Loan Loss Provisions (PLLP) - Overview
6 PLLP – Flow Rates, Loss Factors, Transition Matrix – Definitions and Examples
7 PLLP – Gross Provisions, Recovery Models, Net Provisions - Calculations
8 Risk Costs – Definitions and Examples
9 Experience from the roll-out across the RBI Group
10 Future Plans for Loan Loss Provisioning Methodology in RBI Retail Portfolio
Slide no.7
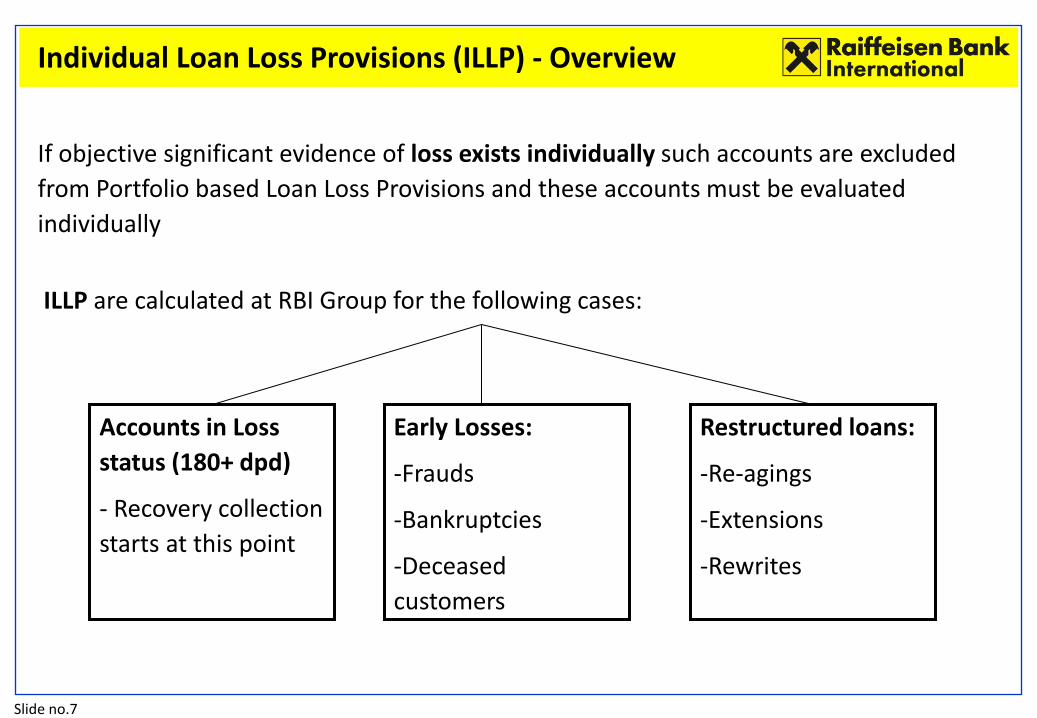
Restructured loans:
-Re-agings
-Extensions
-Rewrites
Early Losses:
-Frauds
-Bankruptcies
-Deceased
customers
Accounts in Loss
status (180+ dpd)
- Recovery collection
starts at this point
Individual Loan Loss Provisions (ILLP) - Overview
If objective significant evidence of loss exists individually such accounts are excluded
from Portfolio based Loan Loss Provisions and these accounts must be evaluated
individually
ILLP are calculated at RBI Group for the following cases:
Slide no.8
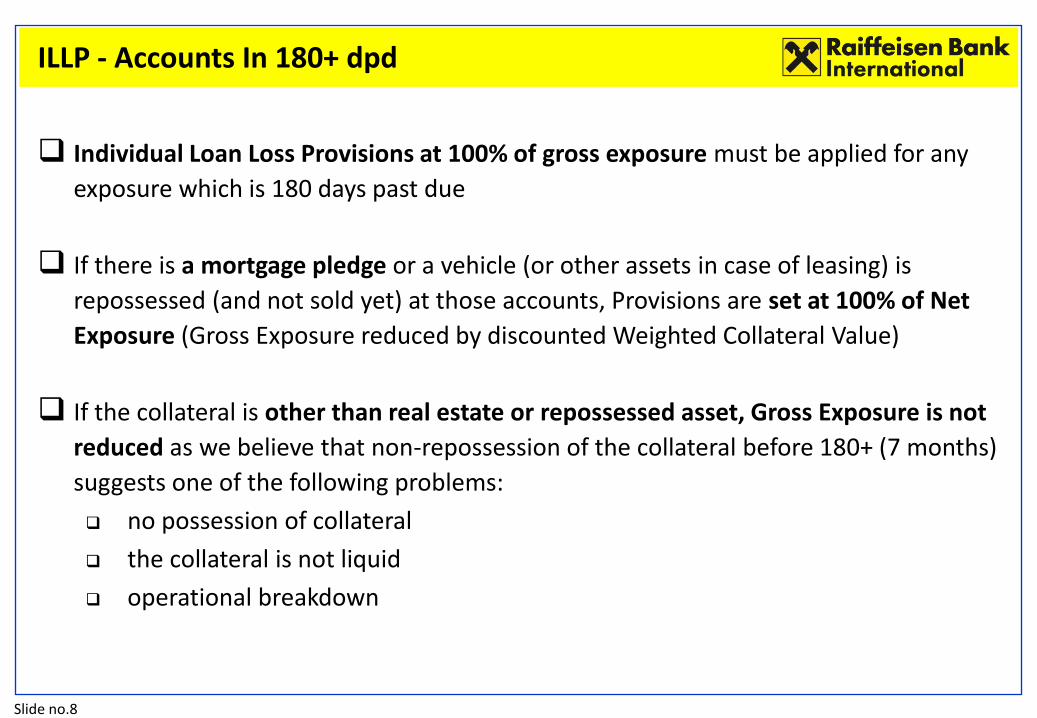
ILLP - Accounts In 180+ dpd
Individual Loan Loss Provisions at 100% of gross exposure must be applied for any
exposure which is 180 days past due
If there is a mortgage pledge or a vehicle (or other assets in case of leasing) is
repossessed (and not sold yet) at those accounts, Provisions are set at 100% of Net
Exposure (Gross Exposure reduced by discounted Weighted Collateral Value)
If the collateral is other than real estate or repossessed asset, Gross Exposure is not
reduced as we believe that non-repossession of the collateral before 180+ (7 months)
suggests one of the following problems:
no possession of collateral
the collateral is not liquid
operational breakdown
Slide no.9
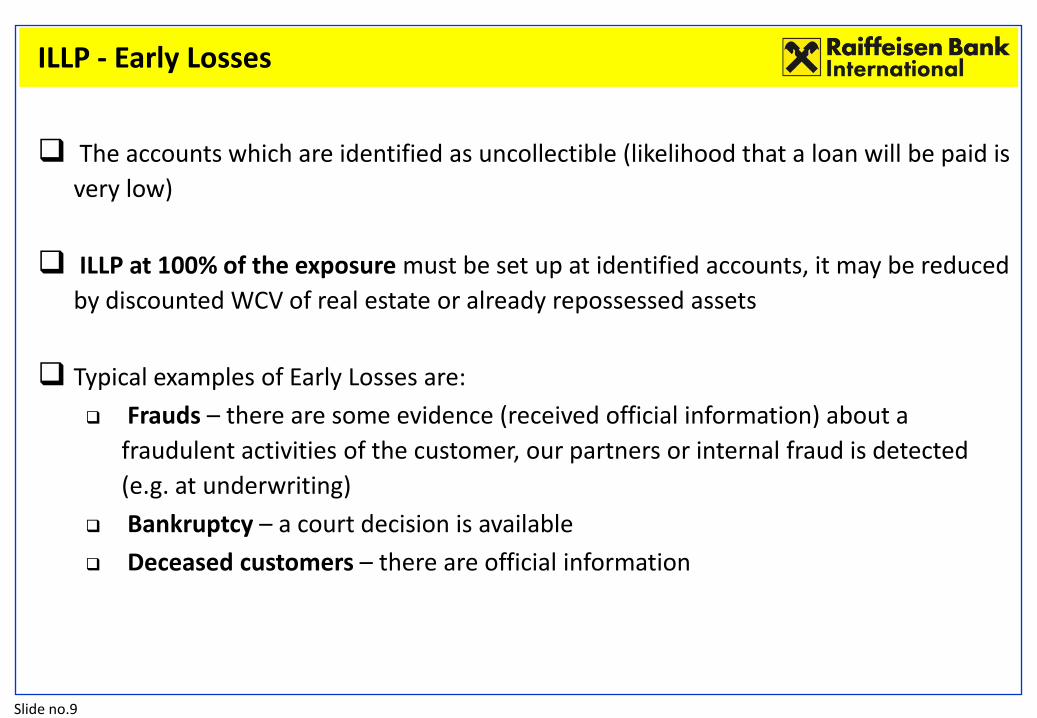
The accounts which are identified as uncollectible (likelihood that a loan will be paid is
very low)
ILLP at 100% of the exposure must be set up at identified accounts, it may be reduced
by discounted WCV of real estate or already repossessed assets
Typical examples of Early Losses are:
Frauds – there are some evidence (received official information) about a
fraudulent activities of the customer, our partners or internal fraud is detected
(e.g. at underwriting)
Bankruptcy – a court decision is available
Deceased customers – there are official information
ILLP - Early Losses
Slide no.10
Agenda
1 Types of Loan Loss Provisions in the Retail Segment of RBI
2 Individual Loan Loss Provisions (ILLP) - Overview
3 ILLP – Treatment of Restructured Accounts
4 ILLP – Calculation steps
5 Portfolio-based Loan Loss Provisions (PLLP) - Overview
6 PLLP – Flow Rates, Loss Factors, Transition Matrix – Definitions and Examples
7 PLLP – Gross Provisions, Recovery Models, Net Provisions - Calculations
8 Risk Costs – Definitions and Examples
9 Experience from the roll-out across the RBI Group
10 Future Plans for Loan Loss Provisioning Methodology in RBI Retail Portfolio
Slide no.11
ILLP – Treatment of Restructured Accounts
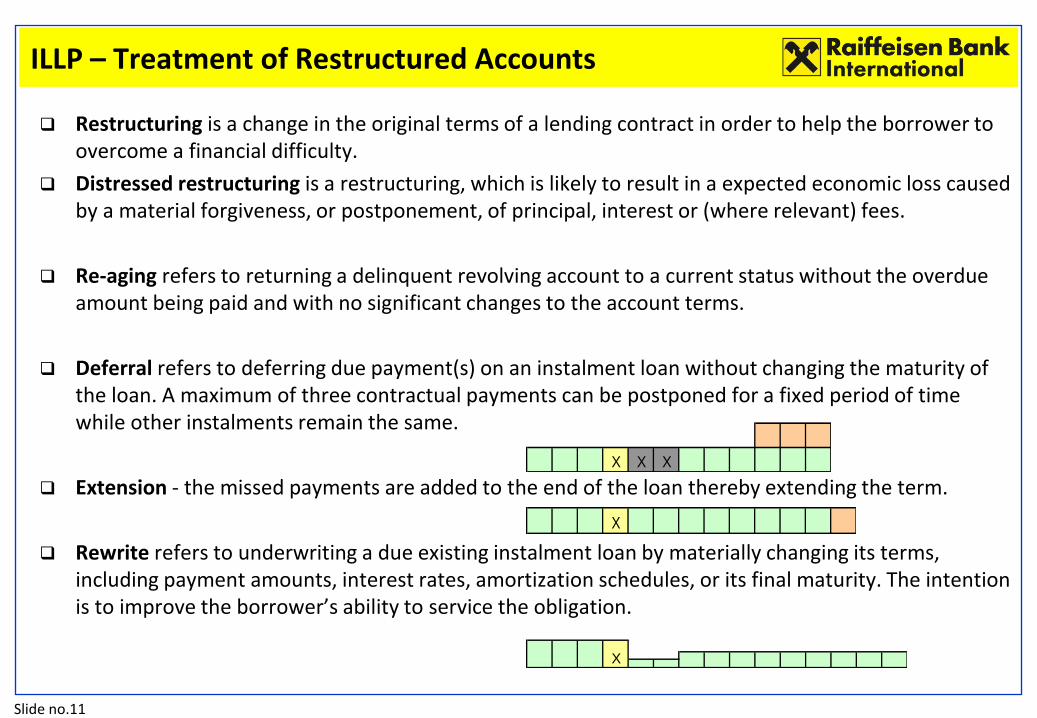
Restructuring is a change in the original terms of a lending contract in order to help the borrower to overcome a financial difficulty.
Distressed restructuring is a restructuring, which is likely to result in a expected economic loss caused by a material forgiveness, or postponement, of principal, interest or (where relevant) fees.
Re-aging refers to returning a delinquent revolving account to a current status without the overdue amount being paid and with no significant changes to the account terms.
Deferral refers to deferring due payment(s) on an instalment loan without changing the maturity of the loan. A maximum of three contractual payments can be postponed for a fixed period of time while other instalments remain the same.
Extension - the missed payments are added to the end of the loan thereby extending the term.
Rewrite refers to underwriting a due existing instalment loan by materially changing its terms, including payment amounts, interest rates, amortization schedules, or its final maturity. The intention is to improve the borrower’s ability to service the obligation.
X
X X X
X
Slide no.12
ILLP - Basic Rules In The Restructuring Process
In order to prevent artificial improvement of the portfolio quality out of restructuring activities, RBI has set the following rules for restructured accounts:
borrower must show a renewed willingness and ability to repay the loan;
the willingness and ability to pay is observed for at least three months after the restructuring and is extended by any period of significant reduction* of the instalment
account can not be restructured (except for deferrals) more than once within any 12-month period and twice within any 3-year period => If breached, ILLP at 100% on the net exposure.
additional funds/limit can not be advanced to enable new payment;
A newly opened account which replaces the old account as a result of restructuring is considered a restructured account as well
Definition of Significant reduction:
The new instalment is lower than the interest only payment
For FX denominated loans – out of devaluation of the LCY the new instalment in EUR is lower than the original one
The new reduced instalment caused extension of the tenor beyond the maximum product tenor set by RBI Retail Credit Policy
The maximum period of temporary significant reduction may not exceed 12 months!
Slide no.13
ILLP - Impairment of restructured accounts
Restructured loans other than Deferrals are always to be checked for impairment:
if the interest rate is lower than it was upon account opening (except where the
interest rate is decreased in order to conform to current market conditions);
if maturity is extended and the instalment amount is unchanged;
if there is a reduction in the amount of debt (principal, interest, fee) and this reduction is not charged off against P&L.
If NPVn (Net present value of new instalment plan) < NPVo of old instalment plan, it must be booked 100% provision for NPVo-NPVn !!!
Slide no.14
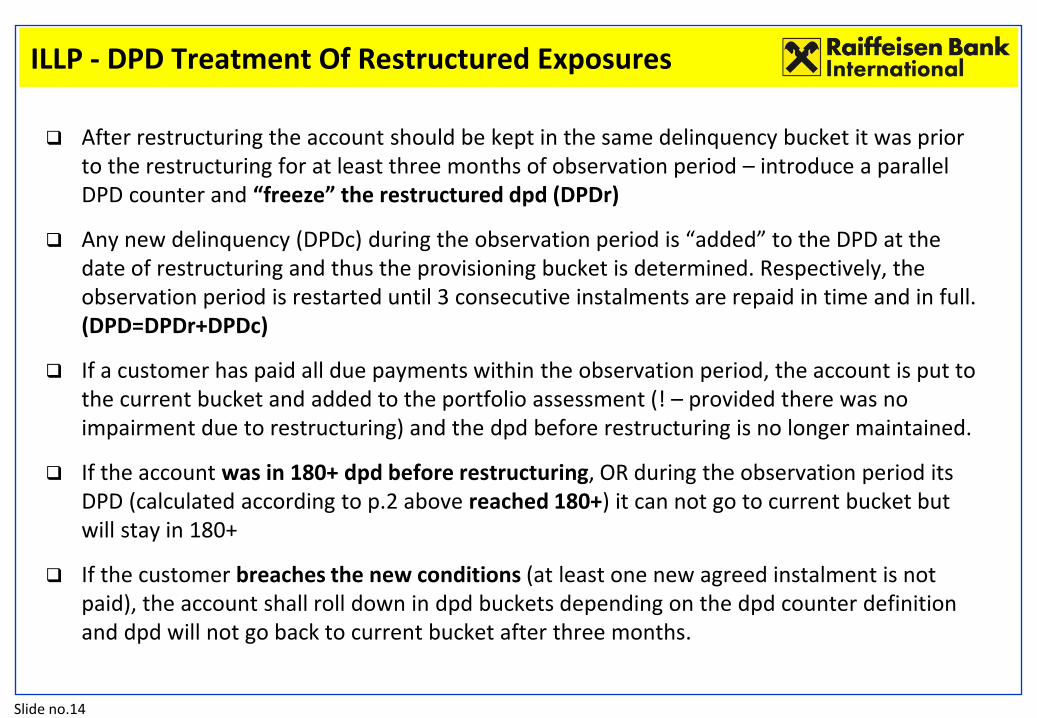
ILLP - DPD Treatment Of Restructured Exposures
After restructuring the account should be kept in the same delinquency bucket it was prior to the restructuring for at least three months of observation period – introduce a parallel DPD counter and “freeze” the restructured dpd (DPDr)
Any new delinquency (DPDc) during the observation period is “added” to the DPD at the date of restructuring and thus the provisioning bucket is determined. Respectively, the observation period is restarted until 3 consecutive instalments are repaid in time and in full. (DPD=DPDr+DPDc)
If a customer has paid all due payments within the observation period, the account is put to the current bucket and added to the portfolio assessment (! – provided there was no impairment due to restructuring) and the dpd before restructuring is no longer maintained.
If the account was in 180+ dpd before restructuring, OR during the observation period its DPD (calculated according to p.2 above reached 180+) it can not go to current bucket but will stay in 180+
If the customer breaches the new conditions (at least one new agreed instalment is not paid), the account shall roll down in dpd buckets depending on the dpd counter definition and dpd will not go back to current bucket after three months.
Slide no.15
Agenda
1 Types of Loan Loss Provisions in the Retail Segment of RBI
2 Individual Loan Loss Provisions (ILLP) - Overview
3 ILLP – Treatment of Restructured Accounts
4 ILLP – Calculation steps
5 Portfolio-based Loan Loss Provisions (PLLP) - Overview
6 PLLP – Flow Rates, Loss Factors, Transition Matrix – Definitions and Examples
7 PLLP – Gross Provisions, Recovery Models, Net Provisions - Calculations
8 Risk Costs – Definitions and Examples
9 Experience from the roll-out across the RBI Group
10 Future Plans for Loan Loss Provisioning Methodology in RBI Retail Portfolio
Slide no.16
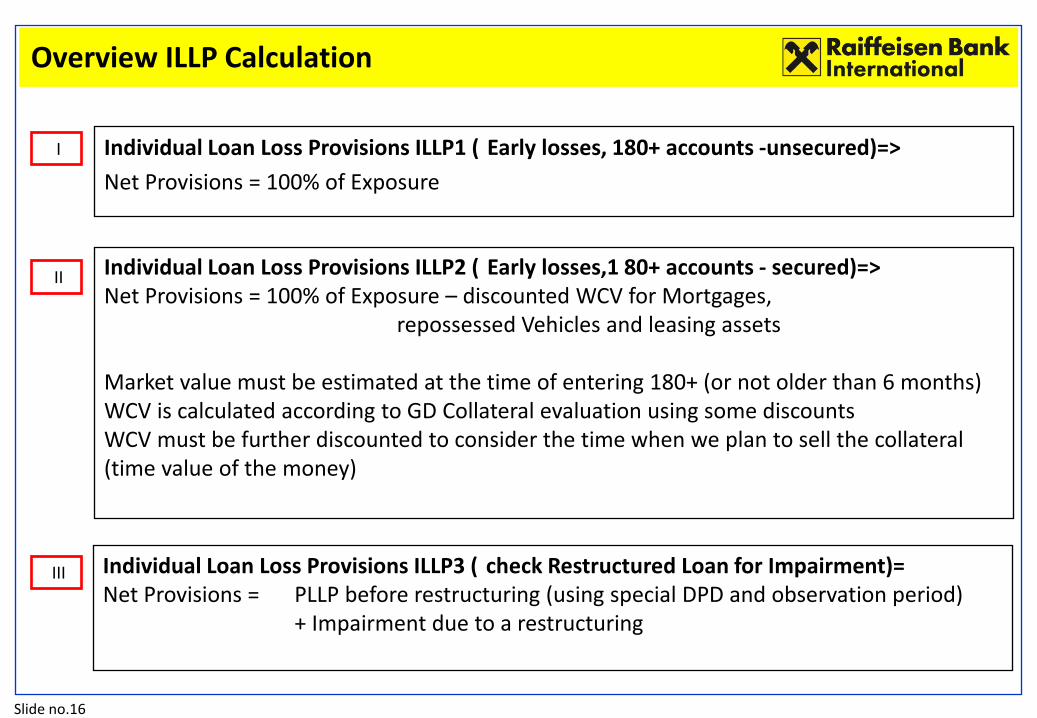
Individual Loan Loss Provisions ILLP1 ( Early losses, 180+ accounts -unsecured)=>
Net Provisions = 100% of Exposure
I
II Individual Loan Loss Provisions ILLP2 ( Early losses,1 80+ accounts - secured)=> Net Provisions = 100% of Exposure – discounted WCV for Mortgages, repossessed Vehicles and leasing assets Market value must be estimated at the time of entering 180+ (or not older than 6 months) WCV is calculated according to GD Collateral evaluation using some discounts WCV must be further discounted to consider the time when we plan to sell the collateral (time value of the money)
III Individual Loan Loss Provisions ILLP3 ( check Restructured Loan for Impairment)= Net Provisions = PLLP before restructuring (using special DPD and observation period) + Impairment due to a restructuring
Overview ILLP Calculation
Slide no.17
Agenda
1 Types of Loan Loss Provisions in the Retail Segment of RBI
2 Individual Loan Loss Provisions (ILLP) - Overview
3 ILLP – Treatment of Restructured Accounts
4 ILLP – Calculation steps
5 Portfolio-based Loan Loss Provisions (PLLP) - Overview
6 PLLP – Flow Rates, Loss Factors, Transition Matrix – Definitions and Examples
7 PLLP – Gross Provisions, Recovery Models, Net Provisions - Calculations
8 Risk Costs – Definitions and Examples
9 Experience from the roll-out across the RBI Group
10 Future Plans for Loan Loss Provisioning Methodology in RBI Retail Portfolio
Slide no.18
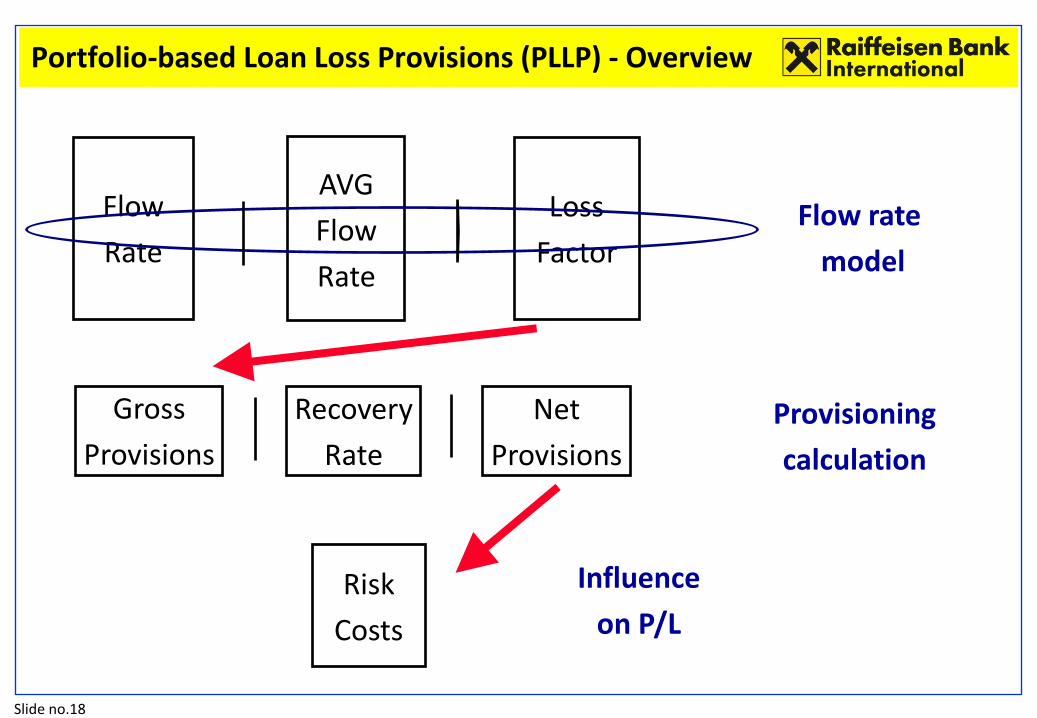
Flow
Rate
AVG
Flow
Rate
Loss
Factor
Gross
Provisions
Recovery
Rate
Net
Provisions
Flow rate
model
Provisioning
calculation
Risk
Costs
Influence
on P/L
Portfolio-based Loan Loss Provisions (PLLP) - Overview
Slide no.19
Agenda
1 Types of Loan Loss Provisions in the Retail Segment of RBI
2 Individual Loan Loss Provisions (ILLP) - Overview
3 ILLP – Treatment of Restructured Accounts
4 ILLP – Calculation steps
5 Portfolio-based Loan Loss Provisions (PLLP) - Overview
6 PLLP – Flow Rates, Loss Factors, Transition Matrix – Definitions and Examples
7 PLLP – Gross Provisions, Recovery Models, Net Provisions - Calculations
8 Risk Costs – Definitions and Examples
9 Experience from the roll-out across the RBI Group
10 Future Plans for Loan Loss Provisioning Methodology in RBI Retail Portfolio

Slide no.20
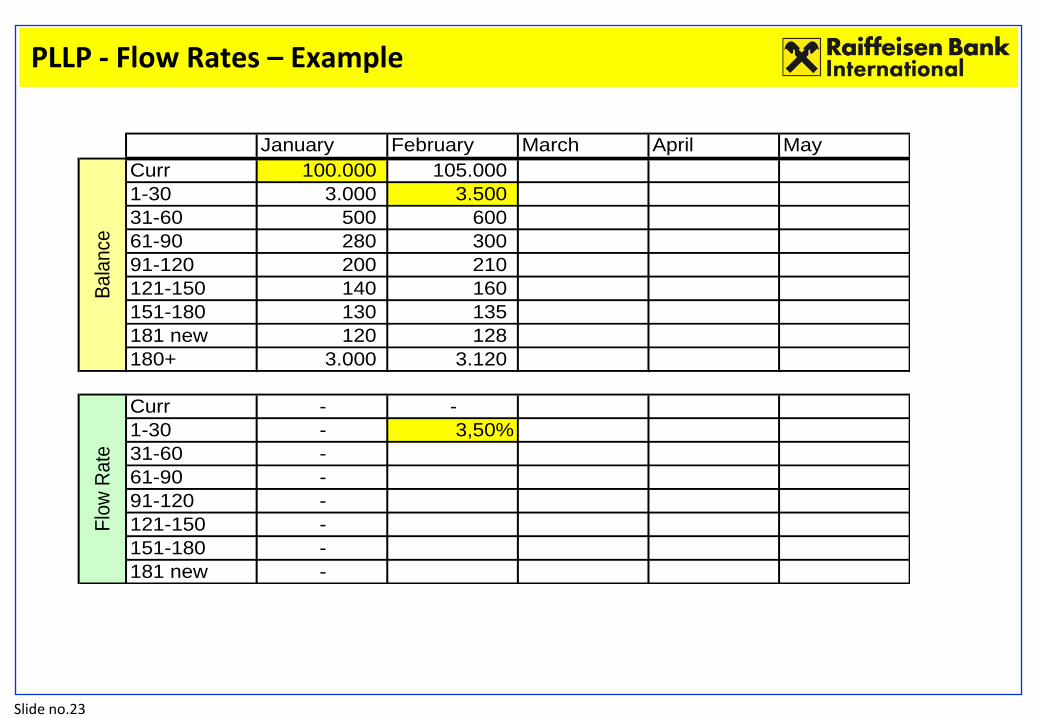
Bucket (i) Previous month balance Bi(t-1)
Current month balance Bi(t) Monthly Flow rate (%) FR
Current (1) B10[1] B11 FR1[3] = min(100%; B21/B10)
1-30 dpd (2) B20 B21 [2] FR2 = min(100%; B31/B20)
31-60 dpd (3) B30 B31 FR3 = min(100%; B41/B30)
61-90 dpd (4) B40 B41 FR4 = min(100%; B51/B40)
91-120 dpd (5) B50 B51 FR5 = min(100%; B61/B50)
121-150 dpd (6) B60 B61 FR6 = min(100%; B71/B60)
151 - 180 dpd (7) B70 B71 FR7 = min(100%; B81/B70)
180+ (8) B80 B81 100%
[1] B10 – balance of loans in the category (Current Bucket) in month “t-1” (previous month)
[2] B21 – balance of loans in the category (1_30) in month “t” (current month – for which the reporting is done)
[3] FR1– Flow rate (%) of rolling from Current bucket to 1-30 dpd bucket corresponding to the actual month (t) for which the reporting is done.
It is based on the assumption that an account either flows down or is paid out
Flow rate is calculated as a ratio – the balance in dpd bucket from actual month over the balance in the previous dpd bucket from previous month (maximum 100%)
PLLP - Flow Rate – Definition
Slide no.21
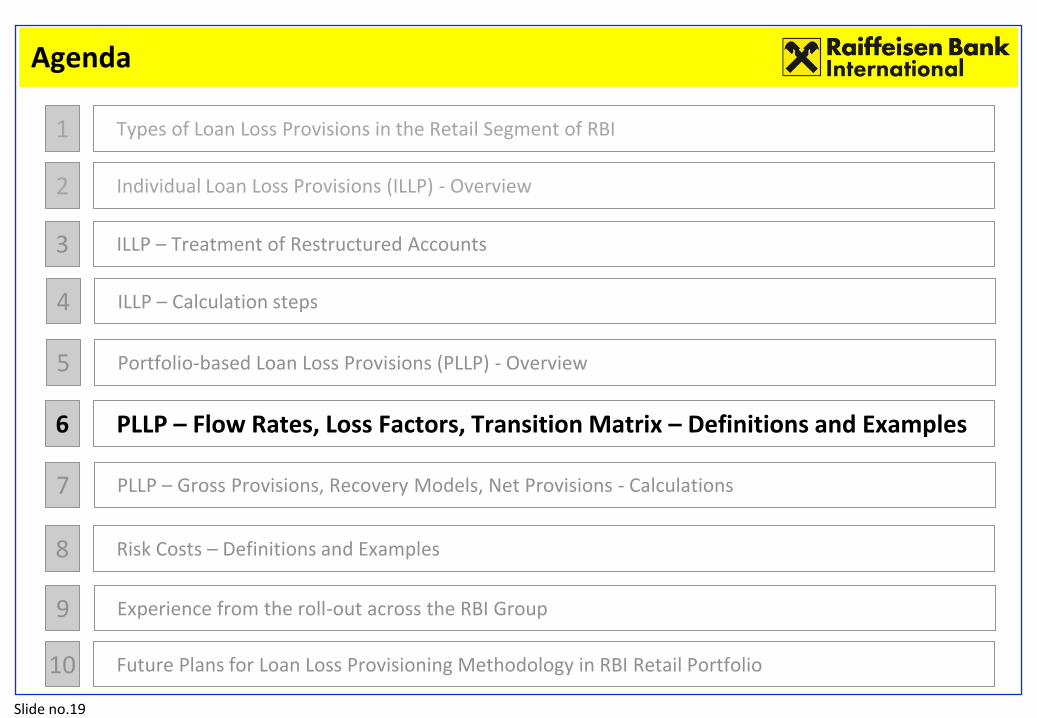
January February March April May
Curr 100.000
1-30 3.000
31-60 500
61-90 280
91-120 200
121-150 140
151-180 130
181 new 120
180+ 3.000
Curr -
1-30 -
31-60 -
61-90 -
91-120 -
121-150 -
151-180 -
181 new -
Ba
lance
Flo
w R
ate
PLLP - Flow Rates – Example
Slide no.22
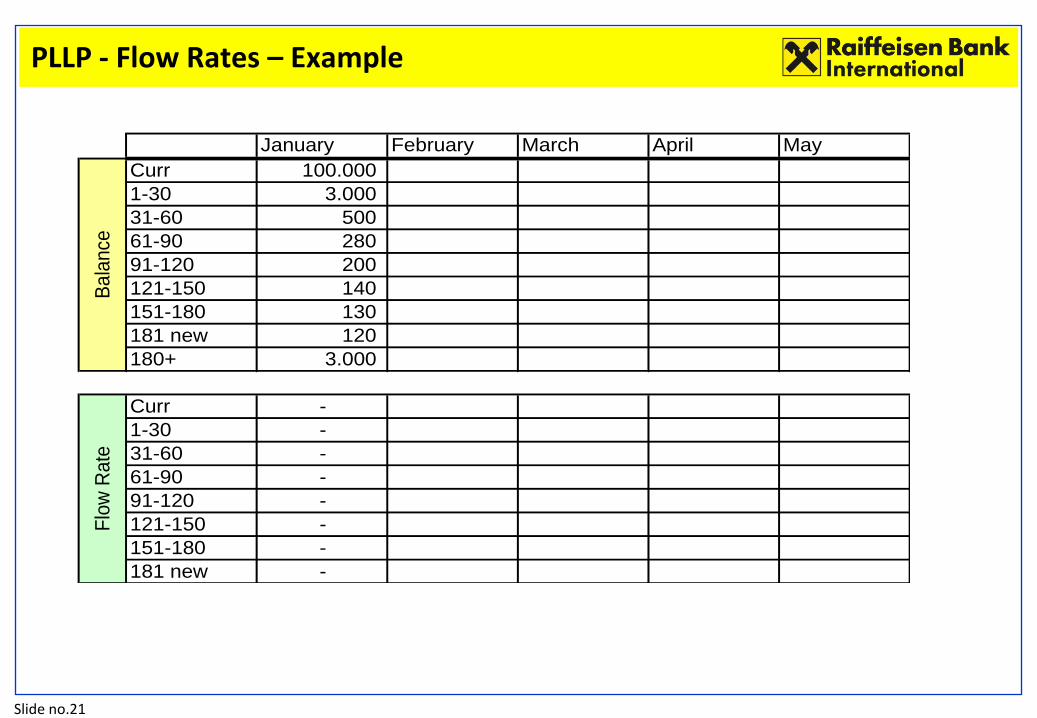
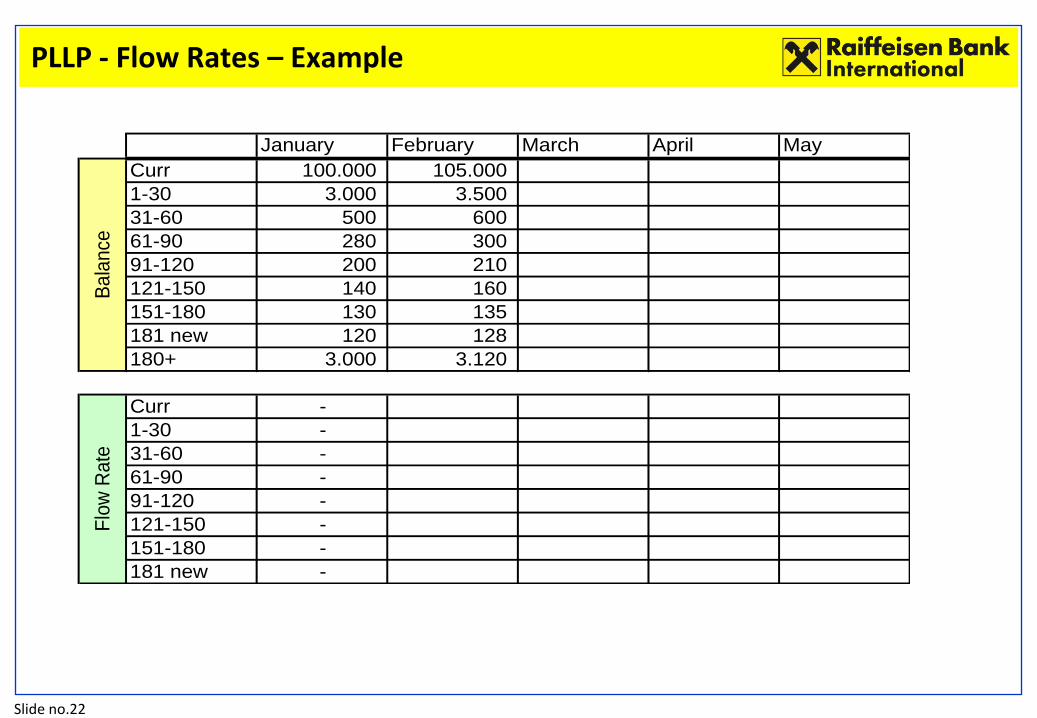
January February March April May
Curr 100.000 105.000
1-30 3.000 3.500
31-60 500 600
61-90 280 300
91-120 200 210
121-150 140 160
151-180 130 135
181 new 120 128
180+ 3.000 3.120
Curr -
1-30 -
31-60 -
61-90 -
91-120 -
121-150 -
151-180 -
181 new -
Ba
lance
Flo
w R
ate
PLLP - Flow Rates – Example
Slide no.23
January February March April May
Curr 100.000 105.000
1-30 3.000 3.500
31-60 500 600
61-90 280 300
91-120 200 210
121-150 140 160
151-180 130 135
181 new 120 128
180+ 3.000 3.120
Curr - -
1-30 - 3,50%
31-60 -
61-90 -
91-120 -
121-150 -
151-180 -
181 new -
Ba
lance
Flo
w R
ate
PLLP - Flow Rates – Example

Slide no.24
January February March April May
Curr 100.000 105.000
1-30 3.000 3.500
31-60 500 600
61-90 280 300
91-120 200 210
121-150 140 160
151-180 130 135
181 new 120 128
180+ 3.000 3.120
Curr - -
1-30 - 3,50%
31-60 - 20,00%
61-90 -
91-120 -
121-150 -
151-180 -
181 new -
Ba
lance
Flo
w R
ate
PLLP - Flow Rates – Example
Slide no.25
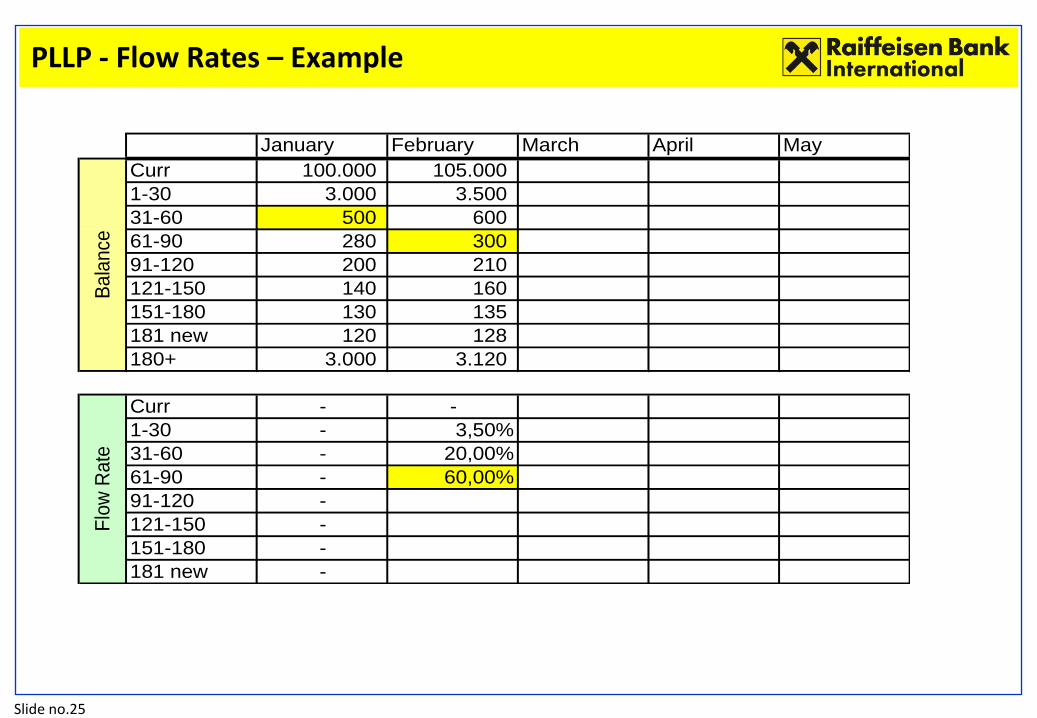
January February March April May
Curr 100.000 105.000
1-30 3.000 3.500
31-60 500 600
61-90 280 300
91-120 200 210
121-150 140 160
151-180 130 135
181 new 120 128
180+ 3.000 3.120
Curr - -
1-30 - 3,50%
31-60 - 20,00%
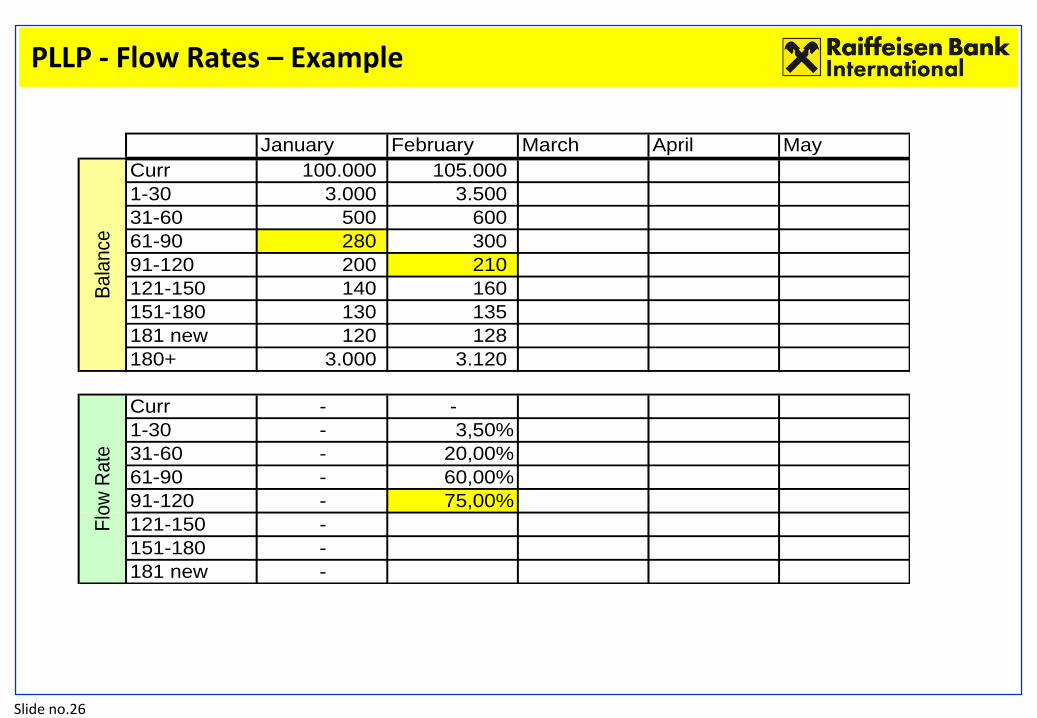
61-90 - 60,00%
91-120 -
121-150 -
151-180 -
181 new -
Ba
lance
Flo
w R
ate
PLLP - Flow Rates – Example
Slide no.26
January February March April May
Curr 100.000 105.000
1-30 3.000 3.500
31-60 500 600
61-90 280 300
91-120 200 210
121-150 140 160
151-180 130 135
181 new 120 128
180+ 3.000 3.120
Curr - -
1-30 - 3,50%
31-60 - 20,00%
61-90 - 60,00%
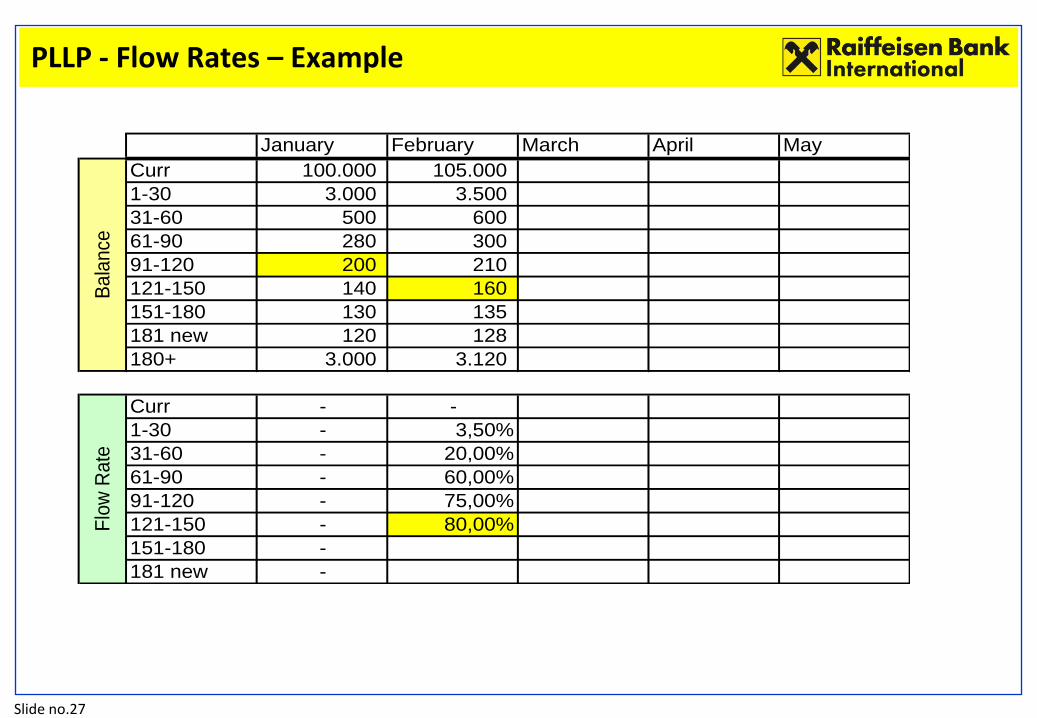
91-120 - 75,00%
121-150 -
151-180 -
181 new -
Ba
lance
Flo
w R
ate
PLLP - Flow Rates – Example
Slide no.27
January February March April May
Curr 100.000 105.000
1-30 3.000 3.500
31-60 500 600
61-90 280 300
91-120 200 210
121-150 140 160
151-180 130 135
181 new 120 128
180+ 3.000 3.120
Curr - -
1-30 - 3,50%
31-60 - 20,00%
61-90 - 60,00%
91-120 - 75,00%
121-150 - 80,00%
151-180 -
181 new -
Ba
lance
Flo
w R
ate
PLLP - Flow Rates – Example
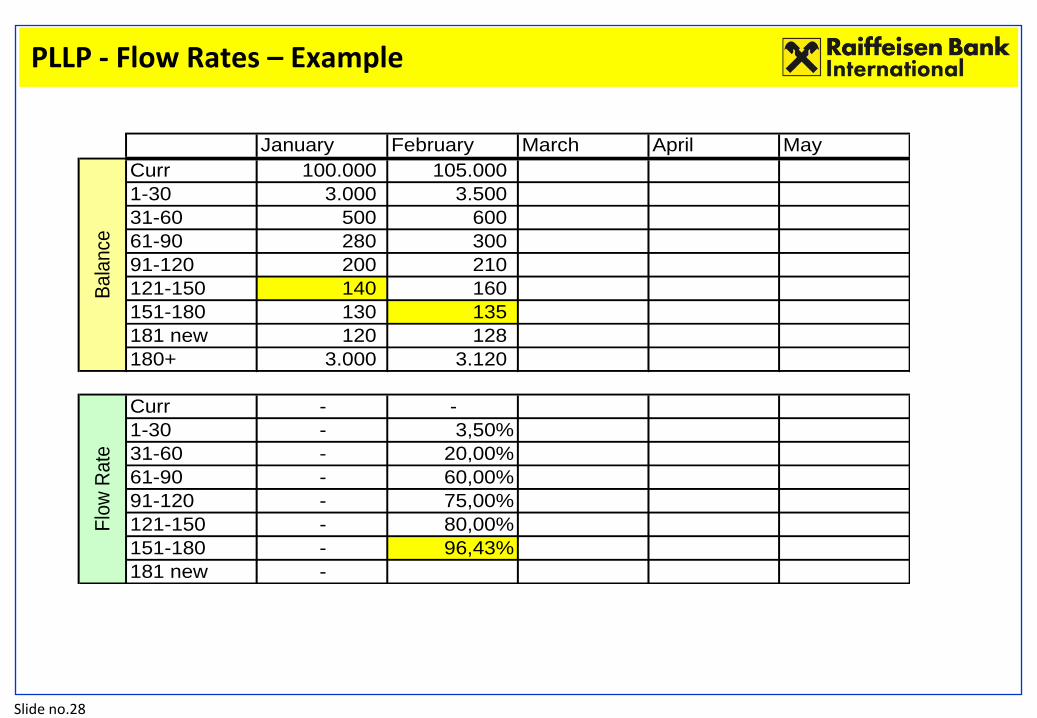
Slide no.28
January February March April May
Curr 100.000 105.000
1-30 3.000 3.500
31-60 500 600
61-90 280 300
91-120 200 210
121-150 140 160
151-180 130 135
181 new 120 128
180+ 3.000 3.120
Curr - -
1-30 - 3,50%
31-60 - 20,00%
61-90 - 60,00%
91-120 - 75,00%
121-150 - 80,00%
151-180 - 96,43%
181 new -
Ba
lance
Flo
w R
ate
PLLP - Flow Rates – Example

Slide no.29
January February March April May
Curr 100.000 105.000
1-30 3.000 3.500
31-60 500 600
61-90 280 300
91-120 200 210
121-150 140 160
151-180 130 135
181 new 120 128
180+ 3.000 3.120
Curr - -
1-30 - 3,50%
31-60 - 20,00%
61-90 - 60,00%
91-120 - 75,00%
121-150 - 80,00%
151-180 - 96,43%
181 new - 98,46%
Ba
lance
Flo
w R
ate
PLLP - Flow Rates – Example
Slide no.30
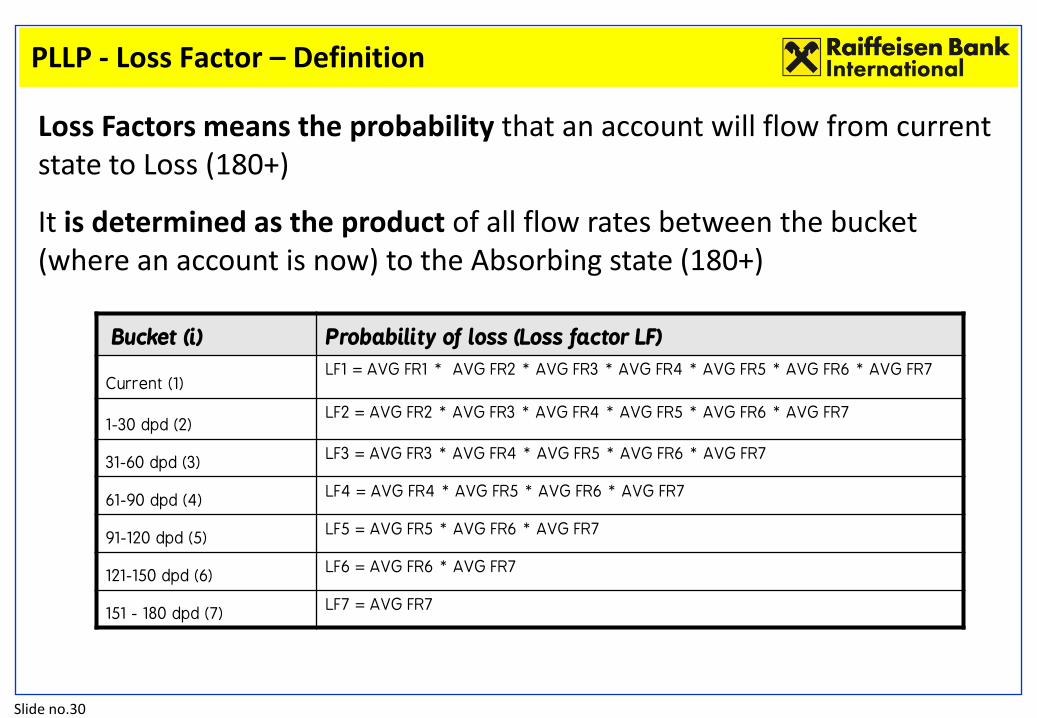
Loss Factors means the probability that an account will flow from current state to Loss (180+)
It is determined as the product of all flow rates between the bucket (where an account is now) to the Absorbing state (180+)
Bucket (i) Probability of loss (Loss factor LF)
Current (1) LF1 = AVG FR1 * AVG FR2 * AVG FR3 * AVG FR4 * AVG FR5 * AVG FR6 * AVG FR7
1-30 dpd (2) LF2 = AVG FR2 * AVG FR3 * AVG FR4 * AVG FR5 * AVG FR6 * AVG FR7
31-60 dpd (3) LF3 = AVG FR3 * AVG FR4 * AVG FR5 * AVG FR6 * AVG FR7
61-90 dpd (4) LF4 = AVG FR4 * AVG FR5 * AVG FR6 * AVG FR7
91-120 dpd (5) LF5 = AVG FR5 * AVG FR6 * AVG FR7
121-150 dpd (6) LF6 = AVG FR6 * AVG FR7
151 - 180 dpd (7) LF7 = AVG FR7
PLLP - Loss Factor – Definition
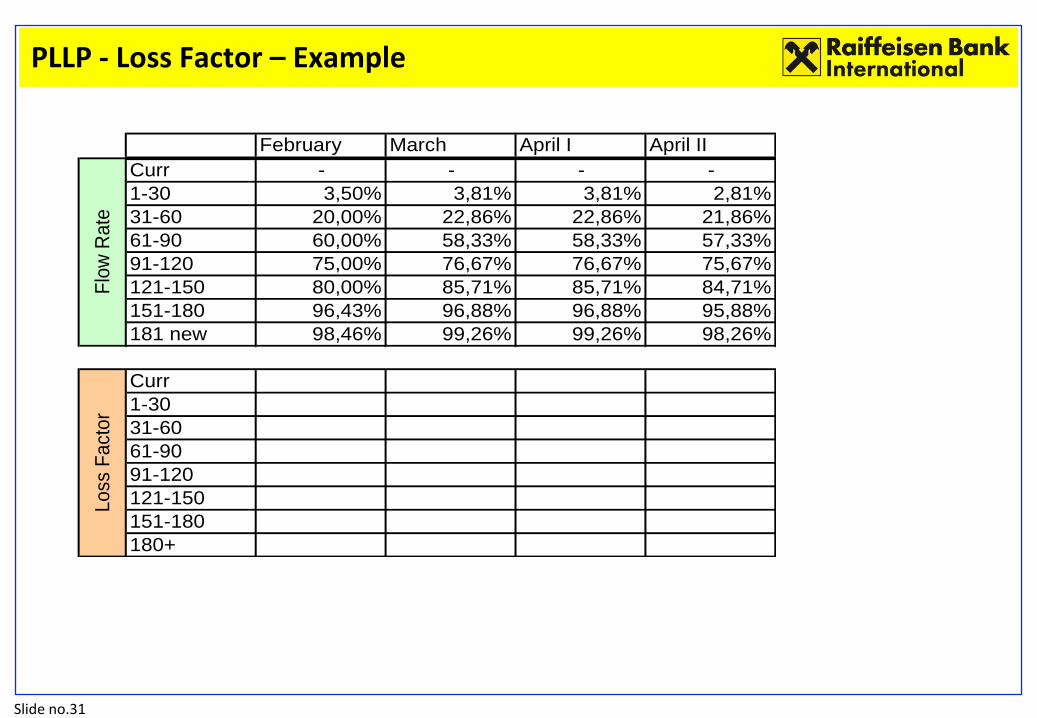
Slide no.31
February March April I April II
Curr - - - -
1-30 3,50% 3,81% 3,81% 2,81%
31-60 20,00% 22,86% 22,86% 21,86%
61-90 60,00% 58,33% 58,33% 57,33%
91-120 75,00% 76,67% 76,67% 75,67%
121-150 80,00% 85,71% 85,71% 84,71%
151-180 96,43% 96,88% 96,88% 95,88%
181 new 98,46% 99,26% 99,26% 98,26%
Curr
1-30
31-60
61-90
91-120
121-150
151-180
180+
Flo
w R
ate
Loss
Fact
or
PLLP - Loss Factor – Example
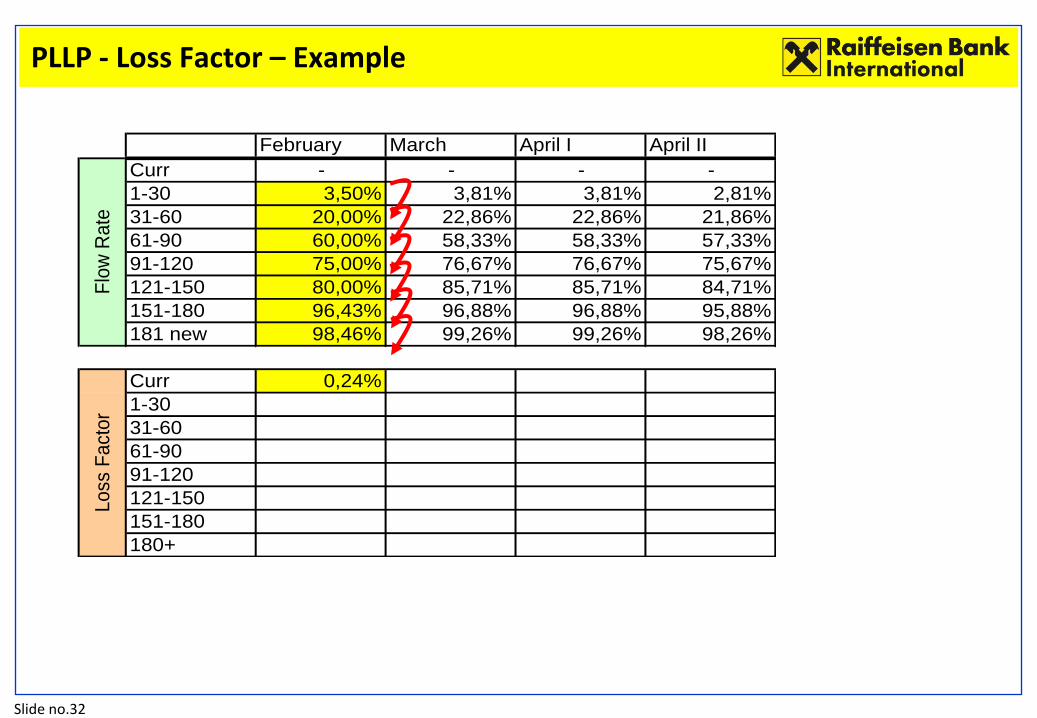
Slide no.32
February March April I April II
Curr - - - -
1-30 3,50% 3,81% 3,81% 2,81%
31-60 20,00% 22,86% 22,86% 21,86%
61-90 60,00% 58,33% 58,33% 57,33%
91-120 75,00% 76,67% 76,67% 75,67%
121-150 80,00% 85,71% 85,71% 84,71%
151-180 96,43% 96,88% 96,88% 95,88%
181 new 98,46% 99,26% 99,26% 98,26%
Curr 0,24%
1-30
31-60
61-90
91-120
121-150
151-180
180+
Flo
w R
ate
Loss
Fact
or
PLLP - Loss Factor – Example
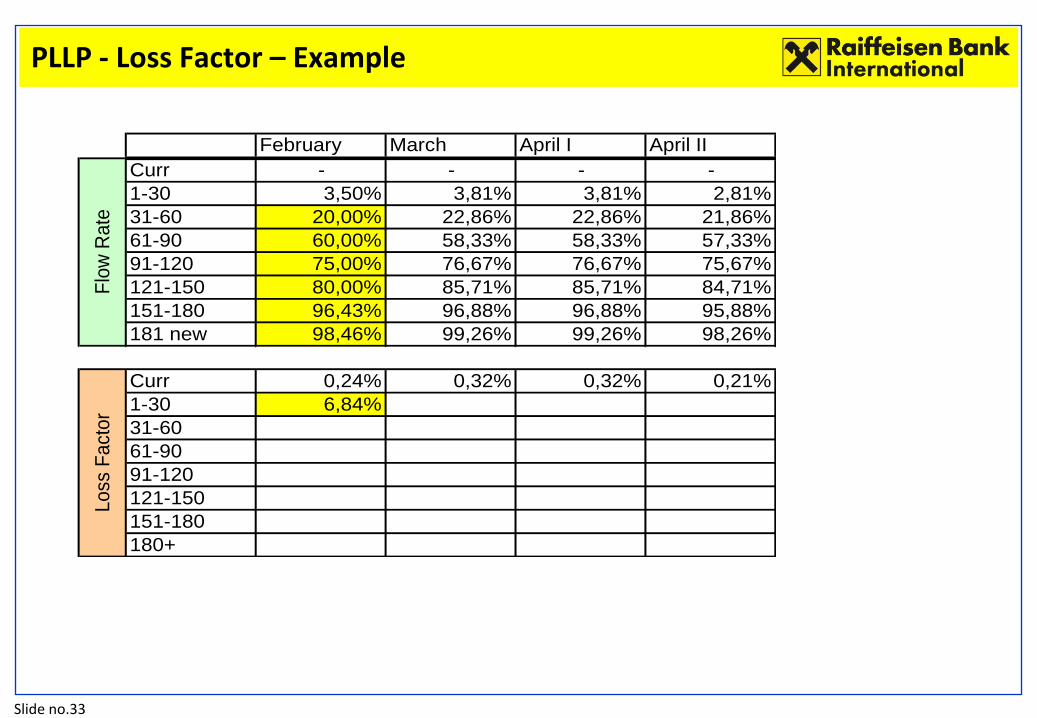
Slide no.33
February March April I April II
Curr - - - -
1-30 3,50% 3,81% 3,81% 2,81%
31-60 20,00% 22,86% 22,86% 21,86%
61-90 60,00% 58,33% 58,33% 57,33%
91-120 75,00% 76,67% 76,67% 75,67%
121-150 80,00% 85,71% 85,71% 84,71%
151-180 96,43% 96,88% 96,88% 95,88%
181 new 98,46% 99,26% 99,26% 98,26%
Curr 0,24% 0,32% 0,32% 0,21%
1-30 6,84%
31-60
61-90
91-120
121-150
151-180
180+
Flo
w R
ate
Loss
Fact
or
PLLP - Loss Factor – Example

Slide no.34
February March April I April II
Curr - - - -
1-30 3,50% 3,81% 3,81% 2,81%
31-60 20,00% 22,86% 22,86% 21,86%
61-90 60,00% 58,33% 58,33% 57,33%
91-120 75,00% 76,67% 76,67% 75,67%
121-150 80,00% 85,71% 85,71% 84,71%
151-180 96,43% 96,88% 96,88% 95,88%
181 new 98,46% 99,26% 99,26% 98,26%
Curr 0,24% 0,32% 0,32% 0,21%
1-30 6,84% 8,43% 8,43% 7,57%
31-60 34,18%
61-90
91-120
121-150
151-180
180+
Flo
w R
ate
Loss
Fact
or
PLLP - Loss Factor – Example
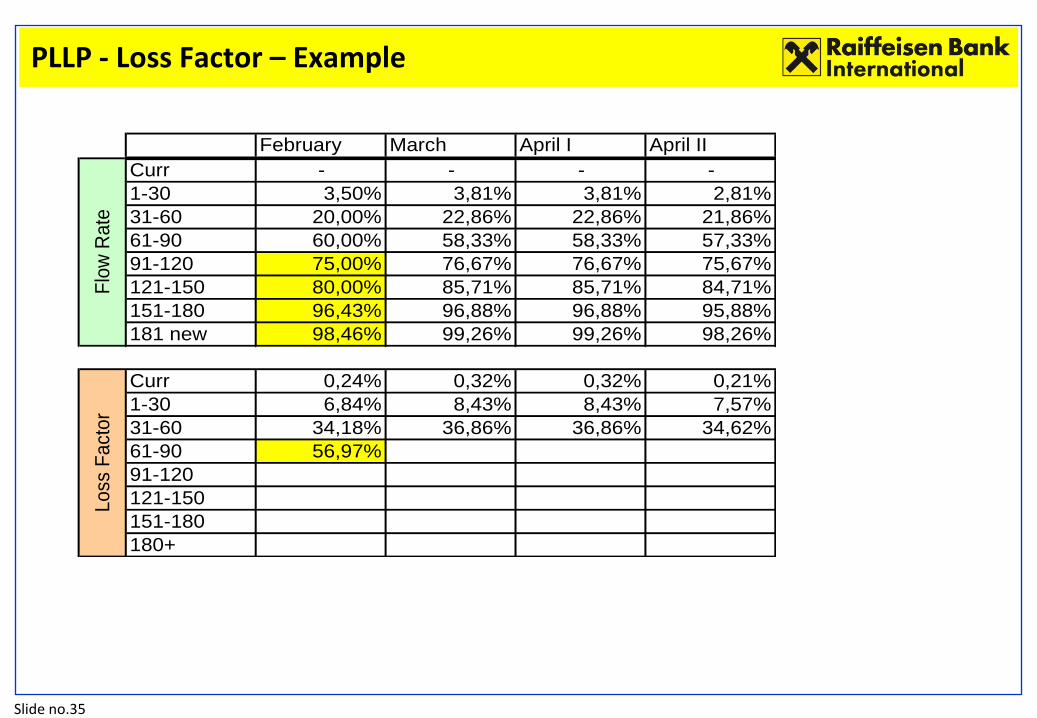
Slide no.35
February March April I April II
Curr - - - -
1-30 3,50% 3,81% 3,81% 2,81%
31-60 20,00% 22,86% 22,86% 21,86%
61-90 60,00% 58,33% 58,33% 57,33%
91-120 75,00% 76,67% 76,67% 75,67%
121-150 80,00% 85,71% 85,71% 84,71%
151-180 96,43% 96,88% 96,88% 95,88%
181 new 98,46% 99,26% 99,26% 98,26%
Curr 0,24% 0,32% 0,32% 0,21%
1-30 6,84% 8,43% 8,43% 7,57%
31-60 34,18% 36,86% 36,86% 34,62%
61-90 56,97%
91-120
121-150
151-180
180+
Flo
w R
ate
Loss
Fact
or
PLLP - Loss Factor – Example
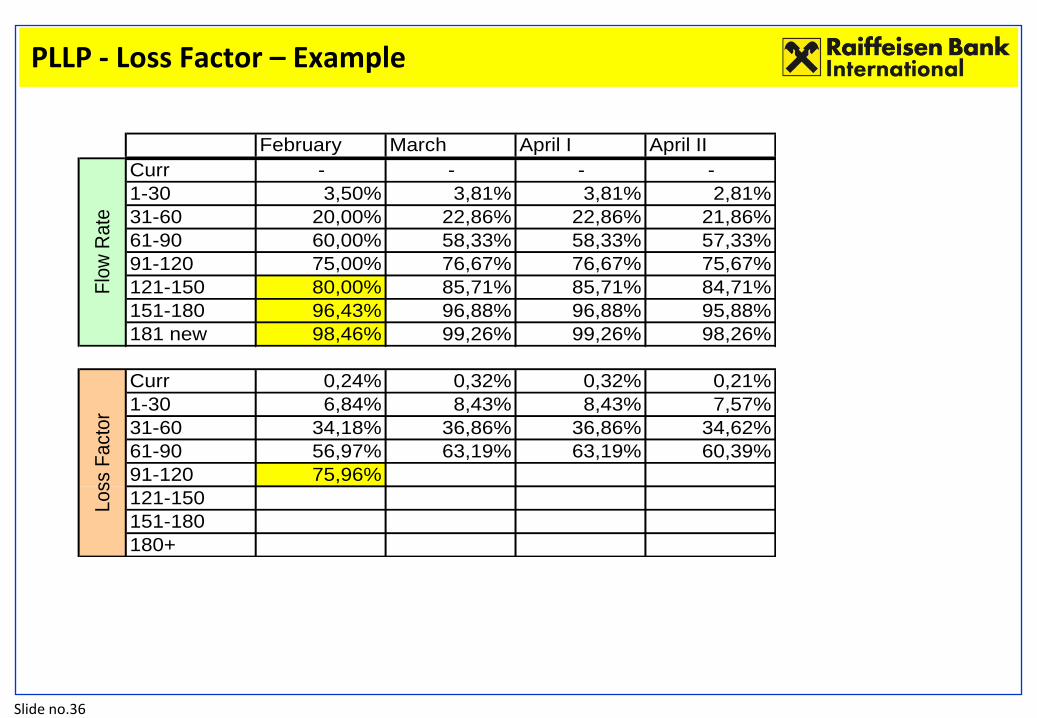
Slide no.36
February March April I April II
Curr - - - -
1-30 3,50% 3,81% 3,81% 2,81%
31-60 20,00% 22,86% 22,86% 21,86%
61-90 60,00% 58,33% 58,33% 57,33%
91-120 75,00% 76,67% 76,67% 75,67%
121-150 80,00% 85,71% 85,71% 84,71%
151-180 96,43% 96,88% 96,88% 95,88%
181 new 98,46% 99,26% 99,26% 98,26%
Curr 0,24% 0,32% 0,32% 0,21%
1-30 6,84% 8,43% 8,43% 7,57%
31-60 34,18% 36,86% 36,86% 34,62%
61-90 56,97% 63,19% 63,19% 60,39%
91-120 75,96%
121-150
151-180
180+
Flo
w R
ate
Loss
Fact
or
PLLP - Loss Factor – Example
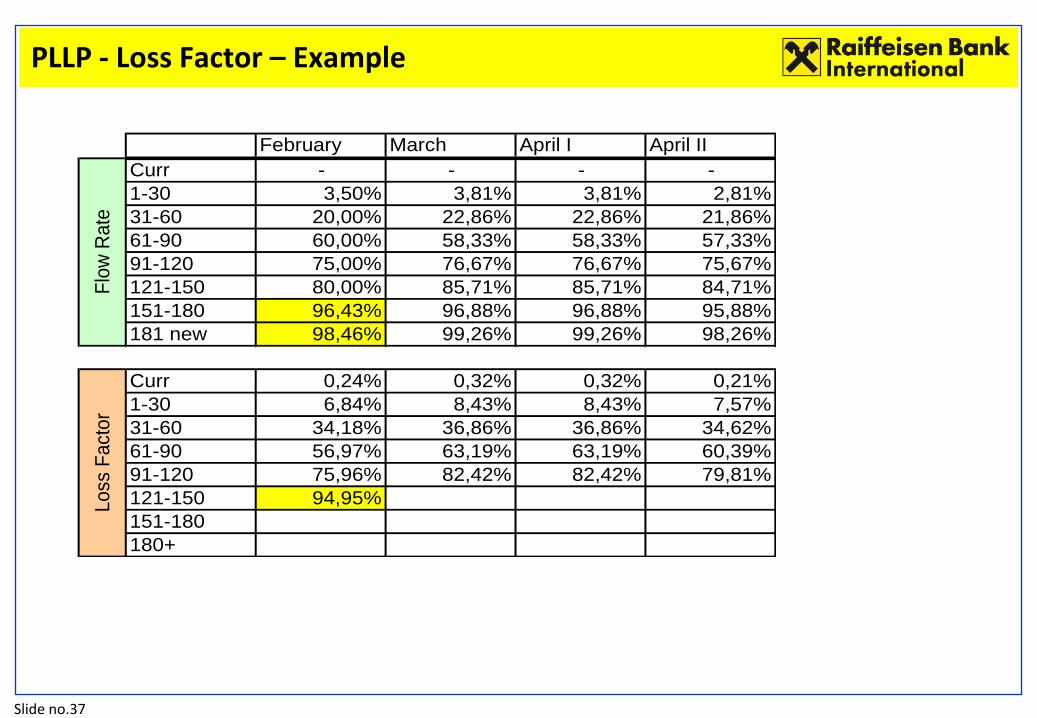
Slide no.37
February March April I April II
Curr - - - -
1-30 3,50% 3,81% 3,81% 2,81%
31-60 20,00% 22,86% 22,86% 21,86%
61-90 60,00% 58,33% 58,33% 57,33%
91-120 75,00% 76,67% 76,67% 75,67%
121-150 80,00% 85,71% 85,71% 84,71%
151-180 96,43% 96,88% 96,88% 95,88%
181 new 98,46% 99,26% 99,26% 98,26%
Curr 0,24% 0,32% 0,32% 0,21%
1-30 6,84% 8,43% 8,43% 7,57%
31-60 34,18% 36,86% 36,86% 34,62%
61-90 56,97% 63,19% 63,19% 60,39%
91-120 75,96% 82,42% 82,42% 79,81%
121-150 94,95%
151-180
180+
Flo
w R
ate
Loss
Fact
or
PLLP - Loss Factor – Example
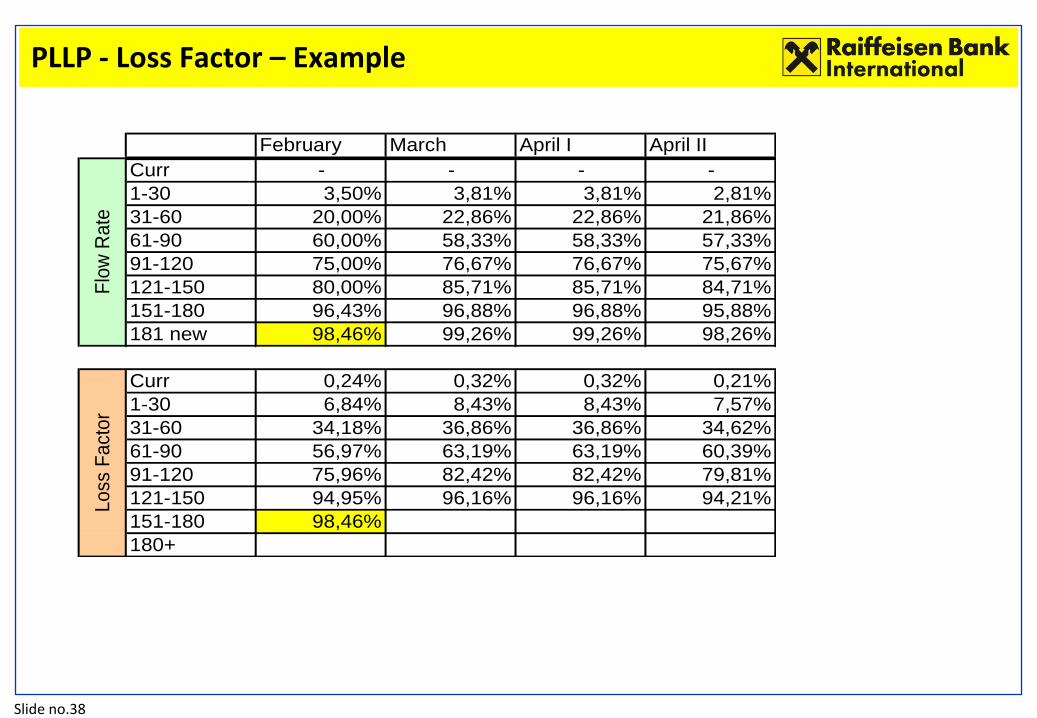
Slide no.38
February March April I April II
Curr - - - -
1-30 3,50% 3,81% 3,81% 2,81%
31-60 20,00% 22,86% 22,86% 21,86%
61-90 60,00% 58,33% 58,33% 57,33%
91-120 75,00% 76,67% 76,67% 75,67%
121-150 80,00% 85,71% 85,71% 84,71%
151-180 96,43% 96,88% 96,88% 95,88%
181 new 98,46% 99,26% 99,26% 98,26%
Curr 0,24% 0,32% 0,32% 0,21%
1-30 6,84% 8,43% 8,43% 7,57%
31-60 34,18% 36,86% 36,86% 34,62%
61-90 56,97% 63,19% 63,19% 60,39%
91-120 75,96% 82,42% 82,42% 79,81%
121-150 94,95% 96,16% 96,16% 94,21%
151-180 98,46%
180+
Flo
w R
ate
Loss
Fact
or
PLLP - Loss Factor – Example
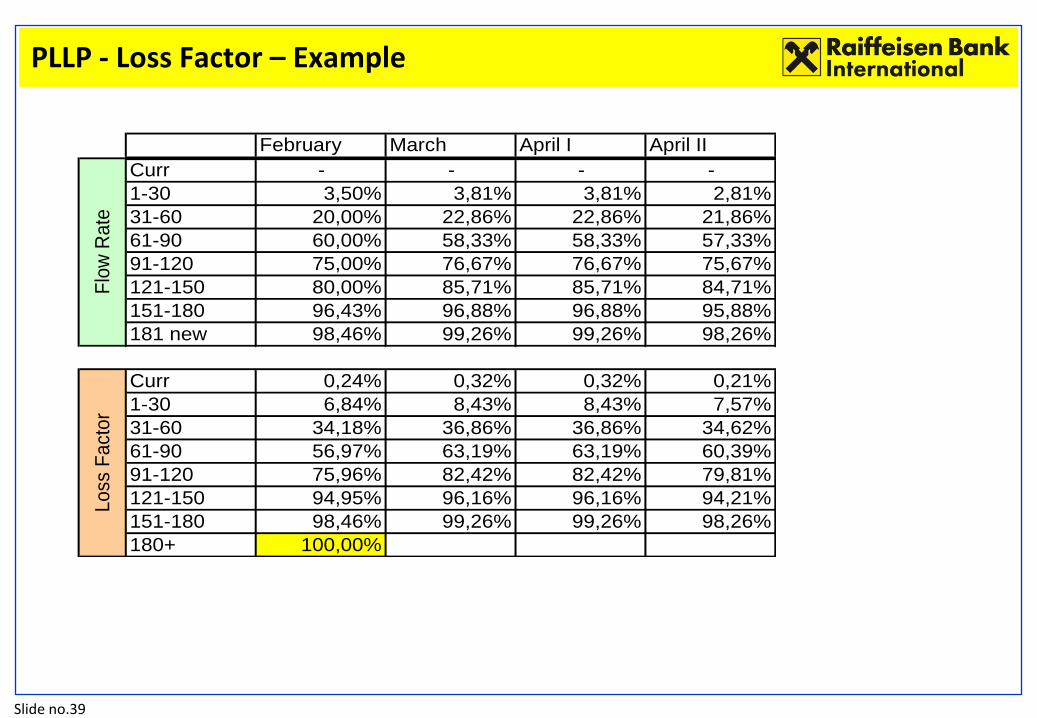
Slide no.39
February March April I April II
Curr - - - -
1-30 3,50% 3,81% 3,81% 2,81%
31-60 20,00% 22,86% 22,86% 21,86%
61-90 60,00% 58,33% 58,33% 57,33%
91-120 75,00% 76,67% 76,67% 75,67%
121-150 80,00% 85,71% 85,71% 84,71%
151-180 96,43% 96,88% 96,88% 95,88%
181 new 98,46% 99,26% 99,26% 98,26%
Curr 0,24% 0,32% 0,32% 0,21%
1-30 6,84% 8,43% 8,43% 7,57%
31-60 34,18% 36,86% 36,86% 34,62%
61-90 56,97% 63,19% 63,19% 60,39%
91-120 75,96% 82,42% 82,42% 79,81%
121-150 94,95% 96,16% 96,16% 94,21%
151-180 98,46% 99,26% 99,26% 98,26%
180+ 100,00%
Flo
w R
ate
Loss
Fact
or
PLLP - Loss Factor – Example
Slide no.40
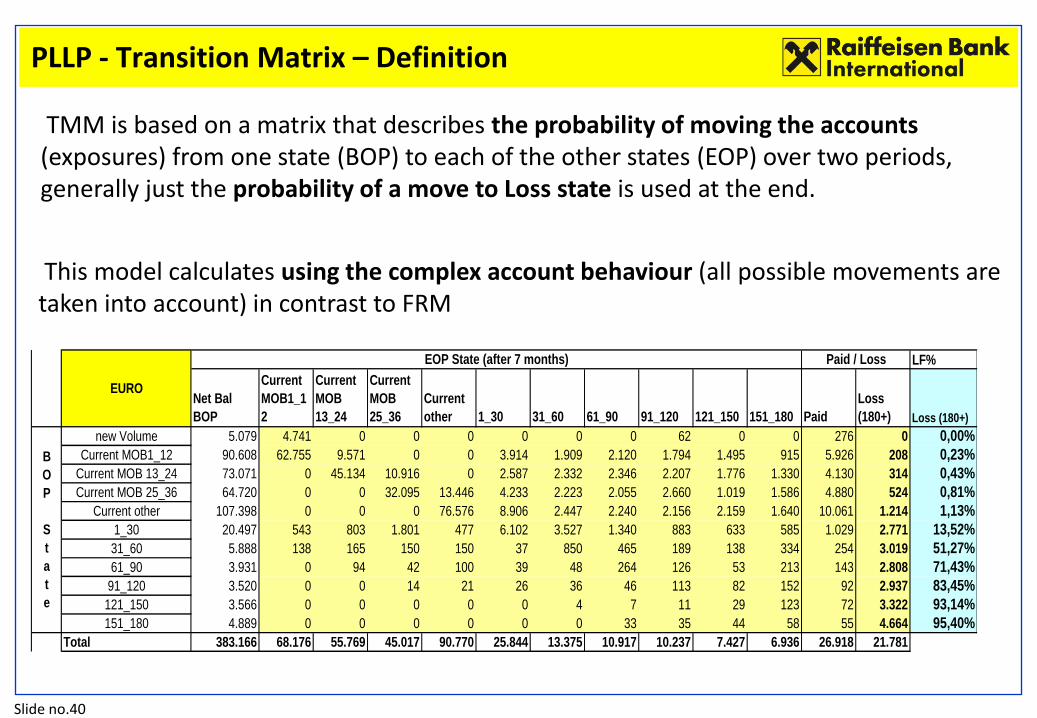
TMM is based on a matrix that describes the probability of moving the accounts (exposures) from one state (BOP) to each of the other states (EOP) over two periods, generally just the probability of a move to Loss state is used at the end.
This model calculates using the complex account behaviour (all possible movements are taken into account) in contrast to FRM
LF%
Net Bal
BOP
Current
MOB1_1
2
Current
MOB
13_24
Current
MOB
25_36
Current
other 1_30 31_60 61_90 91_120 121_150 151_180 Paid
Loss
(180+) Loss (180+)
new Volume 5.079 4.741 0 0 0 0 0 0 62 0 0 276 0 0,00%
Current MOB1_12 90.608 62.755 9.571 0 0 3.914 1.909 2.120 1.794 1.495 915 5.926 208 0,23%
Current MOB 13_24 73.071 0 45.134 10.916 0 2.587 2.332 2.346 2.207 1.776 1.330 4.130 314 0,43%
Current MOB 25_36 64.720 0 0 32.095 13.446 4.233 2.223 2.055 2.660 1.019 1.586 4.880 524 0,81%
Current other 107.398 0 0 0 76.576 8.906 2.447 2.240 2.156 2.159 1.640 10.061 1.214 1,13%
1_30 20.497 543 803 1.801 477 6.102 3.527 1.340 883 633 585 1.029 2.771 13,52%
31_60 5.888 138 165 150 150 37 850 465 189 138 334 254 3.019 51,27%
61_90 3.931 0 94 42 100 39 48 264 126 53 213 143 2.808 71,43%
91_120 3.520 0 0 14 21 26 36 46 113 82 152 92 2.937 83,45%
121_150 3.566 0 0 0 0 0 4 7 11 29 123 72 3.322 93,14%
151_180 4.889 0 0 0 0 0 0 33 35 44 58 55 4.664 95,40%
Total 383.166 68.176 55.769 45.017 90.770 25.844 13.375 10.917 10.237 7.427 6.936 26.918 21.781
Paid / Loss
B
O
P
S
t
a
t
e
EURO
EOP State (after 7 months)
PLLP - Transition Matrix – Definition
Slide no.41
Agenda
1 Types of Loan Loss Provisions in the Retail Segment of RBI
2 Individual Loan Loss Provisions (ILLP) - Overview
3 ILLP – Treatment of Restructured Accounts
4 ILLP – Calculation steps
5 Portfolio-based Loan Loss Provisions (PLLP) - Overview
6 PLLP – Flow Rates, Loss Factors, Transition Matrix – Definitions and Examples
7 PLLP – Gross Provisions, Recovery Models, Net Provisions - Calculations
8 Risk Costs – Definitions and Examples
9 Experience from the roll-out across the RBI Group
10 Future Plans for Loan Loss Provisioning Methodology in RBI Retail Portfolio

Slide no.42
February March
Curr 105.000 110.000
1-30 3.500 4.000
31-60 600 800
61-90 300 350
91-120 210 230
121-150 160 180
151-180 135 155
181 new 128 134
180+ 3.120 3.248
Curr 0,24% 0,32%
1-30 6,84% 8,43%
31-60 34,18% 36,86%
61-90 56,97% 63,19%
91-120 75,96% 82,42%
121-150 94,95% 96,16%
151-180 98,46% 99,26%
180+ 100,00% 100,00%
Bala
nce
Loss
Fact
or
February March
Curr
1-30
31-60
61-90
91-120
121-150
151-180
181 new
180+
Exp
ect
ed L
oss
Pro
visi
on
s
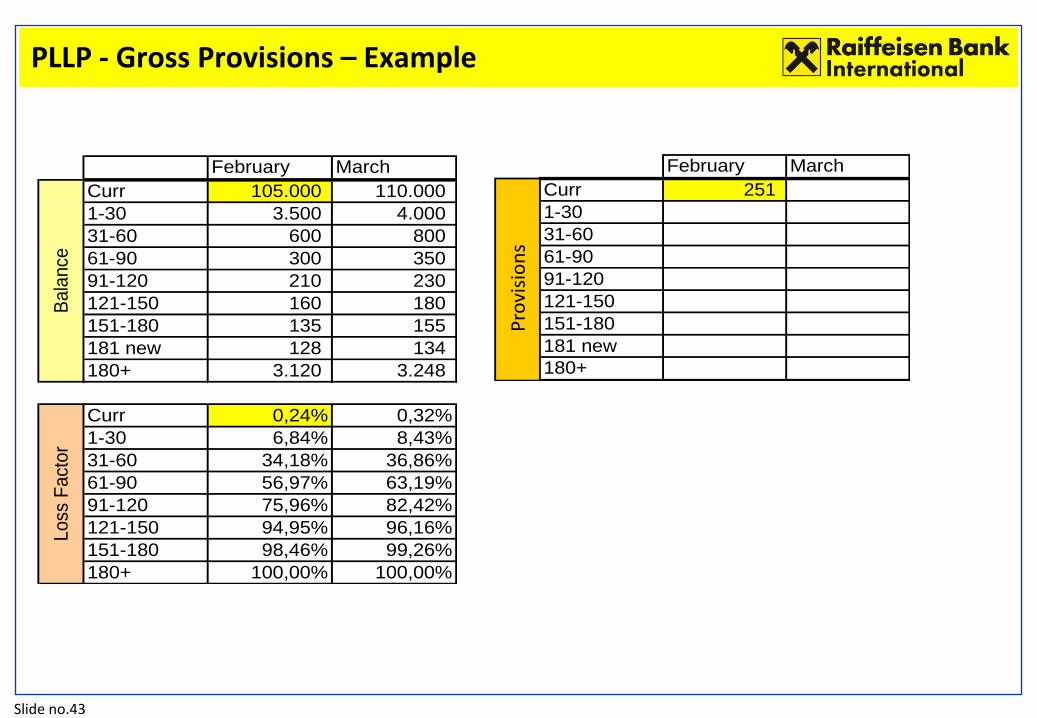
• To calculate the Gross provisions, the probabilities for each state is multiplied with the respective balances, which will give the gross provisions amounts for each state
PLLP - Gross Provisions – Definition
Slide no.43
February March
Curr 105.000 110.000
1-30 3.500 4.000
31-60 600 800
61-90 300 350
91-120 210 230
121-150 160 180
151-180 135 155
181 new 128 134
180+ 3.120 3.248
Curr 0,24% 0,32%
1-30 6,84% 8,43%
31-60 34,18% 36,86%
61-90 56,97% 63,19%
91-120 75,96% 82,42%
121-150 94,95% 96,16%
151-180 98,46% 99,26%
180+ 100,00% 100,00%
Bala
nce
Loss
Fact
or
February March
Curr 251
1-30
31-60
61-90
91-120
121-150
151-180
181 new
180+
Exp
ect
ed L
oss
Pro
visi
on
s
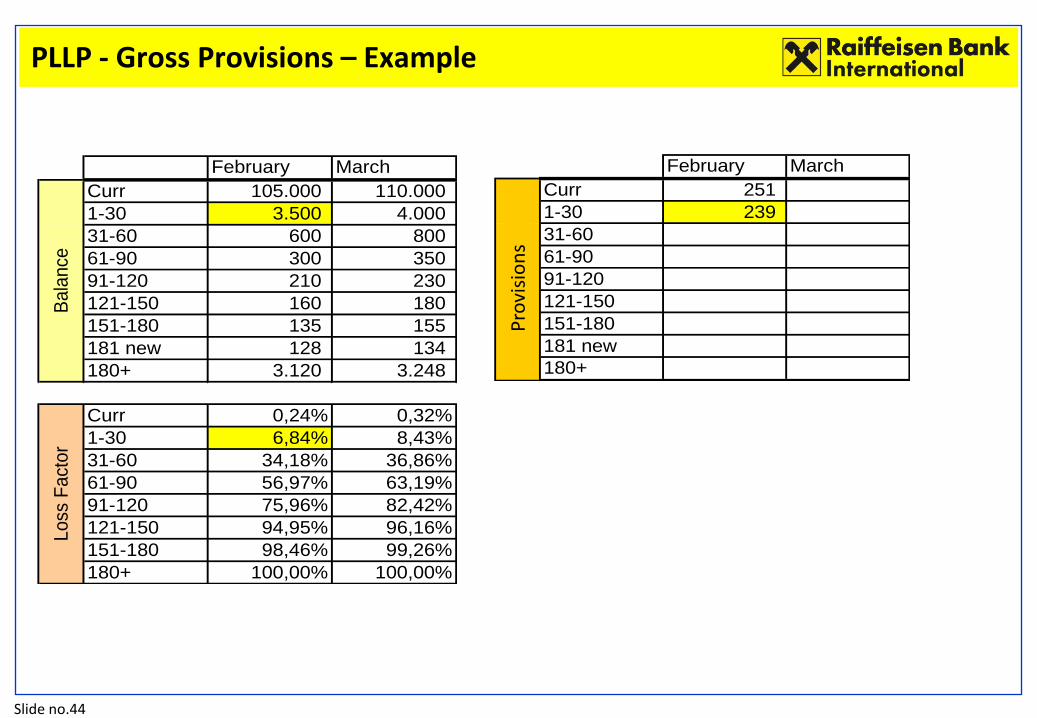
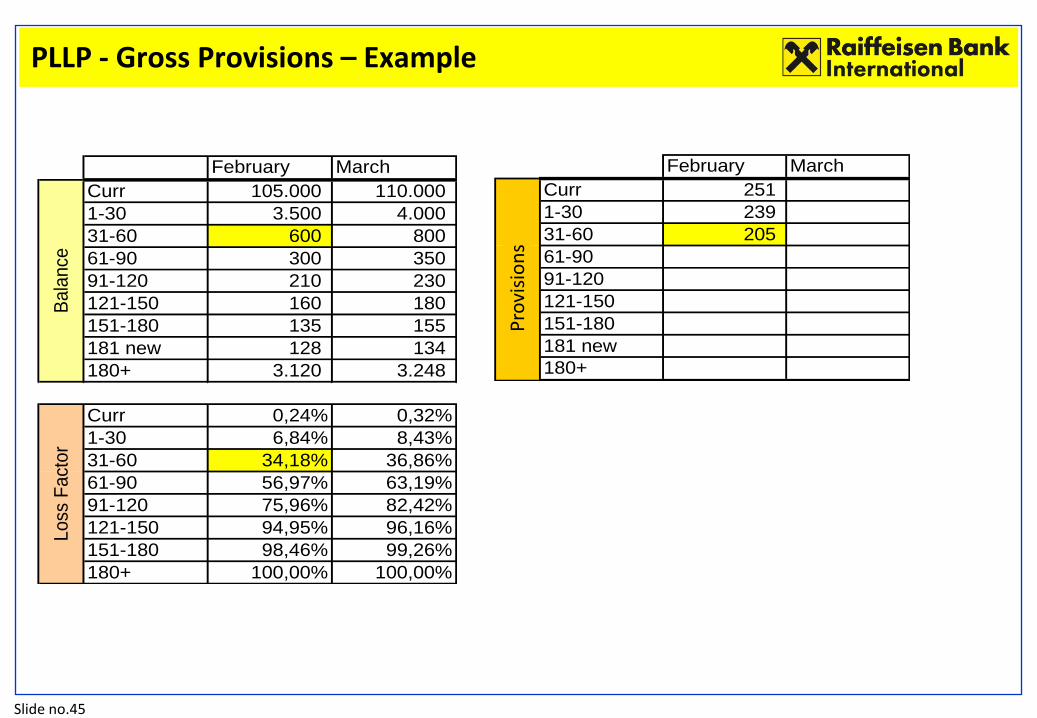
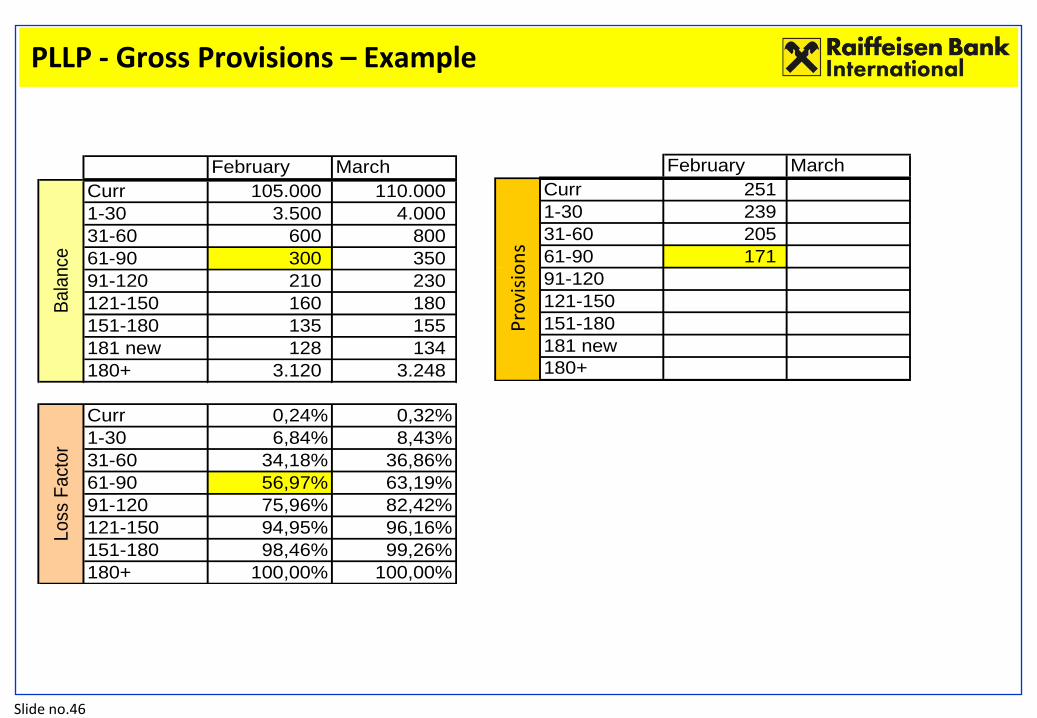
PLLP - Gross Provisions – Example
Slide no.44
February March
Curr 105.000 110.000
1-30 3.500 4.000
31-60 600 800
61-90 300 350
91-120 210 230
121-150 160 180
151-180 135 155
181 new 128 134
180+ 3.120 3.248
Curr 0,24% 0,32%
1-30 6,84% 8,43%
31-60 34,18% 36,86%
61-90 56,97% 63,19%
91-120 75,96% 82,42%
121-150 94,95% 96,16%
151-180 98,46% 99,26%
180+ 100,00% 100,00%
Bala
nce
Loss
Fact
or
February March
Curr 251
1-30 239
31-60
61-90
91-120
121-150
151-180
181 new
180+
Exp
ect
ed L
oss
Pro
visi
on
s
PLLP - Gross Provisions – Example
Slide no.45
February March
Curr 105.000 110.000
1-30 3.500 4.000
31-60 600 800
61-90 300 350
91-120 210 230
121-150 160 180
151-180 135 155
181 new 128 134
180+ 3.120 3.248
Curr 0,24% 0,32%
1-30 6,84% 8,43%
31-60 34,18% 36,86%
61-90 56,97% 63,19%
91-120 75,96% 82,42%
121-150 94,95% 96,16%
151-180 98,46% 99,26%
180+ 100,00% 100,00%
Bala
nce
Loss
Fact
or
February March
Curr 251
1-30 239
31-60 205
61-90
91-120
121-150
151-180
181 new
180+
Exp
ect
ed L
oss
Pro
visi
on
s
PLLP - Gross Provisions – Example
Slide no.46
February March
Curr 105.000 110.000
1-30 3.500 4.000
31-60 600 800
61-90 300 350
91-120 210 230
121-150 160 180
151-180 135 155
181 new 128 134
180+ 3.120 3.248
Curr 0,24% 0,32%
1-30 6,84% 8,43%
31-60 34,18% 36,86%
61-90 56,97% 63,19%
91-120 75,96% 82,42%
121-150 94,95% 96,16%
151-180 98,46% 99,26%
180+ 100,00% 100,00%
Bala
nce
Loss
Fact
or
February March
Curr 251
1-30 239
31-60 205
61-90 171
91-120
121-150
151-180
181 new
180+
Exp
ect
ed L
oss
Pro
visi
on
s
PLLP - Gross Provisions – Example

Slide no.47
February March
Curr 105.000 110.000
1-30 3.500 4.000
31-60 600 800
61-90 300 350
91-120 210 230
121-150 160 180
151-180 135 155
181 new 128 134
180+ 3.120 3.248
Curr 0,24% 0,32%
1-30 6,84% 8,43%
31-60 34,18% 36,86%
61-90 56,97% 63,19%
91-120 75,96% 82,42%
121-150 94,95% 96,16%
151-180 98,46% 99,26%
180+ 100,00% 100,00%
Bala
nce
Loss
Fact
or
February March
Curr 251
1-30 239
31-60 205
61-90 171
91-120 160
121-150
151-180
181 new
180+
Exp
ect
ed L
oss
Pro
visi
on
s
PLLP - Gross Provisions – Example
Slide no.48
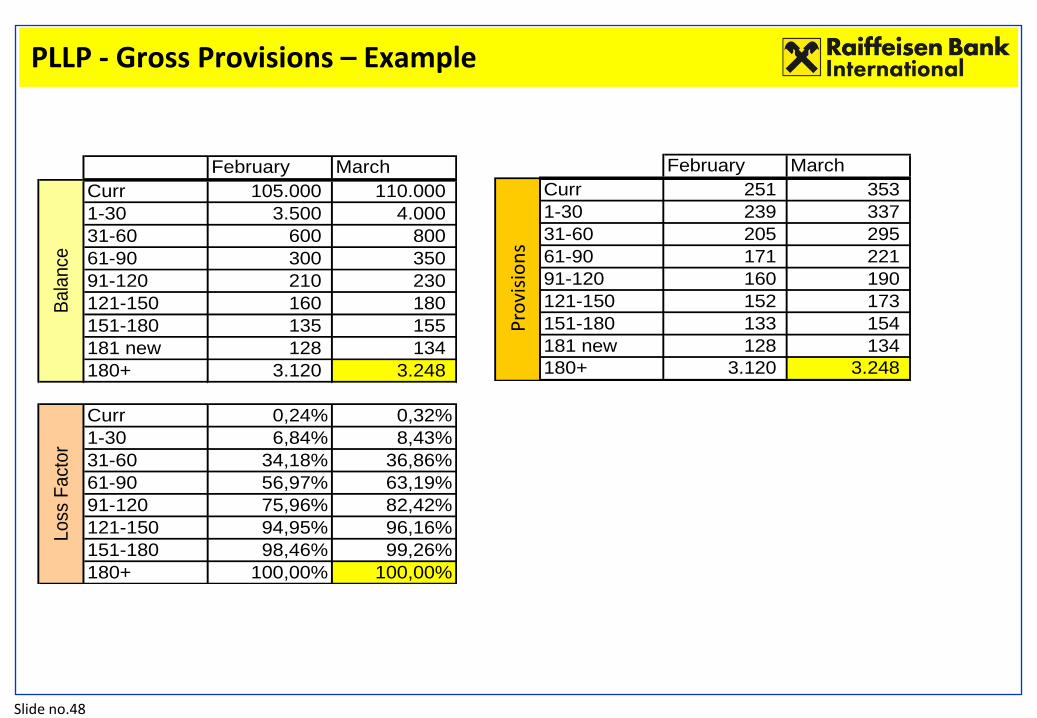
February March
Curr 105.000 110.000
1-30 3.500 4.000
31-60 600 800
61-90 300 350
91-120 210 230
121-150 160 180
151-180 135 155
181 new 128 134
180+ 3.120 3.248
Curr 0,24% 0,32%
1-30 6,84% 8,43%
31-60 34,18% 36,86%
61-90 56,97% 63,19%
91-120 75,96% 82,42%
121-150 94,95% 96,16%
151-180 98,46% 99,26%
180+ 100,00% 100,00%
Bala
nce
Loss
Fact
or
February March
Curr 251 353
1-30 239 337
31-60 205 295
61-90 171 221
91-120 160 190
121-150 152 173
151-180 133 154
181 new 128 134
180+ 3.120 3.248
Exp
ect
ed L
oss
Pro
visi
on
s
PLLP - Gross Provisions – Example
Slide no.49
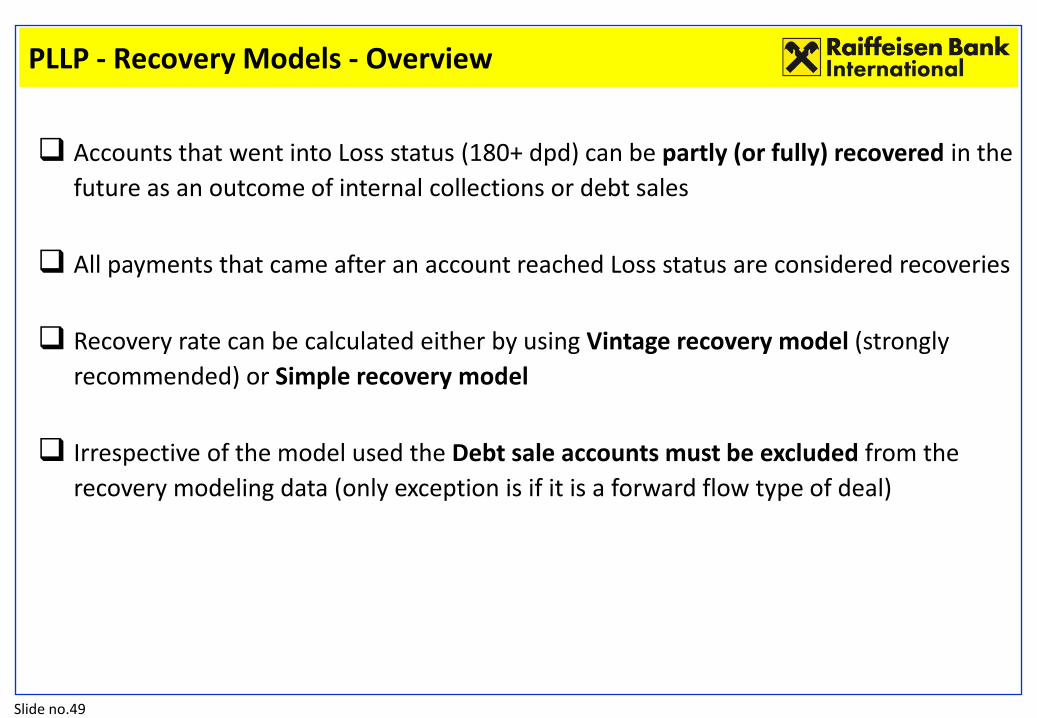
Accounts that went into Loss status (180+ dpd) can be partly (or fully) recovered in the
future as an outcome of internal collections or debt sales
All payments that came after an account reached Loss status are considered recoveries
Recovery rate can be calculated either by using Vintage recovery model (strongly
recommended) or Simple recovery model
Irrespective of the model used the Debt sale accounts must be excluded from the
recovery modeling data (only exception is if it is a forward flow type of deal)
PLLP - Recovery Models - Overview
Slide no.50
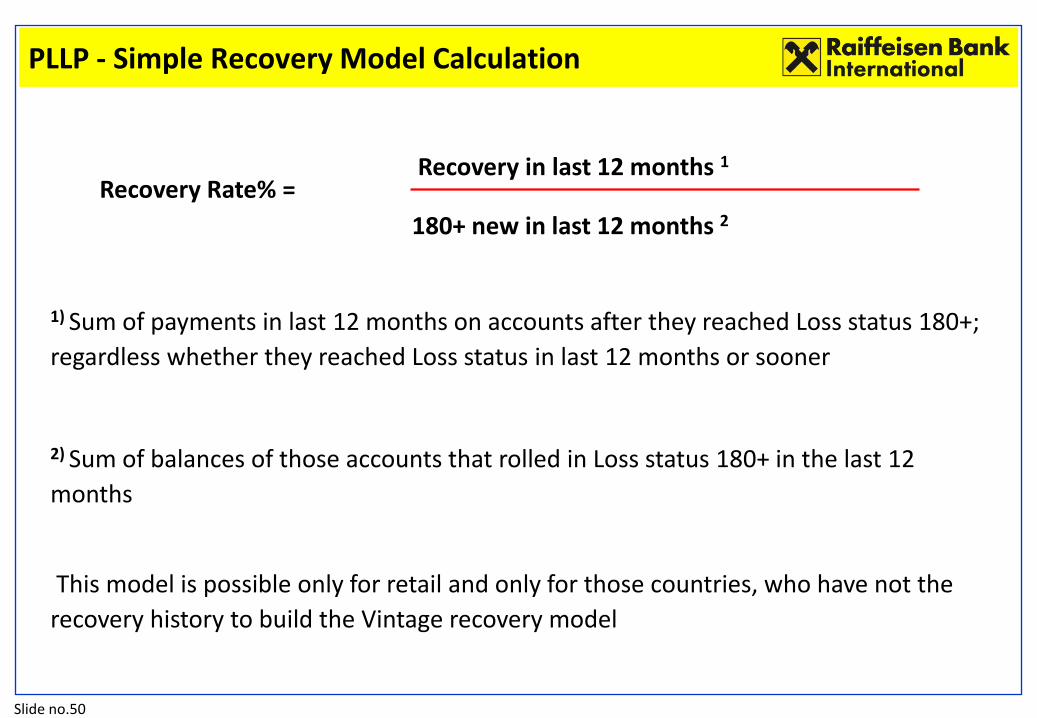
Recovery in last 12 months 1
180+ new in last 12 months 2
Recovery Rate% =
1) Sum of payments in last 12 months on accounts after they reached Loss status 180+;
regardless whether they reached Loss status in last 12 months or sooner
2) Sum of balances of those accounts that rolled in Loss status 180+ in the last 12
months
This model is possible only for retail and only for those countries, who have not the
recovery history to build the Vintage recovery model
PLLP - Simple Recovery Model Calculation
Slide no.51
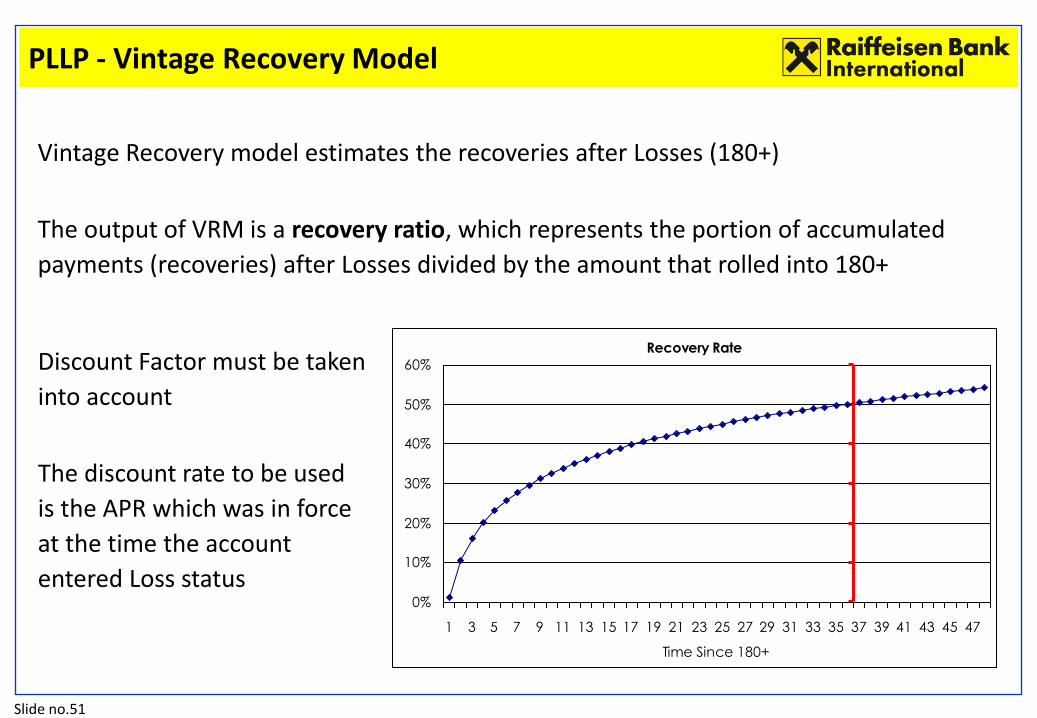
Vintage Recovery model estimates the recoveries after Losses (180+)
The output of VRM is a recovery ratio, which represents the portion of accumulated
payments (recoveries) after Losses divided by the amount that rolled into 180+
PLLP - Vintage Recovery Model
Recovery Rate
0%
10%
20%
30%
40%
50%
60%
1 3 5 7 9 11 13 15 17 19 21 23 25 27 29 31 33 35 37 39 41 43 45 47
Time Since 180+
Discount Factor must be taken
into account
The discount rate to be used
is the APR which was in force
at the time the account
entered Loss status

Slide no.52
A1
B
C
A2 A3
D
Months since write-off
Write off
date
Write-off
amount 1 2 3 4 5 6 7 8
Month, when account
rolled into 180+
Account balance at roll to 180+; see also comments to mortgage ptf.
Loss date Amount
at Loss
Months since Loss
PLLP - Vintage Recovery Rate Calculation
Slide no.53
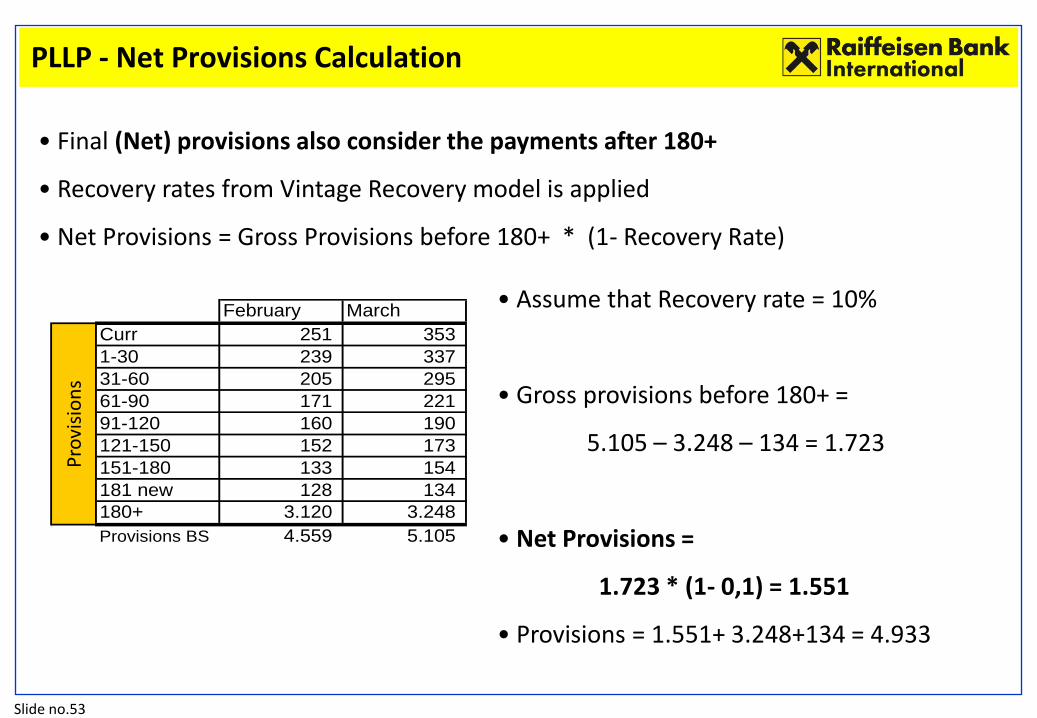
February March
Curr 251 353
1-30 239 337
31-60 205 295
61-90 171 221
91-120 160 190
121-150 152 173
151-180 133 154
181 new 128 134
180+ 3.120 3.248
Provisions BS 4.559 5.105
Exp
ect
ed L
oss
Pro
visi
on
s
• Final (Net) provisions also consider the payments after 180+
• Recovery rates from Vintage Recovery model is applied
• Net Provisions = Gross Provisions before 180+ * (1- Recovery Rate)
• Assume that Recovery rate = 10%
• Gross provisions before 180+ =
5.105 – 3.248 – 134 = 1.723
• Net Provisions =
1.723 * (1- 0,1) = 1.551
• Provisions = 1.551+ 3.248+134 = 4.933
PLLP - Net Provisions Calculation

Slide no.54
Agenda
1 Types of Loan Loss Provisions in the Retail Segment of RBI
2 Individual Loan Loss Provisions (ILLP) - Overview
3 ILLP – Treatment of Restructured Accounts
4 ILLP – Calculation steps
5 Portfolio-based Loan Loss Provisions (PLLP) - Overview
6 PLLP – Flow Rates, Loss Factors, Transition Matrix – Definitions and Examples
7 PLLP – Gross Provisions, Recovery Models, Net Provisions - Calculations
8 Risk Costs – Definitions and Examples
9 Experience from the roll-out across the RBI Group
10 Future Plans for Loan Loss Provisioning Methodology in RBI Retail Portfolio

Slide no.55
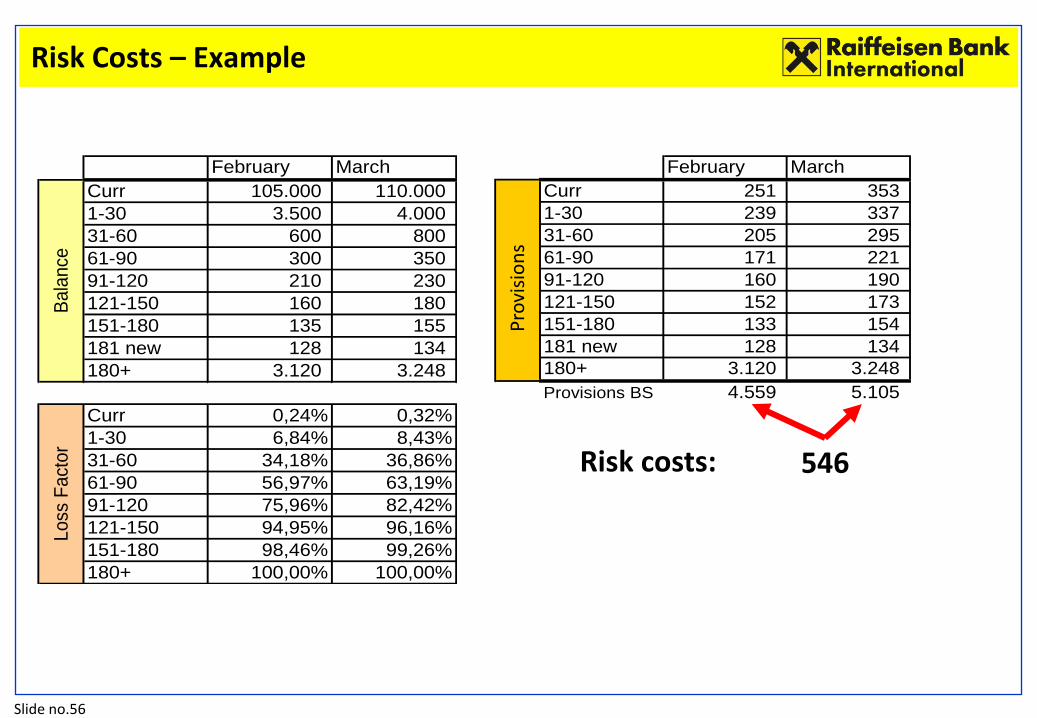
Risk costs =
+ EOP Provisions
– BOP Provisions
+ Usage (Net Write-offs)
BOP – Beginning of Period EOP – End of Period
• has an impact on the Income statement (P&L)
• also called Provisioning for Impairment Losses (P/L) in some financial reports
• shown as the sum of “standard risk costs” and “risk results” (Controlling)
• sum of Allocation, Release, Direct Write downs (Accounting)
• are calculated based on the result of the formula bellow to built new provisions in B/S or to release provisions no longer required
15
40
10
3 3
5
30
0
10
20
30
40
50
60
Provisions
BOP
Allocation* Direct Write
down*
Usage (Net
Write Off)
Release* Provisions
EOP
Risk Costs – Definition
Slide no.56
February March
Curr 105.000 110.000
1-30 3.500 4.000
31-60 600 800
61-90 300 350
91-120 210 230
121-150 160 180
151-180 135 155
181 new 128 134
180+ 3.120 3.248
Curr 0,24% 0,32%
1-30 6,84% 8,43%
31-60 34,18% 36,86%
61-90 56,97% 63,19%
91-120 75,96% 82,42%
121-150 94,95% 96,16%
151-180 98,46% 99,26%
180+ 100,00% 100,00%
Bala
nce
Loss
Fact
or
February March
Curr 251 353
1-30 239 337
31-60 205 295
61-90 171 221
91-120 160 190
121-150 152 173
151-180 133 154
181 new 128 134
180+ 3.120 3.248
Provisions BS 4.559 5.105
Exp
ect
ed L
oss
546 Risk costs:
Pro
visi
on
s
Risk Costs – Example
Slide no.57
Agenda
1 Types of Loan Loss Provisions in the Retail Segment of RBI
2 Individual Loan Loss Provisions (ILLP) - Overview
3 ILLP – Treatment of Restructured Accounts
4 ILLP – Calculation steps
5 Portfolio-based Loan Loss Provisions (PLLP) - Overview
6 PLLP – Flow Rates, Loss Factors, Transition Matrix – Definitions and Examples
7 PLLP – Gross Provisions, Recovery Models, Net Provisions - Calculations
8 Risk Costs – Definitions and Examples
9 Experience from the roll-out across the RBI Group
10 Future Plans for Loan Loss Provisioning Methodology in RBI Retail Portfolio
Slide no.58
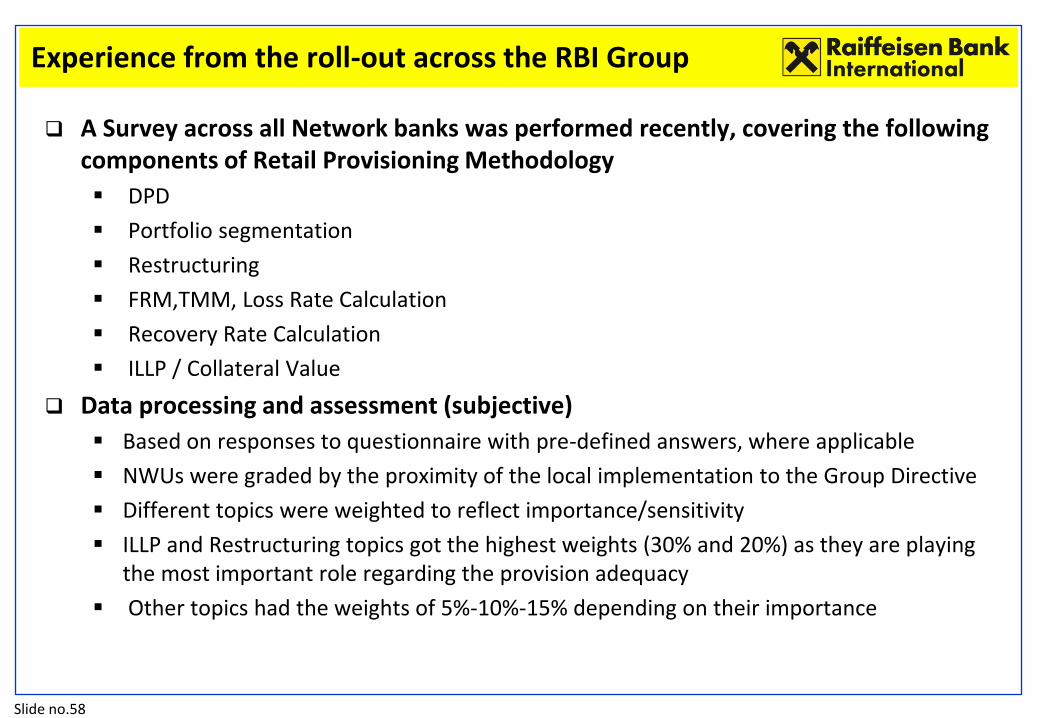
Experience from the roll-out across the RBI Group
A Survey across all Network banks was performed recently, covering the following components of Retail Provisioning Methodology
DPD
Portfolio segmentation
Restructuring
FRM,TMM, Loss Rate Calculation
Recovery Rate Calculation
ILLP / Collateral Value
Data processing and assessment (subjective)
Based on responses to questionnaire with pre-defined answers, where applicable
NWUs were graded by the proximity of the local implementation to the Group Directive
Different topics were weighted to reflect importance/sensitivity
ILLP and Restructuring topics got the highest weights (30% and 20%) as they are playing the most important role regarding the provision adequacy
Other topics had the weights of 5%-10%-15% depending on their importance

Slide no.59
Experience from the roll-out across the RBI Group
Private Individuals
NWBDPD
Portfolio
segmentationRestructuring
Loss rate
calculation
Recovery rate
calculationILLP (WCV) Overall
1 8 9 9 1 0 9 8 8 .9
2 1 0 9 1 0 9 8 1 0 9 .4
3 9 9 7 9 9 5 7 .1
4 8 0 0 3 0 4 3 .3
5 9 1 0 3 6 7 7 6 .4
6 6 8 0 7 6 6 5 .0
7 9 1 0 6 9 6 7 7 .3
8 9 9 3 7 8 8 6 .9
9 1 0 1 0 7 1 0 7 8 7 .8
10 1 0 9 9 8 7 6 7 .5
11 9 9 6 8 8 8 7 .9
12 1 0 9 4 7 0 8 6 .2
13 1 0 1 0 3 4 6 7 6 .1
14 9 9 6 7 8 7 7 .2
15 - - - - - - -
ConservatismNWB PI
1
2
3
4
5
6
7
8
9
10
11
12
13
14
15
MicroSME
NWBDPD
Portfolio
segmentationRestructuring
Loss rate
calculation
Recovery rate
calculationILLP (WCV) Overall
1
2
3
4
5
6
7
8
9
10
11
12
13
14
15
ConservatismNWB Micro
1
2
3
4
5
6
7
8
9
10
11
12
13
14
15
Slide no.60
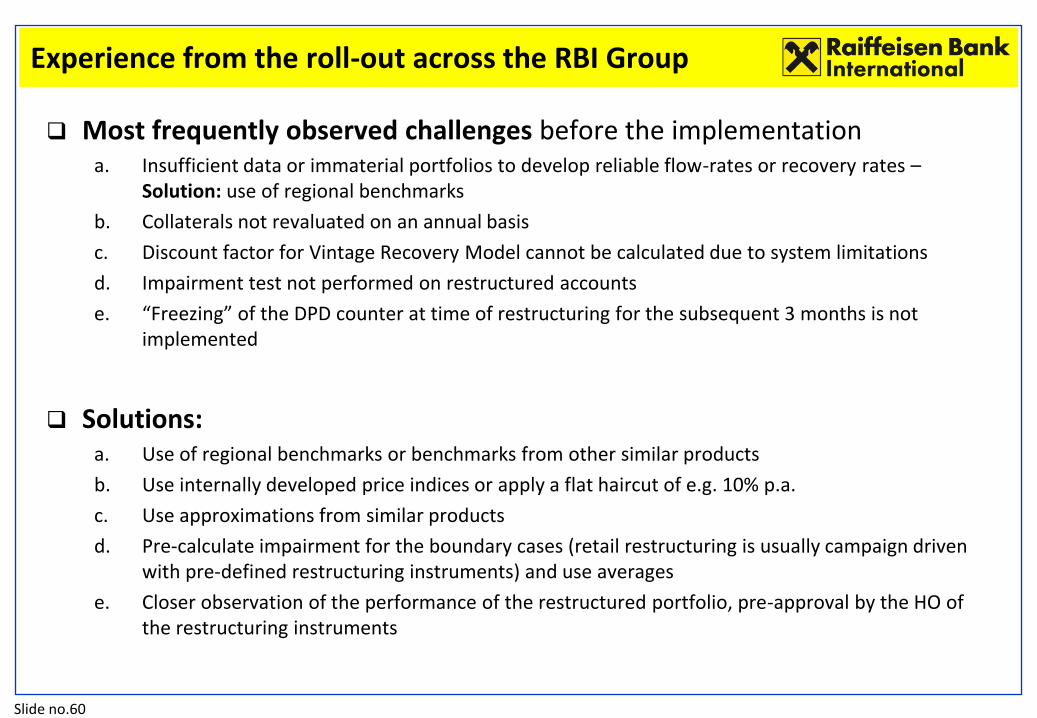
Experience from the roll-out across the RBI Group
Most frequently observed challenges before the implementation a. Insufficient data or immaterial portfolios to develop reliable flow-rates or recovery rates –
Solution: use of regional benchmarks
b. Collaterals not revaluated on an annual basis
c. Discount factor for Vintage Recovery Model cannot be calculated due to system limitations
d. Impairment test not performed on restructured accounts
e. “Freezing” of the DPD counter at time of restructuring for the subsequent 3 months is not implemented
Solutions: a. Use of regional benchmarks or benchmarks from other similar products
b. Use internally developed price indices or apply a flat haircut of e.g. 10% p.a.
c. Use approximations from similar products
d. Pre-calculate impairment for the boundary cases (retail restructuring is usually campaign driven with pre-defined restructuring instruments) and use averages
e. Closer observation of the performance of the restructured portfolio, pre-approval by the HO of the restructuring instruments
Slide no.61
Agenda
1 Types of Loan Loss Provisions in the Retail Segment of RBI
2 Individual Loan Loss Provisions (ILLP) - Overview
3 ILLP – Treatment of Restructured Accounts
4 ILLP – Calculation steps
5 Portfolio-based Loan Loss Provisions (PLLP) - Overview
6 PLLP – Flow Rates, Loss Factors, Transition Matrix – Definitions and Examples
7 PLLP – Gross Provisions, Recovery Models, Net Provisions - Calculations
8 Risk Costs – Definitions and Examples
9 Experience from the roll-out across the RBI Group
10 Future Plans for Loan Loss Provisioning Methodology in RBI Retail Portfolio

Slide no.62
Possible (Near) Future Approaches
Different approaches for the network units depending on available setup (“hierarchy of provisioning methodologies”): Provisioning based on Basel 2/3 framework (if available):
“Before” loss event: Portfolio-based impairments
PLLP = Exposure * PD * LGD' * LIP
“After” loss event: Individual impairments:
ILLP = Exposure * BEEL
Provisioning based on “days-past-due grid”:
Transition matrix model
Flow rate model
1
2
Important: Reconciliation of approaches by benchmarking and backtesting
LGD’ without down-turn adjustment. BEEL = Best estimate of expected loss

Slide no.63
MIND STRETCHERS
Slide no.64
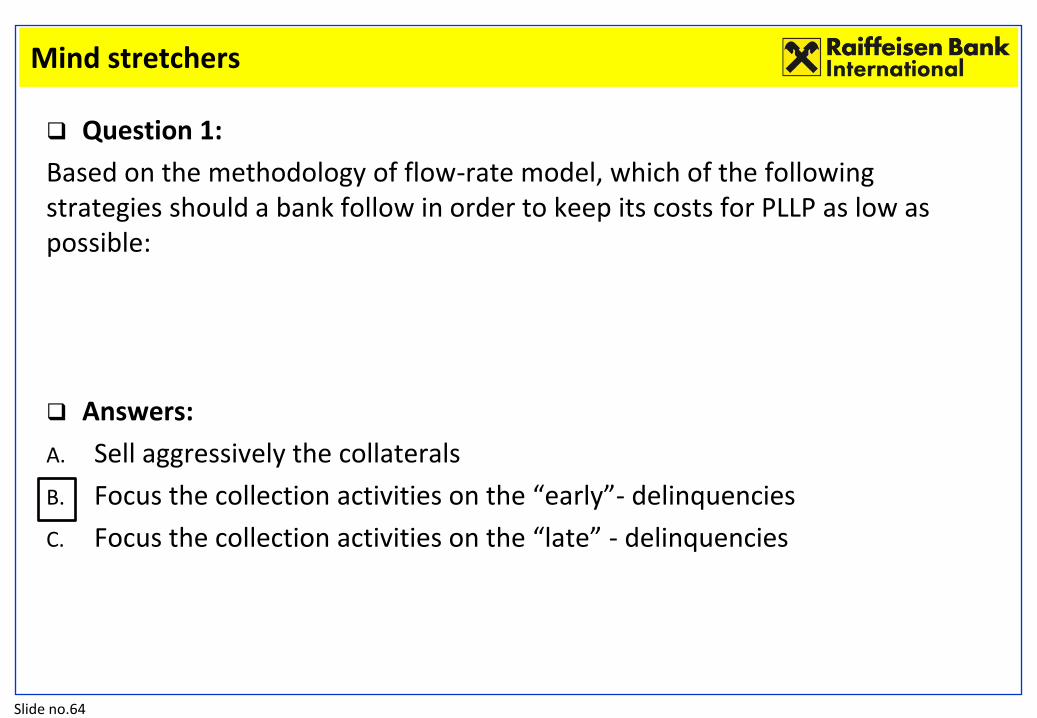
Mind stretchers
Question 1:
Based on the methodology of flow-rate model, which of the following strategies should a bank follow in order to keep its costs for PLLP as low as possible:
Answers:
A. Sell aggressively the collaterals
B. Focus the collection activities on the “early”- delinquencies
C. Focus the collection activities on the “late” - delinquencies
Slide no.65
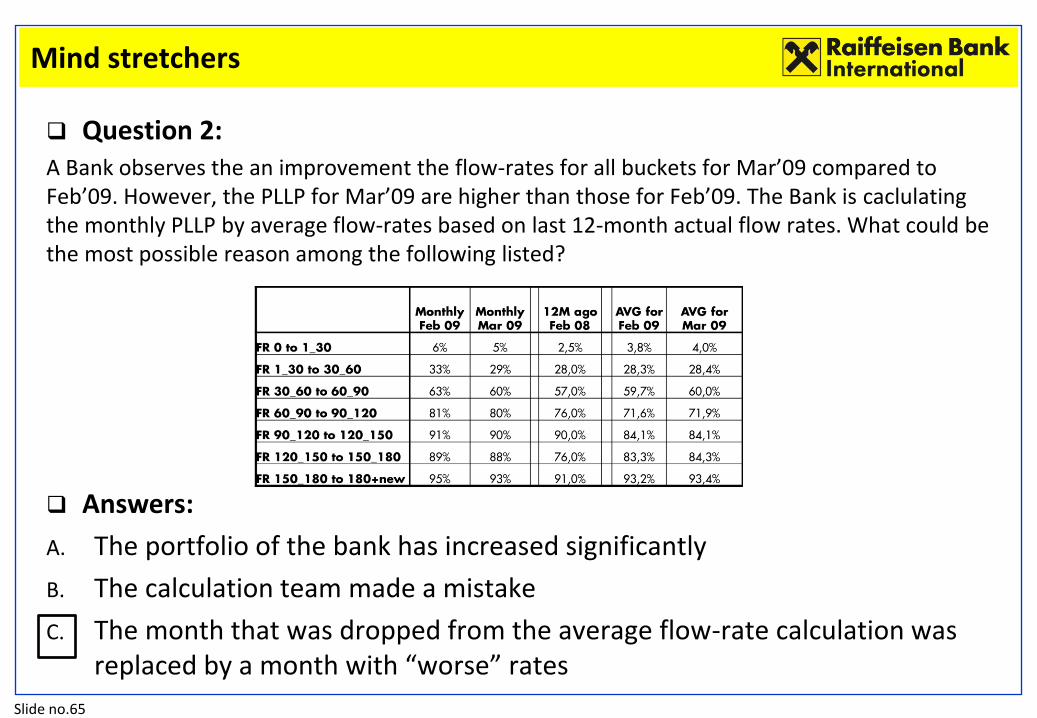
Mind stretchers
Question 2: A Bank observes the an improvement the flow-rates for all buckets for Mar’09 compared to Feb’09. However, the PLLP for Mar’09 are higher than those for Feb’09. The Bank is caclulating the monthly PLLP by average flow-rates based on last 12-month actual flow rates. What could be the most possible reason among the following listed?
Answers:
A. The portfolio of the bank has increased significantly
B. The calculation team made a mistake
C. The month that was dropped from the average flow-rate calculation was replaced by a month with “worse” rates
Slide no.66
Mind stretchers
Question 3: Following the RBI Retail Provisioning methodology, if the flow-rate for Bucket 150-180 to Bucket 180+ is 90%, what is the probability for an account which is currently in Bucket 180+ to roll back into Bucket 150-180?
Answers:
A. 90%
B. 10%
C. 0%
Slide no.67
Mind stretchers
Question 4: If a Bank applying the RBI’s retail provisioning methodology sells a Residential real estate collateral linked to a mortgage account in Bucket 180+ DPD, which of the following provision pools for the Mortgage portfolio will be affected?
Answers:
A. PLLP
B. ILLP
C. Both PLLP and ILLP
Slide no.68
Mind stretchers
Question 5: On 25.05.2013 an unsecured account with current DPD = 55 has been restructured by the Bank whereby during the impairment test it showed an impairment of 2.5%.
On 25.11.2013 the same had DPD = 85 and the Bank restructured the account for a second time, whereby the impairment test showed loss of 5%. What should be the provisioning rate for this account for the end of November 2013?
Additional information: The loss rate for Bucket 30-60 is 30%, the loss rate for Bucket 60-90 is 70%, the Recovery rate for unsecured accounts is 50%.
Answers:
A. 5%
B. 35%
C. 100%

Slide no.69
Q & A

Slide no.70
THANK YOU
Deyan IVANOV
Retail Risk Management
Methodology & Validation
Raiffeisen Bank International AG
Tel.: +43 1 71707-1962
Email: [email protected]