rc 006 121 feb 72 mf-$0.65 hc-$3.29 *census figures ... pi welfare office op education this document...
TRANSCRIPT

DOCUMENT RESUME
ED 063 057 RC 006 121
TITLE Rural Development Chartbook.INSTITUTION Economic Research Service (DOA) Washington, D.C.PUB DATE Feb 72NOTE 89p.
EDRS PRICE MF-$0.65 HC-$3.29DESCRIPTORS *Census Figures; *Economic Factors; Employment;
Government Role; Health Services; Housing; Income;Migration; Planning; *Racial Differences; *RuralUrban Differences; *Tables (Data)
ABSTRACTVarious phases of rural development in the United
States are examined using graphs and tables which provide suchstatistics as the urban-rural total population, migration status byrace, farm population and outmigration, nonfarm nonnettopolitangrowth rate, per capita personal income, earnings by industrialsource, earnings by occupational group, poverty incidence by place ofresidence, number of substandard housing units, per capitaexpenditures for health services, and educational levels. Narrativestatements emphasizing rurdl-urban differences accompany most Of thegraphs and tables. (LS)

U.S. DEPARTMENT OF HEALTH,EDUCATION Pi WELFAREOFFICE OP EDUCATION
THIS DOCUMENT HAS BEEN REPRO-DUCED EXACTLY AS RECEIVED FROMTHE PERSON UR ORGANIZATION ORIG-INATING IT. POINTS OF VIEW OR OPIN-IONS STr.TED OD NOT NECESSARILYREPRESENT OFFICIAL OFFICE OF EDU-CATION POOITION OR POLICY.
RURAL DEVELOPMENT CHAR
ECONOMIC RESEARCHU.S. DEPARTMENT OF

U.S. DEPARTMENT OF HEALTH,EDUCATION & WELFAREOFFICE OF EDUCATION
THIS DOCUMENT HAS BEEN REPRO-OUCED EXACTLY AS RECEIVED FROMTHE PERSON OR ORGANIZATION ORIG-INATING IT. POINTS OF VIEW OR OPIN-IONS STATED DO NOT NECESSARILYREPRESENT OFFICIAL OFFICE OF EDU-CATION POSITION OR POLICY.
ERS-500
ELOPMENT CHARTBOOK
ECONOMIC RESEARCH SERVICE
U.S. DEPARTMENT OF AGRICULTURE. z

Prepared byEconomic Development Division
Economic Research Service
Washington, p. C. 20250
Prepared byEconomic Development Division
Economic Research Service
.. * IFEBRUARY 1972

CONTENTS
Page
Rural Population Holds Steady 2
Urban and Rural Population 3
One-Fifth of Urban Population Came From Rural Areas 4*radon Status and Race of Urban and Rural Population, 1967 5
Outmigration Rate Continues High 6
Farm Population and Migration 7
Nonfarm Nonmetro Growth Rate Exceeds National Average . 8Population Change, 1960-70 9Some Places Growing Rapidly in Nonmetropolitan America 10Location of Nonmetro Towns of 10,000-50,000 PeopleThat
ilad 15 Percent or More Population GrowthFrom 1960-70 .Many Counties Grew After Earlier Population LossCounties With Population Growth in the 1960's After Loss in
the 1950'sOther Counties Had Declining Population RetentionCounties With Population Loss in the 1960's After Growth in
the 1950's 15
Migrants Head for Sea and Sunshine 16
Net Migration, 1960-70 17
Gap in Nonmetropolitan Personal Income Not Yet Closed . . . 18Per Capita Personal Income by Metropolitan Residence 19Nonmetro Areas Depend More on Low-Paying Industries . . . 20
Earnings by Industrial Sources Where Earned, 1968 21
Rural Areas Are Gaining Jobs 22Employment Gains for Industry Groups by Metro-Nonmetro
Location, 1960-70 23
1112
1314
Rural Areas Could Use MorIndustries
Employment, by Industry,and N onmetropolitan Arc
Median Earnings Higher in 'Median Earnings, 1969, byNonmetro Areas Still HaveIncidence of Poverty by M
1969 and 1959Small Farmers Depend onFarm and Off-Farm IncomRural Housing Quality KeeOccupied Substandard Hot,Metro and Nonmetro Com
ServicesPer Capita Expenditures
Services, 1966-67Problem in Delivering MedFhysidans and Hospital Beds in
Despite Improvement, NorSchooling
Educational Attainment o1and Residence, March 1 9
States Organizing NonmetrSub-State Planning and De

CONTENTS
Page
2
3
n Rural Areas 4Population, 1967 5
67
s National Average . 89
10ropolitan America50,000 People ThatIwth From 1960-70 . . 11lation Loss 12
1960's After Loss in13
n Retention 14
60's After Growth in151617
Not Yet Closed . . . 18tan Residence 19'tying Industries . . . 20ned, 1968 21
22Metro-Nonmetro
23
Page
Rural Areas Could Use More "Fast-Growing" NonfarmIndustries 24
Employment, by Industry, United States, Metropolitan Areas,and NonmetropolitanAreas, March 1960 and March 1970 . 25
Median Earnings Higher in Metro Than Nonmetro Areas 26Median Earnings, 1969, by Occupational Group 27
Nonmetro Areas Still Have Much Poverty 28Incidence of Poverty by Metro and Nonmetxo Residence,
1969 and 1959 29Small Farmers Depend on Off-Farm Income 30Farm and Off-Farm Income, 1970 31Rural Housing Quality Keeps Pace With National Trends 32Occupied Substandard Housing Units 33Metro and Nonmetro Communities Spend Money on Same
Services 34Per Capita Expenditures of Local Governments for Selected
Services, 1966-67Problem in Delivering Medical Services to Rural Areas 36Physidans and Hospital Beds in Metro and Nonmetro Areas, 1%9 . 37
Despite Improvement, Nonmetro Areas Lag in Years ofSchooling 38
Educational Attainment of Persons 25 Years and Over, by Colorand Residence, March 1970 39
States Organizing Nonmetro Planning Districts 40Sub-State Planning and Development Districts, September 1971 41
61

RURAL POPULATION HOLDS STEADY
The population of the United States was 203.2 million inApril 1970. This represents an increase of nearly 24 million,or 13 percent, over the corresponding figure for April 1960.The increase was smaller than the 18.5-percent growth of theprevious decade, but was greater in absolute numbers thanthat of any intercensal period except 1950-60.
In 1970, 149.3 million persons were classified as urban resi-dents; the remaining 53.9 million (27 percent) constituted therural population.
The population of the United States was predominately
*z2
rural until 1920,whenmillion, compared withdecades, the process ofportion of the populatiquently, by 1970, nearin urban territory.
In the last few decahas remained nearly th

RURAL POPULATION HOLDS STEADY
as 203.2 million inf nearly 24 million,ire for April 1960.rcent growth of theite numbers than0-60.
assified as urban resi-cent) constituted the
'as predominately
rural until 1920,when the urban population numbered 54.3million, compared with 51.8 million rural. In the followingdecades, the process of urbanization continued and the pro-portion of the population classified as rural declined. Conse-quently, by 1970, nearly 3 out of every 4 persons were livingin urban territory.
In the last few decades, the total number of rural peoplehas remained nearly the same.
(For details, see table 1.)

MIL. PEOPLE
200
160
120
80
40
0
IMMEM
URBAN AND RURAL POPULATIOI
am*
Iota
1111111111111111111111111111111
01°°14
i
Urban\°......-
,....asow- 1,,` 1
riti111110111111111 ii111111111111111111111111111111111 111111111111111111111 11111111M
1
1900 1910 1920 1930 1940 1950 1960
0 DEFINITION CHANGED IN 1950 TO EXCLUDE SOME PEOPLE FORMERLY COUNTED AS RURSOURCE: U.S. BUREAU OF THE CENSUS.
U.S. DEPARTMENT OF AGRICULTURE NEG. ERS 8204-71 (8) ECON

HAN AND RURAL POPULATION
Tota
11411.11
U rban\°......11111111111
er°°° Rura I°I
910 1920 1930 1940 1950 1960 1970 1980CHANGED IN 1950 TO EXCLUDE SOME PEOPLE FORMERLY COUNTED AS RURAL POPULATION.S. BUREAU OF THE CENSUS.
AGRICULTURE NEG. ERS 8204-71 (8) ECONOMIC RESEARCH SERVICE

ONE-FIFTH OF URBAN POPULATION CAME FROM RURAL AREA
In 1967, more than 40 percent of the urban population 14years old and over consisted of nonmigrantspeople who hadnever lived more than 50 miles away from their current resi-dence. Another 40 percent were migrants from other urbanareas. Twenty percent of the urban population grew up inrural areas.
There was no meaningful difference in the migration statusof the urban population by race. In rural areas, however,
..1 o4
there were wide differences betwhistory. Nearly three-fourths ofareas were nonmigrants, comparewhites. Nearly a fourth of the rorigin, whereas just a tenth of thdifferences reflect the fact that,back-and-forth movement betweeamong white people, the movemformly one-directional, from rum

E-FIFTH OF URBAN POPULATION CAME FROM RURAL AREAS
he urban population 14grantspeople who had'rorn their current resi-ants from other urbanopulation grew up in
in the migration statusural areas, however,
there were wide differences between the races in migrationhistory. Nearly three-fourths of the Negroes living in ruralareas were nonmigrants, compared with less than half thewhites. Nearly a fourth of the rural whites were of urbanorigin, whereas just a tenth of the Negroes were. Thesedifferences reflect the fact that, although there is muchback-and-forth movement between urban and rural areasamong white people, the movement of Negroes is more uni-formly one-directional, from rural to urban.
it

MIGRATION STATUS AND RACE OF U
RURAL POPULATION, 196
URBAN POPULATION RURAL
(J1t1ANRURAL TO URBAN MIGRANTS
80
60
AO
20
.00AN.To. uRBAN MIGRANTS *......
41 46
f/froogr.
NONMI
L A
.DOO
RURAL T:RURAL
hiIPRANT
WHITE NEGRO WHITA POPULATION 14 YEARS OLD AND OVER BY 1967 RESIDENCE AND RESIDE* MIGRANTS ARE PERSONS WHO HAVE EVER LIVED MORE THAN 50 MILES F
DATA FROM THE 1967 SURVEY OF ECONOMIC OPPORTUNITY.
U.S. DEPARTMENT OF AGRICULTURE UNIVERSITY OF GEORGIA NEG. ERS 7099-
13

RATION STATUS AND RACE OF URBAN AND
RURAL POPULATION, 1967
3AN POPULATION RURAL POPULATION
TO URBAN MIGRANTS
9\
iN To. URBAN MI6RANTS*
. .
NONMIGRA,72
.
.
41 1:\ Vo
46
IITE
FURBAN TO RURAL MIGRANTS;,,
11'
247
:RURAL TO:.RURAL
:MIPI.tAr4.M*
.17
.......
NEGRO WHITE NEGRO1 14 YEARS OLD AND OVER BY 196 7 RESIDENCE AND RESIDENCE AT AGE 16 OR EARLIER.R E PERSONS WHO HAVE EVER LIVED MORE THAN 50 MILES FROM THEIR 1967 ADDRESS.THE 1967 SURVEY OF ECONOMIC OPPORTUNITY.
[CULTURE UNIVERSITY OF GEORGIA NEG. ERS 7099- 70 (9) ECONOMIC RESEARCH SERVICE
14

OUTMIGRATION RATE CONTINUES HIGH
In 1970, an average of 9.7 million persons lived on farms inrural areas of the United States. Of the more than 203 millionpeople in the Nation, only 4.8 percent, or about 1 person in 20,had a farm residence. In 1920, there were 32.0 million farmpeople, and they comprised nearly a third of the total population.
The continued decline in the farm population has been causedmainly by the drop in farm employment and the resulting heavy
May 10, 1972 1970 .Census Farm - Nonfarm Data
The continuing program of 1970 census
1970 Census Users Bulletin Not_2 the Census has shown that a misclassion farm - nonfarza residence published
the Fourth Count summary tapes. Affe
are the statistics on rural farm andseries PC(1)-C State reports and theand rural nonfarm housing units in thwell as comparable statistics repc5rteing files. of Fourth Count summary tap
limited to the farm - nonfarm compone
the components. Therefore, the populthe rural areas as a whole are not afurban areas and the State as a whole.
movement of persons thas diminished in size,in the rate of outmovea net loss from the fareach year.
156
Corrected State rural farm and rural
and housing unit counts only) are nowtotals for all States will be presentUsers Bulletin, and those for countie
summer.

OUTMIGHATION RATE CONTINUES HIGH
n persons lived on farms inthe more than 203 millioncent, or about 1 person in 20,re were 32.0 million farma third of the total population.
m population has been causedTnent and the resulting heavy
movement of persons to nonfarm areas. As the farm populationhas diminished in size, there has been no evidence of a slackeningin the rate of outmovement. Since mid century, there has beena net loss from the farm population of more than 5 percenteach year.
(For details, see table 2.)
1970 .Censu.s Farm - Nonfarm Data
The continuing program of 1970 census data review at the Bureau of
No. 3 the Census has shown that a misclassification exists in .the statistics
on farm - nonfarm residence published in two series of reports and on
the Fourth Count summary tapes. Affected by this misclassification
are the statistics on rural farm and rural nonfarm population in the
series PC(1)-C State reports and the statistics on occupied rural farm
and rural nonfarm housing units in the series HC(1)-B State reports, as
well as comparable statistics reported in both the population and hous-
ing files of Fourth Count summary tapes. The misclassification is
limited to the farm - nonfarm components and is compensating between
the components. Therefore, the population and housing unit figures for
the rural areas as a whole are not affected, nor are the figures for
urban areas and the State aa a whole.
Corrected State rural farm and rural non-farm totals (total population
and housing unit counts only) are now being prepared. These corrected
totals for all States will be presented as soon as possible in a Census
Users Bulletin, and those for counties will be available later in the
summer.ack

11
-0::
IV*** ::::....:,
. :
.10.0.40.0.44'....
.40 4:
4
O.. I
0:41:40:40:40
::*0**
:*****.
.::.:.:.:::::::::
:.:.:::::::::...
4$555:.*.:.:.:.:..:.:::::::.:
:::0:40:0;;41
5.4i0 *to*. *4,0''.:t.15140.*


NONFARM NONMETRO GROWTH RATE EXCEEDS NATI
From 1960 to 1970, the nonmetropolitan counties of thecountry grew in population by 6.7 percent, while the metrocounties were gaining by 16.6 percent. Since the rates of naturalincrease in these areas are rather similar, it is clear that the non-metro areas were unable to retain all their potential growthand exported a sizable number of people to the metro areas . . .
a net of about 2.4 million outmigrants.
If the farm population, with its pronounced downward trend,
8
is subtracted from thefinds that the nonfarnthe great majority ofin the 1960's. This isnational average, butdecline of farm populgyowth of the nonfaripopulation.
May10, 1972 1970 Census Farm - Nonfarm Data
The continuing program of 1970 census
the Census has rhown that a misclassi
on farm - nonfarm residence publishe
the Fburth Count smumary tapes. Affe
are the statistics on rural farm and
series PC(1)-C State reports and the
and rural nonfarm housing units in t
'Jell as comparable statistics repdrt
ing files of Fourth Count summary ta
limited to the farm - nonfarm compon
the components. Therefore, the popu
the rural areas as a whole are not
urban areas and the State as a whole
1970 Census Users Bulletin No. 3
is
Corrected State rural farm and rural
and housing unit counts only) are no
totals for all States will be presen
Users Bulletin, and those for counti
summer.

NONFARM NONMETRO GROWTH RATE EXCEEDS NATIONAL AVERAGE
nmetropolitan counties of thev 6.7 percent, while the metropercent. Since the rates of naturaler similar, it is clear that the non-tain all their potential growthr of people to the metro areas . . .
tmigrants.
h its pronounced downward trend,
is subtracted from the total nonmetro population, then onefinds that the nonfarm nonmetro population-which comprisesthe great majority of all nonmetro people-rose by 19 percentin the 1960's. This is a rate of growth exceeding not only thenational average, but even the metropolitan average. The heavydecline of farm population has tended to mask the rapidgrowth of the nonfarm segment of the rural and small citypopulation.
1970 Census Farm - Nonfarm Data
The continuing program of 1970 census data review at the Bureau of
etin No. 3 the Census has rhown that a misclassification exists in the statistics
on farm - nonfarm residence published in two series of reports and on
the Fburth Count summary tapes. Affected by this misclassification
are the statistics on rural farm and rural nonfarm population in the
series PC(1)-0 State reports and the statistics on occupied rural farm
and rural nonfarm housing units in the series 110(1)-B State reports, as,
well as comparable statistics reported in both the population and hous-
ing files of Fourth Count summary tapes. The misclassification is
limited to the farm - nonfarm components and is compensating between
the components. Therefore, the population and housing unit figures for
the rural areas as a whole are not affected, nor are the figures for
urban areas and the State as a whole.
Corrected State rural farm and rural non-farm totals (total population
and housing unit counts only) are now being prepared. These corrected
totals for all States will be presented as soon as possible in a Census
Users Bulletin, and those for counties will be available later in the
summer.

%,CHANGE
20
10
o
_ -10
20
-30
POPULATION CHANGE, 1960.
US. TOTAL TOTAL METRO
1 b 6 TOT AL13.3
NONMET
U.S. DEPARTMENT OF AGRICULTURE

POPULATION CHANGE, 1960-70
TAL TOTAL METRO
TOTALNONMET
NONMETRO NONFARII\A193
NONMETRO FARM
RE
3 6.NEG. ERS 8491-71(10) ECONOMIC RESEARCH SERVICE
9
. . 22

SOME PLACES GROWING RAPIDLY IN NONMETROPOLITAN AMERIC
In the 1960's, about 200 nonmetro towns of 10,000 to50,000 population grew by 15 percent or more; that is, at arate clearly above the national average of 13 percent, thusimplying net inmigration. About half of these places are
located in the South. Two featureof them are the presence of a Stattheir location on an interstate high
May 10, 1972 1970 Census Farm - Nonfarm Data
The continuing program of 1970 census data revie
1970 Census Users Bulletin No. 3 the Census has shown that a misclassification exon farm - nonfarm residence published in two serthe Fourth Count summary tapes. Affected by thiare the statistics on rural farm and rural nonfaseries P0(1)-C State reportt and the statisticsand rural nonfarm housing units in the series HCwell as comparable statistics repdrted in both ting files of Fourth Count summary tapes. The milimited to the farm - nonfarm components and isthe components. Therefore, the population and 11the rural areas as a whole are not affected, norurban areas and the State as a whole.
Corrected State rural farm and rural non-farm toand housing unit counts only) are now being preptotals for all States will be presented as soonUsers Bulletin, and those for counties will be a
summer.
10

SOME PLACES GROWING RAPIDLY IN NONMETROPOLITAN AMERICA
metro towns of 10,000 toiercent or more; that is, at aiverage of 13 percent, thust half of these places are
.n No. 3
located in the South. Two features that characterize manyof them are the presence of a State college or university andtheir location on an interstate highway.
1970 Census Farm - Nonfarm Data
The continuing program of 1970 census data review at the Bureau of
the Census has shown that a misclassification exists in the statistics
on farm - nonfarm residence published in two series of reports and on
the Fourth Count summary tapes. Affected by this misclassificationare the statistics on rural farm and rural nonfarm population in the
series PC(1)-C State reports and the statistics on occupied rural farmarid rural nonfarm housing units in the series HC(1)-B State reports, aswell as comparable statistics repdrted in both the population and hous-ing files of Fourth Count summary tapes. The misclassification is
limited to the farm - nonfarm components and is compensating betweenthe components. Therefore, the population and housing unit figures forthe rural areas as a whole are not affected, nor are the figures for-urban areas and the State as a whole.
Corrected State rural farm and rural non-farm totals (total populationand housing unit counts only) are now being prepared. These corrected
totals for all States will be presented as soon as possible in a Census
Users Bulletin, and those for counties will be available later in the
summer.

-50,000 PE °LER MORE POPULATION GROWTH FROM 19
LOCATION OF NONMETRO TOWNS 0 100
*at*,
p 0
of,D
HAWAII.......)IN IONA
1.11A11010
t
,02.04'.-
ALASKA1110 TIO MO JI
11.110/07M
- //I
-2,;
-_ .
.
COUNTIES CON-7AININGNONMETROPOLITAN TOWNSOF 10,000, 50,000 POPULATIOTHAT GREW BY 15 PERCENTOR MORE, 1960 1970.
NEG. ERS B
U.S. DEPARTMENT OP AGRICULTURE ECONOMIC RESEARCDom.," MO.

ETRO TOWNS 0 100 0-50,000 PE L TH A HAD 15 PERCENTMORE POPULATION GROWTH FROM 1960-70
IN COUNTIES CONTAININGNONMETROPOLIT AN TOWNSOF 10,000.. 50,000 POPULATIONTHAT GREW BY 15 PERCENTOR MORE, 1950- 1970.
NEG. ERS 857 4. 710U.S. DEPARTMENT OF AGRICULTURE ECONOMIC RESEARCH SERVICE
1. I 101100
Kok.)
11
;

MANY COUNTIES GREW AFTER EARLIER POPULATION LOSS
During the 1960's, some counties showed: (1) decidedly im-proved population retention; (2) a deterioration in their abilityto hold people; or (3) a continuation of their previous growthpatterns.
The darkly shaded counties shown in the accompanying mapare those which had inadequate population retention abilityin the 1950's but improved ability in the 1960's. In nearly 500
of these counties, the extent of the 1960-70 population growth
7I 2
was dramatic enough to cause a s.gain. This occurred mostly in theparticular, there has been a remaof northern and western Arkansawhere outmigration was very sevThe lower Tennessee Valley wasunimpressive socioeconomic statof population growth in the 196

ANY COUNTIES GREW AFTER EARLIER POPULATION LOSS
showed: (1) decidedly im-eterioration in their abilityn of their previous growth
n in the accompanying mapulation retention abilityn the 1960's. In nearly SOO1960-70 population growth
was dramatic enough to cause a shift from population loss togain. This occurred mostly in the upland parts of the South. Inparticular, there has been a remarkable recovery in a large area
of northern and western Arkansas and eastern Oklahoma,where outmigration was very severe in the preceding 20 years.The lower Tennessee Valley was another. area of previouslyunimpressive socioeconomic status that moved to a position
of population growth in the 1960's.
ks

COUNTIES WITH POPULATION GROWTH IN THE 19601LOSS IN THE 1950'S
%.011_10 Ices_orel.an...ammo)
Source: 1960 and 1970 Census of Population
U S DEPARTMENT OF AGRICULTURE NEG. ERS 8493-71(10) ECONOMIC RESE

H POPULATION GROWTH IN THE 1960'S AFTERLOSS IN THE 1950'S
Source: 1960 and 1970 Census of Population
100 >03 300 4. K.
Ii S DEPARTMENT OF AGRICULTURE NEG. ERS 8493-71(10) ECONOMIC RESEARCH SERVIrEt":117::"'"
30 1 3

OTHER COUNTIES HAD DECLINING POPULATION RETENTION
The darkly shaded counties are ihose of inadequate anddeclining population retention ability. Almost 300 of thesecounties lost population in the 1960's after having gained inthe 1950's. There were seven contiguous States, stretching
1 4
from Idaho through the Northern PlaiIowa, in which a majority of all countor decline and a deteriorating ability t

R COUNTIES HAD DECLINING POPULATION RETENTION
se of inadequate andAlmost 300 of theseafter having gained inus States, stretching
from Idaho through the Northern Plains to Minnesota and
Iowa, in which a majority of all counties had net outmigrationor decline and a deteriorating ability to retain population.
. 412

COUNTIES WITH POPULATION LOSS IN TIIE 1960SGROWTH IN THE 1950'S
33
Source: 1960 and 1970 Census of Population
U S DEPARTMENT OF AGRICULTURENEG. ERS 84947ECONOMIC RES

.11
VI
, I II I__..1hi -,.-. ... 1-
.1-,.71- I
...s.., ..,
I', I. I I iC. I .-1....v.i 1" limrI I, . .... I'III, ,I i C'sfs,N, I, -".1.'\, . 0 I
I I Ii
.:2'ii I .1 III . . ',I,\ ' I.-, I I
,.1,,,71.1"I !.1.;1:11-.;I f,,,. / 1
I N 1 \ ,..... ........ :: 1 1.1 1
11.11:\ .1 ';'.1/,, ;/ 11_. '1.1.1.1./.2:/?Rct.:1-,-
11.,., 1,..: .(ti. t ....z.,.. 1 .._ ,1 . ,
1
:I II t ,I , i

MIGRANTS HEAD FOR SEA AND SUNSHINE
The net migration picture of the 1960's shows the heaviestin-migration was to coastal and retirement-recreation areas.Nevada led the other States by a wide margin, I laving 50percent net in-migration for the decade. Florida had a sub-stantial 27 percent; Arizona 17 percent; California, Colorado,Maryland, and New Hampshire 11 to 13 percent.
1 6
Heavy losers through net outmigratiWyoming, New Mexico, Mississippi, and12-to 15-percent losses. States with outcent or less were widely scattered fromthe Southeast to the Mountain States.

;RANTS HEAD FOR SEA AND SUNSHINE
shows the heaviest-recreation areas.gin, having 50lorida had a sub-a lifornia, Colorado,ercent.
Heavy losers through net outmigration were the Dakotas,Wyoming, New Mexico, Mississippi, and West Virginia, with12-to 15-percent losses. States with outmigration of 10 per-cent or less were widely scattered from New Eng lalid andthe Southeast to the Mountain States.
(For details, see table 3.)
. 36

'4
o o-
0 e:**4 oP:***
4kw
s..0
0 1...S44,_,y4
V..4
..-04 ...4
evW4
'40'
0 4**A
to. + V
.44,4
k4
4*******4
.4. *44. ***V
.V.%
a*******..
....
P44.166
c-0,46.4
le".4
riii-, ..: ' '': .: 14 :;)
4 4P4 44 4-
Clo
_- 4-*
\i .4 i W
A . *A
AA
k .1 1*
V ,
"--0 eve0 Va
6,1,14Q%
1A4 )4 4 )A
.,7 =
'4V L
_0-4
....,4$!.
"0.4r---*4......v..**44.4 SW
A4%
*********4
;!Ii..:...11;!1244."1.4, it a..-f44.
OA
44***********t i.0. ;F4; ;;;:* : ;;;;
N.........v
'4- . . ,.g*4*****.4*.44.,.....4
.1

1W, - I
4to
,
Mb
W
4.
4 P **
4''
iw--
.47
-
...,..
--..
...-.
..-.
0-...
.. -,
,....,
I..
'P
' 4 :
Iff
, .t.,
-*-4
11. .
4'"
vwee
...
,-,
,"4
..&44
vv.w
ww
- . .
.. . o
.,,
1
)1)1
)i1
v"...
&**.***
'**
***
' &W
A4*
****
044
&W
.*. i 4 _,..., 4- 4 -
-4
0V
W-4
0We.
47 il
tar.
"..1
'A'0.
0441
-,
4 ' 4
LO
Pi.
.....4
.0,,.
,
,.....
.H...
......
......
.,..
......
....,
. ..
- . 4 . ........\1
6,..x
.x.4
( ,..
.1
w,-
.....
vi,
......
:..v.
. ,,
(14 V
/ . 4
tz 4
+:4
4444
4 4
'''1 4 4 4 I --,4
.;;:1
44-
1P..,., P . ' 4 4
1
." ;;
;
4
' "We
.... ,. 404
1*4
.4 ..
. 4_
" '
- , ,\
.401
, r4r
4-P.
-.4
t, ...1
I r.
:$ ::
:::"
7,tip, 4.4
41i s
, ! 1
i %
V.,.
44%
%V
*.
44.
:44. ",
:S-4
4- I?A
\`4
4.+
.4 V
.\,..
.v.*
****
***
,, r
11M
V

GAP IN NONMETROPOLITAN PERSONAL INCOME NOT YET
Income per capita in the nonmetropolitan areas of the Nationhas been rising at an average rate of 7.4 percent per year duringthe past four decades. This is a little faster than the 5.9-percentper year gain in metropolitan areas. Total income growth isabout the same in metro and nonmetro areas, but the fastergrowth in per capita incomes in the more rural areas is explainedby continued outmigration. That is, rural areas had about thesame growth in incomes, but a slower growth in population, re-sulting in a more rapid gain in per capita income.
..18
;.1
While income per capita hitan areas than metropolitanenough to close the incomenonmetropolitan areas averathat received in metropolitaincomes had risen to $2,614further and the gap had widper year increase in rural incwould have been necessary t

IN NONMETROPOLITAN PERSONAL INCOME NOT YET CLOSED
etropolitan areas of the Nationof 7.4 percent per year during
little faster than the 5.9-percentas. Total income growth is
nmetro areas, but the fasterthe more rural areas is explainedt is, rural areas had about thelower growth in population, re-er capita income.
While income per capita has been risihg faster in nonmetropol-itan areas than metropolitan areas, it has not been rising fastenough to close the income gap. In 1929, per capita income innonmetropolitan areas averaged $402. This was $528 less thanthat received in metropolitan areas. By 1968, when nonmetroincomes had risen to $2,614, metro incomes had risen evenfurther and the gap had widened to $1,197. An 8.5-percentper year increase in rural income, instead of just 7.4 percent,would have been necessary to close the income gap.
(For details, see table 4.)
40

$ THOUS.
4
PER CAPITA PERSONAL INCOME
BY METROPOLITAN RESIDENCE
1
01929
J
/METRO
/NONMETRO
1940 1950 1960DATA FROM SURVEY OF CURRENT BUSINESS.U.S. DEPARTMENT OF AGRICULTURE NEG. ERS 8214 -71 (3) ECONOIV
41

I CAPITA PERSONAL INCOME
' METROPOLITAN RESIDENCE
METRO
NONMETRO
19403USINESS.
1950 1960 1970NEG. ERS 8214 -71 (3) ECONOMIC RESEARCH SERVICE

NONMETRO AREAS DEPEND MORE ON LOW-PAYING INDU
Nonmetropolitan areas resemble metropolitan areas in industrial
sources of personal income, but rural areas depend more on low-
paying industries.
Agriculture is an important source of income in nonmetropoli-tan areas, with farming comprising more than 10 percent of total
personal income. Nevertheless, manufacturing is the most impor-
43
2 0
tant industrial source of inareas, although more of thpolitan areas. In additionnonmetro ones in their sh
struction, transportation,insurance, and various sellareas depend more heavily

aRo AREAS DEPEND MORE
politan areas in industrialdepend more on low-
ncome in nonmetropoli-than 10 percent of totaliring is the most impor-
ON LOW-PAYING INDUSTRIES
tant industrial source of income m both metro and nonmetro
areas, although more of the manufacturing is located in metro-
politan areas. In addition to manufacturing, metro areas exceednonmetro ones in their shares of personal income from con-struction, transportation, wholesale and retail trade, finance andinsurance, and various services. On the other hand, nonmetroareas depend more heavily on earnings from government services.
(For details, see table 5.)
- 44

EARNINGS BY INDUSTRIAL SOURCES WI1968
16.0%
15.5%
NIIMmo
17.1%
6.0%
7.4%
30.2%
6.1%
Government
Services
..Wholesale and Retail Trade
Finance, Ins. and Real Estate. ...Transportation,
Communicationsand Public Utilities
/OEMs aManalo MEMOS
WAWA
Manufacturing
WOW*WOW.
faggi.
VOW.
1101111011,
ConstcuctionFarming,Mining, Forestry
d Fisherianes
$420.0 BILLIONSMETRO NO
DATA FROM SURVEY OF CURRENT BUSINESS.
U.S. DEPARTMENT OF AGRICULTURE NEG. ERS 8216 - 71 (3)

BY INDUSTRIAL SOURCES WHERE EARNED,1968
16.0%Government 20.3%
15.5%
gamma, alma. 01121111 1111.11. WA Ramat 111 OMNI.
Services
1111110 IMMO
11.7%
2.7%
17.1%
OWNED 4111111D
Wholesale and Retail Trade
MEMO wININIP OWN&
14.4%
6.0%MOWN.. 0111111. MIMI" =MO 1101Finance, Ins. and Real Estateatom a.. Er.
ismormi
5.3%7.4%
a
26.7%
ansportatvon. communicat...00res
mom. 11111101
Manufacturing30.2%
ONO, 5.5%
01110.16
4.111. Anis
ConstructionF at ming, Mining. Forests-II
and F isheries13.4%6.1%
$420.0METRO
URRENT BUSINESS.
ICULTURE
BILLIONS $128.7NONMETRO
NEG. ERS d216 - 71 i3) ECONOMIC RESEARCH SERVICE
46 2 1
RURAL AREAS ARE GAINING JOBS
The rate of gain in nonfarm wage and salary employmentfrom 1960 to 1970 was somewhat greater in rural and othernonmetropolitan counties than in metropolitan areas.
In manufacturing, the annual rate of nonmetro gain wasnearly three times that in the metro areas. Construction jobsand employment in finance, insurance, and real estate alsoincreased more rapidly beyond the big cities and their suburbs.
2 2 47
Rates of gain of mote thannonmetro employment in thement were moderately under rpolitan areas.
Rural and partly rural communthe manufacturing jobs in 1960, aof the gain in manufacturing wor

RURAL AREAS ARE GAINING JOBS
salary employmentr in rural and otherolitan areas.
onmetro gain wass. Construction jobsId real estate also:tics and their suburbs.
Rates of gain of more than 5 0 percent per year innonmetro employment in the smice industries and govern-ment wcrc moderately undcr tees nf increase in metro-politan areas.
Rural and partly rural communities, with only a tenth ofthe manufacturing jobs in 1960, accounted for about a fifthof the gain in manufacturing workers in the 1960-70 decade.

EMPLOYMENT GAINS FOR INDUSTRY GROUPS BY
METRO-NONMETRO LOCATION, 1960-70
Manufacturing
Contract-construction
Transportation-communications-utilities
Trade
finance-insuronce-realestate
Setrice
Gc,vernment
Total Percent
METROPOLITAN STATUS AS Of 1961
Metre
Nannette
60
SOIJACE EPS 1:IA07'A Timis of LIS DEPA RTAIE Mr OF t APOP - STATE I AWL orsTI#T MOO ITV AGE *CV EST ISM TES
US DEPADTVE 'YT Of .41:!?0.111-UNE 'EG ENS 8217 -711P ECONOMIC RESEA RCN SERVICE
49

RURAL AREAS COULD USE MORE "FAST-GROWING" NONFARM
In the 1960-70 decade, nonmetropolitan America added 3.4million new workers, or 17 percent more employed in 1970 thanin 1960. This represented an increase from 19.9 million workers to23.3 million. During the same period, however, metro areas in-creased their number of workers from 46.2 million to 58.5 million,a 27-percent change. The trend for the United States was a rise of24 percent.
Nonmetropolitan areas had a higher percentage change inmanufacturing employment from 1960 to 1970 than did metroareas (31 percent nonmetro,compaled with 12 percent metro).In construction, the figures were 46 percent change for nonmetroareas and 29 percent for metro. Finance, insurance, and real es-tate was the only group in the service sector that grew faster innonmetro than metro areas. In "fast-growing industries," such asgovernment, service, and trade, metro areas outpaced nonmetroin employment gains.
Despite this favorable nonmetro competition in employment,an important factor in the continuing metro-nonmetro income
2 4 SO
gap is revealed by the coareas. Although manufaLareas, "fast-growing inchgrowth rate of 23.8 pert..metro areas in the 1960'a notably higher growthstruction. The nonmetrclargely accounted for b'arcas. The continued dcmetro areas further ern !between metro and non
The most promising siareas is new nonfarm emsocial and economic infrand new business to nonemployment will be in purban environments. Sosmaller urban centers wipoor and the displaced L

%I AREAS COULD USE MORE "FAST-GROWING" NONFARM INDUSTRIES
imetropolitan America added 3.4rcent more employed in 1970 thanicrease from 19.9 million workers toperiod, however, metro areas in-rs from 46.2 million to 58.5 million,1 fo; the United States was a rise of
a higher percentage change inrom 1960 to 1970 than did metroompared with 12 percent metro).vre 46 percent change for nonmetroro. Finance, insurance, and teal es-
service sector that grew faster inn "fast-growing industries," such ase, metro areas outpaced nonmetro
metro competition in employment,,ntinuing metro-nonmetro income
gap is revealed by the comparative industrial mix in the twoareas. Altliough manufacturing has a significant role in both
areas, "fast-growing industries" (exceeding the overall nationalgrowth rate of 23.8 percent) grew faster in metro than non-metro areas in the 1960's. The only fast-growing industry witha notably higher growth rate in nonmetro areas was con-struction. The nonmetro lag in employment and income islargely accounted for by the industrial mix which favors metroareas. The continued decline in agricultural employment in non-metro areas further emphasizes the unfavorable industrial mixbetween metro and nonmetro areas.
The most promising source of development for many ruralareas is new nonfarm employment supported by the necessarysocial and economic infrastructure that will attract new residentsand new business to nonmetropolitan regions. Much of thisemployment will be in plants that are most efficient in relativelyurban environments. So new job creation needs to be in or nearsmaller urban centers within commuting distance of the ruralpoor and the displaced farmers.
5-1

Employment, by industry, United Slates, metropolitan areas, and nonmetropolitan areas, March 1960 and March 19701(Numbers In millions1
United States MetruPoillan " Nonmetropolltan
IndustryMirth
MO
Change 1960-70March
1970
Change 1980-70March
1970
Change 1960-70MardiMarch
19110 Number Percent'Men*
1900 Number Percent ' 1960 Number Percent 9
Total 81.8 Oil 15.7 24 58.5 41 2 12.3 77 213 119 34 17
Pao! growing Industries, total I 41.6 31.4 14.0 44 363 217 167 41 11.3 7.9 3.4 42
Government w.,Te and salary employmentService miscellaneous wage and misty employment
11 911.2
& 47. 1
4.44.1
53so
385.8
& 715
& I3.3
so59
4.11 4
2.71.6
1.3.6
soat
Trade wage and salary employment 14.7 11.0 37 33 11.2 5.4 2.9 34 3.5 2.7 .6 aoFinance, Insurance, and real estate wage and eatery
sitItzneloyment 3.6 2. 6 1.0 39 & 1 2.2 .8 so .6 .4 .2 ation wage and misty employment 3.2 24 .8 33 2. 4 1.9 .5 29 .6 .6 .3 so
Other Industries, total_ 36 1 34.4 I. 7 5 24.2 215 1.7 8 12.0 12.0 () (7)
Manufacturing wen and salary employment 19.7 16.9 2.8 17 14.4 12.9 1.6 12 5.3 4.0 1.3 SITransportation, communication, and utilities wage and
salary employment 4. 4 4.0 .1 12 3.1 3.1 .4 14 1.0 .9 .1 8Mining woes snd salary employment .6 .7 -.1 -11 .2 .2 -3 .4 .5 -.1 -15Nonagricultural employment me.e..1 & 0 & 2 -.2 -3 5.2 4.3 -9 -2 2.8 2.9 -.1 -4Agriculture 9 3.3 4.6 -1.4 -79 .8 1.0 -.2 -24 2.5 3.6 -1.1 -31
I Based on establishment reports.I Workers are classified according to their place of employment rather than place of
residence.Substantielly, this includes employment In all Standard Metropolitsn Statistical
Areas as defined by the Bustin of the Budget Ian. 16, 1946. In a few instances, laborareas delineated try State employment security agencies do not coincide With BMA's.In these instances, tbe ES delineations apply.
Computed (rom unfounded ftmn.Indnstrfes in which mnonwl& employment Increased by a g" iter percentage than
the overall average of 22.8 percent.Lee than so,cao workets.
52
Leo than 03 pueent.'Nemgricu1tundemt not elsewhere classified In this table. This Includes the
sc4f-employed, private d workers, and unpaid family trotters.9 If1(1114ES the self-employed, unpaid family workers, and wage and salary workers In
`agriculture.Nora: Due to rounding, figures may not add to totals.Source: Unpublished data prepared by Claude C. Eaten, Economic Developmmt
Division, Economic Rewaseh *Moe, U.S. wtment of Atriennuts, based primerityon data supplied try State employment saner/ Muck& Enrol MIIIP_o_wer Deoel0P-ments, Manpower Administration, U.S. Department of lAbor, Much p. 11.

workcrs in thc same oworkcrs were especiailmetro areas.
MEDIAN EARNINGS HIGHER IN METRO THAN NONMETRO A
Median earnings in 1969 in metropolitan areas wereconsiderably higher than in nonmetro locations.Differences were even sharper between male and female
2 6

MEDIAN EARNINGS HIGHER IN METRO THAN NONMETRO AREAS
in metropolitan areas werenon metro locations.er between male and female
workers in the same occupation groups. Among women, serviceworkcrs were especially disadvantaged in both metro and non-metro areas.
(For details, see table 6.)
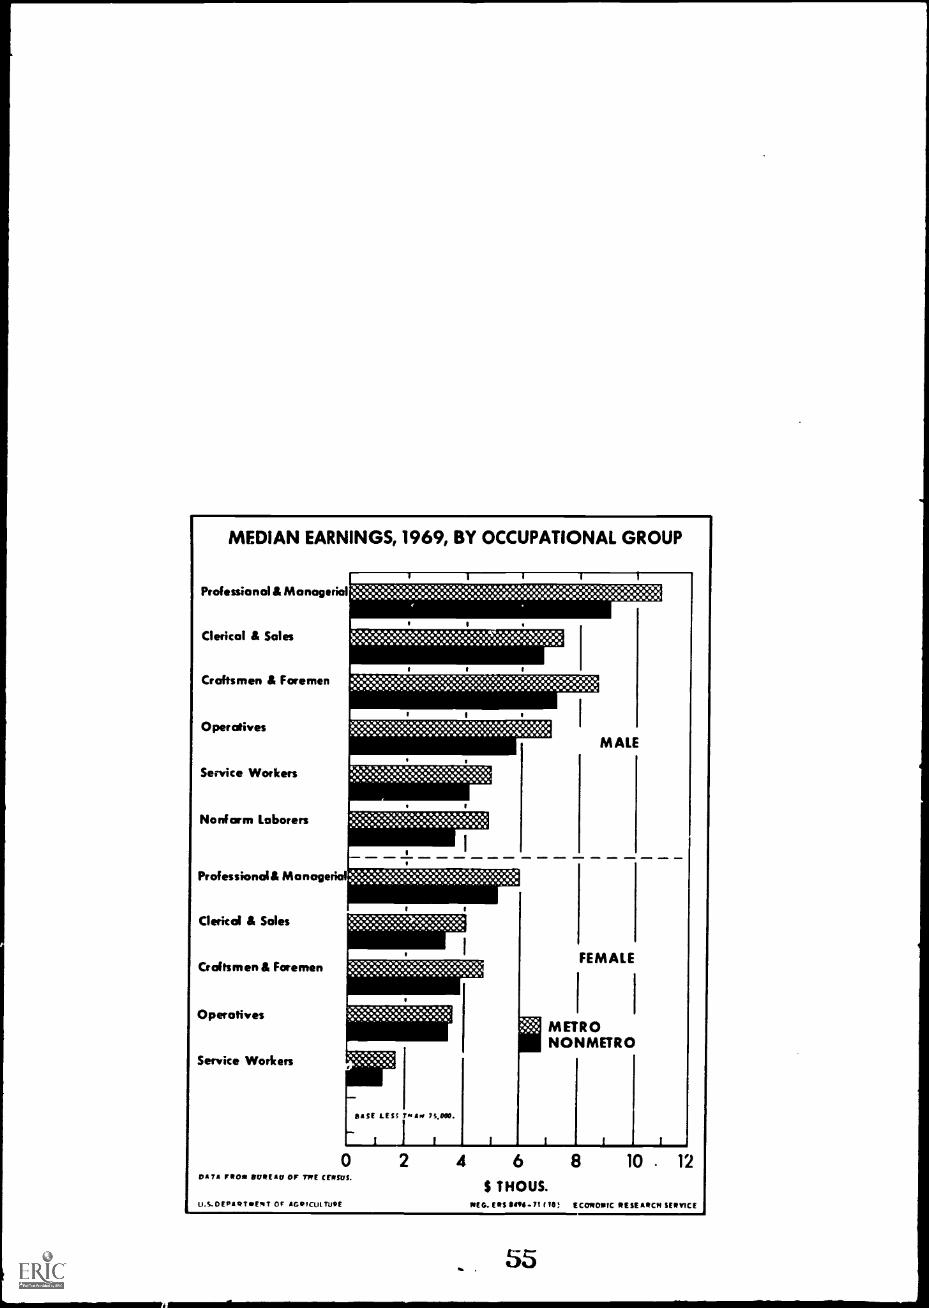
MEDIAN EARNINGS, 1969, BY OCCUPATIONAL GROUP
Professional &Managerial
Clerical & Sales
Craftsmen & Foremen
Operatives
Service Workers
Nonfarm Laborers
Professional& Managerial
Clerical & Soles
Craftsmen& Foremen
Operatives
Service Workers
MALE
-VVVYWANN.W.W.W...WWWW
',Ara rotor IMIIPEIW OF TINE CENSUS.
NNNN.W.
BASE LEV P.a r1 75000.
1
FEMALE
METRONONMETRO
2 4 6 8 10 . 12
$ THOUS.U.S.DEPAliterT OF sOPICuLtifq ERS 110111.7t TO; ECOROMIC RESEARCH SERVICE
55

NONMETRO AREAS STILL HAVE MUCH POVE
In 1969, 24.3 million persons in the United States had incomesbelow the poverty level, a decrease of 15.2 million over the pastdecade. The number of poor families declined 41 percent duringthe 10-year period between 1959 and 1969.
In 1969, 1 out of 10 families was poor. The proportion of theNation's population below the poverty level decreased to 12.2 per-cent. Ten years earlier, 1 out of 5 families was below the povertylevel, and 22.4 percent of the population was in poverty.
28 56
Over the past 10tion residing in mc51 percent, but thcresidents dropped t
While the proportan areas was abounonmetropolitan pcmore prevalent in rand West, it is mor

NONMETRO AREAS STILL HAVE MUCH POVERTY
lnited States had incomes3.2 million over the pastTlined 41 percent during)69.
)r. The proportion of theevel decreased to 12.2 per-ilies was below the povertyri wal. in poverty.
Over the past 10 years, the proportion of the poverty popula-tion residing in metropolitan areas increased from 44 percent to51 percent, but the incidence of poverty among metropolitanresidents dropped from 15 percent in 1959 to 10 percent in 1969.
While the proportion of the total poor living in nonmetropoli-tan areas was about 49 percent in 1969, 17 percent of thenonmetropolitan population was poor. In the South, poverty ismore prevalent in nonmetropolitan areas, whereas, in thc Northand West, it is more a metropolitan problem

INCIDENCE OF POVERTY BY METRO AND I
RESIDENCE, 1969 AND 1959
% IN POVERTY
30
20
10
METROPOLITANI
METF
1959
TOTAL
1
):44444.:
:*******.."4:."4MO: Pe; A1 8 44.11'Ave, ,e,44 :,.V, ,f,WA
CENTRALCITIES
SOURCE: U.S. DEPARTMENT OF COMMERCE.
U.S. DEPARTMENT OF AGRICULTURE
58
SUBURBANRINGS
NEG. ERS 8203 -71 (3) ECO

F POVERTY BY METRO AND NONMETRO
RESIDENCE, 1969 AND 1959
CENT.RAL SUBURBANCITIES RINGS
F COMMERCE.
59 29

SMALL FARMERS DEPEND ON OFF-FARM INCOME
In 1970, average income per farm operator family was aboutequally divided between net income from farming and off-farmincome.
Operators of the 223,000 farms in the largest sales class($40,000 and over) depended on off-farm sources for only
60
3 0
about 18 percent of their net
For about one million farr(less than $2,500), off-farm itotal net income.

4ALL FARMERS DEPEND ON OFF-FARM INCOME
or family was about about 18 percent of their net family income.arming and off-farm
rgest sales classources for only
For about one million farms in the smallest sales class(less than $2,500), off-farm income made up 88 percent oftotal net income.
(For details, see table 7.)

FARM AND OFF-FARM INCOME, 14
$ THOUS.
30
20
10
TOTAL INCOME
A-----mmsa OFF-FARM INCOME
FARM INCOME
All FARMS $40,000 $20,000 $10,000- $5,000- $2,500-
& OVER 39,999 19,999 9,999 4,999
FARMS WITH SALES
U.S.DEPARTMENT OF AGRICULTURE NEG. ERS 8497-71 (10) ECONOMIC
62

ID OFF-FARM INCOME, 1970
k1COME
OFF-FARM INCOME
FARM INCOME
DOO
V ER
$20,000 $ 10,000- $5,000- $2,500
39,999 19,999 9,999 4,999
FARMS WITH SALES
LESS TH A N
$2,500'
NEG. ERS 8497-71 (10) ECONOMIC RESEARCH SERVICE
. 63 31

RURAL HOUSING QUALITY KEEPS
In 1950, more than one-third of the housing in the UnitedStates was substandard. By 1970, this share was down to one-fourteentha decline in the numbe:. of substandard units in20 years from 15.2 million to 4.4 million units.
The greatest improvement occurred in nonmetro areas. Sub-standard housing units located outside metropolitan areas de-clined from 10.1 million occupied units in 1950 to 2.6 million
32
64
PACE WITH NATIONAL TRE
in 1970whereas in metro areasmillion in 1950 to about 1.8 mi
The decline in substandard hothe rise in family incomes. In 1families with incomes under $3,(million families lived in substandthere were 5.3.million families wi5.3 million families lived in subst:

11 HOUSING QUALITY KEEPS PACE WITH NATIONAL TRENDS
the housing in the Unitedhis share was down to one-,. of substandard units inni Ilion units.
rrcd in non metro areas. Sub-side metropolitan areas de-units in 1950 to 2.6 million
in 1970whereas in metro areas the number declined from 5million in 1950 to about 1.8 million in 1970.
The decline in substandard housing is closely correlated withthe rise in family incomes. In 1969, there were 2.5 millionfamilies with incomes under $3,000 in nonmetro areas, and 2.6million families lived in substandard housing in 1970. In 1959,there were 5.3.million families with incomes under $3,000, and5.3 million families lived in substandard housing in 1960.

OCCUPIED SUBSTANDARD HOUSING U
MILLION UNITS
15
10
15.2
1950 1960 19-)
* INCLUDES DILAPIDATED UNITS AND UNITS LACKING COMPLETE PLUMBING FACILITIES.
A ESTIMATED FROM CENSUS DATA.
U.S. DEPARTMENT OF AGRICULTURENEG. ERS 8213 - 71 (8) ECON.
66

950 1960 1970 °
ITS AND UNITS LACKINS COMPLETE PLUMBING FACILITIES.
ATA.
URE NEG. ERS 8213 - 71 (8) ECONOMIC RESEARCH SERVICE
673 3

METRO AND NONMETi1.0 COMMUNITIES SPEND MONEY ON SAME SER
Education stands out as the major function of local govern-ments in the United States. Per capita expenditures on educationare slightly lower outside metropolitan areas, as they are formost functions.
Per capita expenditures often are used as a rough indicator oflevels of service provided, although they must be used very cau-tiously for this purpose. The story they tell is a familiar one,
34 68
that metropolitan communitiescommunity services than nonm,ford. Furthermore, the gap ma%politan communities spent 86 p.metropolitan communities; in 1,as much.

0 ANP NONMETRO COMMUNITIES SPEND MONEY ON SAME SERVICES
lajor function of local govern-capita expenditures on education
nolitan areas, as they are for
are used as a rough indicator ofeh they must be used very cau-ory they tell is a familiar one,
that metropolitan communities provide somew '--. higher levels ofcommunity services than nonmetropolitan communities can af-ford. Furthermore, the gap may be widening. In 1957, nonmetro-politan communities spent 86 percent as much per capita asmetropolitan communities; in 1967, they spent only 74 percentas much.
(For details, see table 8.)

PER CAPITA EXPENDITURES OF LOCAL GC
FOR SELECTED SERVICES, 19661
DOLLARS
150
120
90
60
30
oEDUCATION HEALTH & POLICE
HOSPITALS PROTECTION
sbuRCE: U.S. CENSUS OF GOVERNMENTS.
U.S. DEPARTMENT OF AGRICULTURE
ROADS FIRE SArs
PROTECTION
NEG. ERS 8207 71 (8) i

rA EXPENDITURES OF LOCAL GOVERNMENTS
FOR SELECTED SERVICES, 1966-67
Metro-11,
lIiIllhIlIltI Nonmetro
ION HEALTH & POLICE
HOSPITALS PROTECTION
OF GOVERNMENTS.
AGRICULTURE
ROADS FIRE SANITATION
PROTECTION
WELFARE
NEG. ERS 8207 - 71 (8) ECONOMIC RESEARCH SERVICE
35

PROBLEM IN DELIVERING MEDICAL SERVICES TO RUR.1
But rural people fadcialist. We need to findproviding services of sris too sparse to keep tFiattract them.
Medicine today is an increasingly specialized field, and mostAmericans turn to specialists when they need help. Rural peoplehave about equal access to hospitals and general practitioners asdo metropolitan Americans, except in areas of extremely sparsepopulation.
36ts-.:If got
PROBLEM IN DELIVERING MEDICAL SERVICES TO RURAL AREAS
asingly specializcd field, and mostwhen they need help. Rural people
ospitals and general practitioners asexcept in areas of extremely sparse
But rural people face long hours of traveling to see a spe-cialist. We need to find new and more effective ways ofproviding services of specialists to areas where the populationis too sparse to keep them busy and incomes are too low toattract them.
- 73

PHYSICIANS AND HOSPITAL BEDS IN MI
NONMETRO AREAS, 1969NUMBER PER10,000 POPULATION
40
30
20
10
0
PHYSICIANS
Metro
Nonmetro
14.3OVA1:+:44W411
4041,4041114.41.4
2.5
11.8
1HO
TOTAL GENERAL SPECIALPRACTICE PRACTICE
SOURCE: AMERICAN MEDICAL ASSN., "DISTRIBUTION OF PHYSICIANS, HOSPITALS AND HOSPITAL 81
U.S. DEPARTMENT OF AGRICULTURE NEG. ERS 8209 -71 (3)

AND HOSPITAL BEDS IN METRO AND
ONMETRO AREAS, 1969
PHYSICIANS
ree44'AV-4
'HOSPITAL BEDS
MetroNonmetro
2.5 3'3ezzEl
11.8
GENERAL SPECIALPRACTICE PRACTICE
;SN., "DISTRIBUTION OF PHYSICIANS, HOSPITALS AND HOSPITAL BEDS IN THE U.S., 1969,- VOL 2
TOTAL
JRE NEG. ERS 8209 -71 (3) ECONOMIC RESEARCH SERVICE
75 37

DESPITE IMPROVEMENT, NONNIETRO AREAS LAG IN YEARS OF SCHOO
Levels of educational attainment have improved in both metroand nonmetro areas in recent years. In March 1970, amongnonmetro whites, the proportion who had completed high schoolwas two out of three (65.9 percent) for those aged 25 to 44years, compared with not quite two out of five (38.7 percent)of those 45 years of age or older.
Among Negoes, improvement has been relatively morerapid, but their education still lags far behind that of whites.
7 638
In nonmetropolitan areas, thripopulation 25 years old and cless, compared with three-fiftlmetro areas. Eighty-six percer45 years old and over had 8among those in the age grouphad attained only this level or(23.7 percent) were high scho

\MOVEMENT, NONMETRO AREAS LAG IN YEARS OF SCHOOLING
nt have improved in both metros. In March 1970, amongwho had completed high schoolt) for those aged 25 to 44
vo out of five (38.7 percent)
has been relatively mores far behind that of whites.
In nonmetropolitan areas, three-fourths of the Negro farmpopulation 25 years old and over had 8 years of schooling orless, compared with three-fifths of nonfarm and 36 percent inmetro areas. Eighty-six percent of the Negro farm population45 years old and cner had 8 years or less of schooling, and evenamong those in the age group 25 to 44 years, more than halfhad attained only this level of education. Less than one-fourth(23.7 percent) were high school graduates.
77

Educational attainment of persons 25 years and over, by color and residence,March 1970
Percent of population with-
8 Years of school or less 12 years of school or mere
Age and residence White Negro White Negro
Total 26. 1 43. 0 57. 4 33. 7
Metropolitan areas_ 22. 1 36. 0 61. 5 38. 8Nonmetropolitan areas 33. 2 60. 9 50. 0 20. 6
Nonfarm 31. 7 59. 1 51. 2 21. 6Farm 43. 1 74. 5 42. 0 11. 9
25 to 44 years 11. 8 22. 4 71. 6 47. 9Metropolitan areas 9. 4 18. 0 74. 7 52. 2Nonmetropolitan areas 16. 5 36. 3 05. 9 34. 2
Nonfarm 15. 9 34. 3 66. 2 35. 3Farm 21. 8 54. 1 62. 3 23. 7
45 years and over 36. 8 63. 1 46. 6 19. 9Metropolitan areas 32. 1 55. 7 51. 2 24. 2Nonmetropolitan areas 44. 9 78. 9 38. 7 10. 5
Nonfarm 43. 4 77. 9 40. 0 11. 3Farm 53. 5 86. 4 31. 9 4. 6
Source: Manpower Report of the President, Apri11971, p. l.

STATES ORGANIZING
Forty States have established at least tentative official planningand development districts. These districts are both metropolitanand nonmetropolitan. They are established by executive orderof the governor, by the legislature, or by local choice. Theyprovide the functional unit for planning and development,especially in areas where a metropolitan center is not the logicalfocus.
NONMETRO PLANNING DISTRICTS
The degree of progress in th,sub-State planning districts varally all States were scheduled t1such planning and developmeni
Although it is likely that thcadjustment and change, on thethat planning and developmentbuilding blocks for regional api

STATES ORGANIZING NONT*:',*
cast tentative official planninglistricts are both metropolitantablished by executive orderor by local choice. Theynning and development,olitan center is not the logical
;RD 'PLANNING DISTRICTS
The degree of progress in the development and use of officialsub-State planning districts varies, but at the current rate virtu-ally all States were scheduled to have designated and have in usesuch planning and development districts by the end of 1971.
Although it is likely that there will be considerable re-adjustment and change, on the basis of experience, it is likelythat planning and development districts will become the basicbuilding blocks for regional approaches in rural development.
So

I I I
cr%_s=in=
11
1
1)
Vip::**;-":1 wW0geld 012111.6.- '
=4Ele mocktizettia e=cs =46- -411-: &;;;;W
g--V.X.11grmatitwat.-;.E1=tim\,4. .7.409141,q -
g-1:110i1:5.t.'01 VE a's 5 gt444\\\\ visracm / 444`A. r;;;,.° \ \ \ \\ 0 s,
'ftifil-C:20" ID 18 thcs
--.1-e.,_-0 , sv s....-_,:,-_,--,,, Or4=-J.. --bCDICIC 'IL. 1:31:1 ="i1P---F121:1-4p''Vralo-g7.5Q-1X0100
14 0 4;'" ,,,,,,,,,, ;:
L'Otsgtf' 111P-a,
rev .\ \
f-_,trumisori Lea,.
41144.1
1,111_
tam
\ =Aram
4111
larftlret,
ttrai=ft r41114fillgamitbalealtalgan
. £.1Z.V1114[111lli
,-920m==tapE et I --IA t141-4V
14Crir-49,,v01440-"Arzi.p.4%*)rescit<ittap.
0 'VW4741:4

.
Il
IP-

Table 1.-Population of the United States by urban and rural residence, 1900-70
Year Total
Thou.
1900 76,2121910 92,2281920 106,0221930 123,2031940 132,165
New definition'1950 151,3261960 179,32319702 203,166
IUrban
IRural
Thou. Thou.
30,21542,06454,25369,16174,705
96,847125,269149,281
45,99750,16451,76854,04257,459
54,47954,05453,885
1 Under the current definition, the urban population Is comprised of all persons living inurbanized areas and in places of 2,500 inhabltants or more outside urbanized areas. Inprevious years, the urban population was comprised of all persons living In incorporatedplaces of 2,500 Inhabltants or more. In both definitions, the population not classified asurban constitutes the rural population.2 Preliminary.
Source: United States Censuses of Population, 1960 and 1970.
4 2
Table 2.-Farm population, 1920.70
Year Farm population(In thousands)
Percent of totalUS. population
1920 31,974 30.11925 31,190 27.01930 30,529 24.91935 32,161 25.31940 30,547 23.21945 24,420 17.51950 23,048 15.31955 19,078 11.61960 15,635 8.71965 12,363 6.41970 9,712 4.8
War83
Table 3.-Net4
New England 3.0
MaineNew Hampshire 11.:Vermont 3.7Massachusetts 1.4Rhode island 1.Con necticut .. 8.4
Middle Atlantic
New YorkNew JerseyPen n sylvan la
East Notth Central
OhioIndianaIllinoisMichiganWisconsin
West North Central
V
-0.Ek8.0
-0.4
-04-OA0.10.1
Minnesota -0.1Iowa -6.1Missouri (2)North DakotaSouth DakotaNebraska .. -5.2Kansas -6.1
South Atlantic 5.1
Delaware 8.!Maryland 12.4Dist. of Columbia -13./Viral n la 3.1
West VirginiaNorth Carolina 4..South CarolinaGeorgia 1.Florida 26.1
1 Net migration expressed as a percentage2 Less than .05 percent.
Source: Bureau of the census.

rban and rural residence, 1900-70
rban Rural
Thou. Thou.
30,215 45,99742,064 50,16454,253 51,76869,161 54,04274,705 57,459
96,847 54,47925,269 54,05449,281 53,885
on is comprised of ail persons living ins or more outside urbanized areas. Ined of all persons living In incorporatedtalons, the population not classified as
50 and 1970.
h, 192070
Percent of totalU.S. population
30.127.024.925.323.217.515.311.68.76.44.8
Table 3.-Net migration, 1960-70'
New England
MaineNew HampshireVermont ..MassachusettsRhode islandConnecticut
...
3.0
-7.311.33.71.41.18.4
East South Central
KentuckyTannins'sAlabamaMississippi
West South Central
...
-5.8
-5.0-1.3-7.1
-12.3
-0.3
Middle Atlantic (1) Arkansas -4.0Louisiana -4.1
New York -0.6 Oklahoma 0.6New Jersey 8.0 Texas 1.5
Pennsylvania -3.3Mountain .. 4.5
East North Central -0.4Montana -8.6
Ohio -1.3 Idaho.. -6.3Indiana .. -0.3 Wyoming -11.9Illinois .. -OA Colorado .. 12.3Michigan 0.3 New Mexico .. -13.6Wisconsin 0.1 Arizona 17.4
Utah -1.2West North Central -3.9 Nevada 50.4
m In nesota .... -0.7 Pacific ... 12.4Iowa -6.7Missouri (3) Washington . 8.7North Dakota -14.9 Oregon 9.0South Dakota -14.0 California 13.4Nebraska -5.2 Alaska 6.3
Kansas .. -6.1 Hawaii 1.6
South Atlantic 5.2
Delaware 8.5Maryland 12.4Dist. of Columbia -13.1Virginia 3.9West Virginia -14.2North Carolina -2.1South Carolina -6.2.Georgia 1.3Florida 26.8
Net migration expressed as a percentage of 1960 Population.2 Less than .05 percent.
Source: Bureau of the Census.
1
1

Table 4.-Per capita personal income by metropolitanstatus, United States, 1929.68
YearMetropolitan
countiesNonmetro-
Po Rancounties
192919401950195919621965196619671968
Dollars
928762
1,7452,4482,6583,0803,2963,5173,811
Dollars
402353
1,0881,6031,7912,0172,2812,4192,614
Source: Survey of Current Business, May 1970.
Table 5.-Earnings by Industrial sources where same!, metro and nonmetro, 1968(Dollars In millions)
Industry sector
Sources of earnings
Metro
Percent ofDollars total
Nonmetro
Percent ofDollars total
Manufacturing 126, 804 30. 2 34, 380 26. 7
Wholesale and retail trade 71, 696 17. 1 18, 502 14. 4
Government 87, 137 16. 0 26, 162 20. 3
Services 65, 021 15. 5 14, 993 11. 7
Construction_ 25, 711 6. 1 7, 101 5. 5
Transportation, communications,and public utilities 31, 036 7. 4 6, 827 5. 3
Finance, insurance, and realestate 25, 233 it 0 3, 501 2. 7
Farming, mining, forestry, andfisheries 6, 501 1. 7 16, 488 13. 4
Total 419, 982 100. 0 128, 661 100. 0
Source; Survey of Current Business, May 1970.
Table 6.-Methen earnings. 1989, by *cc,
Nonfarm occupationgroup and sex
Total
Male
Prof. and managerialClerical and salesCraftsmen and foremenOperativesService workersNonfarm laborers
Total
Female
Prof. and managerialClerical and salesCraftsmen and foremenOperativesService workers
Pvt. householdOther service
Nonfarm laborersTotal
.......
..
Dollars
10,3817,3378,1946,6264,5184,2697,653
5,7163,8384,3763,5401,477
5202,0632,6133,453
41114.
3 Base less than 75,000.Source: Social and Economic Characteristiin Metropolitan and Nonmetropolltan AreCurrent Population Reports, P. 23, No.Bureau of the Census, Table 17, p. 66.
Table 7.-Income per farm operator family Ivalue of sales classes, 191
Value of productssold
Realizednet farmincome
Off-farmincome In
All farms$40,000 and over20,000 - 39,999 .10,000 - 19,999 .5,000 9,9992,500 - 4,999Loss than 2,500
Dol. Dol.
5,37425,6649,9626,2083,4922,0491,059
5,833 1:5,803 3:3,5033,4524,9845,4657,954
Source: Farm Income Situation, FIS-218, E/Service, July 1971, Table 513.

by metropolitan2918
Nonmetro-Politan
counties
Dollars402353
1,0881,6031,7912,01 72.2812,4192,614
mod, metro and nonmetro, 1968 . _is)
Sources of earnings
tro Nonmstro
Percent atotal Dollars
Percent oftotal
30. 2 34, 380 26. 717. 1 18, 502 14. 416. 0 26, 162 20. 315. 5 14, 993 11. 76. 1 7, 101 5. 5
7. 4 6, 827 5. 3
6. 0 3, 501 2. 7
' 1. 7 16, 488 13. 4
100. 0 128, 661 100. 0
Table 6.-Modian earninp, 1969, by occupational group
Nonfarm occupationgroup and sex
Total Metro Non-metro
Male
Dollars Dollars Dollars
Prof. and managerial 10,381 10,845 9,100Clerical and sales 7,337 7,509 6.803Craftsmen and foreman 8,194 8,727 7,297Operatives 6,626 7,086 5,827Service workers 4,518 4,963 4,140Nonfarm laborers 4,269 4,877 3,645
Total 7,653 8,109 6,716
Female
Prof. and managerial 5,716 5,989 5,193Clerical and sales 3,838 4,051 3.369Craftsmen and foremen 4,376 4,684 3,862Operatives 3,540 3,617 3,468Service workers 1,477 1,713 1.223
Pvt. household 520 571 487Other service 2,063 2,281 1,741
Nonfarm laborers 2,613 (i) (I )Total 3,453 3,704 3,003
Base less than 75,000.Source: Social and Economic Characteristics of the Populationin Metropolltan and Nonmetropolitan Areas: 1970 and 1960,Current Population Reports, P. 23, No. 37, June 24. 1971.Bureau of the Census, Table 17, p. 66.
Table 7.-Income per form operator family by major source and byvalue of sales classei, 1970
Value of productssold
Realizednet farmIncome
Ott-tarmIncome
Totalincome
Pct. off-farm isof total
1.No. offarms
Dol. Dol. Dol. Pct. Thou.
All farms 5,374 5,833 11,207 52 2,924$40,000 and over 25,664 5,803 31,467 18 223
20,000 39,999 . 9,962 3,503 13,465 26 374
10,000 - 19,999 . 6,208 3,452 9,660 36 513
5,000 9,999 3,492 4,984 8,476 59 370
2,500 4,999 2.049 5,465 7,514 73 260
Less than 2,500 . 1,059 7,954 9,013 88 1,184
Source: Farm Income Situation, F15218, Economic ResearchService, July 1971, Table 5D.
43

4 4
Table 8.Per cepite xpenditures of local governments for selectedservices, by metropolitan status, 198647
Service Metropolltan I Nonmetropolitan
Education 6150.35 $136.44Health and hospitals 18.30 13.70Police protection 16.73 6.56Roads 21.14 26.77Fire protection ... 9.77 3.46Sanitation 15.83 7.03Welfare 24.17 11.88
Source: U.S. Census of Governments.
. 67

UNITED STATES DEPARTMENT OF AGRICULTUREWASHINGTON, D.C. E0210
OFF ICI AL BUSINESS
PENALTY FOR PRIVAT E USE, MO
is

POSTAGE AND FEES PAIDU.S. DEPARTMENT OF
AGRICULTURE