rc-1589 review and revision of overload permit · pdf filebe robust enough to ensure that the...
TRANSCRIPT

Review and Revision of Overload Permit Classification
ORBP Report No. RC-1589
Final Report
for
By Michael Baker Jr., Inc.
February 2013

This page intentionally left blank

Technical Report Documentation Page
i
Abstract 1. Report No.
RC-1589 2. Government Accession No.
N/A 3. MDOT Project Manager
Brad Wagner
4. Title and Subtitle
REVIEW AND REVISION OF OVERLOAD PERMIT CLASSIFICATION
5. Report Date
February 2013
6. Performing Organization Code
N/A
7. Author(s)
Mark Mlynarski, P.E., Bryan Spangler, P.E., Hal Rogers, P.E.
8. Performing Org. Report No.
N/A
9. Performing Organization Name and Address
Michael Baker Jr., Inc. 4431 N. Front Street Harrisburg, PA 17110-1709
10. Work Unit No. (TRAIS)
N/A
11. Contract No.
2010-0317
11(a). Authorization No.
Z1
12. Sponsoring Agency Name and Address
Michigan Department of Transportation Research Administration 8885 Ricks Rd. P.O. Box 30049 Lansing MI 48909
13. Type of Report & Period Covered
Final Report 10/01/2010 – 2/28/2013 14. Sponsoring Agency Code
N/A
15. Supplementary Notes
16. Abstract The Michigan Department of Transportation (MDOT) allows trucks that exceed their legal loads to cross bridges if they apply and are approved for a permit. More than 30,000 permits have been processed each year since 2002, providing a vital service to Michigan's economy. However, the permitting system must be robust enough to ensure that the safety of the motoring public is maintained by accounting for overload vehicles without unduly restricting commerce. Currently, structures are placed into Overload Class by checking all service limit states as identified by the 2005 MDOT Bridge Analysis Guide (BAG) with 2009 Interim Updates and the 2010 American Association of State Highway and Transportation Officials (AASHTO) Manual for Bridge Evaluation (MBE) with interims. Vehicles are placed into the Overload Class by comparing the maximum moments of the vehicle for span lengths between 15-ft to 160-ft to the moments produced by the 20 standard overload configurations provided by the BAG. Structures that do not pass an overload class would be marked as restricted and require a specific analysis, increasing the turn-around time for the client and the analysis cost incurred by MDOT. The current software used for the analysis of the structures is a simplified solution that was developed well over 20 years ago when more robust solutions were not feasible. With the capability of modern computing and the availability of bridge software solutions, this research project looks at solutions for updating the bridge analysis as well as the overall overload permit classification process.
17. Key Words
Bridge Software, LRFR, LFR, Load Rating, Overload, Permit Load
18. Distribution Statement
No restrictions. This document is available to the public through the Michigan Department of Transportation.
19. Security Classification - report
Unclassified
20. Security Classification - page
Unclassified
21. No. of Pages
22. Price
N/A

February 25, 2013 [Review and Revision of Overload Permit Classification]
ii
ORBP Reference No. OR10-010 Report No. RC-1589
This page intentionally left blank
February 25, 2013 [Review and Revision of Overload Permit Classification]
iii
ORBP Reference No. OR10-010 Report No. RC-1589
Table of Contents
Abstract ............................................................................................................................ i Table of Contents ............................................................................................................ iii List of Figures ..................................................................................................................vi List of Tables ...................................................................................................................ix 1 Executive Summary .................................................................................................. 1 2 Introduction ............................................................................................................... 1 3 Objective ................................................................................................................... 3 4 Michigan Overload Permit Review Process .............................................................. 3
4.1 Methodology ..................................................................................................... 3
4.1.1 Documented Procedures ............................................................................. 4 4.1.2 Actual Procedures ....................................................................................... 5
4.1.3 Project Constraints ...................................................................................... 7
4.1.3.1 Existing Data ......................................................................................... 7 4.1.3.2 Data Acquisition .................................................................................... 8
4.1.3.3 MDOT Bridge Demographics ................................................................ 9 MDOT NBI Demographics ................................................................................ 9 Age of Bridges vs. Material Used in Main Span ................................................ 9
Relative Simplicity for Analysis ......................................................................... 9 Overall Bridge Condition ................................................................................. 10
Current Bridge Capacity .................................................................................. 10 Current Bridges with Virtis Ratings Compared to Permit Loads – ................... 11 MDOT Virtis DB Demographics ...................................................................... 12
4.2 Discussion of Results/ Conclusions ................................................................ 13
4.2.1 Option 1 – Modify BridgeOV ...................................................................... 13 4.2.1.1 Update BridgeOV to C#.NET .............................................................. 14 4.2.1.2 Expand Span Length to Represent the Michigan Bridge Demographics 14 4.2.1.3 Validate Class A,B, and C Moments in BridgeOV ............................... 15
4.2.1.4 Add Shear Capabilities ........................................................................ 15 4.2.1.5 Provide Graphing Features ................................................................. 15
4.2.2 Option 2 – Using a Refined Analysis Technique ........................................ 16 4.2.3 Option 3 – Using Virtis ............................................................................... 17 4.2.4 Option 4 – Combination of Option 1 and Option 3 ..................................... 18
4.3 Recommendations .......................................................................................... 21
4.3.1 Use Option 4 – Combination of Option 1 and Option 3 .............................. 21
4.3.2 Reviewing the Existing Loads Using Virtis and BridgeOV ......................... 22 4.3.3 Comparison of Sampling of Permit Vehicles .............................................. 22
5 Reviewing the Permit Vehicle List and Michigan Overload Vehicles ...................... 24 5.1 Methodology ................................................................................................... 25
5.1.1 Software for Reviewing Permit Data .......................................................... 25
5.1.2 Duplicate Vehicles ..................................................................................... 28 5.1.3 Vehicle Anomalies ..................................................................................... 35

February 25, 2013 [Review and Revision of Overload Permit Classification]
iv
ORBP Reference No. OR10-010 Report No. RC-1589
5.1.4 Axle Concentrations .................................................................................. 36 5.1.4.1 Two-Axle Concentrations .................................................................... 38 5.1.4.2 Three-Axle Concentrations ................................................................. 42 5.1.4.3 Four-Axle Concentrations ................................................................... 45 5.1.4.4 Five-Axle Concentrations .................................................................... 48
5.1.4.5 Maximum Gross Weight ...................................................................... 50 5.1.4.6 Five-Axle Construction Vehicle ........................................................... 53
5.1.5 Review of Michigan Overload Vehicles (LFR) ........................................... 54 5.1.5.1 Overload Vehicles 1 through 5 ............................................................ 56 5.1.5.2 Overload Vehicles 6 and 8 .................................................................. 57
5.1.5.3 Overload Vehicles 11, 19 and 20 ........................................................ 58 5.1.6 Review of NBI Maximum Span Length ...................................................... 60
5.1.7 Review of Continuous Span Structures ..................................................... 63
5.1.8 BridgeOV – LFR vs. LRFR ........................................................................ 67 5.1.8.1 Three-Axle Vehicle – LFR vs. LRFR ................................................... 67 5.1.8.2 Review of the Permit Vehicles in LRFR .............................................. 72
5- axle closely spaced 24 kip loads................................................................. 72 Maximum Gross Weight .................................................................................. 74 Axle Concentrations ........................................................................................ 75
5.2 Discussion of Results ...................................................................................... 81 5.3 Conclusions .................................................................................................... 81
5.4 Recommendations .......................................................................................... 84 6 Modifications to the BridgeOV Algorithm ................................................................ 86
6.1 Methodology ................................................................................................... 86
6.1.1 Revisions to the Moment Table ................................................................. 86
6.1.2 Addition of Shear Table ............................................................................. 90 6.1.3 Adding Shear for Two Equal Spans ........................................................... 92 6.1.4 Adding the Maximum Span Length ............................................................ 96
6.1.5 Interface Features ..................................................................................... 96 6.2 Discussion of Results ...................................................................................... 96
6.3 Conclusions/Recommendations ..................................................................... 96 7 Final Conclusions ................................................................................................... 97 8 Recommendations for Implementation ................................................................... 98
8.1 Implement the API .......................................................................................... 98 8.2 Virtis Database Development ......................................................................... 98
8.3 Periodic Use of the Software Tools ................................................................. 99 8.4 Implementation of Training Course ................................................................. 99
9 Recommendations for Further Research ................................................................ 99
10 BridgeOV Software User Manual ...................................................................... 100 10.1 Starting the BridgeOV-Virtis program ............................................................ 101 10.2 BridgeOV/Virtis ............................................................................................. 103
10.2.1 Running the BridgeOV/Virtis ................................................................ 106
10.2.2 The BridgeOV/Virtis interface ............................................................... 107 10.2.2.1 Permit Information Tab ...................................................................... 109 10.2.2.2 Bridge List Tab .................................................................................. 110

February 25, 2013 [Review and Revision of Overload Permit Classification]
v
ORBP Reference No. OR10-010 Report No. RC-1589
10.2.2.3 Vehicle Tab ....................................................................................... 112 10.2.2.4 Process Tab ...................................................................................... 115 10.2.2.5 Output Tab ........................................................................................ 116
10.2.3 Setting up the Virtis database............................................................... 118 10.2.3.1 Identify the run time ........................................................................... 119
10.2.3.2 Choosing the key members .............................................................. 119 10.3 BridgeOV-Standalone ................................................................................... 123
10.3.1 Running the BridgeOV-Standalone Program ....................................... 123 10.3.1.1 Getting Started .................................................................................. 123 10.3.1.2 Interface Options ............................................................................... 125
10.3.2 Running BridgeOV-Standalone using BridgeOV-Virtis ......................... 129 10.3.3 BridgeOV input file ............................................................................... 133
10.3.4 BridgeOV output file ............................................................................. 135
10.4 Permit Vehicle Analyzer ................................................................................ 136 10.4.1 Preparing an MDOT Excel file .............................................................. 137 10.4.2 Running the Permit Vehicle Analyzer ................................................... 139
11 List of Acronyms/Glossary ................................................................................. 143 12 References ........................................................................................................ 144 Appendix A – Excerpt from “SUPERLOAD Permitting and Routing Implementation” ..A-1
Appendix B – Michigan Virtis DB bridge demographics ...............................................B-1 Year Built .......................................................................................................B-1
Structure Type ...............................................................................................B-2 Span Length Breakdown ................................................................................B-4 Maximum Span Count ...................................................................................B-5
Appendix C – Original BridgeOV documentation ........................................................ C-1
Appendix D – Permit Vehicle Review .......................................................................... D-1 Appendix E – Permit Vehicles - Virtis Ratings .............................................................E-1 Appendix F – Revised CLSABC2U.txt File ................................................................... F-1
Appendix G – BridgeOV-Virtis Application Programming Interface (API) interface ..... G-1 Wrapper class functions ........................................................................................... G-1
SessionReturnCode Start((string sUsername, string sPassword, string sDataSource) ........................................................................................................ G-2 bool ProcessRequest(string sInputFileName, string sOutputFileName, string sStatusFileName, ref string sErrorMessages, ref string sWarningMessages, ref object objtextbx) ................................................................................................... G-3
API Input File ........................................................................................................... G-4 Sample input file ................................................................................................... G-4 Input File Format .................................................................................................. G-6
API Output File ....................................................................................................... G-12 Sample Output File (XML/XSL) .......................................................................... G-12 Output File Format .............................................................................................. G-18
Auxiliary Files ......................................................................................................... G-20
Appendix H – Weigh-in-Motion – (WIM) file format ..................................................... H-1
February 25, 2013 [Review and Revision of Overload Permit Classification]
vi
ORBP Reference No. OR10-010 Report No. RC-1589
List of Figures Figure 1. Michigan bridge distribution by decade and bridge type .............................................................. 9 Figure 2. MiTRIP class distribution ............................................................................................................ 11 Figure 3. Bridges rated with Virtis ratings .................................................................................................. 12 Figure 4. BridgeOV prototype .................................................................................................................... 16 Figure 5. Running Virtis in ‘Batch Mode’ .................................................................................................... 18 Figure 6. Running BridgeOV with Virtis option in ‘Batch Mode’ ................................................................. 19 Figure 7. Running BridgeOV with Virtis using ‘Standalone’ ....................................................................... 20 Figure 8. Permit Spreadsheet in original form from MDOT ....................................................................... 26 Figure 9. MDOT Permit Spreadsheet after conversion to CSV and some editing..................................... 26 Figure 10. MDOT Permit Vehicle Analyzer (PVA) software ....................................................................... 27 Figure 11. Frequency of duplicate vehicles ............................................................................................... 28 Figure 12. BridgeOV Moment ratio of top 40 duplicate vehicles ................................................................ 29 Figure 13. BridgeOV Shear (simple span) for top 40 duplicate vehicles ................................................... 29 Figure 14. BridgeOV Shear (2-span) for top 40 duplicate vehicles ........................................................... 30 Figure 15. BridgeOV Moment ratio envelope of top 40 duplicate vehicles ................................................ 30 Figure 16. BridgeOV Shear (simple span) envelope for top 40 duplicate vehicles ................................... 31 Figure 17. BridgeOV Shear (2-span) envelope for top 40 duplicate vehicles ............................................ 31 Figure 18. BridgeOV Moment ratio of critical duplicate vehicles ............................................................... 32 Figure 19. BridgeOV Shear (simple span) for critical duplicate vehicles ................................................... 32 Figure 20. BridgeOV Shear (2-span) for critical duplicate vehicles ........................................................... 33 Figure 21. Axle concentration example ...................................................................................................... 36 Figure 22. BridgeOV moment - 2 axle concentration- 5 vehicles with suspect axle spacing .................... 39 Figure 23. BridgeOV shear – 2-axle concentration- 5 vehicles with suspect axle spacing ....................... 39 Figure 24. BridgeOV moment plot of all 31 vehicles with 2-axle concentration ......................................... 40 Figure 25. BridgeOV moment plot of Vehicles 2AC-0006, 2AC-0015, and 2AC-0016 2-axle concentration
............................................................................................................................................................ 40 Figure 26. BridgeOV Shear plot of vehicles MiPer0006, MiPer0015, and MiPer0016 2-axle concentration
............................................................................................................................................................ 41 Figure 27. BridgeOV Moment plot of all 31 vehicles with 3-axle concentration ......................................... 43 Figure 28. BridgeOV moment plot of 3-axle concentrations – Envelope of top 31 concentrations ........... 43 Figure 29. BridgeOV Shear (2-span) plot of 3-axle concentrations – envelope of top 31 concentrations 44 Figure 30. BridgeOV moment plot of 4-axle concentrations – envelope of top 31 concentrations ............ 46 Figure 31. BridgeOV shear plot of 4-axle concentrations – envelope of top 31 concentrations ................ 46 Figure 32. BridgeOV Moment plot of 4-axle concentrations – envelope of top 31 concentrations- W/O
4AC-0011 ............................................................................................................................................ 46 Figure 33. BridgeOV Shear plot of 4-axle concentrations – envelope of top 31 concentrations- W/O 4AC-
0011 .................................................................................................................................................... 47 Figure 34. BridgeOV Moment plot of 5-axle concentrations – envelope of top 31 concentrations ............ 49 Figure 35. BridgeOV Shear plot of 5-axle concentrations – envelope of top 31 concentrations ............... 49 Figure 36. BridgeOV moment plot largest gross-weight vehicles – Top 30 ............................................... 51 Figure 37. BridgeOV Shear plot largest gross-weight vehicles – Top 30 .................................................. 51 Figure 38. BridgeOV Moment plot for vehicles GW-0001, GW-0002, GW-0003, GW-0004, GW-0005,
GW-0007, GW-0010, GW-0013, and GW-0025 ................................................................................. 52 Figure 39. BridgeOV Shear plot for vehicles GW-0001, GW-0002, GW-0003, GW-0004, GW-0005, GW-
0007, GW-0010, GW-0013, and GW-0025 ......................................................................................... 52 Figure 40. BridgeOV moment plot – 5-axle short vehicle, 24 kip axle loads, 4-ft spacings ....................... 53 Figure 41. BridgeOV shear plot – 5-axle short vehicle, 24 kip axle loads, 4-ft spacings ........................... 53 Figure 42. BridgeOV moment plot for Michigan Class A vehicles – governing vehicles labeled .............. 54 Figure 43. BridgeOV Moment plot of 2-axle Michigan overload vehicles .................................................. 56 Figure 44. BridgeOV shear (2 span) plot of 2-axle Michigan overload vehicles ....................................... 57 Figure 45. BridgeOV moment plots – Class A- vehicles 6 and 8 ............................................................... 57 Figure 46. BridgeOV moment plots – Class A- vehicles 11, 19 and 20 ..................................................... 58 Figure 47. BridgeOV shear plots – Class A- vehicles 11, 19 and 20 ......................................................... 58

February 25, 2013 [Review and Revision of Overload Permit Classification]
vii
ORBP Reference No. OR10-010 Report No. RC-1589
Figure 48. BridgeOV shear-2-span plots – Class A- vehicles 11, 19 and 20 ............................................ 59 Figure 49. Bridge failing BridgeOV for shorter span length but passing for longer span lengths .............. 60 Figure 50. Revised permit vehicle – maximum axle loads changed from 46 kips to 38 kips .................... 61 Figure 51. BridgeOV moment plot for revised permit vehicle .................................................................... 61 Figure 52. BridgeOV shear plot for revised permit vehicle ........................................................................ 62 Figure 53. Plot of BID 26 shear in Virtis ..................................................................................................... 64 Figure 54. Modification of 3-axle vehicle used for the BridgeOV – LRFR load factor analysis ................. 68 Figure 55. LRFR BridgeOV moment comparison of TV2 and TV3 from 10’-250’ ...................................... 69 Figure 56. LRFR BridgeOV moment comparison of TV2 and TV3 from 10’-50’ ........................................ 69 Figure 57. LFR BridgeOV moment comparison of TV2 and TV3 from 10’-50’ .......................................... 70 Figure 58. BridgeOV Moment ratio plot of LRFR vehicles TV2 and TV3 .................................................. 72 Figure 59. LFR BridgeOV moment plot -5-axle short vehicle, 24 kip axle loads, 4’ spacings ................... 73 Figure 60. LRFR BridgeOV moment plot – 5-axle short vehicle, 24 kip axle loads, 4’ spacings ............... 73 Figure 61. BridgeOV LFR/LRFR moment ratio envelope for maximum gross weight vehicles ................. 75 Figure 62. BridgeOV LFR/LRFR moment ratio envelope for 2-axle concentration vehicles ..................... 77 Figure 63. BridgeOV LFR/LRFR moment ratio envelope for 3-axle concentration vehicles ..................... 78 Figure 64. BridgeOV LFR/LRFR moment ratio envelope for 4-axle concentration vehicles ..................... 79 Figure 65. BridgeOV LFR/LRFR moment ratio envelope for 5-axle concentration vehicles ..................... 80 Figure 66. Plot envelope of files option in BridgeOV ................................................................................. 87 Figure 67. Plot of Michigan Class A moment envelope with the existing BridgeOV Class A,B,C plots (10’-
250’) NOTE: For this older version of BridgeOV, the Class A,B,C tables ended at 200’ ................... 88 Figure 68. Plot of Michigan Class B moment envelope with the existing BridgeOV Class A,B,C plots (10’-
250’) NOTE: For this older version of BridgeOV, the Class A,B,C tables ended at 200’ ................... 88 Figure 69. Plot of Michigan Class C moment envelope with the existing BridgeOV Class A,B,C plots (10’-
250’) NOTE: For this older version of BridgeOV, the Class A,B,C tables ended at 200’ ................... 89 Figure 70. Plot showing new Class A,B, and C moments up to 250’ ........................................................ 89 Figure 71. Plot of Michigan Class A shear envelope with the existing BridgeOV Class A,B,C plots (10’-
250’) NOTE: For this older version of BridgeOV, shear values were not available for Class A,B, or C ............................................................................................................................................................ 90
Figure 72. Plot of Michigan Class B shear envelope with the existing BridgeOV Class A,B,C plots (10’-250’) NOTE: For this older version of BridgeOV, shear values were not available for Class A,B, or C ............................................................................................................................................................ 90
Figure 73. Plot of Michigan Class C shear envelope with the existing BridgeOV Class A,B,C plots (10’-250’) NOTE: For this older version of BridgeOV, shear values were not available for Class A,B, or C ............................................................................................................................................................ 91
Figure 74. Plot showing the added A,B,C classes for simple span shear ................................................. 91 Figure 75. AISC beam diagrams and formulas for two equal spans ......................................................... 92 Figure 76. Plot showing the added A,B,C Classes for 2 equal spans shear ............................................. 92 Figure 77. BridgeOV-Virtis login screen ................................................................................................... 101 Figure 78. BridgeOV-Virtis option disabled .............................................................................................. 102 Figure 79. BridgeOV/Virtis logic (Part 1) .................................................................................................. 104 Figure 80. BridgeOV/Virtis logic (Part 2) .................................................................................................. 105 Figure 81. Starting BridgeOV/Virtis .......................................................................................................... 106 Figure 82. Modifying a BridgeOV-Virtis XML file...................................................................................... 107 Figure 83. Checkboxes on the BridgeOV-Virtis window ........................................................................... 108 Figure 84. BridgeOV-Virtis Permit Information tab .................................................................................. 109 Figure 85. BridgeOV-Virtis Bridge List tab ............................................................................................... 110 Figure 86. BridgeOV-Virtis Vehicle tab .................................................................................................... 112 Figure 87. Vehicle view ............................................................................................................................ 113 Figure 88. BridgeOV-Virtis Process tab ................................................................................................... 115 Figure 89. BridgeOV-Virtis Output tab ..................................................................................................... 116 Figure 90. BridgeOV plot with standard gage (STD) and actual gage (ACT) .......................................... 118 Figure 91. Initial run times for 32 multi-span bridges ............................................................................... 119 Figure 92. Entering the 20 Class A Michigan overload vehicles in Virtis ................................................. 120 Figure 93. Reviewing the rating results in Virtis ....................................................................................... 121

February 25, 2013 [Review and Revision of Overload Permit Classification]
viii
ORBP Reference No. OR10-010 Report No. RC-1589
Figure 94. Turning of the ‘Existing’ flag in Virtis ....................................................................................... 121 Figure 95. Results after revision of ‘Existing’ flag in Virtis ....................................................................... 122 Figure 96. Opening a BridgeOV-Standalone window .............................................................................. 123 Figure 97. Opening multiple BridgeOV standalone files .......................................................................... 124 Figure 98. BridgeOV standalone interface ............................................................................................... 125 Figure 99. Creating a ‘New’ BridgeOV-Virtis file ...................................................................................... 129 Figure 100. Default ‘Bridge ID’ for a new input file in BridgeOV-Virtis ..................................................... 130 Figure 101. Default vehicle configuration for a new BridgeOV-Virtis input file. ....................................... 130 Figure 102. Steps to plot BridgeOV-Standalone from BridgeOV-Virtis ................................................... 131 Figure 103. BridgeOV-Virtis and BridgeOV-Standalone .......................................................................... 131 Figure 104. Setting parameters for BridgeOV-Virtis to run in tandem with BridgeOV-Standalone ......... 132 Figure 105. BridgeOV input format .......................................................................................................... 133 Figure 106. BridgeOV moment output description ................................................................................... 135 Figure 107. Opening the permit analyzer ................................................................................................. 136 Figure 108. Opening WIM data in PVA .................................................................................................... 137 Figure 109. Turning off ‘Merge cells’ in a permit vehicle Excel spreadsheet ........................................... 138 Figure 110. Sorting the permit vehicle Excel spreadsheet ...................................................................... 139 Figure 111. Permit Vehicle Analyzer screen ............................................................................................ 140 Figure 112. Graphing duplicate vehicles .................................................................................................. 141 Figure C-113. BRIDGEOV.EXE flowchart ............................................................................................... C-2 Figure D-114. All Michigan permit vehicles (from permit list provided from MDOT)................................ D-5 Figure D-115. Vehicles MIP-0002, 0030, 0031 (3, 4, and 5 axles) moment ............................................ D-5 Figure D-116. Vehicles MIP-0003, 0004, 0007,0008 (6 axles) moment .................................................. D-6 Figure D-117. Vehicles MIP-0006, 0011, 0012, 0029 (7 axles) moment ................................................. D-6 Figure D-118. Vehicles MIP-0013, 0025, 0026, 0027 (8 axles) moment ................................................. D-7 Figure D-119. Vehicles MIP-0009, 0016, 0017, 0023 (9 axles) moment ................................................. D-7 Figure D-120. Vehicles MIP-0019, 0021, 0022 (10 axles) moment ......................................................... D-8 Figure D-121. Vehicles MIP-0010, 0015, 0018 (12, 13 and 18 axles) moment....................................... D-8 Figure E-122. Operating rating factors > 1.0 for the 17 vehicles listed in Table E-27 .............................. E-2 Figure E-123. Operating rating factors vs. Virtis BridgeID for HS 20-44 ................................................. E-2 Figure E-124. Operating rating factors vs. Virtis Bridge ID for permit vehicle MIPer0001 (see Table E-27)
.......................................................................................................................................................... E-3 Figure E-125. Operating rating factors vs. Virtis Bridge ID for permit vehicle MIPer0002 (see Table E-27)
.......................................................................................................................................................... E-3 Figure E-126. Operating rating factors vs. Virtis Bridge ID for permit vehicle MIPer0003 (see Table E-27)
.......................................................................................................................................................... E-4

February 25, 2013 [Review and Revision of Overload Permit Classification]
ix
ORBP Reference No. OR10-010 Report No. RC-1589
List of Tables Table 1. Michigan NBI distribution ............................................................................................................. 10 Table 2. NBI bridge distribution vs. Michigan Virtis DB ............................................................................. 13 Table 3. Breakdown of permit vehicle list provided by TPU ...................................................................... 24 Table 4. Break down of MDOT permit vehicle set from ............................................................................. 24 Table 5. Review of most frequent vehicle duplicates using BridgeOV ...................................................... 34 Table 6. Possible errors in axle spacing .................................................................................................... 35 Table 7. Possible errors with axle loads .................................................................................................... 35 Table 8. Calculation of 2 and 3 axle concentrations .................................................................................. 37 Table 9. Largest 2-axle vehicle concentrations ......................................................................................... 38 Table 10. Largest 3-axle vehicle concentrations ....................................................................................... 42 Table 11. Largest 4-axle vehicle concentrations ....................................................................................... 45 Table 12. Largest 5-axle vehicle concentrations ....................................................................................... 48 Table 13. Largest gross-weight vehicle ..................................................................................................... 50 Table 14. BridgeOV governing Michigan overload vehicles - Class A ...................................................... 55 Table 15. Spacing of Michigan 2-axle overload Class A vehicles ............................................................. 56 Table 16. Virtis /BridgeOV comparisons on 30 bridge MDOT sample using ‘Max Span Length’ to nearest
1’.......................................................................................................................................................... 65 Table 17. Virtis /BridgeOV comparisons on 30 bridge MDOT sample using ‘Max Span Length’ rounded
up to nearest 10’ + 10’ ........................................................................................................................ 66 Table 18. Three vehicle test of MDOT LRFR live load factors .................................................................. 68 Table 19. Overall comparison of vehicles TV1, TV2, and TV3 for LFR and LRFR ................................... 71 Table 20. Comparison of LRFR controlling overload live load factors with 5-axle construction vehicle.... 74 Table 21. Calculated LRFR live load factors (Curtis/Till Equation 18) ....................................................... 76 Table 22. Moment table comparing new BridgeOV overload values with existing BridgeOV table and
Virtis .................................................................................................................................................... 93 Table 23. Shear table comparing new BridgeOV overload values with Virtis ............................................ 94 Table 24. Shear (2 equal spans) table comparing New BridgeOV overload values with Virtis ................. 94 Table D-25. List of permit vehicles reviewed ........................................................................................... D-1 Table D-26. Permit Table groupings for plotting ...................................................................................... D-4 Table E-27. Summary of results – comparing Virtis/BridgeOV – 225 bridges – 17 permit vehicles ........ E-1

February 25, 2013 [Review and Revision of Overload Permit Classification]
x
ORBP Reference No. OR10-010 Report No. RC-1589
This page intentionally left blank

February 25, 2013 [Review and Revision of Overload Permit Classification]
1
ORBP Reference No. OR10-010 Report No. RC-1589
1 Executive Summary
The Michigan Department of Transportation (MDOT) allows trucks that exceed their
legal loads to cross bridges if they apply and are approved for a permit. More than
30,000 permits have been processed each year since 2002, providing a vital service to
Michigan's economy. However, the permitting system must be robust enough to ensure
that the safety of the motoring public is maintained by accounting for overload vehicles
without unduly restricting commerce.
Currently, structures are placed into Overload Class by checking all service limit states
as identified by the 2005 MDOT Bridge Analysis Guide (BAG) with 2009 Interim
Updates and the 2010 American Association of State Highway and Transportation
Officials (AASHTO) Manual for Bridge Evaluation (MBE) with interims. Vehicles are
placed into the Overload Class by comparing the maximum moments of the vehicle for
span lengths between 15-ft to 160-ft to the moments produced by the 20 standard
overload configurations provided by the BAG. Structures that do not pass an overload
class would be marked as restricted and require a specific analysis, increasing the turn-
around time for the client and the analysis cost incurred by MDOT.
The current software used for the analysis of the structures is a simplified solution that
was developed well over 20 years ago when more robust solutions were not feasible.
With the capability of modern computing and the availability of bridge software
solutions, this research project looks at solutions for updating the bridge analysis as well
as the overall overload permit classification process. In addition, a half-day training
curriculum highlighting the software tools developed for this project was produced and
presented to MDOT bridge engineers. This curriculum is provided with this research to
be used as a tool for future training using the software.
2 Introduction
Statement of the Problem
MDOT allows trucks that exceed their legal loads to cross bridges if they apply and are
approved for a permit. More than 30,000 permits have been processed each year since
2002, providing a vital service to Michigan's economy. However, the permitting system
must be robust enough to ensure that the safety of the motoring public is maintained
without unduly restricting commerce. In order to process these requests, the Bridge
Management/ Load Rating unit of the Design Division (BMLR) classifies all bridges, and
the Transports Permits Unit (TPU) of the Real Estate Development Services Division
classifies the truck and then compares the two results. The computer program and
methodology used to classify both bridges and trucks was last reviewed and modified in
1991. Since that time, changes have occurred in the business practices of each

February 25, 2013 [Review and Revision of Overload Permit Classification]
2
ORBP Reference No. OR10-010 Report No. RC-1589
Division. A new method of bridge design, analysis and rating has been adopted by the
Federal Highway Administration (FHWA), MDOT and BMLR. Load and Resistance
Factor Rating (LRFR) is required for load rating of new and reconstructed structures as
of October 2010. This method replaced Load Factor Rating (LFR), which is anticipated
to remain the method for existing structures. Additionally, a new program for processing
permits has been adopted by the TPU.
Currently, structures are placed into Overload Class by checking strength and service
limit states as identified by the 2005 MDOT BAG with 2009 Interim Updates and the
2010 AASHTO-MBE. Vehicles are placed into the Overload Class by comparing the
maximum moments of the vehicle for span lengths between 15-ft to 160-ft to the
moments produced by the 20 standard overload configurations provided by the BAG.
Additionally, gage spacings greater than 8-ft are allowed to carry additional load as
identified by the BAG. The formula given in the BAG was likely based on LFR
distribution factors and does not account for LRFR. Structures that do not apply to this
constraint are marked as Restricted by the BMLR and TPU and require a specific
analysis, increasing the turn-around time for the client and the analysis cost incurred by
the BMLR. Additionally, since the range of spans checked is always in the 15-ft to 160-ft
range, vehicles may be restricted from routes based on span lengths that are not
present on the route, which also leads to increased turn-around time for the client and
additional analysis cost incurred by the BMLR.
Proposed Solution
To address these issues, the researchers have examined the current process, including
reviewing the 20 overload standard vehicles, interviewing key MDOT personnel, making
modifications to the existing software, reviewing the MDOT permitting procedures,
exploring various software options, and reviewing the effects of the LRFR varying live
load factors based on different weight vehicles. Based on these reviews, a new process
has been recommended that maintains the reliability of the system and allows for
efficient transportation of goods. This process is outlined in this report and includes the
development of a new piece of software that will replace the software developed in
1991. This process takes into account the business practice which requires a quick
turn-around of permit applications and also provides a methodology that could be
implemented by local agencies as permits are not limited to state-owned routes. The
software utilizes a hybrid of the AASHTOWareTM Virtis® software (which is licensed by
MDOT) and a revision to the MDOT software developed in 1991 [NOTE: During the
development of this research project, the name of the AASHTOWareTM Virtis® software
was changed by AASHTO to AASHTOWareTM Bridge Rating. The research report has
retained the original name ‘Virtis’ throughout this report]. The result is a program that
operates as a standalone program, capable of being used by third-party developers for

February 25, 2013 [Review and Revision of Overload Permit Classification]
3
ORBP Reference No. OR10-010 Report No. RC-1589
inclusion in other programs (such as MDOT’s MiTRIP software). The software includes
a standalone interface and API (Application Program Interface) documentation for use
by third-party developers.
Ultimately, the full success of the project relies on MDOT’s continued development of
their AASHTOWare Bridge database which will be used to accurately rate/analyze the
state bridge inventory. The process is set up, however, in a manner that allows for the
immediate implementation of the software prior to the full development of the bridge
database.
3 Objective
The following were the research objectives of this project:
Review current Overload Permitting procedure from the structure and vehicle
perspective. Compare this procedure to current National Best Practices, MDOT
and local agency business needs, and reliability of the system.
Incorporating LRFR-determined bridge capacity ratings into the process as they
become available.
Create an interim report summarizing the current method, identifying deficiencies
of the current procedure and proposing a method to be approved by MDOT.
Create a software program to replace the current BridgeOV program that
addresses all vehicle and structural variables outlined in the problem statement.
Educate MDOT staff and Local Agency Bridge Owners.
The following sections provide a description of the methodology used to complete this
research project. The project was divided into two phases: the Interim Phase review
process which is described in Section 4 and the Final Phase which is discussed in
Sections 5 and 6.
In general, the Interim Phase involved the review of Michigan’s procedures, processes
and existing software in order to provide recommendations that could be implemented
in the Final Phase of the project and beyond.
4 Michigan Overload Permit Review Process
4.1 Methodology
The researchers reviewed the Michigan Overload Permit Review Process through
document evaluation, data assessment, phone conferences and on-site visits in
December 2010 and July 2011. The researchers performed these reviews in order to
gain an understanding of Michigan’s procedures for processing, reviewing and

February 25, 2013 [Review and Revision of Overload Permit Classification]
4
ORBP Reference No. OR10-010 Report No. RC-1589
approving overload vehicle permit requests. The purpose of the review was to develop
recommendations to improve Michigan’s automated system.
4.1.1 Documented Procedures
Published procedures for review of overload permit requests are documented in the
Michigan Department of Transportation (MDOT) Bridge Analysis Guide (BAG), Chapter
8, Overload Procedures.
MDOT owns and maintains all bridges on and over Michigan (M), US and Interstate
routes. However, for permitting purposes, bridges over MDOT-owned highways are the
responsibility of the road owner even if the structure is owned by MDOT. Local bridge
owners are not required to utilize the state’s method of overload evaluation. Routine
permit reviews are conducted by TPU who is responsible for issuing the permits.
MDOT has established a list of 20 vehicles to represent common overload permit
vehicles typically requesting access to MDOT roadways. Each overload is broken down
into three weight Classes A, B, and C. Class A considers each vehicle at the maximum
weight, while Class B and C represent reduced axle weight configurations for each
vehicle. Bridges are to be evaluated for their ability to carry each of the 20 permit
vehicles. Those that can support all 20 loads at the maximum weight are identified as
Class A bridges. Bridges which cannot support all 20 loads at the maximum weights
are then evaluated at the lower set of axle weights. Those that pass all 20 loads at the
Class B level are categorized as Class B bridges and those that pass all 20 loads at the
Class C level are categorized as Class C bridges. If a bridge cannot pass all 20 loads
at the Class C level, it is coded as Class D for restricted, and no overweight permits are
issued to cross the structure. The configurations of these 20 vehicles have been in
place for some time, and it is believed they were developed in the 1960’s or 1970’s.
For overload permit vehicles 1 through 5, 11 and 13 a second lower set of axle weights
exists for Class B, and for permit vehicles 1 through 5 and 11, a lower set of axle
weights exist for Class C. These are to be used in evaluating bridges designed for
AASHTO H15-44 loading. Ratings for bridges designed for this lighter load may be
controlled by the deck capacity for very large permit axle loads. The H15-44 design
criteria was used in Michigan between 1965 and 1972. Bridges built between these
dates that need the reduced axle loads to pass an overload class are to have an
additional designation of an S Flag. Permit loads are only allowed to cross S Flag
bridges if they are shown to have moments below the Class B or Class C moments the
bridge is designated for and if the axle loads are less than 38 kips. It should be noted
that the moments in the tables appear to have been developed using the full axle loads.
There is not a second set of values for those trucks using the reduced axle weights.

February 25, 2013 [Review and Revision of Overload Permit Classification]
5
ORBP Reference No. OR10-010 Report No. RC-1589
The R Flag is used to designate bridges which have beam spacings greater than 10-ft
as well as trusses and main girder type systems. If the R Flag is in place for a bridge,
the axle weights for the truck are not eligible for a reduction if the actual axle width is
greater than 8-ft. Allowable permit load tables used for comparison were computed
using vehicles with an axle width of 8-ft. If the actual axle width is wider, the axle loads
are reduced by a factor computed from the actual axle width for bridges without the R
Flag. The equation to determine the factor is as follows: Axle weight / ((axle spacing
+8.0)/16). Each bridge is classified as either Class A, Class B, Class C or Restricted D
and have the R or S flags designated by BMLR Division (see Figure 2 on page 11).
Haulers use a web based system known as MiTRIP. For the evaluation/comparison of
their vehicle with the Class A, B and C loads, MiTRIP uses a version of the BridgeOV
program developed by the Michigan Technological University and the Michigan
Department of Transportation. When a permit is evaluated, a version of the BridgeOV
program is run within MiTRIP for the load. Note, BridgeOV is run for all permit
applications, even if the load is legal by weight. BridgeOV produces simple span
moments based on the axle loads and spacings for the vehicle. They are produced for
spans from 15-ft thru 160-ft at 5-ft increments using an impact factor based on the
AASHTO Standard Specifications (LFD). These are compared against the Class A
table of predetermined values for each of the above span lengths. For a Class A
bridges to be crossed, all of the moments produced for the actual vehicle must be below
the values in the table. If any of the checks fail, the load does not pass. The actual
bridge span length(s) or configuration is not considered. Similarly for Class B and C
bridges, the same checks are performed and compared against the Class B and Class
C tables of allowable moment values.
4.1.2 Actual Procedures
Axle weights and spacings are input by the hauler as part of the MiTRIP application
process on line. Reviewers from TPU staff receive output from MiTRIP which provides
a comparison of the moment values of the actual load to the table values for Class A, B,
and C bridges. The R and S flags are also considered by the system. MiTRIP also
performs a check for maximum tire load per inch. The maximum load allowed is 700
lb/inch for hauled loads and 850 lb/inch for construction vehicles. The staff is limited in
their reviews of BridgeOV output, review of the axle weights and the pass-fail responses
from the system. No permits are auto issued by the system, all receive manual review
first.
The data for MiTRIP is all developed by BMLR. In theory, all spans of all Michigan
permitted bridges are analyzed for each of the 20 overload vehicles (Class A) and
checked that they all receive a passing rating for both moment and shear.
February 25, 2013 [Review and Revision of Overload Permit Classification]
6
ORBP Reference No. OR10-010 Report No. RC-1589
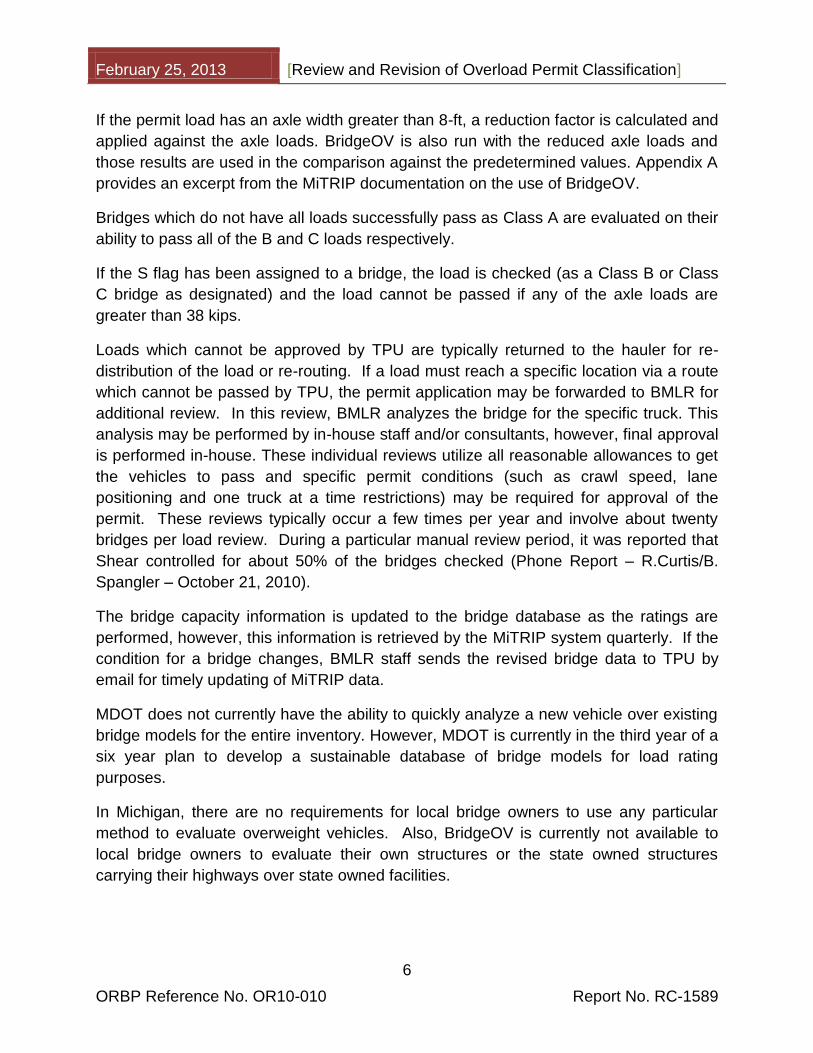
If the permit load has an axle width greater than 8-ft, a reduction factor is calculated and
applied against the axle loads. BridgeOV is also run with the reduced axle loads and
those results are used in the comparison against the predetermined values. Appendix A
provides an excerpt from the MiTRIP documentation on the use of BridgeOV.
Bridges which do not have all loads successfully pass as Class A are evaluated on their
ability to pass all of the B and C loads respectively.
If the S flag has been assigned to a bridge, the load is checked (as a Class B or Class
C bridge as designated) and the load cannot be passed if any of the axle loads are
greater than 38 kips.
Loads which cannot be approved by TPU are typically returned to the hauler for re-
distribution of the load or re-routing. If a load must reach a specific location via a route
which cannot be passed by TPU, the permit application may be forwarded to BMLR for
additional review. In this review, BMLR analyzes the bridge for the specific truck. This
analysis may be performed by in-house staff and/or consultants, however, final approval
is performed in-house. These individual reviews utilize all reasonable allowances to get
the vehicles to pass and specific permit conditions (such as crawl speed, lane
positioning and one truck at a time restrictions) may be required for approval of the
permit. These reviews typically occur a few times per year and involve about twenty
bridges per load review. During a particular manual review period, it was reported that
Shear controlled for about 50% of the bridges checked (Phone Report – R.Curtis/B.
Spangler – October 21, 2010).
The bridge capacity information is updated to the bridge database as the ratings are
performed, however, this information is retrieved by the MiTRIP system quarterly. If the
condition for a bridge changes, BMLR staff sends the revised bridge data to TPU by
email for timely updating of MiTRIP data.
MDOT does not currently have the ability to quickly analyze a new vehicle over existing
bridge models for the entire inventory. However, MDOT is currently in the third year of a
six year plan to develop a sustainable database of bridge models for load rating
purposes.
In Michigan, there are no requirements for local bridge owners to use any particular
method to evaluate overweight vehicles. Also, BridgeOV is currently not available to
local bridge owners to evaluate their own structures or the state owned structures
carrying their highways over state owned facilities.

February 25, 2013 [Review and Revision of Overload Permit Classification]
7
ORBP Reference No. OR10-010 Report No. RC-1589
4.1.3 Project Constraints
One of the original tenants of this project is that no new data will be developed by
MDOT and any new system must operate within the data constraints of the existing
BridgeOV System.
Rising labor costs and advances in construction and fabrication have driven many
manufacturers to fabricate very large components in specialized factory settings. This
allows lower cost and tighter construction tolerances leading to more efficient machines.
As a result of a shifting from on-site fabrication to more off site, plant fabrication is larger
and heavier loads need to be transported. This trend is has resulted in specialized
hauling companies who have modular hauling units that can be configured to transport
extremely large loads in the ranges of half a million to over 2 million pounds.
A further spin-off of the superload hauling companies is the availability of the
specialized equipment and the need to keep it employed. The use of these specialized
vehicles is becoming more common to haul all types of oversize and overweight loads.
These vehicles are typically a close arrangement of axles which can produce large
shear forces on short span bridges in particular. More conventional trucks have greater
spacing between and fewer axles in groups than some of the newer vehicles. BridgeOV
as well as other states analysis methods focused on moments. The introduction of new
vehicles places increased need for tools to check the effect of shear as well as moment.
Some other constraints:
MDOT provided the researchers with the Bentley/MDOT documentation “SUPERLOAD: Permitting and Routing Implementation Michigan Department of Transportation System Specification”. Upon reviewing the documentation, it does not appear that any data is present for tire width, however, according to MDOT, the tire width is an input item in the permitting system.
While Virtis is capable of analyzing a large percentage of bridges for Michigan, it is anticipated that there will always be certain bridge types that can’t be evaluated with the Virtis software or the BridgeOV software. These bridges may need to be reviewed on a case by case basis based on the condition, performance, and approximate, conservative values assigned as BridgeOV classes.
4.1.3.1 Existing Data
The existing data on MDOT bridges is limited to the NBI data which includes the
following fields relevant to permitting:
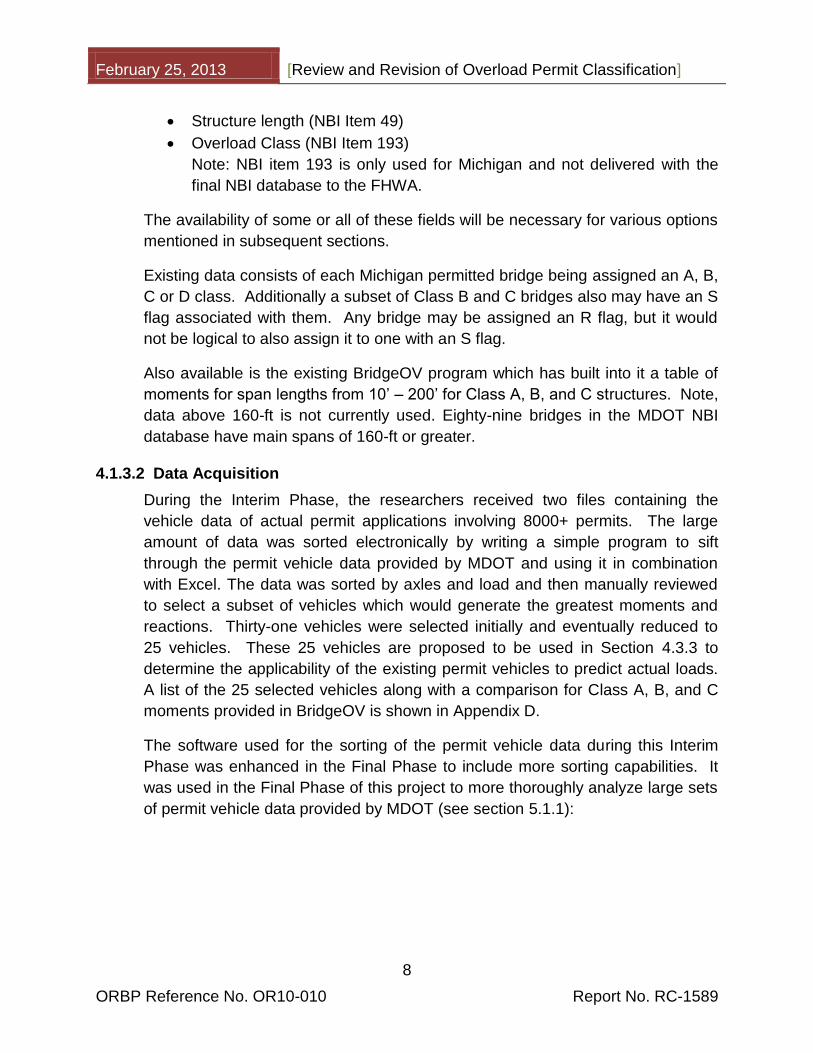
Structure Number (NBI Item 8)
Number of spans in main unit (NBI Item 45)
Length of maximum span (NBI Item 48)
February 25, 2013 [Review and Revision of Overload Permit Classification]
8
ORBP Reference No. OR10-010 Report No. RC-1589
Structure length (NBI Item 49)
Overload Class (NBI Item 193)
Note: NBI item 193 is only used for Michigan and not delivered with the
final NBI database to the FHWA.
The availability of some or all of these fields will be necessary for various options
mentioned in subsequent sections.
Existing data consists of each Michigan permitted bridge being assigned an A, B,
C or D class. Additionally a subset of Class B and C bridges also may have an S
flag associated with them. Any bridge may be assigned an R flag, but it would
not be logical to also assign it to one with an S flag.
Also available is the existing BridgeOV program which has built into it a table of
moments for span lengths from 10’ – 200’ for Class A, B, and C structures. Note,
data above 160-ft is not currently used. Eighty-nine bridges in the MDOT NBI
database have main spans of 160-ft or greater.
4.1.3.2 Data Acquisition
During the Interim Phase, the researchers received two files containing the
vehicle data of actual permit applications involving 8000+ permits. The large
amount of data was sorted electronically by writing a simple program to sift
through the permit vehicle data provided by MDOT and using it in combination
with Excel. The data was sorted by axles and load and then manually reviewed
to select a subset of vehicles which would generate the greatest moments and
reactions. Thirty-one vehicles were selected initially and eventually reduced to
25 vehicles. These 25 vehicles are proposed to be used in Section 4.3.3 to
determine the applicability of the existing permit vehicles to predict actual loads.
A list of the 25 selected vehicles along with a comparison for Class A, B, and C
moments provided in BridgeOV is shown in Appendix D.
The software used for the sorting of the permit vehicle data during this Interim
Phase was enhanced in the Final Phase to include more sorting capabilities. It
was used in the Final Phase of this project to more thoroughly analyze large sets
of permit vehicle data provided by MDOT (see section 5.1.1):

February 25, 2013 [Review and Revision of Overload Permit Classification]
9
ORBP Reference No. OR10-010 Report No. RC-1589
4.1.3.3 MDOT Bridge Demographics
MDOT NBI Demographics
From the NBI data MDOT has submitted to FHWA, some insight can be gained into the
MDOT bridges from their ages, the main span material and span continuity.
Age of Bridges vs. Material Used in Main Span
The chart below shows the material of the main span plotted against the decade in
which the bridge was built.
The large number of steel bridges built between 1950 and 1979 are all now over 40
years of age and entering a stage where deterioration is more probable with
subsequent loss of capacity.
Figure 1. Michigan bridge distribution by decade and bridge type
Relative Simplicity for Analysis
As shown in Table 1, the MDOT bridges lend themselves to analysis by less complex
engineering programs:
Over 90% of the bridges have simple-span main spans of steel, reinforced concrete
or prestressed concrete.
Only 30 steel bridges consisting of 49 main spans (including trusses, arches, box
girders, suspension) are not I girders.
1 5 14 37 80 35 115 71 14 10 14 58 1 0 1
1 34 38 15
49 245
78 121 119
211
2
0
4
1 39
11
2
10
4
23
3
69
3
43
9
10
2
15
51
0
0
200
400
600
800
1000
1200
1890s 1900s 1910s 1920s 1930s 1940s 1950s 1960s 1970s 1980s 1990s 2000s 2010s
Nu
mb
er
of
Bri
dge
s
Decade Built
MDOT Bridges By Decade Built and Main Span Material
Steel
P/S Concrete
Reinf Concrete

February 25, 2013 [Review and Revision of Overload Permit Classification]
10
ORBP Reference No. OR10-010 Report No. RC-1589
The NBI data does not identify girders that are horizontally-curved requiring higher-
order analysis. It is estimated that less than 10% of remaining main steel spans are
curved.
Table 1. Michigan NBI distribution
Number of Bridges Number of Spans
Simple Span
Cont. Span
Total Simple Span
Cont. Span
Total
Reinforced Concrete 356 99 455 462 337 799
Steel 1,626 167 1,793 5,025 976 6,001
Prestressed Concrete 908 6 914 2,242 76 2,318
Other 3 3 5 5
TOTALS 2,893 272 3,165 7,734 1,389 9,123
Overall Bridge Condition
The overall condition of the bridges is good with only 8% being Structurally Deficient at
the time of the query, which would limit the number of re-ratings needed solely due to
deterioration.
Current Bridge Capacity
The MiTRIP class distribution (see Figure 2) was created from the bridge list for MiTRIP
and indicates a large proportion (2816 of 3185 total bridges ~ 89%) of the bridges as
being Class A, meaning that they can safely carry all current Michigan Overload trucks.
The number of S flag bridges (designed for H15 loads) may be under-reported. A
review of the NBI data shows that 386 bridges were built with a design load less
than AASHTO HS20-44.
823 bridges (26% of total) were designed using the AASHTO HS 25 loading.
The apparent discrepancy in values may at least partially be explained as some
bridges had narrow beam spacings such that the H-15 loading would not control and
other bridges may have had deck replacements or other major rehabilitations which
would account for the differences. It is recommended that MDOT further investigate
the individual bridges.

February 25, 2013 [Review and Revision of Overload Permit Classification]
11
ORBP Reference No. OR10-010 Report No. RC-1589
Figure 2. MiTRIP class distribution
Current Bridges with Virtis Ratings Compared to Permit Loads –
The chart provided in Figure 3 shows the number of bridges by main span length along
with 3 vehicles selected from the MDOT permit list and showing the moment ratio of the
vehicle to an HS20 loading.
The ratio of maximum moment for three typical permit vehicles versus HS 20 loading
was plotted for each span range to demonstrate the load demand of modern permit
vehicles.
o For a considerable span range (20-ft to 120-ft) that makes up 90% of MDOT’s
bridges, the maximum moment exceeds 200% of HS20 loading.
o The three vehicles weighing 150 k, 208 k and 289 k each were selected from
actual MDOT permits.
2816
195 102 18 64 3 0
500
1000
1500
2000
2500
3000
A B C D R S
Nu
mb
er o
f B
rid
ges
BridgeOV Capacity Classes
MDOT Bridges BridgeOV Codes

February 25, 2013 [Review and Revision of Overload Permit Classification]
12
ORBP Reference No. OR10-010 Report No. RC-1589
Figure 3. Bridges rated with Virtis ratings
MDOT Virtis DB Demographics
During the Interim Phase, MDOT provided a Virtis bridge database totaling 225 Bridges
to the researchers . All bridges ran through and produced LFR ratings with the
exception of Bridge IDs 527, 617, 717, and 776.
Some or all portions of these bridges did not run through completely. The graphs shown
in Appendix B represent a breakdown of the bridges by year and structure type based
on data extracted from the Virtis database.
Note that the total number of superstructures (545) is larger than the total number of
bridges submitted (225). Virtis permits the entering of multiple superstructure definitions
per bridge; the breakdown shown in the graphs and tables is by structure.
Comparing the Virtis DB breakdown to the bridge breakdown shown in the previous
section reveals the following:
February 25, 2013 [Review and Revision of Overload Permit Classification]
13
ORBP Reference No. OR10-010 Report No. RC-1589
The ‘Year built’ (see Appendix B) for the Virtis DB compares favorably to the ‘Year
Built’ distribution.
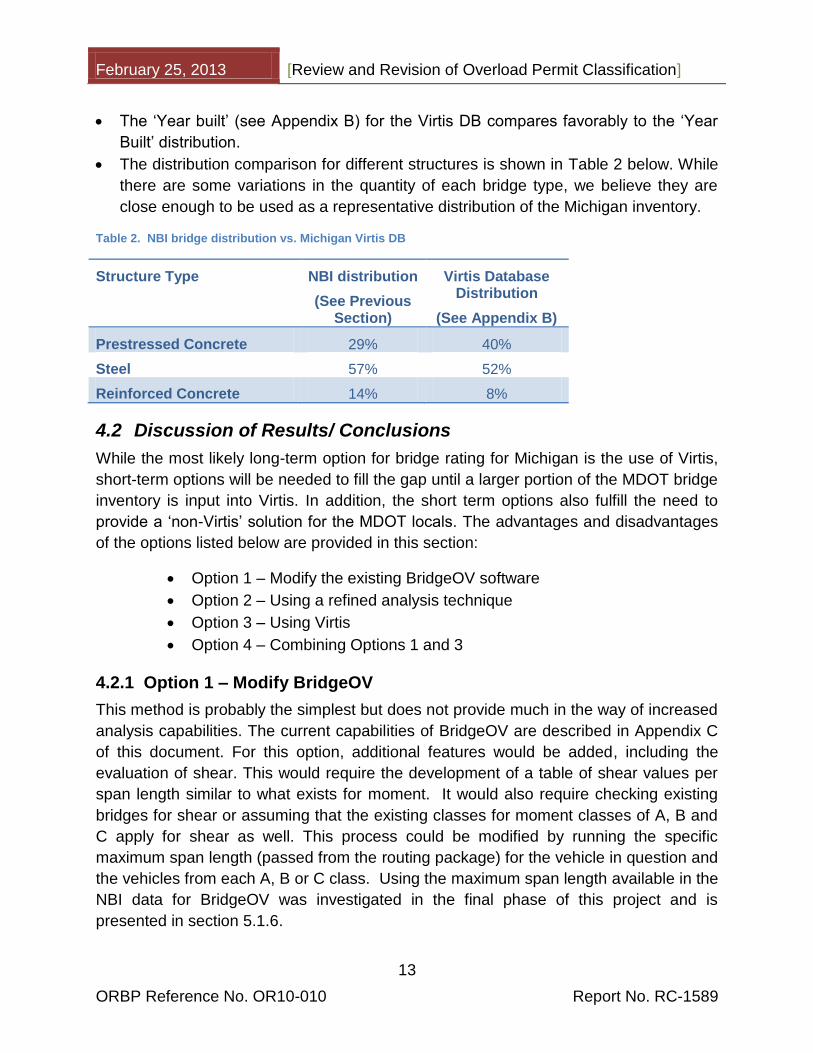
The distribution comparison for different structures is shown in Table 2 below. While
there are some variations in the quantity of each bridge type, we believe they are
close enough to be used as a representative distribution of the Michigan inventory.
Table 2. NBI bridge distribution vs. Michigan Virtis DB
Structure Type NBI distribution
(See Previous Section)
Virtis Database Distribution
(See Appendix B)
Prestressed Concrete 29% 40%
Steel 57% 52%
Reinforced Concrete 14% 8%
4.2 Discussion of Results/ Conclusions
While the most likely long-term option for bridge rating for Michigan is the use of Virtis,
short-term options will be needed to fill the gap until a larger portion of the MDOT bridge
inventory is input into Virtis. In addition, the short term options also fulfill the need to
provide a ‘non-Virtis’ solution for the MDOT locals. The advantages and disadvantages
of the options listed below are provided in this section:
Option 1 – Modify the existing BridgeOV software
Option 2 – Using a refined analysis technique
Option 3 – Using Virtis
Option 4 – Combining Options 1 and 3
4.2.1 Option 1 – Modify BridgeOV
This method is probably the simplest but does not provide much in the way of increased
analysis capabilities. The current capabilities of BridgeOV are described in Appendix C
of this document. For this option, additional features would be added, including the
evaluation of shear. This would require the development of a table of shear values per
span length similar to what exists for moment. It would also require checking existing
bridges for shear or assuming that the existing classes for moment classes of A, B and
C apply for shear as well. This process could be modified by running the specific
maximum span length (passed from the routing package) for the vehicle in question and
the vehicles from each A, B or C class. Using the maximum span length available in the
NBI data for BridgeOV was investigated in the final phase of this project and is
presented in section 5.1.6.

February 25, 2013 [Review and Revision of Overload Permit Classification]
14
ORBP Reference No. OR10-010 Report No. RC-1589
Advantages Disadvantages
Simpler to implement
Does not require direct use of Virtis
Can be modified to include shear
Provides a program that can be used by locals
With the criteria of no new data, this would assume that the existing A, B and C classifications are also adequate for shear
Only uses simple span distribution
Lowest level of analysis
Modifications for BridgeOV for this option would include updates for a more manageable
future maintenance of the programming, functional updates, and updates for further
investigation of the existing Michigan overload vehicles. These include the following,
which are further described in the next sections:
Update BridgeOV to C#.NET
Expand the span length to represent the Michigan bridge demographics
Check or validate the Class A, B and C moments currently built into BridgeOV,
and include new permit vehicles to the envelope if necessary.
Evaluate both existing and new permit vehicles for shear to determine effects
and to justify the inclusion of performing the additional checks
Add shear capabilities for use in conjunction with the moment check and possible
verification of effect of shear on existing structures (shear values imposed cannot
exceed the loadings of the existing permit vehicles, and the new proposed
vehicles may need to be proportioned down from the actual loads to meet
existing evaluation capacities)
Include a graphing option
Possible inclusion of call to Virtis (see Recommendations section)
4.2.1.1 Update BridgeOV to C#.NET
The most current version of BridgeOV is written in the C programming language. For
this option, we propose using C#.NET for Developer Studio 2010. This takes advantage
of the Microsoft programming environment to include additional features for BridgeOV.
The actual calculation routine for the current BridgeOV module is relatively simple, so a
prototype of the C# program is currently working.
Creating the new program also creates a user-friendly environment that can be used by
locals (i.e., outside of TPU as a standalone version).
4.2.1.2 Expand Span Length to Represent the Michigan Bridge Demographics
The current version of BridgeOV only examines spans up to 160’ in length. This can be
modified to 200-ft (the A,B,C class moment file includes span lengths up to 200-ft). It

February 25, 2013 [Review and Revision of Overload Permit Classification]
15
ORBP Reference No. OR10-010 Report No. RC-1589
can be expanded to lengths beyond 200-ft by using Virtis to calculate the A,B,C class
moments for the longer span lengths with the existing overload vehicle loads.
In addition, if the ‘Maximum Span Length’ available from the Michigan NBI data is
passed to BridgeOV, the evaluation of the span lengths could be performed on bridge
lengths from 15-ft up to and including the maximum span length. Another option would
be to continue to use the current process of checking all span lengths for bridges with
spans less than or equal to 160-ft and also to check all span lengths up to the maximum
for all span lengths greater than 160-ft.
4.2.1.3 Validate Class A,B, and C Moments in BridgeOV
The moment tables for Class A, B, and C loads provided in BridgeOV were developed
over 20 years ago and should be reviewed for accuracy. They also should be reviewed
in light of the LRFD Specifications, particularly with respect to live load factors. If new
permit vehicles are to be added to the Class A,B,C envelope, they should be used to
modify the tables.
4.2.1.4 Add Shear Capabilities
The original version of BridgeOV did not have an option to check shear. An option was
proposed and added in the final phase to calculate the shear for the vehicle input. In
order to compare, the Class A, B, and C shear values were computed and placed in a
table similar to the moments. Before adding these capabilities, the researchers
investigated the benefits of adding shear. The results of this investigation are described
in sections 6.1.2 and 6.1.3.
4.2.1.5 Provide Graphing Features
Moving the software to a C#.NET environment allows for additional features to be
added to BridgeOV, such as graphing and enhanced reporting, making it more useful as
a standalone program for local users of the software. A modified BridgeOV prototype is
shown in Figure 4 below. The final modifications to BridgeOV are described in detail in
section 6 of this report. This option would be particularly useful for the evaluation of the
overload vehicles.

February 25, 2013 [Review and Revision of Overload Permit Classification]
16
ORBP Reference No. OR10-010 Report No. RC-1589
Figure 4. BridgeOV prototype
4.2.2 Option 2 – Using a Refined Analysis Technique
This option calls for replacing the existing BridgeOV software with an analysis module
that would provide a more refined and accurate approach for analyzing the bridge. A
FORTRAN module is available that can analyze continuous structures given the span
length configuration. It will analyze both simple and continuous spans and has the
capability to handle hinges and floor beams (if information is available to define these
structural items).
The key for the level of refinement provided by this option is the amount of data
available to properly define the structure; the more data available (e.g., span lengths,
span configuration for multiple spans, cross section information (less likely to be
available), hinges (less likely to be available), etc.), the more refined the analysis. As

February 25, 2013 [Review and Revision of Overload Permit Classification]
17
ORBP Reference No. OR10-010 Report No. RC-1589
more and more data is made available, the closer this moves to Option 3 (Virtis
Analysis).
For this method, in addition to the permit vehicle in question being run, all of the
overload vehicles for the class would need to be run as well. An envelope of shear and
moments for the overload vehicles for the needed class (A, B or C) would be built and
compared with the permit vehicle moments and shears.
Advantages Disadvantages
More refined analysis
Does not require direct use of Virtis
Could potentially run as a standalone
More Refinement requires more data
Required data may not currently be available to pass down from the routing system
Assumes prismatic sections as section property information would likely not be available
This work would ultimately be replaced by Virtis
4.2.3 Option 3 – Using Virtis
Option 3 involves using AASHTO Virtis directly. Using this process would permit the
bridge (or bridge system) to be defined directly and would allow any condition changes
in the structure to be included. This method requires that the bridges in question be
available in a Virtis database. A simple diagram of how this process of running Virtis in
this ‘Batch Mode’ would work is shown in Figure 5. This method has been developed
and is in the process of being tested for Oklahoma DOT. The method relies on the true
bridge description and is still viable when new and improved versions of the software
become available.
Virtis may also be used to consider:
Potential uplift at girder ends on continuous bridges
Increased shear in obtuse corners of sharply skewed bridges (may be critical for
steel)
Non-standard truck gage
Fascia beams

February 25, 2013 [Review and Revision of Overload Permit Classification]
18
ORBP Reference No. OR10-010 Report No. RC-1589
Advantages Disadvantages
Actual analysis of the defined structure
Virtis is continually being upgraded to the latest specification changes
Virtis structures are not currently all
input
Structures that Virtis cannot handle
(e.g. suspension bridges) cannot be
analyzed
Longer run times
Would not benefit local agencies that do not use Virtis
Run Virtis
SUPERLOAD
MiTRIP
Build List
of Bridges
based on
NBI
Number
Input File with
list of bridges
and vehicle
information
Output File
Rating Results
All bridges
Return Results
To MiTRIP
Figure 5. Running Virtis in ‘Batch Mode’
4.2.4 Option 4 – Combination of Option 1 and Option 3
Option 4 provides a hybrid of Options 1 and 3. An example of how this would work is
demonstrated in Figure 6. The idea is that BridgeOV would be utilized much as it is
today but would require using the NBI number. Within BridgeOV, a call would be made
to a copy of the existing Virtis database with a dedicated version of the input datasets to
see if the bridge is in fact present in the current Virtis database. If so, Virtis would be run
and the rating factor returned; if not, the modified version of BridgeOV would be run
(see Figure 6).

February 25, 2013 [Review and Revision of Overload Permit Classification]
19
ORBP Reference No. OR10-010 Report No. RC-1589
Figure 6. Running BridgeOV with Virtis option in ‘Batch Mode’
The ability to run Virtis in this mode would be built on the enhancements to Virtis that
Oklahoma DOT has funded which provide for running Virtis and returning rating factors
in a ‘batch mode’. These enhancements, although initiated by Oklahoma DOT, are
available to all licensees of Virtis.
This method will allow MDOT to begin the transition of using Virtis at an earlier time and
will allow for inclusion of newly input Virtis bridges as they become available. It will also
include the enhancements to BridgeOV as discussed in Option 1.
This option also allows for running this as a standalone program (i.e., without the use of
MiTRIP). Figure 7 shows a similar flowchart but with the initiation of the program coming
from an interface other than MiTRIP. This will be a simple interface that will work with a
group of bridges and a single permit vehicle (see Figure 7). To provide security, for use
by locals, an option can be provided to bypass Virtis.

February 25, 2013 [Review and Revision of Overload Permit Classification]
20
ORBP Reference No. OR10-010 Report No. RC-1589
Figure 7. Running BridgeOV with Virtis using ‘Standalone’
The database for Virtis would need to be dedicated for permitting and would need to be
updated by the bridge group for condition changes. The output provided by the
BridgeOV-Virtis Interface will be of pass/fail variety.

February 25, 2013 [Review and Revision of Overload Permit Classification]
21
ORBP Reference No. OR10-010 Report No. RC-1589
Advantages Disadvantages
BridgeOV Can be modified to include Shear
Can be used as a standalone for local bridges.
Combines benefits of Option 1 and Option 3
Can be used now with a more robust solution in the future as additional Virtis bridges become available
Makes additional and cost-effective use of MDOT’s commitment to Virtis ratings
Can re-evaluate for changed conditions in bridges
Good transition option
Small number of Virtis bridge
currently available
Until more bridges have Virtis
ratings, the disadvantages of Option
1 remain
The time needed to substantially
increase the number of Virtis ratings
4.3 Recommendations
The challenge for implementation will be to provide a short-term solution that can
transition to the ideal long-term solution. The following was recommended at the Interim
Phase of this project:
For a programmatic solution, use Option 4 which implements a short-term
solution with ultimate long-term goals for integrating the Virtis software into the
rating process.
Review the existing Legal Loads and Permit Loads to determine which, if any,
can be eliminated.
Review our sampling of actual loads and determine if any loads need to be
added to the existing group of Michigan permit loads to reflect modern hauling
vehicles.
4.3.1 Use Option 4 – Combination of Option 1 and Option 3
While Option 2 improves the accuracy of review over the BridgeOV review with its
incorporation of multiple span lengths for each bridge, it is not a good strategic solution
because of its immediate need for additional data without the accuracy of Virtis.
Moreover, the Option 2 data doesn’t meet the data needs for the long-term adoption of
Virtis for MDOT bridge ratings.

February 25, 2013 [Review and Revision of Overload Permit Classification]
22
ORBP Reference No. OR10-010 Report No. RC-1589
The researchers believe the best short-term solution is Option 4 (or a combination of
Option 1 (updating BridgeOV) and Option 3 (beginning the integration of Virtis). Of
course, initially the more accurate Virtis analysis would be available only for bridges with
a Virtis dataset, but additional bridges could be added as they are rated for NBIS - short
-term benefits with an integrated long-term Virtis solution.
4.3.2 Reviewing the Existing Loads Using Virtis and BridgeOV
The researchers also recommend the review of the existing permit loads and legal loads
(for comparison with the overloads) to determine if all the individual loads are necessary
to represent the potential permit vehicles and if their moment (and possibly shear)
envelopes represent different loading conditions or if any can be eliminated. With
revisions to BridgeOV and the Virtis database provided, all of the vehicles can be
plotted together or separately.
To perform this task, the existing Michigan legal load and overload vehicles can be
plotted together using BridgeOV results. The researchers can also plot the results of
these vehicles using results of 2 and 3 span continuous bridges to see if any of the
vehicles may be eliminated.
4.3.3 Comparison of Sampling of Permit Vehicles
During the Interim Phase, the researchers reviewed a list of permits provided by MDOT
(see section 4.1.3.2). This set of actual permit applications included axle loads and axle
spacings (gage distances were not included). The researchers reviewed this selection
of permit vehicles using software developed during the interim phase that allowed for
the conversion of the data provide by TPU into a format that could be sorted in a
spreadsheet. This included the conversion of axle spacings from ft-in format into
decimal format and to eliminate duplicate vehicles (i.e. vehicles with identical number of
axles, identical axle spacings and axle loads).
After the conversion of the vehicle data using the software and sorted in a spreadsheet,
it appeared that several of the vehicles were believed to induce greater moments and
almost certainly greater shears than the existing group of permit vehicles. This was
confirmed by reviewing a set of 25 of the permit vehicles using a version of BridgeOV
that was revised for the Interim Phase. The results of this preliminary review of the 25
Michigan permit vehicles is provided in Appendix D.
Based on the review of the 25 permit vehicles described in Appendix D, the list of
vehicles was further reduced and analyzed using the 225 Virtis bridge database
provided by MDOT and the results compared with results for BridgeOV. The results of
this analysis and comparison are provided in Appendix E.

February 25, 2013 [Review and Revision of Overload Permit Classification]
23
ORBP Reference No. OR10-010 Report No. RC-1589
Based on this preliminary permit vehicle review, the researchers recommended a
further review of the permit vehicles. To facilitate this review, MDOT agreed to provide
the following for the final phase of the project:
Virtis input files for a set of 30 continuous span structures
A full year of permit vehicle data (16,000+ vehicles).
The Virtis sample will include additional bridges with the R flag
From the data provided, the following was recommended for the Final Phase of the
project:
Review the new list of permit vehicles. The permit vehicle software started in the
Interim Phase was modified to facilitate this analysis and is provided in the final
software deliverable.
Review the effect of continuity using the database of 30 continuous structures
provided by MDOT.
Determine if some vehicles from the Class A overload category may be
eliminated because they are enveloped by other overload vehicles.
Review the effect of the R flag.

February 25, 2013 [Review and Revision of Overload Permit Classification]
24
ORBP Reference No. OR10-010 Report No. RC-1589
5 Reviewing the Permit Vehicle List and Michigan Overload Vehicles
Michigan DOT provided the researchers a spreadsheet list of Permit vehicles
(axle_weight_spacing7_23_11 to_7_24_12.xls) that was analyzed using software
developed for this project. The overall statistics for the vehicle breakdown are as shown
in Table 3 below.
Table 3. Breakdown of permit vehicle list provided by TPU
Period 4/23/11- 4/24/12
Total Number of Vehicles 16,124
Number of Unique Vehicles 10,006
Number of Duplicate Vehicles 6,118
For the purpose of comparing, duplicate vehicles are ones that have the exact number
of axles, the exact load/axle AND the exact axle spacing. Table 4 below represents the
breakdown of the unique vehicles sent by number of axles. This list of vehicles was
used in comparison of the overload vehicle curves developed for the revised BridgeOV
software.
Table 4. Break down of MDOT permit vehicle set from
#axles Number of Vehicles
1 0 2 21 3 44 4 398 5 4213 6 2334 7 1382 8 889 9 246 10 180 11 157 12 31 13 90 14 2 15 1 16 0 17 0 18 7 19 9 20 2

February 25, 2013 [Review and Revision of Overload Permit Classification]
25
ORBP Reference No. OR10-010 Report No. RC-1589
5.1 Methodology
Since reviewing the analytical results of all 16,000+ vehicles provided by MDOT was
prohibitive, a systematic approach was developed to sort and organize the data to
selectively choose vehicles to be analyzed. This included the following:
Developing software for reading in the permit vehicles and sorting them in
different ways.
Using the revised BridgeOV software to perform the analysis of the software
(see Section 6 of this document for a description of the changes to the BridgeOV
software).
A review of vehicles that were most often permitted (i.e. vehicles with identical
axle spacings and axle loads).
A review of vehicles that appear to have anomalous data, such as unusually
small axle spacings or large loads.
A review of vehicles with the largest axle concentrations (2 axle, 3 axle, 4 axle
and 5 axle).
A review of vehicles with the largest gross weight.
A review of a 5 axle vehicle with 4-ft axle spacings and 24 kip loads. This was
requested directly by MDOT.
A review of the Michigan Overload vehicle list for possible elimination of some
vehicles.
A review of 30 continuous structures provided by MDOT to determine if
BridgeOV is conservative
The effects of using the maximum span length information provided in the NBI
data record for each bridge.
A review of the effects of the proposed Michigan LRFR load factors that vary
with the gross weight of the vehicle.
Note that in all results, the gage distance was not provided in the spreadsheet.
Only axle loads and axle spacings are provided.
The process of developing the above mentioned criteria and the results of the analysis
are described in detail in the following subsections.
5.1.1 Software for Reviewing Permit Data
In the Interim Phase of this project, the Permit Vehicle Analyzer (PVA) software for
analyzing large amounts of permit data was developed. The software works with the
spreadsheets (modified) provided by MDOT and has been used to analyze the permit
data. The software will be delivered to MDOT as a deliverable for use by the MDOT and
local agencies after this research is completed.
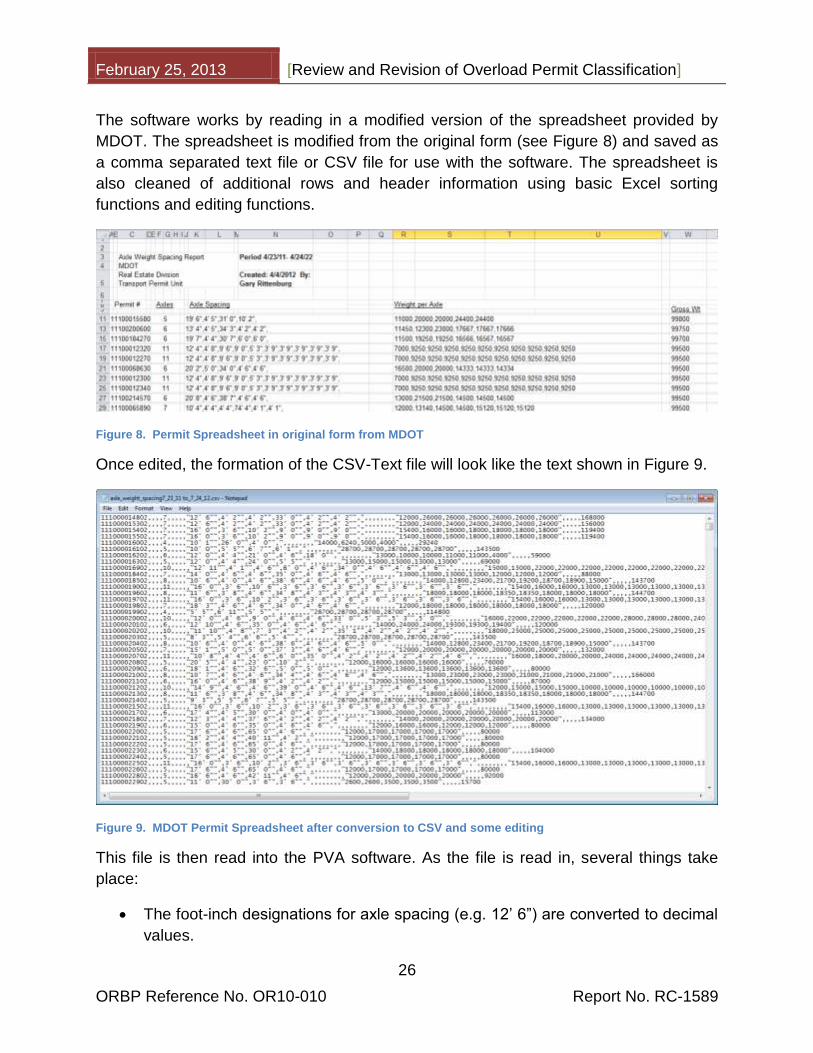
February 25, 2013 [Review and Revision of Overload Permit Classification]
26
ORBP Reference No. OR10-010 Report No. RC-1589
The software works by reading in a modified version of the spreadsheet provided by
MDOT. The spreadsheet is modified from the original form (see Figure 8) and saved as
a comma separated text file or CSV file for use with the software. The spreadsheet is
also cleaned of additional rows and header information using basic Excel sorting
functions and editing functions.
Figure 8. Permit Spreadsheet in original form from MDOT
Once edited, the formation of the CSV-Text file will look like the text shown in Figure 9.
Figure 9. MDOT Permit Spreadsheet after conversion to CSV and some editing
This file is then read into the PVA software. As the file is read in, several things take
place:
The foot-inch designations for axle spacing (e.g. 12’ 6”) are converted to decimal
values.

February 25, 2013 [Review and Revision of Overload Permit Classification]
27
ORBP Reference No. OR10-010 Report No. RC-1589
Duplicate vehicles are detected and marked.
The vehicles are stored into memory and can then be manipulated or analyzed.
The vehicles that are selected as the results of an analysis may be saved as
BridgeOV input files or Virtis XML vehicle files or moved to an excel spreadsheet.
A sample of the interface is shown in Figure 10. A more detailed description of the
functionality of the PVA software and the process for converting the spreadsheet into
the necessary CSV file are provided in Section 10.4.1 of this documentation.
Figure 10. MDOT Permit Vehicle Analyzer (PVA) software

February 25, 2013 [Review and Revision of Overload Permit Classification]
28
ORBP Reference No. OR10-010 Report No. RC-1589
5.1.2 Duplicate Vehicles
Using the PVA software, the top vehicle frequencies were identified (i.e. the maximum
occurrences of duplicate vehicles). The vehicles with duplicates greater than or equal to
15 are shown in Figure 11. These vehicles were reviewed to get a sense of the effect on
the most duplicated vehicles in the system.
Figure 11. Frequency of duplicate vehicles
Running these vehicles through BridgeOV produces the graphs shown in Figure 12
through Figure 17.

February 25, 2013 [Review and Revision of Overload Permit Classification]
29
ORBP Reference No. OR10-010 Report No. RC-1589
Figure 12. BridgeOV Moment ratio of top 40 duplicate vehicles
Figure 13. BridgeOV Shear (simple span) for top 40 duplicate vehicles

February 25, 2013 [Review and Revision of Overload Permit Classification]
30
ORBP Reference No. OR10-010 Report No. RC-1589
Figure 14. BridgeOV Shear (2-span) for top 40 duplicate vehicles
Figure 15. BridgeOV Moment ratio envelope of top 40 duplicate vehicles

February 25, 2013 [Review and Revision of Overload Permit Classification]
31
ORBP Reference No. OR10-010 Report No. RC-1589
Figure 16. BridgeOV Shear (simple span) envelope for top 40 duplicate vehicles
Figure 17. BridgeOV Shear (2-span) envelope for top 40 duplicate vehicles
The figures showing the individual plots (Figure 12, Figure 13, and Figure 14), indicate
that several of the vehicles fall below the Class A,B, and C line, while the enveloped
figures provide an overall view of these 40 vehicles. Several of the vehicles exceed
Class B and C, but none exceed Class A. A summary of the vehicle set and which
exceed the class curves are provided in Table 5. The vehicles that exceed at least one
span length for 1 class are highlighted in green. Plotting the highlighted vehicles alone
yields the moment curve shown in Figure 18, Figure 19, and Figure 20.

February 25, 2013 [Review and Revision of Overload Permit Classification]
32
ORBP Reference No. OR10-010 Report No. RC-1589
Figure 18. BridgeOV Moment ratio of critical duplicate vehicles
Figure 19. BridgeOV Shear (simple span) for critical duplicate vehicles
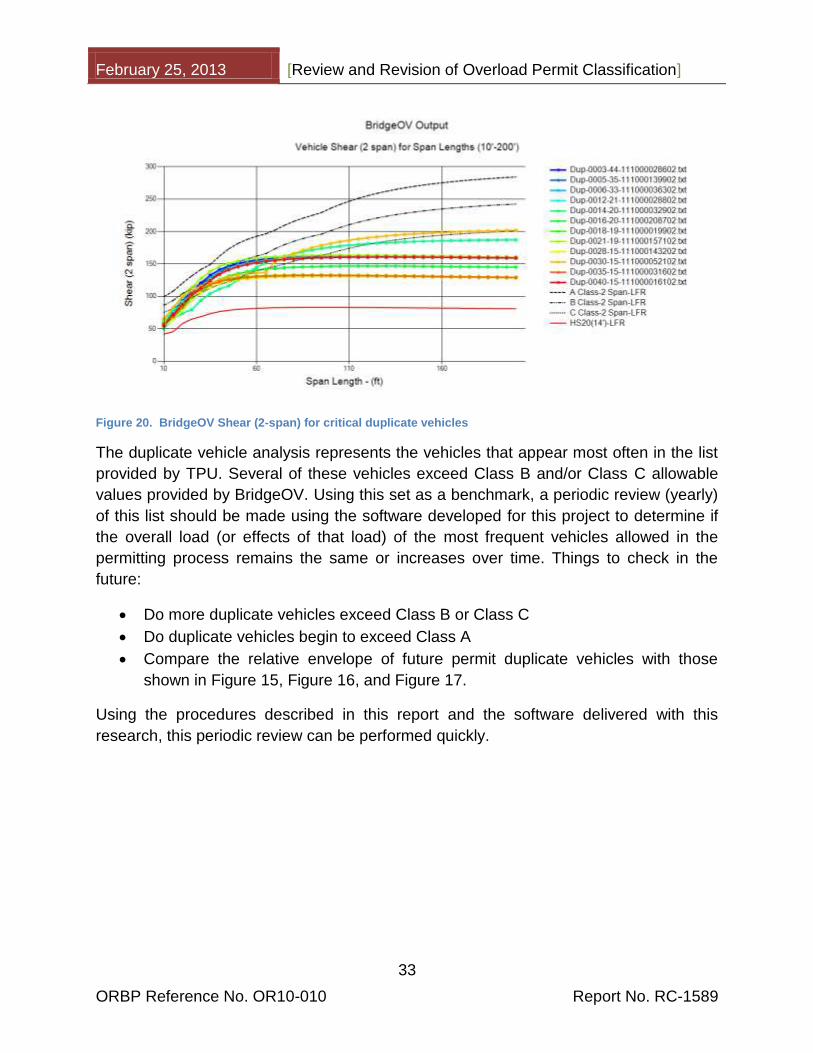
February 25, 2013 [Review and Revision of Overload Permit Classification]
33
ORBP Reference No. OR10-010 Report No. RC-1589
Figure 20. BridgeOV Shear (2-span) for critical duplicate vehicles
The duplicate vehicle analysis represents the vehicles that appear most often in the list
provided by TPU. Several of these vehicles exceed Class B and/or Class C allowable
values provided by BridgeOV. Using this set as a benchmark, a periodic review (yearly)
of this list should be made using the software developed for this project to determine if
the overall load (or effects of that load) of the most frequent vehicles allowed in the
permitting process remains the same or increases over time. Things to check in the
future:
Do more duplicate vehicles exceed Class B or Class C
Do duplicate vehicles begin to exceed Class A
Compare the relative envelope of future permit duplicate vehicles with those
shown in Figure 15, Figure 16, and Figure 17.
Using the procedures described in this report and the software delivered with this
research, this periodic review can be performed quickly.

February 25, 2013 [Review and Revision of Overload Permit Classification]
34
ORBP Reference No. OR10-010 Report No. RC-1589
Table 5. Review of most frequent vehicle duplicates using BridgeOV
Vehicle IDPermit ID
Number
Duplicates
Num
Axles
Gross
Weight
Vehicle
LengthA B C A B C
Shear 2-
Span A
Shear 2-
Span B
Shear 2
Span C
Dup-0001 111000083202 88 8 119.0 67.6
Dup-0002 111000037602 50 8 146.0 71.7
Dup-0003 111000028602 44 5 143.5 25.8 x x x x x x
Dup-0004 111000173302 37 5 80.0 66.5
Dup-0005 111000139902 35 5 143.5 27.8 x x x x x x
Dup-0006 111000036302 33 5 143.5 27.7 x x x x x x
Dup-0007 111000178502 29 4 17.8 50.2
Dup-0008 111000227702 27 5 80.0 59.0
Dup-0009 111000146702 26 5 80.0 63.0
Dup-0010 111000154502 22 6 89.0 56.4
Dup-0011 111000174502 21 5 80.0 61.0
Dup-0012 111000028802 21 5 143.5 27.1 x x x x x
Dup-0013 111001437602 20 5 64.0 70.3
Dup-0014 111000032902 20 8 175.6 51.9 x x x
Dup-0015 111000176302 20 5 80.0 63.0
Dup-0016 111000208702 20 5 130.3 27.0 x x x
Dup-0017 111000115702 19 5 94.0 51.8
Dup-0018 111000019902 19 4 114.8 17.8 x x x
Dup-0019 111000731500 19 5 78.0 141.4
Dup-0020 111000147402 19 5 80.0 61.6
Dup-0021 111000157102 19 5 143.5 23.8 x x x x x x
Dup-0022 111000037302 18 5 80.0 65.2
Dup-0023 111001332702 17 5 70.0 65.0
Dup-0024 111000174002 17 5 80.0 61.8
Dup-0025 111000378802 16 4 96.0 23.8
Dup-0026 111000139402 16 5 80.0 65.7
Dup-0027 111000192502 16 5 80.0 53.7
Dup-0028 111000143202 15 4 114.4 20.8 x x
Dup-0029 111000056202 15 5 80.0 68.7
Dup-0030 111000052102 15 8 193.5 67.1 x x x x
Dup-0031 111000203202 15 9 96.0 93.6
Dup-0032 111000195702 15 6 112.0 64.8
Dup-0033 111000421102 15 5 24.0 47.0
Dup-0034 111001218702 15 9 135.0 98.6
Dup-0035 111000031602 15 4 114.8 18.7 x x x
Dup-0036 111000186602 15 5 80.0 66.9
Dup-0037 111000186002 15 5 70.0 65.7
Dup-0038 111000963002 15 5 80.0 62.8
Dup-0039 111001298402 15 5 70.0 55.0
Dup-0040 111000016102 15 5 143.5 28.1 x x x x x
Exceeds Moment Exceeds Shear (Simple Span) Exceeds Shear (2 span)

February 25, 2013 [Review and Revision of Overload Permit Classification]
35
ORBP Reference No. OR10-010 Report No. RC-1589
5.1.3 Vehicle Anomalies
During the sorting of the vehicles by axle concentrations (see following section), it was
noticed that some apparent anomalies occur in the data provided by MDOT. Table 6
represents vehicles that have an axle spacing less than 1.5’. Similarly, looking at axle
loads that appear too small yields permit vehicles with an axle load that less than 1.1
kips (see Table 7)
These values could be the result of the following possibilities
1. Input error
2. Error translating the routing information to the Excel spreadsheet
3. The small spacing or loading provided was intended for some reason
4. Error in translating the Excel spreadsheet provided by MDOT
We have ruled out the second item by manually reviewing the original spreadsheet for
each of the permit vehicles shown in Table 6 and Table 7 to verify the spacing and
loading. If these values are indeed in error, we recommend that a check be placed in
the routing system for consistency (i.e. reasonable upper and lower bounds).
Table 6. Possible errors in axle spacing
Table 7. Possible errors with axle loads
Permit IDNum
Axles
Gross
Weight
Vehicle
Length
Axle
Spacing 1
Axle
Spacing 2
Axle
Spacing 3
Axle
Spacing 4
Axle
Spacing 5
Axle
Spacing 6
Axle
Load 1
Axle
Load 2
Axle
Load 3
Axle
Load 4
Axle
Load 5
Axle
Load 6
Axle
Load 7
111001973902 4 12 29 10 15 4 5.0 5.0 1.0 1.0
111002017102 4 10 24 12 8 4 4.0 4.0 1.0 1.0
111000444902 4 4 20 7 10 3 1.0 1.0 1.0 1.0
111000666702 4 14.5 33 10 20 3 1.5 1.0 6.0 6.0
112009528302 4 8 26 10 12 4 3.0 3.0 1.0 1.0
111000003402 4 6 34 15 15 4 2.0 2.0 1.0 1.0
111000171102 5 45 52 18 26 4 4 1.0 14.0 10.0 10.0 10.0
111000483402 5 18.427 19 7 7 2.5 2.5 5.0 1.1 4.1 4.1 4.1
111001985302 5 10 36 12 18 3 3 3.5 3.5 1.0 1.0 1.0
111001556202 6 65 57.5 20 4.5 24 4.5 4.5 8.0 12.0 12.0 16.0 16.0 1.0 0.0
111001157102 6 10 36 20 4 4 4 4 5.0 1.0 1.0 1.0 1.0 1.0 0.0
111001103102 7 16 40 20 4 4 4 4 4 10.0 1.0 1.0 1.0 1.0 1.0 1.0
111000914302 7 7.105 72 11 51 2.5 2.5 2.5 2.5 1.0 1.0 1.0 1.0 1.0 1.0 1.0
Permit IDNum
Axles
Gross
Weight
Vehicle
Length
Axle
Spacing 1
Axle
Spacing 2
Axle
Spacing 3
Axle
Spacing 4
Axle
Spacing 5
Axle
Spacing 6
Axle
Spacing 7
Axle
Spacing 8
Axle
Spacing 9
Axle
Spacing
10
111000844502 6 112.0 48.3 0.50 4.33 35.08 4.17 4.17
111000949702 11 221.0 78.1 10.50 4.33 4.50 6.42 0.33 35.00 4.17 4.17 4.17 4.50
111001384802 5 72.0 51.0 11.00 1.00 35.00 4.00
111001935002 6 108.3 57.2 15.17 4.17 33.00 4.50 0.33
111002178802 9 100.0 91.5 21.50 0.33 14.67 5.00 5.00 35.00 5.00 5.00

February 25, 2013 [Review and Revision of Overload Permit Classification]
36
ORBP Reference No. OR10-010 Report No. RC-1589
5.1.4 Axle Concentrations
Vehicles with heavy concentrations of axle load will likely govern shear and/or moment
calculations. The PVA software written for this project has the capability to sort through
a large number of vehicles to determine the largest 2, 3, 4 and 5 axle concentrations.
This process of reviewing short, heavy trucks was performed using the PVA software
which calculates the concentration of axles of all permit vehicles submitted by MDOT.
The vehicles with the largest 2, 3, 4, and 5 axle concentrations were reviewed and
plotted using BridgeOV to try to determine the effects of these vehicles. To determine
the vehicle concentration, each set of axles for the whole vehicle is analyzed to
determine the largest concentration by distributing those axles over the spacing
between them.
For example, for the vehicle shown in Figure 21 the 2 and 3 wheel concentrations would
be as shown in Table 8.
Figure 21. Axle concentration example

February 25, 2013 [Review and Revision of Overload Permit Classification]
37
ORBP Reference No. OR10-010 Report No. RC-1589
Table 8. Calculation of 2 and 3 axle concentrations
2 Axle Concentration Calculation Maximum Value
(Axle 1 Load + Axle 2 Load) / Axle 1 Spacing
(19.6 + 19.6)/ 4.5 8.71
(Axle 2 Load + Axle 3 Load) / Axle 2 Spacing
(19.6 + 39.0)/ 14.17 4.13
(Axle 3 Load + Axle 4 Load) / Axle 3 Spacing
(39 + 39) /4.5 17.33
3 Axle Concentration Calculation Maximum Value
(Axle 1 Load + Axle 2 Load + Axle Load 3) / (Axle 1 Spacing + Axle 2 Spacing)
(19.6 + 19.6 + 39)/ (4.5 + 14.17)
4.19
(Axle 2 Load + Axle 3 Load + Axle 4) / (Axle 2 Spacing + Axle 3 Spacing)
(19.6 + 39.0 + 39)/ (14.17 + 4.5)
5.23

February 25, 2013 [Review and Revision of Overload Permit Classification]
38
ORBP Reference No. OR10-010 Report No. RC-1589
5.1.4.1 Two-Axle Concentrations
Using the PVA software, the largest 2-axle concentrations were determined as shown in
Table 9.
Table 9. Largest 2-axle vehicle concentrations
Permit ID Permit #Number
Duplicates
Num
Axles
Gross
Weight
Vehicle
Length
2 axle
Conc
3 axle
Conc
4 axle
Conc
5 axle
Conc
111000949702* 2AC-0001 0 11 221.0 78.1 120.00 8.89 7.11 6.47
111001935002* 2AC-0002 0 6 108.3 57.2 112.50 11.64 2.02 2.29
111002178802* 2AC-0003 0 9 100.0 91.5 81.00 3.30 2.15 2.04
111000844502** 2AC-0004 0 6 112.0 48.3 64.00 10.76 1.84 2.09
111001384802*** 2AC-0005 0 5 72.0 51.0 32.00 3.33 1.60 1.41
111001324800 2AC-0006 0 9 289.2 89.8 22.09 9.75 8.83 5.15
111000981202 2AC-0007 1 6 165.4 42.0 20.00 15.00 4.44 5.00
111000336602 2AC-0008 1 8 105.0 58.0 18.00 6.67 5.05 1.48
111000073202 2AC-0009 7 4 117.2 23.2 17.33 5.23 5.06 0.00
111001246502 2AC-0010 0 4 114.2 22.8 16.98 5.14 5.00 0.00
111000136102 2AC-0011 1 4 115.0 28.0 16.84 4.06 4.11 0.00
111000345102 2AC-0012 1 4 114.2 23.0 16.67 5.11 4.97 0.00
111000320302 2AC-0013 0 5 71.3 61.0 16.24 3.62 1.43 1.17
111000958902 2AC-0014 0 4 117.6 26.5 16.22 4.52 4.44 0.00
111000469500 2AC-0015 0 8 208.0 70.3 16.12 12.07 10.72 3.35
111000393900 2AC-0016 0 15 480.0 221.4 16.00 8.72 8.53 5.07
111001883502 2AC-0017 0 9 217.6 72.0 15.40 10.70 6.57 6.00
111000273402 2AC-0018 2 6 150.2 29.9 15.20 11.17 5.34 5.16
111000858702 2AC-0019 0 6 127.4 42.0 14.93 11.20 3.32 3.73
111000761002 2AC-0020 0 4 96.0 23.3 14.79 4.42 4.11 0.00
111001569902 2AC-0021 0 7 163.6 56.3 14.78 6.60 5.87 3.26
111000296500 2AC-0022 0 5 111.0 59.9 14.75 3.49 1.97 1.85
111000439302 2AC-0023 3 6 114.3 51.2 14.67 11.00 2.25 2.53
111000898802 2AC-0024 0 6 150.0 61.5 14.62 10.96 2.41 2.78
111000564402 2AC-0025 0 6 145.0 61.5 14.51 10.88 2.39 2.76
111000478902 2AC-0026 1 8 219.0 68.3 14.50 10.35 8.62 2.95
111001046502 2AC-0027 0 6 140.0 63.5 14.29 10.71 2.38 2.75
111000547600 2AC-0028 0 8 163.2 70.3 14.28 10.00 8.43 2.65
111000685100 2AC-0029 0 8 163.2 70.3 14.28 9.99 8.43 2.65
111000122002 2AC-0030 0 9 234.6 72.3 14.22 10.39 7.57 6.84
111002057700 2AC-0031 0 8 161.1 70.3 14.10 9.87 8.32 2.62
*contains an axle spacing of 0.33'
** Contains an axle spacing of 0.5'
*** Contains an axle spacing of 1.0'
Note that the top five axle combinations have some small axle spacings that appear to
be suspect. Running BridgeOV using just these 5 vehicles yields the moment/ shear
plots shown in Figure 22 and Figure 23. Even though the suspect spacing could yield
results that could skew the results of the entire permit set, in this case only one of the
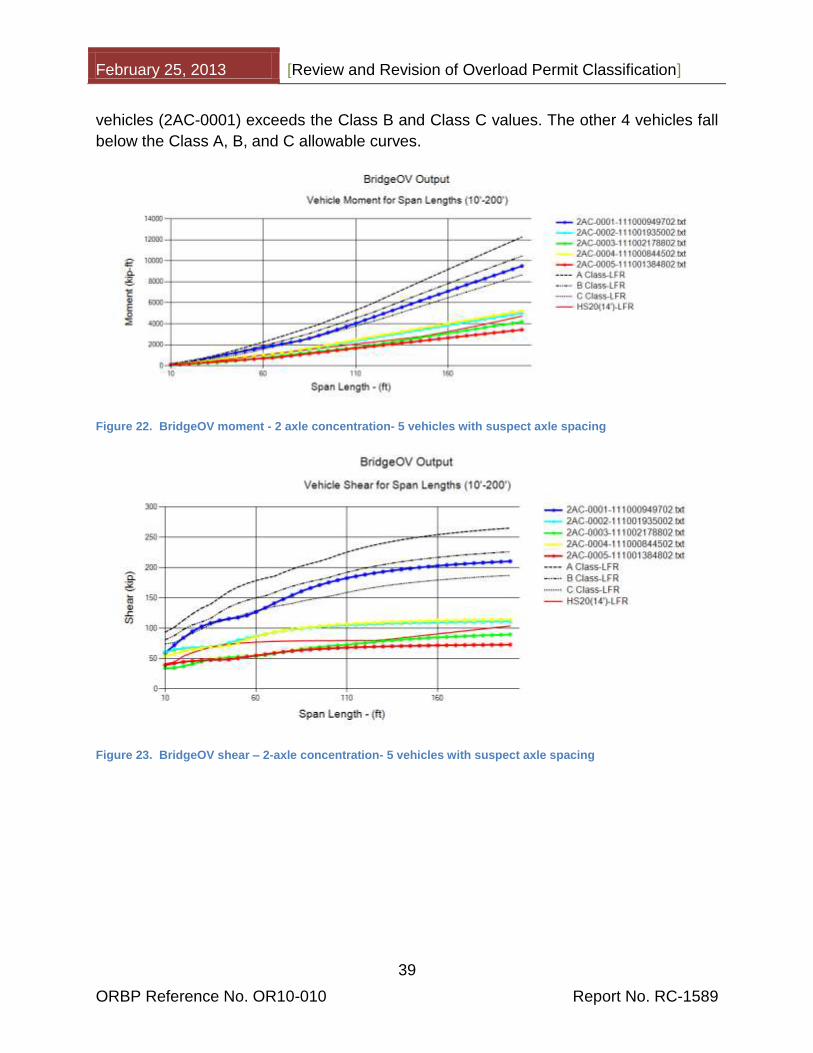
February 25, 2013 [Review and Revision of Overload Permit Classification]
39
ORBP Reference No. OR10-010 Report No. RC-1589
vehicles (2AC-0001) exceeds the Class B and Class C values. The other 4 vehicles fall
below the Class A, B, and C allowable curves.
Figure 22. BridgeOV moment - 2 axle concentration- 5 vehicles with suspect axle spacing
Figure 23. BridgeOV shear – 2-axle concentration- 5 vehicles with suspect axle spacing
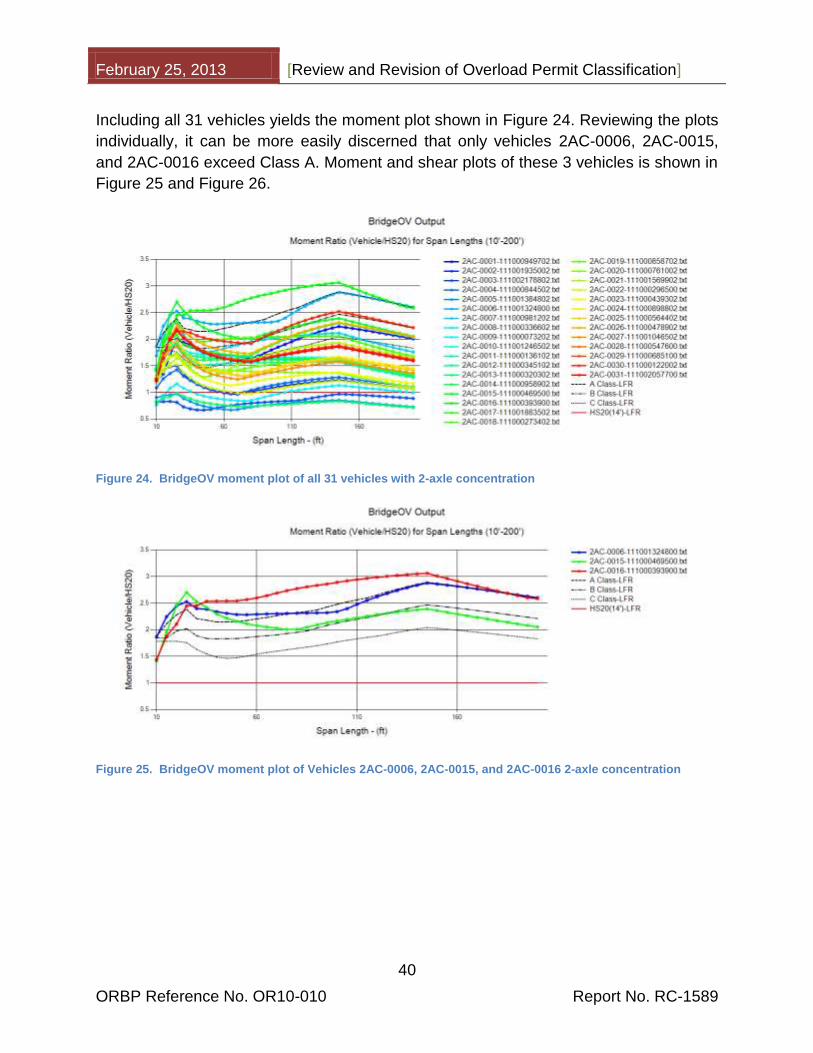
February 25, 2013 [Review and Revision of Overload Permit Classification]
40
ORBP Reference No. OR10-010 Report No. RC-1589
Including all 31 vehicles yields the moment plot shown in Figure 24. Reviewing the plots
individually, it can be more easily discerned that only vehicles 2AC-0006, 2AC-0015,
and 2AC-0016 exceed Class A. Moment and shear plots of these 3 vehicles is shown in
Figure 25 and Figure 26.
Figure 24. BridgeOV moment plot of all 31 vehicles with 2-axle concentration
Figure 25. BridgeOV moment plot of Vehicles 2AC-0006, 2AC-0015, and 2AC-0016 2-axle concentration

February 25, 2013 [Review and Revision of Overload Permit Classification]
41
ORBP Reference No. OR10-010 Report No. RC-1589
Figure 26. BridgeOV Shear plot of vehicles MiPer0006, MiPer0015, and MiPer0016 2-axle concentration
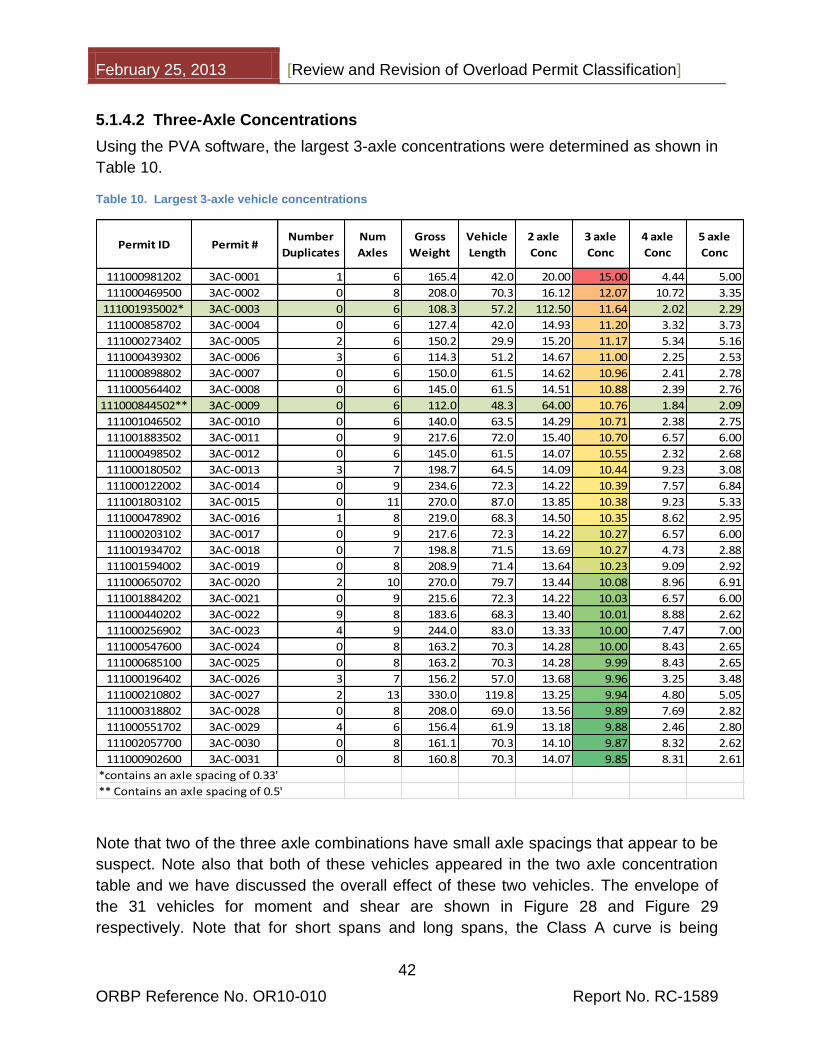
February 25, 2013 [Review and Revision of Overload Permit Classification]
42
ORBP Reference No. OR10-010 Report No. RC-1589
5.1.4.2 Three-Axle Concentrations
Using the PVA software, the largest 3-axle concentrations were determined as shown in
Table 10.
Table 10. Largest 3-axle vehicle concentrations
Permit ID Permit #Number
Duplicates
Num
Axles
Gross
Weight
Vehicle
Length
2 axle
Conc
3 axle
Conc
4 axle
Conc
5 axle
Conc
111000981202 3AC-0001 1 6 165.4 42.0 20.00 15.00 4.44 5.00
111000469500 3AC-0002 0 8 208.0 70.3 16.12 12.07 10.72 3.35
111001935002* 3AC-0003 0 6 108.3 57.2 112.50 11.64 2.02 2.29
111000858702 3AC-0004 0 6 127.4 42.0 14.93 11.20 3.32 3.73
111000273402 3AC-0005 2 6 150.2 29.9 15.20 11.17 5.34 5.16
111000439302 3AC-0006 3 6 114.3 51.2 14.67 11.00 2.25 2.53
111000898802 3AC-0007 0 6 150.0 61.5 14.62 10.96 2.41 2.78
111000564402 3AC-0008 0 6 145.0 61.5 14.51 10.88 2.39 2.76
111000844502** 3AC-0009 0 6 112.0 48.3 64.00 10.76 1.84 2.09
111001046502 3AC-0010 0 6 140.0 63.5 14.29 10.71 2.38 2.75
111001883502 3AC-0011 0 9 217.6 72.0 15.40 10.70 6.57 6.00
111000498502 3AC-0012 0 6 145.0 61.5 14.07 10.55 2.32 2.68
111000180502 3AC-0013 3 7 198.7 64.5 14.09 10.44 9.23 3.08
111000122002 3AC-0014 0 9 234.6 72.3 14.22 10.39 7.57 6.84
111001803102 3AC-0015 0 11 270.0 87.0 13.85 10.38 9.23 5.33
111000478902 3AC-0016 1 8 219.0 68.3 14.50 10.35 8.62 2.95
111000203102 3AC-0017 0 9 217.6 72.3 14.22 10.27 6.57 6.00
111001934702 3AC-0018 0 7 198.8 71.5 13.69 10.27 4.73 2.88
111001594002 3AC-0019 0 8 208.9 71.4 13.64 10.23 9.09 2.92
111000650702 3AC-0020 2 10 270.0 79.7 13.44 10.08 8.96 6.91
111001884202 3AC-0021 0 9 215.6 72.3 14.22 10.03 6.57 6.00
111000440202 3AC-0022 9 8 183.6 68.3 13.40 10.01 8.88 2.62
111000256902 3AC-0023 4 9 244.0 83.0 13.33 10.00 7.47 7.00
111000547600 3AC-0024 0 8 163.2 70.3 14.28 10.00 8.43 2.65
111000685100 3AC-0025 0 8 163.2 70.3 14.28 9.99 8.43 2.65
111000196402 3AC-0026 3 7 156.2 57.0 13.68 9.96 3.25 3.48
111000210802 3AC-0027 2 13 330.0 119.8 13.25 9.94 4.80 5.05
111000318802 3AC-0028 0 8 208.0 69.0 13.56 9.89 7.69 2.82
111000551702 3AC-0029 4 6 156.4 61.9 13.18 9.88 2.46 2.80
111002057700 3AC-0030 0 8 161.1 70.3 14.10 9.87 8.32 2.62
111000902600 3AC-0031 0 8 160.8 70.3 14.07 9.85 8.31 2.61
*contains an axle spacing of 0.33'
** Contains an axle spacing of 0.5'
Note that two of the three axle combinations have small axle spacings that appear to be
suspect. Note also that both of these vehicles appeared in the two axle concentration
table and we have discussed the overall effect of these two vehicles. The envelope of
the 31 vehicles for moment and shear are shown in Figure 28 and Figure 29
respectively. Note that for short spans and long spans, the Class A curve is being

February 25, 2013 [Review and Revision of Overload Permit Classification]
43
ORBP Reference No. OR10-010 Report No. RC-1589
exceeded by vehicles 3AC-0002 and 3AC-0027 (see Figure 27). This is more clearly
seen in an envelope plot of these vehicles with the points labeled with the controlling
vehicle (see Figure 28). This trend continues for the shear curve envelope again with
the 3AC-0002 governing for short spans and exceeding the Class A curve and the 3AC-
0027 governing for long spans and exceeding the Class A curve (see Figure 29). Note
also, that for the longer span structures that the shear is greater than Class A beginning
around 160-ft (see Figure 29) while the moment Class A curve is not exceeded until
around 225-ft (see Figure 28). This point accentuates the desirability to have both
moment and shear checks in BridgeOV.
Figure 27. BridgeOV Moment plot of all 31 vehicles with 3-axle concentration
Figure 28. BridgeOV moment plot of 3-axle concentrations – Envelope of top 31 concentrations
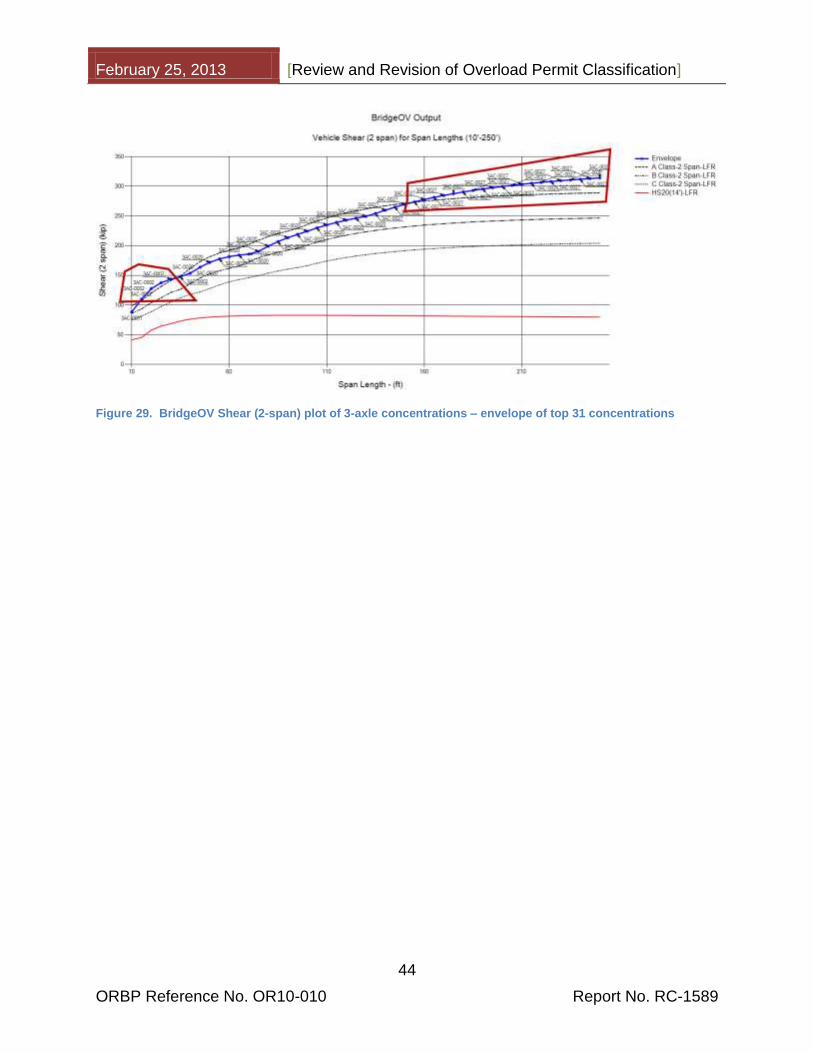
February 25, 2013 [Review and Revision of Overload Permit Classification]
44
ORBP Reference No. OR10-010 Report No. RC-1589
Figure 29. BridgeOV Shear (2-span) plot of 3-axle concentrations – envelope of top 31 concentrations

February 25, 2013 [Review and Revision of Overload Permit Classification]
45
ORBP Reference No. OR10-010 Report No. RC-1589
5.1.4.3 Four-Axle Concentrations
Using the PVA software, the largest 4-axle concentrations were determined as shown in
Table 11.
Table 11. Largest 4-axle vehicle concentrations
Permit ID Permit #Number
Duplicates
Num
Axles
Gross
Weight
Vehicle
Length
2 axle
Conc
3 axle
Conc
4 axle
Conc
5 axle
Conc
111000469500 4AC-0001 0 8 208.0 70.3 16.12 12.07 10.72 3.35
111001803102 4AC-0002 0 11 270.0 87.0 13.85 10.38 9.23 5.33
111000180502 4AC-0003 3 7 198.7 64.5 14.09 10.44 9.23 3.08
111001594002 4AC-0004 0 8 208.9 71.4 13.64 10.23 9.09 2.92
111000650702 4AC-0005 2 10 270.0 79.7 13.44 10.08 8.96 6.91
111000440202 4AC-0006 9 8 183.6 68.3 13.40 10.01 8.88 2.62
111001324700 4AC-0007 0 9 277.8 89.8 20.00 9.75 8.83 4.81
111002004302 4AC-0008 0 8 188.0 67.8 14.00 9.75 8.67 2.85
111000202302 4AC-0009 12 9 216.0 74.5 12.96 9.72 8.64 4.32
111000478902 4AC-0010 1 8 219.0 68.3 14.50 10.35 8.62 2.95
111000393900 4AC-0011 0 15 480.0 221.4 16.00 8.72 8.53 5.07
111000267102 4AC-0012 1 10 251.0 84.4 12.73 9.55 8.49 6.14
111000427902 4AC-0013 0 8 222.0 58.5 13.56 9.89 8.44 3.81
111001963802 4AC-0014 0 7 171.3 64.3 12.74 9.55 8.44 2.65
111000547600 4AC-0015 0 8 163.2 70.3 14.28 10.00 8.43 2.65
111000685100 4AC-0016 0 8 163.2 70.3 14.28 9.99 8.43 2.65
111000159802 4AC-0017 14 9 213.0 74.5 12.96 9.72 8.40 4.32
111001738902 4AC-0018 1 8 193.9 71.4 12.59 9.44 8.39 2.70
111002057700 4AC-0019 0 8 161.1 70.3 14.10 9.87 8.32 2.62
111000552802 4AC-0020 3 10 252.0 79.7 12.48 9.36 8.32 6.42
111000902600 4AC-0021 0 8 160.8 70.3 14.07 9.85 8.31 2.61
111001315302 4AC-0022 1 8 196.0 76.7 12.44 9.33 8.30 2.50
111000905002 4AC-0023 0 7 169.2 64.3 12.58 9.41 8.20 2.60
111000181002 4AC-0024 14 7 183.8 71.5 13.54 9.18 8.16 2.52
111001129502 4AC-0025 0 8 180.0 56.0 12.21 9.16 8.14 3.39
111000020202 4AC-0026 1 10 243.0 79.7 12.00 9.00 8.00 6.17
111000052102 4AC-0027 15 8 193.5 67.1 12.00 9.00 8.00 2.78
111000659602 4AC-0028 3 8 202.5 72.8 12.28 8.90 7.91 2.90
111000359302 4AC-0029 0 7 155.2 63.2 11.89 8.85 7.87 2.49
111002138002 4AC-0030 0 10 210.0 65.5 11.76 8.82 7.84 6.76
111000765702 4AC-0031 0 7 172.8 65.0 13.69 8.75 7.78 3.00
Note that none of the four axle combinations have any axle spacings that appear to be
suspect. The envelope of the 31 vehicles for shear and moment are shown in Figure 30
and Figure 31. The dominant vehicle in these plots is 4AC-0011 which has a gross
weight of 480 kips. Removing this vehicle from the set yields the moment and shear
envelope plots shown in Figure 32 and Figure 33. Note that for these plots, many of the
spans drop below the Class A curve, however, shorter span bridges are affected with
values above the Class A curve.
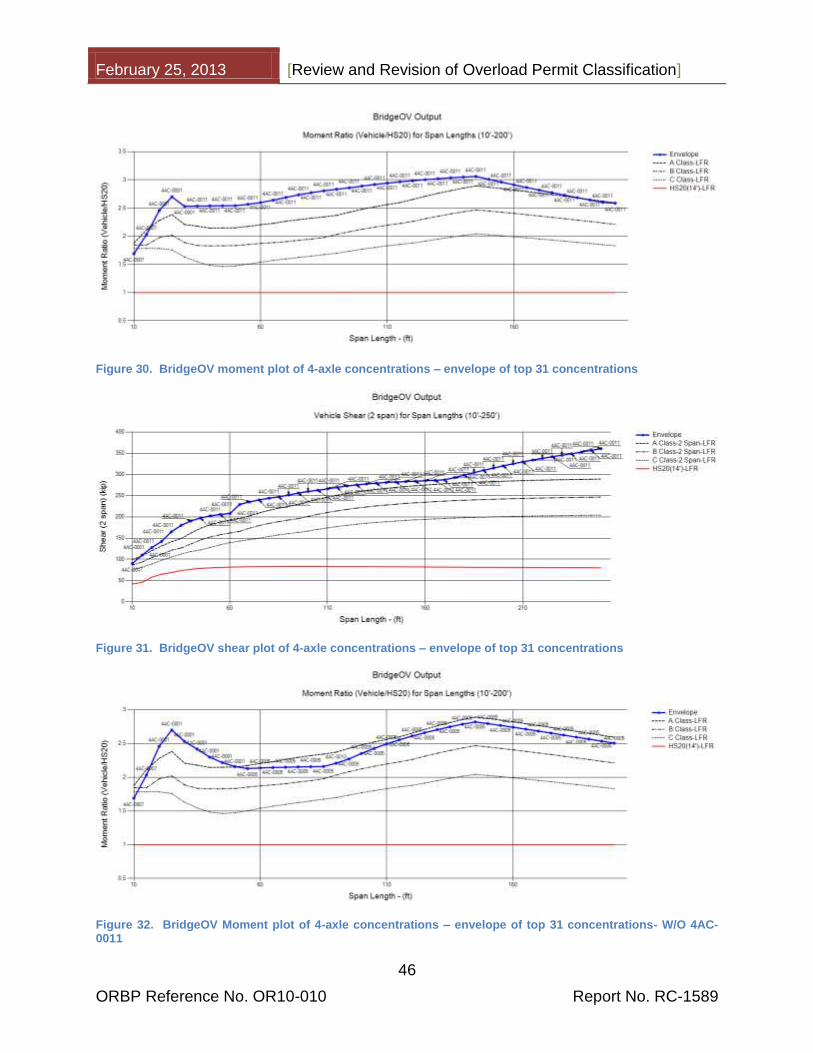
February 25, 2013 [Review and Revision of Overload Permit Classification]
46
ORBP Reference No. OR10-010 Report No. RC-1589
Figure 30. BridgeOV moment plot of 4-axle concentrations – envelope of top 31 concentrations
Figure 31. BridgeOV shear plot of 4-axle concentrations – envelope of top 31 concentrations
Figure 32. BridgeOV Moment plot of 4-axle concentrations – envelope of top 31 concentrations- W/O 4AC-0011

February 25, 2013 [Review and Revision of Overload Permit Classification]
47
ORBP Reference No. OR10-010 Report No. RC-1589
Figure 33. BridgeOV Shear plot of 4-axle concentrations – envelope of top 31 concentrations- W/O 4AC-0011

February 25, 2013 [Review and Revision of Overload Permit Classification]
48
ORBP Reference No. OR10-010 Report No. RC-1589
5.1.4.4 Five-Axle Concentrations
Using the PVA software, the largest 5-axle concentrations were determined as shown in
Table 12.
Table 12. Largest 5-axle vehicle concentrations
Permit ID Permit #Number
Duplicates
Num
Axles
Gross
Weight
Vehicle
Length
2 axle
Conc
3 axle
Conc
4 axle
Conc
5 axle
Conc
111000385202 5AC-0001 0 10 261.0 78.2 13.44 9.72 8.64 8.10
111001128702 5AC-0002 1 11 257.0 81.7 12.00 9.00 8.00 7.35
111000020702 5AC-0003 0 11 242.0 81.7 11.52 8.64 7.68 7.20
111001786402 5AC-0004 1 11 271.5 89.3 11.33 8.50 7.56 7.08
111000029902 5AC-0005 0 11 242.0 82.4 11.52 8.64 7.68 7.06
111000256902 5AC-0006 4 9 244.0 83.0 13.33 10.00 7.47 7.00
111000650702 5AC-0007 2 10 270.0 79.7 13.44 10.08 8.96 6.91
111001991702 5AC-0008 0 10 225.0 78.2 11.52 8.28 7.36 6.90
111000122002 5AC-0009 0 9 234.6 72.3 14.22 10.39 7.57 6.84
111002067902 5AC-0010 1 10 246.5 79.5 13.20 8.17 7.26 6.81
111002138002 5AC-0011 0 10 210.0 65.5 11.76 8.82 7.84 6.76
111001493402 5AC-0012 0 10 222.5 78.2 11.52 8.10 7.20 6.75
111000701002 5AC-0013 1 10 261.0 79.7 12.96 9.72 8.64 6.67
111000102202 5AC-0014 0 11 234.0 84.0 10.67 8.00 7.11 6.67
111000296202 5AC-0015 0 11 238.0 86.2 10.56 7.92 7.04 6.60
111000235302 5AC-0016 0 9 195.0 73.9 11.52 8.31 7.04 6.57
111000132802 5AC-0017 0 11 239.0 83.4 11.52 8.31 7.14 6.53
111000165802 5AC-0018 1 11 221.0 82.9 10.56 7.92 7.04 6.47
111001513802 5AC-0019 0 8 190.0 78.4 12.24 7.71 6.86 6.43
111000242702 5AC-0020 0 9 211.0 72.5 12.00 8.71 7.14 6.42
111000552802 5AC-0021 3 10 252.0 79.7 12.48 9.36 8.32 6.42
111000343802 5AC-0022 0 10 216.0 78.2 11.00 7.62 6.77 6.35
111001507302 5AC-0023 0 10 211.0 78.2 11.04 7.56 6.72 6.30
111000028002 5AC-0024 3 7 200.9 37.9 10.60 7.95 6.59 6.28
111000855900 5AC-0025 0 11 227.0 84.4 10.08 7.44 6.64 6.24
111001761202 5AC-0026 0 11 235.0 85.5 10.67 8.00 6.81 6.22
111000719302 5AC-0027 0 10 237.0 88.3 12.00 9.00 6.65 6.22
111000370702 5AC-0028 2 9 208.0 74.5 11.54 8.65 6.57 6.19
111000020202 5AC-0029 1 10 243.0 79.7 12.00 9.00 8.00 6.17
111002038102 5AC-0030 2 10 194.0 122.6 9.86 7.39 6.57 6.16
111001733502 5AC-0031 0 8 150.0 66.3 9.86 7.39 6.57 6.16
Note that none of the five axle combinations have any axle spacings that appear to be
suspect. The envelope of the 31 vehicles for shear and moment are shown in Figure 34
and Figure 35. Note that the dominant vehicle in the 4 axle set is no longer present (480
kip gross weight). From Figure 34 it is evident that vehicle 5AC-0001 governs for shorter
spans (and exceeds the Class A allowable curve), vehicle 5AC-0024 governs the
middle span length ranges (and also exceeds the Class A allowable curve), and vehicle
5AC-0007 governs the longer spans but are within the Class A allowable curve.

February 25, 2013 [Review and Revision of Overload Permit Classification]
49
ORBP Reference No. OR10-010 Report No. RC-1589
Figure 34. BridgeOV Moment plot of 5-axle concentrations – envelope of top 31 concentrations
Figure 35. BridgeOV Shear plot of 5-axle concentrations – envelope of top 31 concentrations
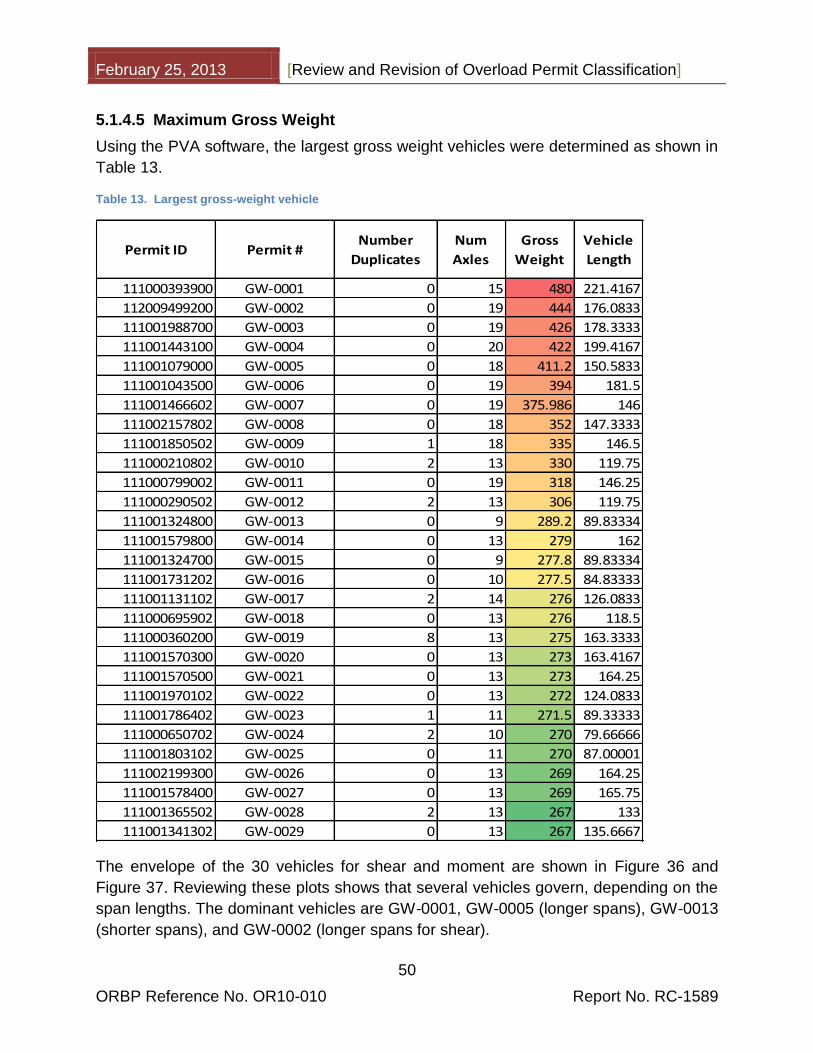
February 25, 2013 [Review and Revision of Overload Permit Classification]
50
ORBP Reference No. OR10-010 Report No. RC-1589
5.1.4.5 Maximum Gross Weight
Using the PVA software, the largest gross weight vehicles were determined as shown in
Table 13.
Table 13. Largest gross-weight vehicle
Permit ID Permit #Number
Duplicates
Num
Axles
Gross
Weight
Vehicle
Length
111000393900 GW-0001 0 15 480 221.4167
112009499200 GW-0002 0 19 444 176.0833
111001988700 GW-0003 0 19 426 178.3333
111001443100 GW-0004 0 20 422 199.4167
111001079000 GW-0005 0 18 411.2 150.5833
111001043500 GW-0006 0 19 394 181.5
111001466602 GW-0007 0 19 375.986 146
111002157802 GW-0008 0 18 352 147.3333
111001850502 GW-0009 1 18 335 146.5
111000210802 GW-0010 2 13 330 119.75
111000799002 GW-0011 0 19 318 146.25
111000290502 GW-0012 2 13 306 119.75
111001324800 GW-0013 0 9 289.2 89.83334
111001579800 GW-0014 0 13 279 162
111001324700 GW-0015 0 9 277.8 89.83334
111001731202 GW-0016 0 10 277.5 84.83333
111001131102 GW-0017 2 14 276 126.0833
111000695902 GW-0018 0 13 276 118.5
111000360200 GW-0019 8 13 275 163.3333
111001570300 GW-0020 0 13 273 163.4167
111001570500 GW-0021 0 13 273 164.25
111001970102 GW-0022 0 13 272 124.0833
111001786402 GW-0023 1 11 271.5 89.33333
111000650702 GW-0024 2 10 270 79.66666
111001803102 GW-0025 0 11 270 87.00001
111002199300 GW-0026 0 13 269 164.25
111001578400 GW-0027 0 13 269 165.75
111001365502 GW-0028 2 13 267 133
111001341302 GW-0029 0 13 267 135.6667
The envelope of the 30 vehicles for shear and moment are shown in Figure 36 and
Figure 37. Reviewing these plots shows that several vehicles govern, depending on the
span lengths. The dominant vehicles are GW-0001, GW-0005 (longer spans), GW-0013
(shorter spans), and GW-0002 (longer spans for shear).

February 25, 2013 [Review and Revision of Overload Permit Classification]
51
ORBP Reference No. OR10-010 Report No. RC-1589
Figure 36. BridgeOV moment plot largest gross-weight vehicles – Top 30
Figure 37. BridgeOV Shear plot largest gross-weight vehicles – Top 30
Plotting each vehicle individually in the BridgeOV software indicates that 9 vehicles
exceed the Class A curve; GW-0001, GW-0002, GW-0003, GW-0004, GW-0005, GW-
0007, GW-0010, GW-0013, and GW-0025. The plot for these curves for moment and
shear are shown in Figure 38 and Figure 39. Note that for both the moment and the
shear, at higher span lengths, several of the vehicles begin to diverge from the Class A
curve, an indicator that reviewing longer span lengths when appropriate would be
necessary.

February 25, 2013 [Review and Revision of Overload Permit Classification]
52
ORBP Reference No. OR10-010 Report No. RC-1589
Figure 38. BridgeOV Moment plot for vehicles GW-0001, GW-0002, GW-0003, GW-0004, GW-0005, GW-0007, GW-0010, GW-0013, and GW-0025
Figure 39. BridgeOV Shear plot for vehicles GW-0001, GW-0002, GW-0003, GW-0004, GW-0005, GW-0007, GW-0010, GW-0013, and GW-0025

February 25, 2013 [Review and Revision of Overload Permit Classification]
53
ORBP Reference No. OR10-010 Report No. RC-1589
5.1.4.6 Five-Axle Construction Vehicle
At MDOT’s request, the researchers reviewed a 5 axle vehicle with 4-ft axle spacing
and 24 kip loads for each axle. This emulates the worst possible theoretical construction
vehicle that meets the requirements of an MDOT Extended Permit and yields the
Moment and Shear plots shown in Figure 40 and Figure 41. Neither of these exceed the
Class A curves in BridgeOV but there is some concern in that the moment for shorter
spans does exceed the Class B (25-ft – 60-ft) and C (20-ft – 100-ft) curves.
Figure 40. BridgeOV moment plot – 5-axle short vehicle, 24 kip axle loads, 4-ft spacings
Figure 41. BridgeOV shear plot – 5-axle short vehicle, 24 kip axle loads, 4-ft spacings

February 25, 2013 [Review and Revision of Overload Permit Classification]
54
ORBP Reference No. OR10-010 Report No. RC-1589
5.1.5 Review of Michigan Overload Vehicles (LFR)
Reviewing all of the Class A Michigan overload vehicles in BridgeOV using the LFR
option for span lengths of 10-ft – 250-ft and plotting them as an envelope yields the
Moment in Figure 42. The labels have been turned on to show which of the overload
vehicles governed at each span location. Similar runs were made for both the shear and
2-span shear in order to determine which vehicles governed for each effect at 5-ft span
increments. A summary of the governing vehicles per effect is shown in Table 14.
Figure 42. BridgeOV moment plot for Michigan Class A vehicles – governing vehicles labeled
The table reveals that 7 vehicles do not govern any of the effects (2, 3, 4, 6, 8, 11, 19
and 20). Furthermore, vehicle MIOLT-01A only governs for moment for a 10’ span
length. The following sections provide a review and recommendations for each of these
vehicles.

February 25, 2013 [Review and Revision of Overload Permit Classification]
55
ORBP Reference No. OR10-010 Report No. RC-1589
Table 14. BridgeOV governing Michigan overload vehicles - Class A
Vehicle Moment Shear 2 Equal Span Shear
MIOLT-01A X*
MIOLT-02A
MIOLT-03A
MIOLT-04A
MIOLT-05A X X
MIOLT-06A
MIOLT-07A X X X
MIOLT-08A
MIOLT-09A X
MIOLT-10A X
MIOLT-11A
MIOLT-12A X X X
MIOLT-13A X X
MIOLT-14A X
MIOLT-15A X X X
MIOLT-16A X X
MIOLT-17A X X
MIOLT-18A X X X
MIOLT-19A
MIOLT-20A
*Note: MIOLT-01A only governs at the 10’ span length
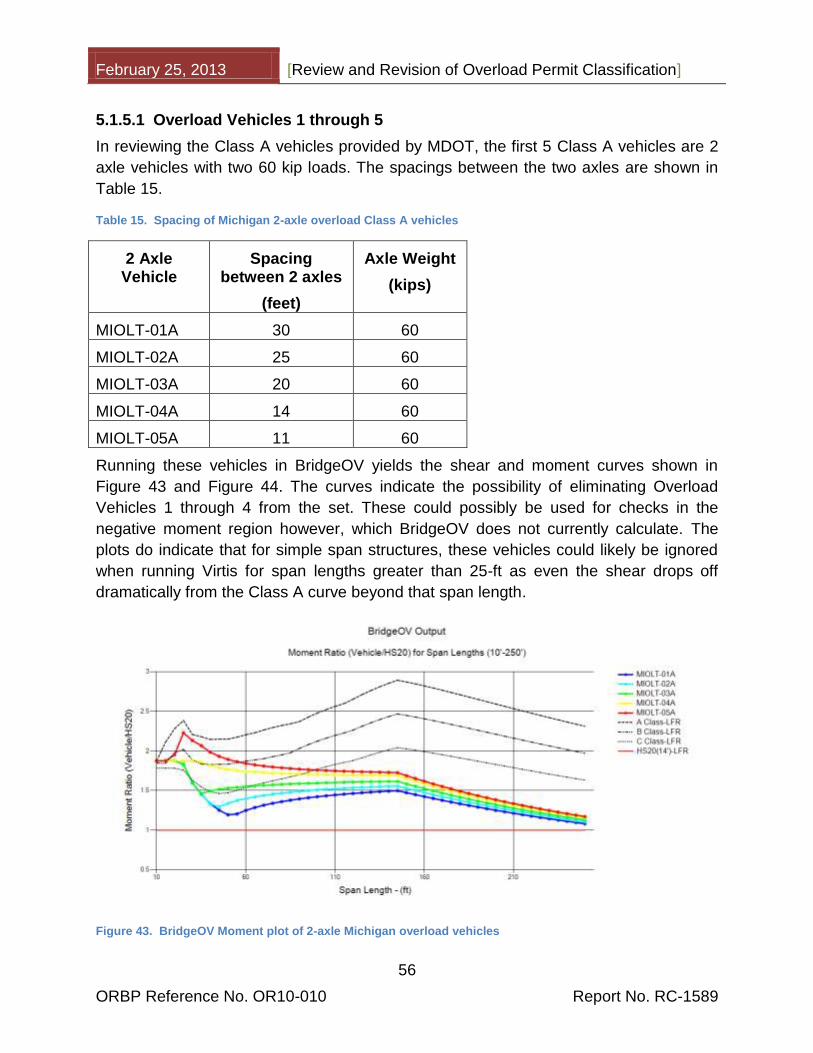
February 25, 2013 [Review and Revision of Overload Permit Classification]
56
ORBP Reference No. OR10-010 Report No. RC-1589
5.1.5.1 Overload Vehicles 1 through 5
In reviewing the Class A vehicles provided by MDOT, the first 5 Class A vehicles are 2
axle vehicles with two 60 kip loads. The spacings between the two axles are shown in
Table 15.
Table 15. Spacing of Michigan 2-axle overload Class A vehicles
2 Axle Vehicle
Spacing between 2 axles
(feet)
Axle Weight
(kips)
MIOLT-01A 30 60
MIOLT-02A 25 60
MIOLT-03A 20 60
MIOLT-04A 14 60
MIOLT-05A 11 60
Running these vehicles in BridgeOV yields the shear and moment curves shown in
Figure 43 and Figure 44. The curves indicate the possibility of eliminating Overload
Vehicles 1 through 4 from the set. These could possibly be used for checks in the
negative moment region however, which BridgeOV does not currently calculate. The
plots do indicate that for simple span structures, these vehicles could likely be ignored
when running Virtis for span lengths greater than 25-ft as even the shear drops off
dramatically from the Class A curve beyond that span length.
Figure 43. BridgeOV Moment plot of 2-axle Michigan overload vehicles

February 25, 2013 [Review and Revision of Overload Permit Classification]
57
ORBP Reference No. OR10-010 Report No. RC-1589
Figure 44. BridgeOV shear (2 span) plot of 2-axle Michigan overload vehicles
5.1.5.2 Overload Vehicles 6 and 8
Vehicles 6 and 8 do not govern for any effect, however, the results for short span
ranges are close enough to the Class A curve for moment, that they should be retained.
(see Figure 45).
Figure 45. BridgeOV moment plots – Class A- vehicles 6 and 8

February 25, 2013 [Review and Revision of Overload Permit Classification]
58
ORBP Reference No. OR10-010 Report No. RC-1589
5.1.5.3 Overload Vehicles 11, 19 and 20
Vehicles 11, 19, and 20 do not govern for any effect (see Figure 46, Figure 47 and
Figure 48). The MIOLT-20A truck comes close for short spans for the moment effect,
but several other overload vehicles do as well. It is recommended that these vehicles be
reviewed to be for possible removal from the set.
Figure 46. BridgeOV moment plots – Class A- vehicles 11, 19 and 20
Figure 47. BridgeOV shear plots – Class A- vehicles 11, 19 and 20

February 25, 2013 [Review and Revision of Overload Permit Classification]
59
ORBP Reference No. OR10-010 Report No. RC-1589
Figure 48. BridgeOV shear-2-span plots – Class A- vehicles 11, 19 and 20

February 25, 2013 [Review and Revision of Overload Permit Classification]
60
ORBP Reference No. OR10-010 Report No. RC-1589
5.1.6 Review of NBI Maximum Span Length
Using some of the permit vehicles delivered from MDOT, a review was made of the
possibility/ practicality of using the NBI item number 48 (length of maximum span) to set
the maximum span length used by BridgeOV. In general, the maximum span length
cannot be used conservatively with BridgeOV except as possibly an upper bound. If the
NBI bridge record has multiple spans and the upper span length is used (or a range
near the upper span length), spans within the same bridge with shorter span lengths
would be missed. In some cases, BridgeOV will fail bridges with shorter span lengths,
but pass bridges with longer span lengths. Figure 49 shows an example from the MDOT
permit set for two-axle concentrations (2AC-0015).
Figure 49. Bridge failing BridgeOV for shorter span length but passing for longer span lengths
If the length of maximum span item is considered as an upper bound for Bridge OV,
some longer vehicles that fail for longer spans, would benefit from an upper bound
based on the length of maximum span. The largest (and longest vehicle) from the
permit set provided in the MDOT permit set has a gross weight of 480 kips and a length
of 221.4-ft with a maximum axle load of 46 kips. This vehicle was slightly modified by
decreasing the axle loads from 46 kips to 38 kips to demonstrate the case where the
moments/ shears for shorter span bridges may pass BridgeOV while longer spans
would fail. The revised vehicle is shown in Figure 50. The moment and shear plots for
the vehicle are shown in Figure 51 and Figure 52. In the shear plot (Figure 51),
BridgeOV passes class A for shear up to about the 225-ft span length, but then starts
failing Class A. For the moment plot, BridgeOV passes the Class A for spans up to 250-
ft, but at 250-ft is trending upward. Two points arise from this:

February 25, 2013 [Review and Revision of Overload Permit Classification]
61
ORBP Reference No. OR10-010 Report No. RC-1589
Using a maximum span length value from the NBI record for BridgeOV would
safely allow passage on bridges with only shorter span members while
appropriately blocking the issuing of permits for the few longer span bridges.
This method is recommended and is incorporated in the final software package
produced for this research project
Longer span lengths (up to 250-ft) have been incorporated into BridgeOV to
account for longer vehicles that cannot be analyzed in Virtis.
Figure 50. Revised permit vehicle – maximum axle loads changed from 46 kips to 38 kips
Figure 51. BridgeOV moment plot for revised permit vehicle

February 25, 2013 [Review and Revision of Overload Permit Classification]
62
ORBP Reference No. OR10-010 Report No. RC-1589
Figure 52. BridgeOV shear plot for revised permit vehicle

February 25, 2013 [Review and Revision of Overload Permit Classification]
63
ORBP Reference No. OR10-010 Report No. RC-1589
5.1.7 Review of Continuous Span Structures
MDOT provided the researchers with a set of 30 Virtis bridges with multiple continuous
spans. This set was used to determine if the revised BridgeOV, that only checks
moment for simple spans and shear for simple spans and 2-equal spans, provides
conservative results. Upon review of the structures, it was determined that two of the
bridges (41141064000R020 and 49149025000S050) contained only simple span
structures and were not used for this analysis. The remaining structures were run in
Virtis using LFR and with distribution factors of 2.0 so that the results could be
compared against the moments and shears produced by the revised bridge OV
program.
To compare the results, the Virtis maximum live load moments (positive and negative)
were saved from an envelope of all 20 Class A Michigan overload vehicles. The 20
vehicles were also run in BridgeOV and the results saved. For BridgeOV, the maximum
span length of the structure was used as the key for determining the moment or shear.
Initially the BridgeOV values were taken at 1’ span increments (rounded up) based on
the maximum span length for each structure. These values are represented in Table 16.
In this table the BridgeOV / Virtis ratio is expected to be greater than 1.0 if the values
are to be conservative. Using this method, bridges (BID) 26, 31, 34, 35, 36, 42, 50 and
55 fail the shear ratio with ratios ranging from 0.972 to 0.999. In addition, bridges (BID)
41 and 42 fail the moment ratio checks with ratios of 0.987 and 0.944 respectively (see
Table 16).
The criteria was changed to use the maximum span length for the bridge rounded up to
the next 10-ft increment and adding 10-ft on to the increment. For example if the
maximum span length for the bridge is 54.0-ft (BID 28), the span length used for
BridgeOV would be 60-ft + 10-ft or 70-ft. When the criteria was changed to this, all
bridges for moment passed with the lowest ratio being 1.116. In addition, two BID 26
and 36 still have ratios slightly less than one (see Table 17).
It seem that the likely issue for these two bridges is that they are both relatively long
span bridges with a shorter span next to the maximum length span. In the case of BID
26 the span lengths are (157-ft, 122-ft, 122-ft, and 122-ft) with the maximum negative
shear of 281.9 kip being located at the support between the 157-ft and 122-ft span
bridge (see Figure 53).

February 25, 2013 [Review and Revision of Overload Permit Classification]
64
ORBP Reference No. OR10-010 Report No. RC-1589
Figure 53. Plot of BID 26 shear in Virtis
The impact for the axles loaded in span 1 would be
While the impact for axles loaded in Span 2 would be higher because of the shorter
span length
The BridgeOV calculation would use the impact for the longer span and thus use a
reduced impact factor. Using an even larger span does increase the shear, but also
reduces the impact factor.
One possibility would be to make the impact factor constant (e.g. 1.33) for the shear
calculations in BridgeOV altogether although this will mean change in the allowable
values as well.
Another possibility is to increase the maximum span length provided by the NBI data by
a factor. Currently, in the revised version of the BridgeOV software, the factor has been
set as a user input and defaults to 1.2, meaning that the maximum span length from the
NBI data is multiplied by 1.2 and round up to the next highest 5-ft increment.
Example:
NBI span length = 69-ft
Maximum span length = 1.2 * 69 = 82.8-ft round up and use 85-ft as the maximum span
length.

February 25, 2013 [Review and Revision of Overload Permit Classification]
65
ORBP Reference No. OR10-010 Report No. RC-1589
Table 16. Virtis /BridgeOV comparisons on 30 bridge MDOT sample using ‘Max Span Length’ to nearest 1’
BID Bridge Id Bridge Name
Number of
Multi-Span
Structures
Num
Spans
Struct
Max Span
Length
Max
Positive
Moment
Max
Negative
Moment
Max Pos
Shear
Max
Negative
Shear
BridgeOV
Moment
(Simple)*
BridgeOV
Shear
(Simple)
*
BridgeOV
2 span
Shear *
Max
Virtis
Moment
(kip-ft) (kip-ft) (kip) (kip) (kip-ft) (kip) (kip) (kip-ft)
26 63163192000S010 I-96 EB, RAMP J OVER M-5/I-96/I-696 2 4 157.0 6897.0 4796.9 258.3 281.9 8940.3 253.0 274.0 6897
26 63163192000S010 I-96 EB, RAMP J OVER M-5/I-96/I-696 2 3 156.0 5100.8 4007.6 262.9 262.9 8862.2 252.6 274.0 5100.8
27 82182023000S270 M-10 NB OVER I-94 1 6 57.4 1510.6 1070.4 182.6 182.3 2098.3 175.8 189.7 1510.6
28 82182192000S040 OAKWOOD BLVD OVER M-39 1 2 54.0 1612.2 1312.9 183.7 183.7 1938.9 172.7 186.5 1612.2
29 41141064000R020 M-6 EB OVER NORFOLK SOUTHERN RR 0 1 0.0
30 63163111000R020 I-75 BL NB OVER GTW RR 1 4 78.0 2678.9 830.6 202.5 200.5 3250.3 195.3 213.0 2678.9
31 19119033000S090 TAFT ROAD OVER US-127 1 2 105.4 3938.4 2927.5 241.7 241.7 4952.6 220.4 241.4 3938.4
32 11111016000B013 I-94 EB OVER ST. JOSEPH RIVER 1 8 84.0 3548.8 940.7 205.8 205.8 3582.7 201.4 219.4 3548.8
33 23123063000S130 DAVIS HWY OVER I-69 1 2 170.6 7942.1 4761.5 280.6 273.4 10105.8 257.7 278.1 7942.1
34 82182022000S430 M-39 SB RAMP L over I-94 1 3 30.0 654.4 634.5 141.7 141.7 807.9 133.1 141.3 654.4
35 49149025000S050 CHARLES MORAN RD OVER I-75 SB 0 0 0.0
36 38138101000S100 DETTMAN RD over I-94 1 2 167.8 7938.7 4342.1 281.6 262.9 9796.1 256.8 277.3 7938.7
37 50150062000S110 I-696 RAMP N TO W OVER I-94 1 4 109.1 5220.8 1330.9 240.3 237.4 5223.5 224.2 245.6 5220.8
38 63163191000S010 MEADOWBROOK RD OVER I-96 1 2 153.7 7605.5 3194.3 244.1 272.4 8705.8 251.8 272.9 7605.5
39 82182081000S061 Evergreen Rd NB Over M-153 1 2 119.5 5366.4 2022.5 248.0 227.2 6012.5 233.4 255.0 5366.4
40 41141131000S110 HALL ST OVER US-131 and CENTURY AVE1 2 73.3 2666.2 993.0 183.2 202.5 2971.5 189.3 206.5 2666.2
41 50150061000S030 RYAN ST OVER I-696 1 2 87.8 3854.4 1017.0 209.6 219.4 3802.8 204.9 223.0 3854.4
42 50150061000S140 SHERWOOD AVE OVER I-696 & RAMPS B,C,H,F1 6 141.8 8222.1 2056.3 250.8 272.5 7762.6 246.6 268.0 8222.1
43 82182291000B020 I-275 NB OVER HURON R & METROPARK1 4 83.2 3237.5 980.0 217.4 198.4 3527.5 200.4 218.4 3237.5
44 63163191000S100 TEN MILE ROAD OVER I-96 1 5 121.8 5024.3 1596.9 258.5 252.0 6172.9 234.8 256.5 5024.3
45 19119043000S020 Clark road over I-69 & US-127 1 5 141.0 6323.8 2596.2 266.6 261.8 7683.6 246.1 267.6 6323.8
46 25125031000S110 MILLER ROAD OVER I-75 1 2 63.6 2170.5 890.7 176.3 195.4 2469.1 182.0 195.5 2170.5
47 58158151000S100 LAPLAISANCE RD over I-75 1 4 112.3 2315.0 3664.8 239.9 228.0 5425.8 226.9 248.4 3664.8
48 25125132000S230 I-475 OVER STEVER - BROADWAY AVES2 7 78.6 2779 750.4 208.1 205.3 3305.9 196.4 214.2 2779
48 25125132000S230 I-475 OVER STEVER - BROADWAY AVES2 7 78.6 2779 750.4 208.1 205.3 3305.9 196.4 214.2 2779
49 50150111000S274 WB I-94 OVER CROCKER ROAD 1 3 100.4 3922.3 1018.2 225.3 225.3 4612.3 215.0 235.6 3922.3
50 82182022000S480 I-94 EB over M-39 3 4 31.3 677.9 667.8 143.7 143.7 846.3 139.7 142.9 677.9
50 82182022000S480 I-94 EB over M-39 3 4 30.0 654.4 634.5 141.7 141.7 807.9 139.7 141.3 654.4
50 82182022000S480 I-94 EB over M-39 3 4 35.0 812.6 773.9 148.8 140.6 1022.6 139.7 148.8 812.6
51 82182022000S420 I-94 EB RMP Over PELHAM RMP 2 4 30.5 660.7 650.2 142.6 142.6 846.3 134.6 142.9 660.7
51 82182022000S420 I-94 EB RMP Over PELHAM RMP 2 4 28.0 600.3 589.2 137.5 138.2 735.2 134.6 137.8 600.3
52 13113033000B010 I-194 OVER KALAMAZOO RIVER 4 2 74.5 2461.2 2075 208 205.2 3027.3 191.8 209.2 2461.2
52 13113033000B010 I-194 OVER KALAMAZOO RIVER 4 2 73.2 2397.5 2099.2 202.3 204.9 2971.5 191.8 206.5 2397.5
52 13113033000B010 I-194 OVER KALAMAZOO RIVER 4 2 74.2 2431.1 2089.5 206.3 205.8 3027.3 191.8 207.9 2431.1
52 13113033000B010 I-194 OVER KALAMAZOO RIVER 4 2 71.3 2292.5 2112.9 201.3 202.8 2859.7 191.8 203.6 2292.5
53 82182191000S240 I-75 RAMP C NB OVER TOLEDO DIX HWY RAMP D1 5 104.5 4164.2 2612.5 223.2 234.9 4952.6 220.4 241.4 4164.2
54 41141027000B020 M-21 OVER GRAND RIVER 1 7 116.0 3279.4 3160.4 238 238 5695.5 230.3 251.9 3279.4
55 82182112000S348 M-102 Over M-10 & Ramps 3 5 128.5 6643.9 2285.1 252.4 239.5 6731.8 239.4 261.1 6643.9
55 82182112000S348 M-102 Over M-10 & Ramps 3 5 212.5 8895.8 4856.6 286.4 286.4 13250.8 267.3 285.5 8895.8
55 82182112000S348 M-102 Over M-10 & Ramps 3 7 142.0 6797 2349.6 256.3 260.6 7762.6 246.6 268.0 6797
* BridgeOV values taken at the nearest 1' increment
** Virtis values using a 2.0 DF with LFD impact applied
Virtis**

February 25, 2013 [Review and Revision of Overload Permit Classification]
66
ORBP Reference No. OR10-010 Report No. RC-1589
Table 17. Virtis /BridgeOV comparisons on 30 bridge MDOT sample using ‘Max Span Length’ rounded up to nearest 10’ + 10’
BID Bridge Id Bridge Name
Number of
Multi-Span
Structures
Num
Spans
Struct
Max Span
Length
Max
Positive
Moment
Max
Negative
Moment
Max Pos
Shear
Max
Negative
Shear
BridgeOV
Moment
(Simple)*
BridgeOV
Shear
(Simple)
*
BridgeOV
2 span
Shear *
Max
Virtis
Moment
Max
Virtis
Shear
Max
BridgeOV
Moment
Max
BridgeOV
Shear
Ratio
BridgeOv
/ Virtis
Moment
Ratio
BridgeOV/
Virtis
Shear
(kip-ft) (kip-ft) (kip) (kip) (kip-ft) (kip) (kip) (kip-ft) (kip) (kip-ft) (kip)
26 63163192000S010 I-96 EB, RAMP J OVER M-5/I-96/I-696 2 4 157.0 6897.0 4796.9 258.3 281.9 9951.0 257.4 277.8 6897 281.9 9951.0 277.8 1.443 0.985
26 63163192000S010 I-96 EB, RAMP J OVER M-5/I-96/I-696 2 3 156.0 5100.8 4007.6 262.9 262.9 9951.0 257.4 277.8 5100.8 262.9 9951.0 277.8 1.951 1.057
27 82182023000S270 M-10 NB OVER I-94 1 6 57.4 1510.6 1070.4 182.6 182.3 2803.6 185.6 202.0 1510.6 182.6 2803.6 202.0 1.856 1.106
28 82182192000S040 OAKWOOD BLVD OVER M-39 1 2 54.0 1612.2 1312.9 183.7 183.7 2803.6 185.6 202.0 1612.2 183.7 2803.6 202.0 1.739 1.100
29 41141064000R020 M-6 EB OVER NORFOLK SOUTHERN RR 0 1 0.0
30 63163111000R020 I-75 BL NB OVER GTW RR 1 4 78.0 2678.9 830.6 202.5 200.5 3926.6 206.5 224.6 2678.9 202.5 3926.6 224.6 1.466 1.109
31 19119033000S090 TAFT ROAD OVER US-127 1 2 105.4 3938.4 2927.5 241.7 241.7 6012.5 233.4 255.0 3938.4 241.7 6012.5 255.0 1.527 1.055
32 11111016000B013 I-94 EB OVER ST. JOSEPH RIVER 1 8 84.0 3548.8 940.7 205.8 205.8 4612.3 215.0 235.6 3548.8 205.8 4612.3 235.6 1.300 1.145
33 23123063000S130 DAVIS HWY OVER I-69 1 2 170.6 7942.1 4761.5 280.6 273.4 11494.5 262.8 282.2 7942.1 280.6 11494.5 282.2 1.447 1.006
34 82182022000S430 M-39 SB RAMP L over I-94 1 3 30.0 654.4 634.5 141.7 141.7 1734.3 167.8 141.3 654.4 141.7 1734.3 167.8 2.650 1.184
35 49149025000S050 CHARLES MORAN RD OVER I-75 SB 0 0 0.0
36 38138101000S100 DETTMAN RD over I-94 1 2 167.8 7938.7 4342.1 281.6 262.9 10724.6 260.3 280.2 7938.7 281.6 10724.6 280.2 1.351 0.995
37 50150062000S110 I-696 RAMP N TO W OVER I-94 1 4 109.1 5220.8 1330.9 240.3 237.4 6012.5 233.4 255.0 5220.8 240.3 6012.5 255.0 1.152 1.061
38 63163191000S010 MEADOWBROOK RD OVER I-96 1 2 153.7 7605.5 3194.3 244.1 272.4 9951.0 257.4 277.8 7605.5 272.4 9951.0 277.8 1.308 1.020
39 82182081000S061 Evergreen Rd NB Over M-153 1 2 119.5 5366.4 2022.5 248.0 227.2 6811.3 240.0 267.1 5366.4 248 6811.3 267.1 1.269 1.077
40 41141131000S110 HALL ST OVER US-131 and CENTURY AVE1 2 73.3 2666.2 993.0 183.2 202.5 3926.6 206.5 224.6 2666.2 202.5 3926.6 224.6 1.473 1.109
41 50150061000S030 RYAN ST OVER I-696 1 2 87.8 3854.4 1017.0 209.6 219.4 4612.3 204.9 235.6 3854.4 219.4 4612.3 235.6 1.197 1.074
42 50150061000S140 SHERWOOD AVE OVER I-696 & RAMPS B,C,H,F1 6 141.8 8222.1 2056.3 250.8 272.5 9174.3 254.1 274.9 8222.1 272.5 9174.3 274.9 1.116 1.009
43 82182291000B020 I-275 NB OVER HURON R & METROPARK1 4 83.2 3237.5 980.0 217.4 198.4 4612.3 215.0 235.6 3237.5 217.4 4612.3 235.6 1.425 1.084
44 63163191000S100 TEN MILE ROAD OVER I-96 1 5 121.8 5024.3 1596.9 258.5 252.0 7604.5 245.6 267.1 5024.3 258.5 7604.5 267.1 1.514 1.033
45 19119043000S020 Clark road over I-69 & US-127 1 5 141.0 6323.8 2596.2 266.6 261.8 9174.3 254.1 274.9 6323.8 266.6 9174.3 274.9 1.451 1.031
46 25125031000S110 MILLER ROAD OVER I-75 1 2 63.6 2170.5 890.7 176.3 195.4 3361.4 197.4 215.3 2170.5 195.4 3361.4 215.3 1.549 1.102
47 58158151000S100 LAPLAISANCE RD over I-75 1 4 112.3 2315.0 3664.8 239.9 228.0 6811.3 240.0 261.7 3664.8 239.9 6811.3 261.7 1.859 1.091
48 25125132000S230 I-475 OVER STEVER - BROADWAY AVES2 7 78.6 2779 750.4 208.1 205.3 3926.6 206.5 224.6 2779 208.1 3926.6 224.6 1.413 1.079
48 25125132000S230 I-475 OVER STEVER - BROADWAY AVES2 7 78.6 2779 750.4 208.1 205.3 3926.6 206.5 224.6 2779 208.1 3926.6 224.6 1.413 1.079
49 50150111000S274 WB I-94 OVER CROCKER ROAD 1 3 100.4 3922.3 1018.2 225.3 225.3 6012.5 233.4 255.0 3922.3 225.3 6012.5 255.0 1.533 1.132
50 82182022000S480 I-94 EB over M-39 3 4 31.3 677.9 667.8 143.7 143.7 1734.3 167.8 181.4 677.9 143.7 1734.3 181.4 2.558 1.262
50 82182022000S480 I-94 EB over M-39 3 4 30.0 654.4 634.5 141.7 141.7 1734.3 167.8 181.4 654.4 141.7 1734.3 181.4 2.650 1.280
50 82182022000S480 I-94 EB over M-39 3 4 35.0 812.6 773.9 148.8 140.6 1734.3 167.8 181.4 812.6 148.8 1734.3 181.4 2.134 1.219
51 82182022000S420 I-94 EB RMP Over PELHAM RMP 2 4 30.5 660.7 650.2 142.6 142.6 1734.3 167.8 181.4 660.7 142.6 1734.3 181.4 2.625 1.272
51 82182022000S420 I-94 EB RMP Over PELHAM RMP 2 4 28.0 600.3 589.2 137.5 138.2 1253.7 150.2 161.7 600.3 138.2 1253.7 161.7 2.088 1.170
52 13113033000B010 I-194 OVER KALAMAZOO RIVER 4 2 74.5 2461.2 2075 208 205.2 3926.6 206.5 224.6 2461.2 208 3926.6 224.6 1.595 1.080
52 13113033000B010 I-194 OVER KALAMAZOO RIVER 4 2 73.2 2397.5 2099.2 202.3 204.9 3926.6 206.5 224.6 2397.5 204.9 3926.6 224.6 1.638 1.096
52 13113033000B010 I-194 OVER KALAMAZOO RIVER 4 2 74.2 2431.1 2089.5 206.3 205.8 3926.6 206.5 224.6 2431.1 206.3 3926.6 224.6 1.615 1.089
52 13113033000B010 I-194 OVER KALAMAZOO RIVER 4 2 71.3 2292.5 2112.9 201.3 202.8 3926.6 206.5 224.6 2292.5 202.8 3926.6 224.6 1.713 1.108
53 82182191000S240 I-75 RAMP C NB OVER TOLEDO DIX HWY RAMP D1 5 104.5 4164.2 2612.5 223.2 234.9 6012.5 233.4 255.0 4164.2 234.9 6012.5 255.0 1.444 1.086
54 41141027000B020 M-21 OVER GRAND RIVER 1 7 116.0 3279.4 3160.4 238 238 6811.3 240.0 261.7 3279.4 238 6811.3 261.7 2.077 1.100
55 82182112000S348 M-102 Over M-10 & Ramps 3 5 128.5 6643.9 2285.1 252.4 239.5 7604.5 245.6 267.1 6643.9 252.4 7604.5 267.1 1.145 1.058
55 82182112000S348 M-102 Over M-10 & Ramps 3 5 212.5 8895.8 4856.6 286.4 286.4 13250.8 267.3 288.3 8895.8 286.4 13250.8 288.3 1.490 1.007
55 82182112000S348 M-102 Over M-10 & Ramps 3 7 142.0 6797 2349.6 256.3 260.6 7762.6 246.6 274.9 6797 260.6 7762.6 274.9 1.142 1.055
* BridgeOV values taken at the next highest 10' + 10' (e.g. 141' would be taken at the 160' location)
** Virtis values using a 2.0 DF with LFD impact applied
Virtis**

February 25, 2013 [Review and Revision of Overload Permit Classification]
67
ORBP Reference No. OR10-010 Report No. RC-1589
5.1.8 BridgeOV – LFR vs. LRFR
A review of the effect of the BridgeOV results based on LFR and the Michigan
implementation of LRFR was performed to determine the effect of varying live load
factors as described in the Curtis, Till, Michigan Research Report “Recommendations
for Michigan Specific Load and Resistance Factor Design Loads and Load and
Resistance Factor Rating Procedures”.
As per the recommendation from MDOT, equation 18 from that report was implemented
in BridgeOV along with a new input item that specifies if the BridgeOV run is and LRFR
or LFR run. The BridgeOV input file is described in Section 10.3.2 of this report.
Equation 18 from the Curtis, Till report is shown below
( (
) )
Equation 18 (Curtis,Till)
For the purposes of implementing in BridgeOV, MDOT provided the following constants
for the implementation of this equation.
ADTT = 5000 which yields a value of AT of 188.6 as per Table 18 (p. 18) of the
report.
gm / gl = 2.0
P = gross weight of the vehicle
5.1.8.1 Three-Axle Vehicle – LFR vs. LRFR
An initial investigation was conducted by modifying a simple 3 axle vehicle by changing
the axle loads. The vehicle used for the analysis is described in Figure 54. Vehicle TV1
is simply the HS-20 vehicle without the variable axle spacing. Vehicle TV2 is the vehicle
with the same spacing but with the middle axle increased from 32 kips to 60 kips.
Vehicle TV3 is has the same configuration as vehicle TV2 but with the third axle
increased from 32 kips to 46 kip. Therefore each vehicle is progressively heavier in
gross weight.

February 25, 2013 [Review and Revision of Overload Permit Classification]
68
ORBP Reference No. OR10-010 Report No. RC-1589
Figure 54. Modification of 3-axle vehicle used for the BridgeOV – LRFR load factor analysis
When Equation 18 from the Curtis, Till report is applied the factored axle loads are as
shown in Table 18. Note that as the gross weight of the vehicle increases, the live load
factor (equiv) decreases. Note also that the gross factored weight of TV3 is 4.9% greater
than the gross factored weight of TV2 whereas the unfactored gross weight of TV3 is
14% greater than that of the unfactored gross weight of TV2.
Table 18. Three vehicle test of MDOT LRFR live load factors
Vehicle Axle Loads Factored Axle Loads
Axle 1
Axle 2 Axle 3 Gross LF
equiv
Axle 1 Axle 2 Axle 3 Gross/ Factored
TV1 8 32 32 72 1.800* 14.40 57.60 57.60 140.8
TV2 8 60 32 100 1.558 12.47 93.51 49.87 155.8
TV3 8 60 46 114 1.433 11.47 86.00 65.93 163.4
*Maximum Value
The changing of the axle load from vehicle TV2 to TV3 and the accompanying lowering
of the load factor as the vehicle load increases, leads to some peculiar behavior for
shorter span moment checks in BridgeOV.
The graph in Figure 55 shows the TV2 and TV3 moment plots in BridgeOV using the
LRFR option where the load factor varies with the gross weight of the vehicle. It can be
seen for longer spans in this figure that curve for TV2 (the lighter vehicle) is below the
TV3 vehicle as expected.

February 25, 2013 [Review and Revision of Overload Permit Classification]
69
ORBP Reference No. OR10-010 Report No. RC-1589
Figure 55. LRFR BridgeOV moment comparison of TV2 and TV3 from 10’-250’
Looking closer at the shorter span lengths in Figure 56, however reveals that the
heavier TV3 vehicle moment falls below the lighter TV2 vehicle curve, thus showing that
as the axle weight of the third axle is increased, the comparisons for the simple span
moment are improved (or made smaller).
Figure 56. LRFR BridgeOV moment comparison of TV2 and TV3 from 10’-50’

February 25, 2013 [Review and Revision of Overload Permit Classification]
70
ORBP Reference No. OR10-010 Report No. RC-1589
Plotting the same moment curves using the LFR option yields different results as the
lighter vehicle TV2 vehicle curve falls below the heavier TV3 vehicle curve (see Figure
57).
Figure 57. LFR BridgeOV moment comparison of TV2 and TV3 from 10’-50’

February 25, 2013 [Review and Revision of Overload Permit Classification]
71
ORBP Reference No. OR10-010 Report No. RC-1589
A summary of the load factors for each vehicle as well as the moments at various span
lengths are presented in Table 19 along with the controlling Michigan overload vehicle
information at each span location. Note that for the LRFR spans of 20’ and 50’ the
heavier TV3 vehicle has a lower moment in each case than the lighter TV2 vehicle.
Table 19. Overall comparison of vehicles TV1, TV2, and TV3 for LFR and LRFR
Moment values from BridgeOV
Michigan Overloads TV1 TV2 TV3
Span Length
Controlling Vehicle
Impact LF Moment LF Moment LF Moment LF Moment
LRFR
20 MIOLT-07 1.33 1.278 615.8 1.800 383.0 1.558 621.8 1.433 571.9
50 MIOLT-06 1.33 1.348 2229.7 1.800 1503.0 1.558 2022.1 1.433 2019.5
100 MIOLT-15 1.33 1.100 5520.9 1.800 3648.1 1.558 4607.1 1.433 4724.2
200 MIOLT-18 1.33 1.100 15545.4 1.800 7952.7 1.558 9786.1 1.433 10151.5
LFR
20 MIOLT-13 1.300 1.000 473.9 1.000 208.0 1.000 390.0 1.000 390.0
50 MIOLT-17 1.286 1.000 1734.3 1.000 807.2 1.000 1254.3 1.000 1362.0
100 MIOLT-15 1.222 1.000 4612.3 1.000 1862.5 1.000 2716.7 1.000 3028.8
200 MIOLT-18 1.154 1.000 12260.4 1.000 3833.0 1.000 5447.7 1.000 6144.3
Perhaps a more revealing plot of the vehicles TV2 and TV3 for short spans is shown in
Figure 58. For spans 10-ft – 20-ft the plots of the moment ratios (vehicle to HS20-14’
spacing) are parallel. Since the length of the vehicle is longer than the bridge for these
cases, the heavier of the axles is governing for each (which is 60 kips, unfactored).
Since the TV2 vehicle has a higher load factor, it is governing over the TV3 vehicle with
the lower load factor. Even though the overall factored gross weight of TV3 is larger
than that of TV2, the portion that can be placed on the structure is heavier for TV2. This
demonstrates that for the same number of axles and the same axle spacing, increasing
the axle loads can reduce the factored load effect in some cases.

February 25, 2013 [Review and Revision of Overload Permit Classification]
72
ORBP Reference No. OR10-010 Report No. RC-1589
Figure 58. BridgeOV Moment ratio plot of LRFR vehicles TV2 and TV3
5.1.8.2 Review of the Permit Vehicles in LRFR
This section reviews the effects of running some the permit vehicles discussed in
previous sections using the BridgeOV LRFR option. As with the vehicle analysis
discussed in previous sections, gage spacing was not considered as the gage spacing
was not available in the data provided by TPU. Also, girder distribution factors could not
be considered since the results were only being reviewed in light of the changes being
made to BridgeOV.
5- axle closely spaced 24 kip loads
In Section 5.1.4.6, a 5 axle vehicle with 24 kip loads spaced at 4’ was reviewed using
BridgeOV at the request of MDOT. The plot for the moment ratio is reproduced in Figure
59 (LFR) and Figure 60 (LRFR) below.
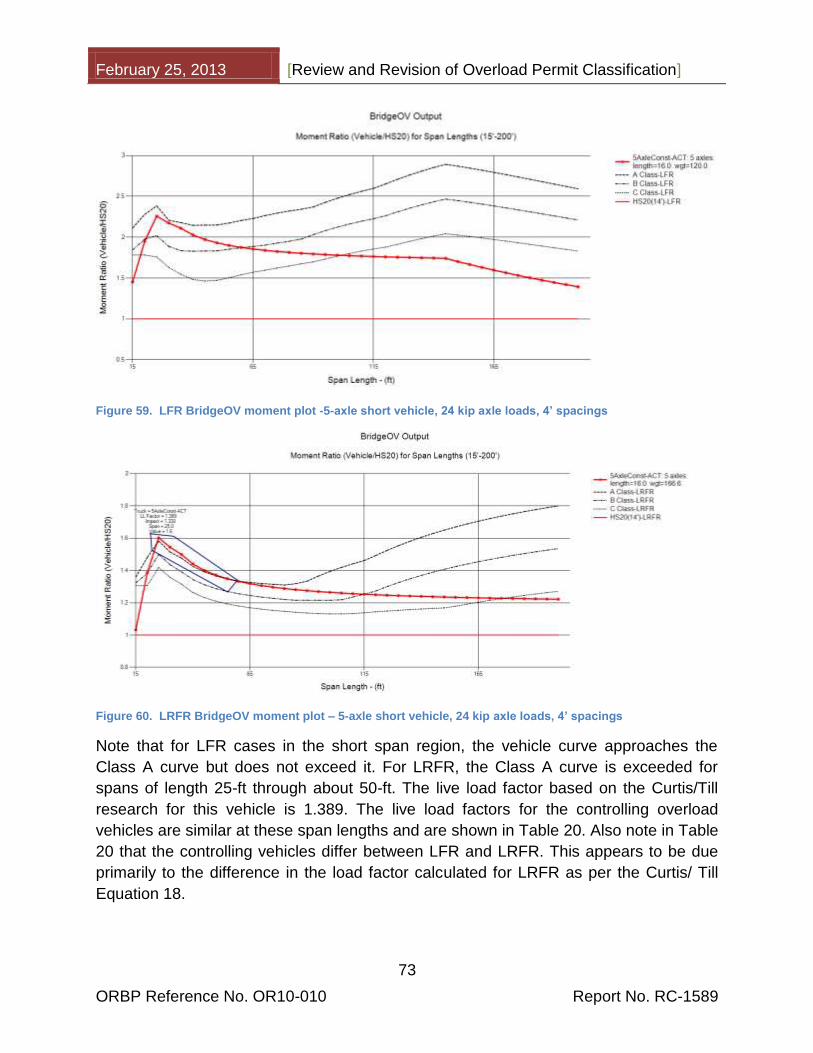
February 25, 2013 [Review and Revision of Overload Permit Classification]
73
ORBP Reference No. OR10-010 Report No. RC-1589
Figure 59. LFR BridgeOV moment plot -5-axle short vehicle, 24 kip axle loads, 4’ spacings
Figure 60. LRFR BridgeOV moment plot – 5-axle short vehicle, 24 kip axle loads, 4’ spacings
Note that for LFR cases in the short span region, the vehicle curve approaches the
Class A curve but does not exceed it. For LRFR, the Class A curve is exceeded for
spans of length 25-ft through about 50-ft. The live load factor based on the Curtis/Till
research for this vehicle is 1.389. The live load factors for the controlling overload
vehicles are similar at these span lengths and are shown in Table 20. Also note in Table
20 that the controlling vehicles differ between LFR and LRFR. This appears to be due
primarily to the difference in the load factor calculated for LRFR as per the Curtis/ Till
Equation 18.

February 25, 2013 [Review and Revision of Overload Permit Classification]
74
ORBP Reference No. OR10-010 Report No. RC-1589
Table 20. Comparison of LRFR controlling overload live load factors with 5-axle construction vehicle
Span Length
(ft)
Controlling Overload Vehicle (LFR)
Overload Vehicle
Load Factor for
LFR Controlling
Vehicle*
Controlling Overload Vehicle
(LRFR)
Overload Vehicle
Load Factor
(LRFR)
5-axle Construction Vehicle Load
Factor
25 MIOLT-12 1.100 MIOLT-05 1.389 1.389
30 MIOLT-16 1.100 MIOLT-05 1.389 1.389
35 MIOLT-07 1.278 MIOLT-06 1.348 1.389
40 MIOLT-17 1.100 MIOLT-06 1.348 1.389
45 MIOLT-17 1.100 MIOLT-06 1.348 1.389
50 MIOLT-17 1.100 MIOLT-06 1.348 1.389
*This load factor is the calculated LRFR load factor based on Curtis/Till equation 18 but
using the controlling overload vehicle for the LFR curve at the given span length.
Maximum Gross Weight
The maximum gross weight vehicles for LFR from the list of permit vehicles provided by
MDOT were discussed in Section 5.1.4.5. The comparisons shown below (Figure 61)
represent the BridgeOV moment ratio envelope for LFR and LRFR respectively. Note
that for shorter spans, the enveloped LFR curve exceeds the allowable Class A curve
while the LRFR curve is below or less than the Class A curve. It should be noted that
because of the large weight of these vehicles, all of the live load factors are the
minimum of 1.1. For shorter span lengths the load factors are higher; in the 1.348-1.389
range as shown in Table 20. This opens the possibility that these vehicles for LRFR
would pass for short spans whereas in the past (LFR) they would have failed.
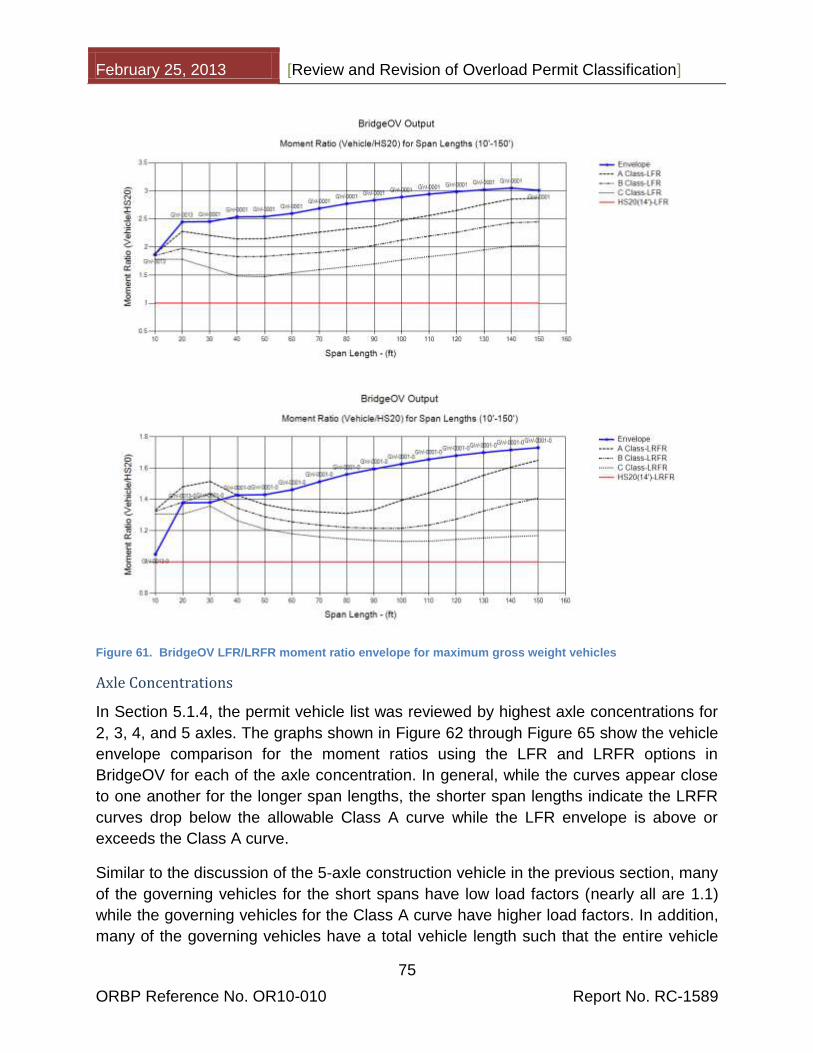
February 25, 2013 [Review and Revision of Overload Permit Classification]
75
ORBP Reference No. OR10-010 Report No. RC-1589
Figure 61. BridgeOV LFR/LRFR moment ratio envelope for maximum gross weight vehicles
Axle Concentrations
In Section 5.1.4, the permit vehicle list was reviewed by highest axle concentrations for
2, 3, 4, and 5 axles. The graphs shown in Figure 62 through Figure 65 show the vehicle
envelope comparison for the moment ratios using the LFR and LRFR options in
BridgeOV for each of the axle concentration. In general, while the curves appear close
to one another for the longer span lengths, the shorter span lengths indicate the LRFR
curves drop below the allowable Class A curve while the LFR envelope is above or
exceeds the Class A curve.
Similar to the discussion of the 5-axle construction vehicle in the previous section, many
of the governing vehicles for the short spans have low load factors (nearly all are 1.1)
while the governing vehicles for the Class A curve have higher load factors. In addition,
many of the governing vehicles have a total vehicle length such that the entire vehicle

February 25, 2013 [Review and Revision of Overload Permit Classification]
76
ORBP Reference No. OR10-010 Report No. RC-1589
does not fit on the bridge for shorter span lengths. A summary of the load factors for
span lengths 25-ft – 50-ft is shown in Table 21.
Table 21. Calculated LRFR live load factors (Curtis/Till Equation 18)
Span Length (ft)
Controlling Overload
Vehicle (LFR)
Total Length (ft)
Gross Weight
/unfactored (kips)
LRFR Load Factor
2-axle concentration 25 2AC-0015 70.3 208 1.100 30 2AC-0015 70.3 208 1.100 35 2AC-0016 221.4 480 1.100 40 2AC-0016 221.4 480 1.100 45 2AC-0016 221.4 480 1.100 50 2AC-0016 221.4 480 1.100
3-axle concentration 25 3AC-0002 70.3 208 1.100 30 3AC-0002 70.3 208 1.100 35 3AC-0002 70.3 208 1.100 40 3AC-0002 70.3 208 1.100 45 3AC-0002 70.3 208 1.100 50 3AC-0005 29.9 150.2 1.218
4-axle concentration 25 4AC-0001 70.3 208 1.100 30 4AC-0001 70.3 208 1.100 35 4AC-0011 221.4 480 1.100 40 4AC-0011 221.4 480 1.100 45 4AC-0011 221.4 480 1.100 50 4AC-0011 221.4 480 1.100
5-axle concentration 25 5AC-0001 78.2 261 1.100 30 5AC-0001 78.2 261 1.100 35 5AC-0001 78.2 261 1.100 40 5AC-0001 78.2 261 1.100 45 5AC-0024 37.9 201 1.100 50 5AC-0024 37.9 201 1.100

February 25, 2013 [Review and Revision of Overload Permit Classification]
77
ORBP Reference No. OR10-010 Report No. RC-1589
Figure 62. BridgeOV LFR/LRFR moment ratio envelope for 2-axle concentration vehicles

February 25, 2013 [Review and Revision of Overload Permit Classification]
78
ORBP Reference No. OR10-010 Report No. RC-1589
Figure 63. BridgeOV LFR/LRFR moment ratio envelope for 3-axle concentration vehicles

February 25, 2013 [Review and Revision of Overload Permit Classification]
79
ORBP Reference No. OR10-010 Report No. RC-1589
Figure 64. BridgeOV LFR/LRFR moment ratio envelope for 4-axle concentration vehicles

February 25, 2013 [Review and Revision of Overload Permit Classification]
80
ORBP Reference No. OR10-010 Report No. RC-1589
Figure 65. BridgeOV LFR/LRFR moment ratio envelope for 5-axle concentration vehicles

February 25, 2013 [Review and Revision of Overload Permit Classification]
81
ORBP Reference No. OR10-010 Report No. RC-1589
5.2 Discussion of Results
In general, the process of breaking down the permit vehicles using several different
sorting methods provides a way to quickly review a larger set of vehicles while focusing
on heavier loads and heavier load concentrations. The researchers believe that the
methods outlined in this section can continue to be used in the future by MDOT using
the software developed for this research project and using the data described in these
sections as benchmarks.
5.3 Conclusions
The following table summarizes the conclusions for the various methods of analyzing
the permit vehicles / overload vehicles described in the previous sections. When
reviewing the permit vehicles, it should be noted that the gage information was not
available in the data set. This could have an effect on the BridgeOV results observed if
the gage distance results were known and included in the analysis. In general, the gage
distance decreases the factor applied to the axles by (1/ ((gage+8) /16)). If the gage
distance is the standard 8’, the factor is equal to 1.0.
Method Conclusions
Duplicate vehicles The review of the duplicate vehicles provides a method for looking at the most commonly requested permit vehicles. While none of the vehicles that were most commonly occurring in the set exceeded the Class A allowable curve for moment or shear, several did exceed the Class B curve.
Vehicle anomalies While reviewing the permit data set, it was noticed that several apparent anomalies existed in the data with either very small axle spacings or apparently small axle loads. As such, the PVA software includes some input parameters to detect such data.
Axle concentrations Sorting the vehicles by axle concentrations (2, 3, 4, and 5 axles) permits the review of a large set of permit vehicles (in this case 16,000+) by logically sorting them into concentrations that will likely govern shear or moment. The axle concentration vehicles analyzed in this section demonstrate that these heavier loads can exceed the Class A curves and very often exceed Class B and C curves.
Maximum gross weight
This option is the easiest to sort by and captures the heaviest vehicles in the set regardless of the axle concentrations. This method is useful in combination with others and reveals vehicles that well exceed the Class A, B, and C curve.

February 25, 2013 [Review and Revision of Overload Permit Classification]
82
ORBP Reference No. OR10-010 Report No. RC-1589
Method Conclusions
Five-axle construction vehicle
This vehicle does not exceed the Class A curve (although it comes close) but does violate the Class B and C curves for shorter span lengths. This may be a concern since this represents a possible construction vehicle that is subject only to extended permit requirements, which are not limited to Class A bridges.
Review of Michigan overload vehicles
The 20 Michigan overload vehicles were reviewed with BridgeOV, and it was found that several of the vehicles (2, 3, 4, 6, 8, 11, 19 and 20) did not govern any of the points on the simple span moment, shear, or two-span shear Class A curve.
Looking closer at sets of the vehicles, it was determined that several of the vehicles could possibly be eliminated, even if only for simple span analysis. The recommendations are provided in the next section.
Review of NBI span length
Each bridge record in the NBI contains an item with the maximum span length for the structure. The researchers have concluded, based on our analysis that this value may be useful in determining the upper limit for the BridgeOV analysis. Some vehicles may pass the BridgeOV check for moment and shear on shorter spans but fail on longer spans. Thus, using the maximum span length to some degree as an upper limit would enable more short-span bridges to pass, particularly for longer length vehicles.
Review of continuous span structures
It was determined from the analysis of 28 continuous span structures provided by MDOT in Virtis and comparing them with the output of BridgeOV (which analyzes simple span for moment and shear and two-equal-span shear) that BridgeOV can be used if the maximum span length used for the BridgeOV run is set as the NBI maximum span length increased by at least a factor of 1.2 and rounded up to the nearest 5’ increment.

February 25, 2013 [Review and Revision of Overload Permit Classification]
83
ORBP Reference No. OR10-010 Report No. RC-1589
Method Conclusions
BridgeOV –
LFR vs. LRFR
LRFR capabilities were added to BridgeOV by incorporating Equation 18 of the Curtis/Till research provided by MDOT (see References section). Upon reviewing a simple 3-axle vehicle, it was noted that in shorter spans, the moment of a heavier vehicle could be less than a lighter vehicle even though the trucks were of the same length. This was attributable to the different load factors, which are a function of the weight, calculated for the vehicles.
In addition, when reviewing the other vehicles analyzed in this section using the LRFR revision to BridgeOV, it was noted that for shorter span bridges, LRFR passes vehicles that would otherwise fail using the LFR option.

February 25, 2013 [Review and Revision of Overload Permit Classification]
84
ORBP Reference No. OR10-010 Report No. RC-1589
5.4 Recommendations
The following table summarizes the researchers’ recommendations based on the
findings of the permit vehicle / overload vehicle analysis.
Method Conclusions
Duplicate vehicles While none of the duplicate vehicles analyzed exceeded the Class A curve, several exceeded the Class B and C curves.
We recommend that the PVA software be used periodically with data supplied by TPU (an Excel spreadsheet with a year’s worth of permit vehicle data similar to that used for this study) using the data provided in this report for duplicate vehicles as a benchmark. This can be useful in developing trends in the types of vehicles being permitted.
Vehicle anomalies We recommend that checks be placed somewhere in the MiTRIP software to detect anomalies in data such as too small and/or too large vehicle axle spacings and loads.
We also recommend that the PVA software be used periodically with data supplied by TPU (an Excel spreadsheet with a year’s worth of permit vehicle data similar to that used for this study) to determine if the anomaly checks added to MiTRIP are effective and, if not, adjusted.
Axle concentrations Reviewing the axle concentrations revealed several vehicles that exceeded the Class A, B and C curves.
We recommend that the PVA software be used periodically with data supplied by TPU (an Excel spreadsheet with a year’s worth of permit vehicle data similar to that used for this study) using the data provided in this report for axle concentrations as a benchmark. This can be useful in developing trends in the types of vehicles being permitted.
Maximum gross weight
Reviewing the maximum gross weight vehicles revealed several vehicles that exceeded the Class A, B and C curves.
We recommend that the PVA software be used periodically with data supplied by TPU (an Excel spreadsheet with a year’s worth of permit vehicle data similar to that used for this study) using the data provided in this report for maximum gross weight vehicles as a benchmark. This can be useful in developing trends in the types of vehicles being permitted.

February 25, 2013 [Review and Revision of Overload Permit Classification]
85
ORBP Reference No. OR10-010 Report No. RC-1589
Method Conclusions
Five-axle construction vehicle
While this vehicle did not exceed the Class A mark, it was close. It did exceed the Class B and C curves for certain spans and should be viewed a bit closer, particularly if these vehicles can be used without permitting.
Review of Michigan overload vehicles
While several of the Overload vehicles were shown not to govern, the BridgeOV analysis used to determine this was for simple span moment and shear and two-span shear only. Even so, it is recommended that vehicles 11, 19 and 20 could be removed from the set.
As a minimum, when running Virtis structures for simple span, overload vehicles 2, 3, 4, 11, 19 and 20 could be removed as they appear to be covered by the other overload vehicles.
Review of NBI span length
The researchers recommend using the NBI maximum span length with a factor of 1.2 when using BridgeOV in the MiTRIP software. This will allow some longer vehicles to pass for shorter span bridges.
Review of continuous span structures
Based on the review of the continuous span structures provided by MDOT, BridgeOV can be used with a maximum span length parameter of 1.2 within the MiTRIP software.
BridgeOV –
LFR vs. LRFR
Based on the review of LRFR as implemented using the MDOT Curtis/Till research (see References section), and since The majority of the current bridge classifications used for MiTRIP would have been established using LFR, the researchers recommend using the LFR option in BridgeOV for the MiTRIP software.

February 25, 2013 [Review and Revision of Overload Permit Classification]
86
ORBP Reference No. OR10-010 Report No. RC-1589
6 Modifications to the BridgeOV Algorithm
Revisions to the original version of the BridgeOV algorithm were performed based on
the recommendations made in the Interim Phase of this research. These revisions
include:
Updating the source code to C# .NET programming language
Updating the moment tables
Adding shear tables for simple spans
Adding shear tables for 2-spans of equal length
Providing graphical/ interactive features to the output
The following sections provide the methodology for the modifications/ enhancements as
well as recommendations for implementation of the software.
6.1 Methodology
The BridgeOV algorithm was modified to include revised values for moments and for
new values for shear. To develop the new curves for BridgeOV, the A, B and C class
vehicles were used in an envelope fashion for span lengths from 10-ft – 250-ft in 1 foot
increments. In the process, the values were checked/verified with Virtis and in the case
of the moments, were compared to the original values provided in the BridgeOV table
contained in the CLSABC2U.TXT file read in by the program (see Appendix F – Revised
CLSABC2U.txt File). This file was provided with the original software by MDOT. The
following sections describe the revisions.
For obtaining the shear and moment values produced by Virtis, span lengths for 20-ft –
200-ft were checked by using a simple span rolled beam using a set distribution factor
of 2.0. Virtis runs for shear were also made for 2 equal span bridge lengths. The values
for the shear and moment Virtis runs for these span lengths, along with comparisons to
the new BridgeOV results and the original BridgeOV class A,B,C moment table are
shown in Table 22, Table 23, and Table 24 at the end of this section.
6.1.1 Revisions to the Moment Table
To revise the moment tables, revisions were made to the BridgeOV software developed
in the Interim Phase to produce an envelope of moments for a set of vehicles loaded
into the software. To obtain the enveloped curve for Class A vehicles, all 20 Michigan
overload vehicles were loaded into the BridgeOV software.
Once loaded, the files were plotted using the ‘Plot envelope of files’ option added to the
interface (see Figure 66). Checking the box provides a plot and a table of points for the
Class A vehicles (see Figure 67). Note, the moment values in the higher span ranges

February 25, 2013 [Review and Revision of Overload Permit Classification]
87
ORBP Reference No. OR10-010 Report No. RC-1589
for the envelope are slightly higher than the original BridgeOV tabular values. Also, no
values are provided for above 200-ft in the previous version. The enveloped values
were compared against the original BridgeOV values and with the Virtis software. The
results compare favorably with Virtis values (see Table 22 at the end of this section).
The original moment table, a text file (CLSABC2U.TXT), delivered by MDOT and used
by the BridgeOV software, will be modified to include the newly calculated results.
The same comparison was made for Class B and C. There was a bit more separation
for the moments in these categories as shown in Figure 68, Figure 69 and Table 22
(provided at the end of this section). The Class C results, in particular, were about 5-7%
lower in the original program for the higher span lengths (see Table 22 at the end of this
section). We are not sure why the original values were lower, but the researchers
recommend the original BridgeOV table (CLSABC2U.TXT) be modified to include the
newly calculated envelope of results.
Figure 66. Plot envelope of files option in BridgeOV

February 25, 2013 [Review and Revision of Overload Permit Classification]
88
ORBP Reference No. OR10-010 Report No. RC-1589
Figure 67. Plot of Michigan Class A moment envelope with the existing BridgeOV Class A,B,C plots (10’-250’) NOTE: For this older version of BridgeOV, the Class A,B,C tables ended at 200’
Figure 68. Plot of Michigan Class B moment envelope with the existing BridgeOV Class A,B,C plots (10’-250’) NOTE: For this older version of BridgeOV, the Class A,B,C tables ended at 200’
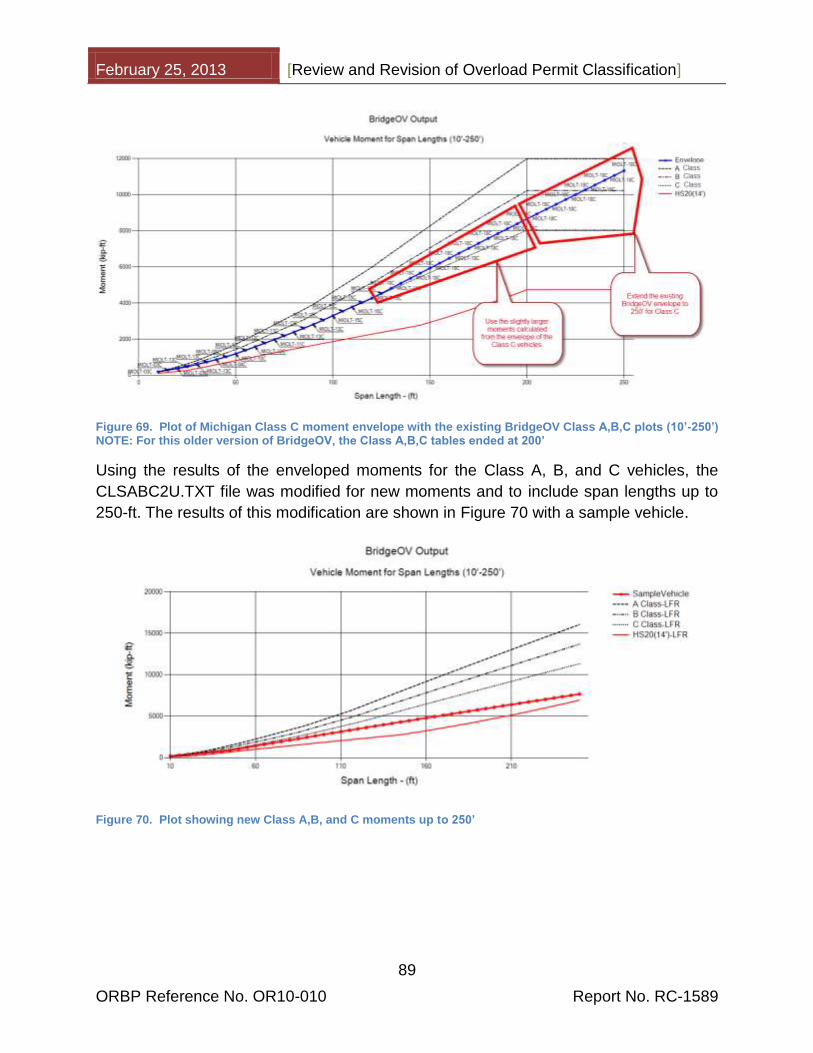
February 25, 2013 [Review and Revision of Overload Permit Classification]
89
ORBP Reference No. OR10-010 Report No. RC-1589
Figure 69. Plot of Michigan Class C moment envelope with the existing BridgeOV Class A,B,C plots (10’-250’) NOTE: For this older version of BridgeOV, the Class A,B,C tables ended at 200’
Using the results of the enveloped moments for the Class A, B, and C vehicles, the
CLSABC2U.TXT file was modified for new moments and to include span lengths up to
250-ft. The results of this modification are shown in Figure 70 with a sample vehicle.
Figure 70. Plot showing new Class A,B, and C moments up to 250’

February 25, 2013 [Review and Revision of Overload Permit Classification]
90
ORBP Reference No. OR10-010 Report No. RC-1589
6.1.2 Addition of Shear Table
The original version of the BridgeOV software did not include a calculation for shear.
Because shear can sometimes be the governing effect, especially for shorter spans, this
calculation was added to the new version of BridgeOV, but the comparison tables for
Class A, B, and C were not available in the CLSABC2U.TXT table. These values
needed to be added. To do this, we needed to verify the calculation of the shear added
to the BridgeOV software. Figure 71, Figure 72, and Figure 73 show the shear plots
using the envelope feature of the new version of BridgeOV for Class A, B, and C
respectively.
Figure 71. Plot of Michigan Class A shear envelope with the existing BridgeOV Class A,B,C plots (10’-250’) NOTE: For this older version of BridgeOV, shear values were not available for Class A,B, or C
Figure 72. Plot of Michigan Class B shear envelope with the existing BridgeOV Class A,B,C plots (10’-250’) NOTE: For this older version of BridgeOV, shear values were not available for Class A,B, or C
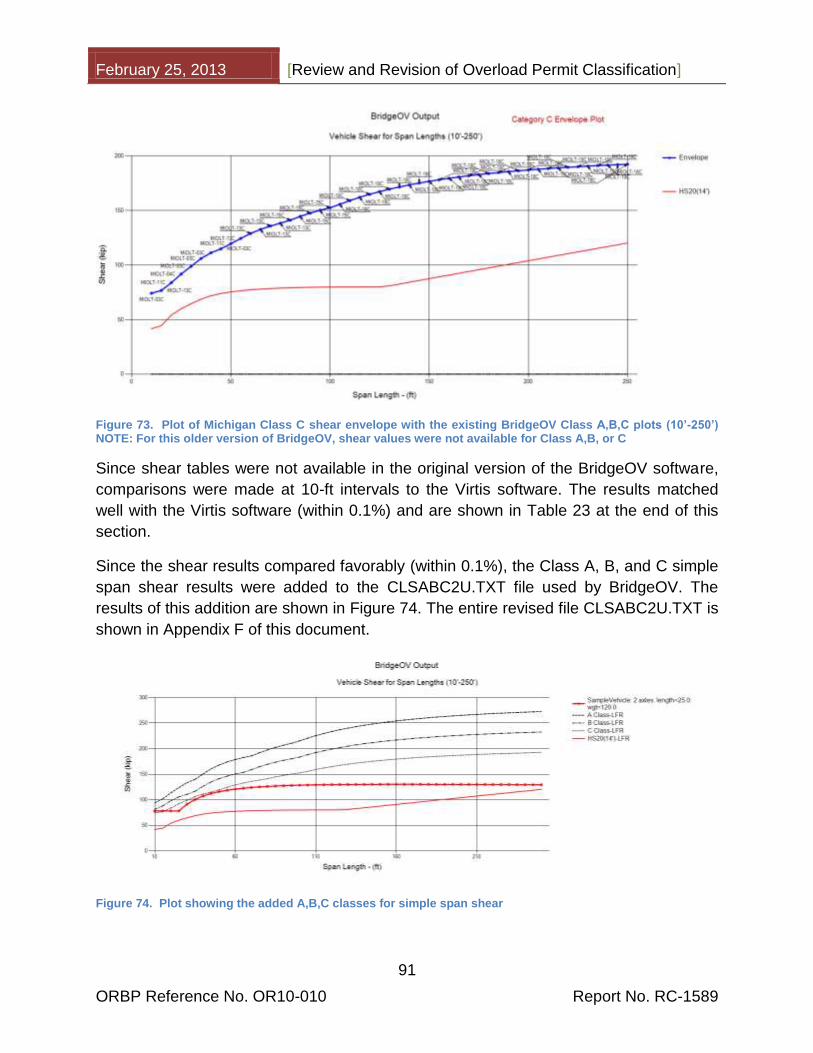
February 25, 2013 [Review and Revision of Overload Permit Classification]
91
ORBP Reference No. OR10-010 Report No. RC-1589
Figure 73. Plot of Michigan Class C shear envelope with the existing BridgeOV Class A,B,C plots (10’-250’) NOTE: For this older version of BridgeOV, shear values were not available for Class A,B, or C
Since shear tables were not available in the original version of the BridgeOV software,
comparisons were made at 10-ft intervals to the Virtis software. The results matched
well with the Virtis software (within 0.1%) and are shown in Table 23 at the end of this
section.
Since the shear results compared favorably (within 0.1%), the Class A, B, and C simple
span shear results were added to the CLSABC2U.TXT file used by BridgeOV. The
results of this addition are shown in Figure 74. The entire revised file CLSABC2U.TXT is
shown in Appendix F of this document.
Figure 74. Plot showing the added A,B,C classes for simple span shear

February 25, 2013 [Review and Revision of Overload Permit Classification]
92
ORBP Reference No. OR10-010 Report No. RC-1589
6.1.3 Adding Shear for Two Equal Spans
For shear, the maximum effect could occur at an interior support. To account for this,
BridgeOV was modified to include the shear calculation just to the left of the interior
support of a structure with two equal span lengths. To perform this calculation, the AISC
Beam Diagrams and Formulas (Ref: AISC Manual for Steel Construction) were used to
compute the reaction ‘R1’ at the left most support and the shears were then computed
just to the left of the interior support as the vehicle is stepped across the structure. This
calculation was incorporated into BridgeOV. The maximum shear is then saved from all
of the load steps.
The results of the BridgeOV addition for two equal spans were compared with results
from a Virtis Line-girder run for spans from 20-ft – 200-ft in increments of 20-ft. The
results compared favorably and are presented in Table 24 at the end of this section.
Figure 75. AISC beam diagrams and formulas for two equal spans
Since the two span shear results compared favorably, the Class A, B, and C, 2-span
shear results were added to the CLSABC2U.TXT file used by BridgeOV. The results of
this addition are shown in Figure 76. The entire revised file CLSABC2U.TXT is shown in
Appendix F of this document.
Figure 76. Plot showing the added A,B,C Classes for 2 equal spans shear

February 25, 2013 [Review and Revision of Overload Permit Classification]
93
ORBP Reference No. OR10-010 Report No. RC-1589
Table 22. Moment table comparing new BridgeOV overload values with existing BridgeOV table and Virtis
1 2 3 4 5 6 7 8 9 10 11 12 13 14 15 16 17 18 19
Span
Moment
Envelope
of
Category A
Vehicles
Controlling
Vehicle -
Category A
Moment
Envelope
of
Category B
Vehicles
Controlling
Vehicle -
Category B
Moment
Envelope of
Category C
Vehicles
Controlling
Vehicle -
Category C
Virtis
Moment
Category
A*
Virtis
Moment
Category
B*
Virtis
Moment
Category
C*
Category A
Moment-
BOV Table
Category
B Moment-
BOV Table
Category C
Moment-
BOV Table
Calculated
/BOV Table
Categ A
Calculated
/BOV
Table
Categ B
Calculated
/BOV Table
Categ C
Calculated
/ Virtis
Category A
Calculated
/ Virtis
Category B
Calculated
/ Virtis
Category C
15 329.5 MIOLT-13A 287.6 MIOLT-03B 277.9 MIOLT-03C 329.5 292.5 292.5 1.000 0.983 0.950
20 473.9 MIOLT-13A 410.7 MIOLT-13B 370.5 MIOLT-03C 473.85 410.67 370.50 473.6 410 390 1.001 1.002 0.950 1.0000 1.0000 1.0000
25 634.2 MIOLT-12A 537.2 MIOLT-08B 467.8 MIOLT-13C 634 537.3 487.5 1.000 1.000 0.960
30 807.9 MIOLT-16A 690.5 MIOLT-15B 596.7 MIOLT-13C 807.30 689.52 596.70 808.3 690.4 597 1.000 1.000 0.999 1.0008 1.0014 1.0000
35 1022.6 MIOLT-07A 861.2 MIOLT-06B 725.6 MIOLT-13C 1022.7 861.3 726 1.000 1.000 0.999
40 1253.7 MIOLT-17A 1069.0 MIOLT-17B 867.1 MIOLT-04C 1253.56 1068.92 866.32 1245.2 1035.9 867.1 1.007 1.032 1.000 1.0001 1.0001 1.0009
45 1496.8 MIOLT-17A 1276.4 MIOLT-17B 1019.5 MIOLT-08C 1468.4 1232 1019.6 1.019 1.036 1.000
50 1734.3 MIOLT-17A 1478.9 MIOLT-17B 1188.2 MIOLT-10C 1732.38 1477.22 1187.81 1723 1428.8 1187.6 1.007 1.035 1.001 1.0011 1.0011 1.0003
55 1991.4 MIOLT-10A 1697.4 MIOLT-17B 1376.8 MIOLT-12C 1991.5 1647.2 1377.7 1.000 1.031 0.999
60 2257.8 MIOLT-10A 1916.9 MIOLT-17B 1577.2 MIOLT-12C 2257.79 1915.18 1574.47 2257.8 1881.8 1578.7 1.000 1.019 0.999 1.0000 1.0009 1.0018
65 2522.0 MIOLT-12A 2134.3 MIOLT-17B 1777.6 MIOLT-12C 2522.2 2119.9 1778.5 1.000 1.007 0.999
70 2803.6 MIOLT-12A 2355.9 MIOLT-12B 1976.6 MIOLT-11C 2802.34 2354.81 1972.25 2803.7 2356.5 1977 1.000 1.000 1.000 1.0005 1.0005 1.0022
75 3083.0 MIOLT-12A 2590.6 MIOLT-12B 2181.4 MIOLT-11C 3083.5 2591.7 2181.4 1.000 1.000 1.000
80 3361.4 MIOLT-12A 2824.6 MIOLT-12B 2386.7 MIOLT-13C 3361.44 2824.57 2383.90 3361.5 2825.4 2388 1.000 1.000 0.999 1.0000 1.0000 1.0012
85 3637.9 MIOLT-12A 3069.6 MIOLT-15B 2600.2 MIOLT-13C 3638 3069.6 2601.4 1.000 1.000 1.000
90 3926.6 MIOLT-15A 3365.7 MIOLT-15B 2812.3 MIOLT-13C 3925.27 3364.51 2811.61 3926.8 3365.8 2813.8 1.000 1.000 0.999 1.0003 1.0003 1.0003
95 4269.9 MIOLT-15A 3659.9 MIOLT-15B 3049.9 MIOLT-15C 4270.5 3660.4 3050.4 1.000 1.000 1.000
100 4612.3 MIOLT-15A 3953.4 MIOLT-15B 3294.5 MIOLT-15C 4612.30 3953.40 3294.50 4612.4 3953.5 3294.6 1.000 1.000 1.000 1.0000 1.0000 1.0000
105 4952.6 MIOLT-15A 4245.1 MIOLT-15B 3537.6 MIOLT-15C 4952.6 4245.1 3537.6 1.000 1.000 1.000
110 5291.0 MIOLT-15A 4535.1 MIOLT-15B 3779.3 MIOLT-15C 5290.99 4535.14 3779.28 5291.3 4535.4 3779.5 1.000 1.000 1.000 1.0000 1.0000 1.0000
115 5627.5 MIOLT-15A 4823.6 MIOLT-15B 4019.7 MIOLT-15C 5629.1 4824.3 4020.3 1.000 1.000 1.000
120 6012.5 MIOLT-18A 5128.3 MIOLT-18B 4259.8 MIOLT-15C 6012.54 5128.34 4258.84 5975.3 5112 4260 1.006 1.003 1.000 1.0000 1.0000 1.0002
125 6412.9 MIOLT-18A 5469.8 MIOLT-18B 4526.8 MIOLT-18C 6360.7 5424.9 4498.7 1.008 1.008 1.006
130 6811.3 MIOLT-18A 5809.7 MIOLT-18B 4808.0 MIOLT-18C 6811.33 5809.66 4808.00 6744.5 5752.2 4736.5 1.010 1.010 1.015 1.0000 1.0000 1.0000
135 7208.1 MIOLT-18A 6148.1 MIOLT-18B 5088.1 MIOLT-18C 7126.7 6078.3 4973.4 1.011 1.011 1.023
140 7604.5 MIOLT-18A 6486.2 MIOLT-18B 5367.9 MIOLT-18C 7602.75 6484.70 5366.65 7507.5 6403.1 5209.4 1.013 1.013 1.030 1.0002 1.0002 1.0002
145 7999.2 MIOLT-18A 6822.9 MIOLT-18B 5646.5 MIOLT-18C 7887 6726.8 5444.6 1.014 1.014 1.037
150 8392.4 MIOLT-18A 7158.2 MIOLT-18B 5924.0 MIOLT-18C 8387.62 7154.15 5920.67 8265.1 7049.3 5679.1 1.015 1.015 1.043 1.0006 1.0006 1.0006
155 8784.0 MIOLT-18A 7492.3 MIOLT-18B 6200.5 MIOLT-18C 8642 7370.7 5912.8 1.016 1.016 1.049
160 9174.3 MIOLT-18A 7825.2 MIOLT-18B 6476.0 MIOLT-18C 9166.62 7818.59 6470.55 9017.6 7691.2 6145.7 1.017 1.017 1.054 1.0008 1.0008 1.0008
165 9563.3 MIOLT-18A 8156.9 MIOLT-18B 6750.6 MIOLT-18C 9392.2 8010.6 6381.7 1.018 1.018 1.058
170 9951.0 MIOLT-18A 8487.6 MIOLT-18B 7024.2 MIOLT-18C 9940.35 8478.53 7016.72 9765.6 8329.2 6617.4 1.019 1.019 1.061 1.0011 1.0011 1.0011
175 10338.1 MIOLT-18A 8817.8 MIOLT-18B 7297.5 MIOLT-18C 10138.1 8646.9 6852.5 1.020 1.020 1.065
180 10724.6 MIOLT-18A 9147.5 MIOLT-18B 7570.3 MIOLT-18C 10709.32 9134.42 7559.52 10509.5 8963.7 7087 1.020 1.021 1.068 1.0014 1.0014 1.0014
185 11110.1 MIOLT-18A 9476.2 MIOLT-18B 7842.4 MIOLT-18C 10880 9279.7 7320.9 1.021 1.021 1.071
190 11494.5 MIOLT-18A 9804.1 MIOLT-18B 8113.8 MIOLT-18C 11474.00 9786.64 8099.29 11249.6 9594.9 7554.2 1.022 1.022 1.074 1.0018 1.0018 1.0018
195 11877.9 MIOLT-18A 10131.2 MIOLT-18B 8384.4 MIOLT-18C 11618.3 9909.4 7792.1 1.022 1.022 1.076
200 12260.4 MIOLT-18A 10457.4 MIOLT-18B 8654.4 MIOLT-18C 12234.77 10435.54 8636.31 11986.2 10223.2 8038.9 1.023 1.023 1.077 1.0021 1.0021 1.0021
Note: Needed to add a 1/20th point near midspan
New BridgeOV Calculated Values (Overload Vehicles Envelope)
Values from Virtis Line Girder
Analysis Original BridgeOV Tables
Ratio of BridgeOV Tables with New
Bridge OV Overload vehicle
envelope
Ratio of new BridgeOV with Virtis
calculated values

February 25, 2013 [Review and Revision of Overload Permit Classification]
94
ORBP Reference No. OR10-010 Report No. RC-1589
Table 23. Shear table comparing new BridgeOV overload values with Virtis
1 2 3 4 5 6 7 8 9 10 11 12 13 14 15 16 17 18 19
Span
Length
Shear
Envelope of
Category A
Vehicles
Controlling
Vehicle -
Category A
Shear
Envelope of
Category B
Vehicles
Controlling
Vehicle -
Category B
Shear
Envelope of
Category C
Vehicles
Controlling
Vehicle -
Category C
Virtis
Shear
Category
A
Virtis
Shear
Category
B
Virtis
Shear
Category
C
Category
A
Moment-
BOV
Table
Category
B
Moment-
BOV
Table
Category
C
Moment-
BOV
Table
Calculated
/BOV Table
Categ A
Calculated
/BOV Table
Categ B
Calculated
/BOV Table
Categ B
Calculated /
Virtis
Category A
Calculated
/ Virtis
Category B
Calculated
/ Virtis
Category C
15 101.7 MIOLT-12A 87.9 MIOLT-13B 76.6 MIOLT-13C n/a n/a n/a n/a n/a n/a
20 113.1 MIOLT-05A 98.0 MIOLT-05B 83.7 MIOLT-11C 113.10 98.02 83.72 n/a n/a n/a n/a n/a n/a 1.0000 1.0000 1.0000
25 123.8 MIOLT-07A 105.5 MIOLT-05B 91.7 MIOLT-04C n/a n/a n/a n/a n/a n/a
30 133.1 MIOLT-07A 110.4 MIOLT-05B 98.8 MIOLT-03C 133.05 110.41 98.80 n/a n/a n/a n/a n/a n/a 1.0000 1.0000 1.0000
35 139.7 MIOLT-07A 116.3 MIOLT-08B 105.9 MIOLT-03C n/a n/a n/a n/a n/a n/a
40 150.2 MIOLT-12A 126.2 MIOLT-12B 111.2 MIOLT-03C 150.15 126.25 111.15 n/a n/a n/a n/a n/a n/a 1.0000 1.0000 1.0000
45 160.3 MIOLT-12A 134.7 MIOLT-12B 114.7 MIOLT-03C n/a n/a n/a n/a n/a n/a
50 167.8 MIOLT-12A 141.1 MIOLT-12B 119.5 MIOLT-11C 167.83 141.08 119.47 n/a n/a n/a n/a n/a n/a 1.0000 1.0000 1.0000
55 173.8 MIOLT-12A 146.1 MIOLT-12B 124.3 MIOLT-13C n/a n/a n/a n/a n/a n/a
60 178.5 MIOLT-12A 150.1 MIOLT-12B 128.8 MIOLT-13C 178.54 150.07 128.85 n/a n/a n/a n/a n/a n/a 1.0000 1.0000 1.0000
65 182.4 MIOLT-12A 153.3 MIOLT-12B 132.6 MIOLT-13C n/a n/a n/a n/a n/a n/a
70 185.6 MIOLT-12A 158.7 MIOLT-15B 135.7 MIOLT-13C 185.59 158.74 135.68 n/a n/a n/a n/a n/a n/a 1.0000 1.0000 1.0000
75 191.8 MIOLT-15A 164.4 MIOLT-15B 138.3 MIOLT-13C n/a n/a n/a n/a n/a n/a
80 197.4 MIOLT-15A 169.2 MIOLT-15B 141.0 MIOLT-15C 197.44 169.23 141.03 n/a n/a n/a n/a n/a n/a 1.0000 1.0000 1.0000
85 202.3 MIOLT-15A 173.4 MIOLT-15B 144.5 MIOLT-15C n/a n/a n/a n/a n/a n/a
90 206.5 MIOLT-15A 177.0 MIOLT-15B 147.5 MIOLT-15C 206.49 177.00 147.50 n/a n/a n/a n/a n/a n/a 1.0000 1.0000 1.0000
95 210.4 MIOLT-16A 180.1 MIOLT-15B 150.1 MIOLT-15C n/a n/a n/a n/a n/a n/a
100 215.0 MIOLT-18A 183.4 MIOLT-18B 152.4 MIOLT-15C 214.98 183.37 152.41 n/a n/a n/a n/a n/a n/a 1.0000 1.0000 1.0000
105 220.4 MIOLT-18A 188.0 MIOLT-18B 155.5 MIOLT-18C n/a n/a n/a n/a n/a n/a
110 225.2 MIOLT-18A 192.1 MIOLT-18B 158.9 MIOLT-18C 225.18 192.05 158.94 n/a n/a n/a n/a n/a n/a 0.9999 1.0000 1.0000
115 229.5 MIOLT-18A 195.7 MIOLT-18B 162.0 MIOLT-18C n/a n/a n/a n/a n/a n/a
120 233.4 MIOLT-18A 199.0 MIOLT-18B 164.7 MIOLT-18C 233.35 199.03 164.72 n/a n/a n/a n/a n/a n/a 1.0000 1.0000 1.0000
125 236.9 MIOLT-18A 202.0 MIOLT-18B 167.2 MIOLT-18C n/a n/a n/a n/a n/a n/a
130 240.0 MIOLT-18A 204.7 MIOLT-18B 169.4 MIOLT-18C 240.04 204.74 169.44 n/a n/a n/a n/a n/a n/a 1.0000 1.0000 1.0000
135 242.9 MIOLT-18A 207.2 MIOLT-18B 171.5 MIOLT-18C n/a n/a n/a n/a n/a n/a
140 245.6 MIOLT-18A 209.5 MIOLT-18B 173.3 MIOLT-18C 245.57 209.46 173.34 n/a n/a n/a n/a n/a n/a 1.0000 1.0000 1.0000
145 248.0 MIOLT-18A 211.5 MIOLT-18B 175.0 MIOLT-18C n/a n/a n/a n/a n/a n/a
150 250.2 MIOLT-18A 213.4 MIOLT-18B 176.6 MIOLT-18C 250.20 213.40 176.61 n/a n/a n/a n/a n/a n/a 1.0000 1.0000 1.0000
155 252.2 MIOLT-18A 215.1 MIOLT-18B 178.0 MIOLT-18C n/a n/a n/a n/a n/a n/a
160 254.1 MIOLT-18A 216.7 MIOLT-18B 179.4 MIOLT-18C 254.11 216.74 179.37 n/a n/a n/a n/a n/a n/a 1.0000 1.0000 1.0000
165 255.8 MIOLT-18A 218.2 MIOLT-18B 180.6 MIOLT-18C n/a n/a n/a n/a n/a n/a
170 257.4 MIOLT-18A 219.6 MIOLT-18B 181.7 MIOLT-18C 257.44 219.58 181.73 n/a n/a n/a n/a n/a n/a 1.0000 1.0000 1.0000
175 258.9 MIOLT-18A 220.9 MIOLT-18B 182.8 MIOLT-18C n/a n/a n/a n/a n/a n/a
180 260.3 MIOLT-18A 222.0 MIOLT-18B 183.7 MIOLT-18C 260.31 222.03 183.75 n/a n/a n/a n/a n/a n/a 1.0000 1.0000 1.0000
185 261.6 MIOLT-18A 223.1 MIOLT-18B 184.7 MIOLT-18C n/a n/a n/a n/a n/a n/a
190 262.8 MIOLT-18A 224.1 MIOLT-18B 185.5 MIOLT-18C 262.78 224.14 185.49 n/a n/a n/a n/a n/a n/a 1.0000 1.0000 1.0000
195 263.9 MIOLT-18A 225.1 MIOLT-18B 186.3 MIOLT-18C n/a n/a n/a n/a n/a n/a
200 264.9 MIOLT-18A 226.0 MIOLT-18B 187.0 MIOLT-18C 264.94 225.98 187.02 n/a n/a n/a n/a n/a n/a 1.0000 1.0000 1.0000
**Note: For shear, there were no original BridgeOV values
New BridgeOV Calculated Values (Overload Vehicles Envelope)
Values from Virtis Line
Girder Analysis Original BridgeOV Tables**
Ratio of BridgeOV Tables with New
Bridge OV Overload vehicle
envelope
Ratio of new BridgeOV with Virtis
calculated values
Table 24. Shear (2 equal spans) table comparing New BridgeOV overload values with Virtis
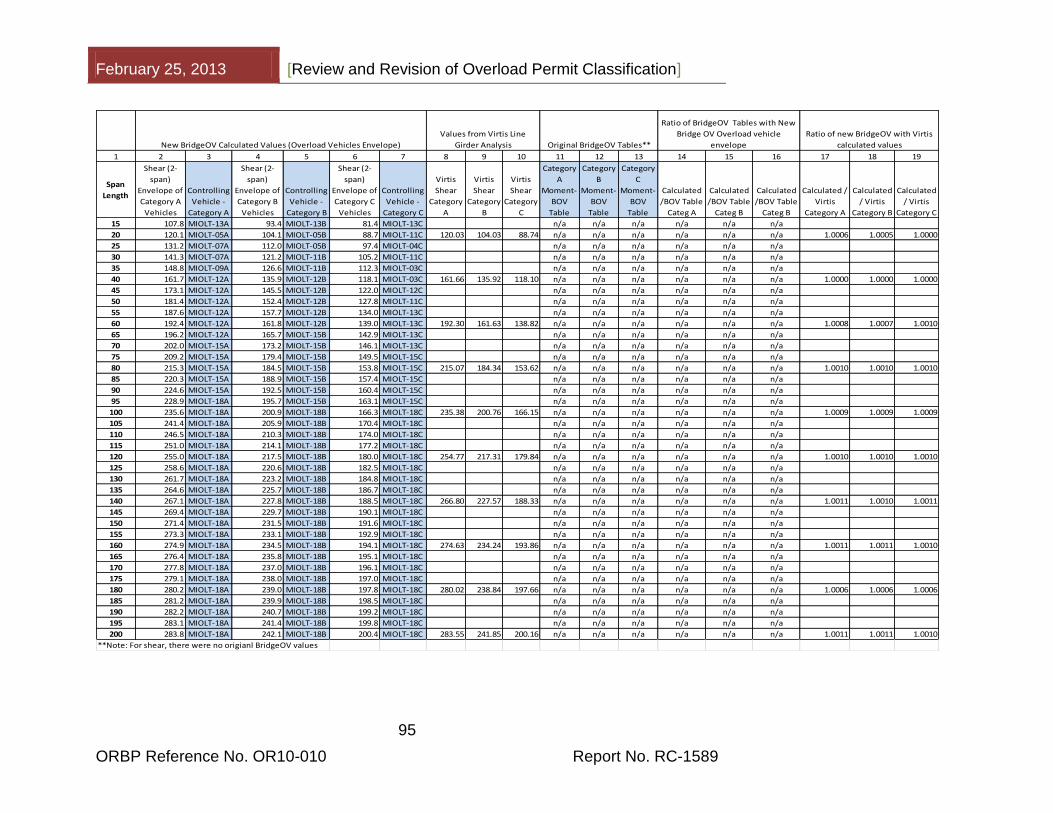
February 25, 2013 [Review and Revision of Overload Permit Classification]
95
ORBP Reference No. OR10-010 Report No. RC-1589
1 2 3 4 5 6 7 8 9 10 11 12 13 14 15 16 17 18 19
Span
Length
Shear (2-
span)
Envelope of
Category A
Vehicles
Controlling
Vehicle -
Category A
Shear (2-
span)
Envelope of
Category B
Vehicles
Controlling
Vehicle -
Category B
Shear (2-
span)
Envelope of
Category C
Vehicles
Controlling
Vehicle -
Category C
Virtis
Shear
Category
A
Virtis
Shear
Category
B
Virtis
Shear
Category
C
Category
A
Moment-
BOV
Table
Category
B
Moment-
BOV
Table
Category
C
Moment-
BOV
Table
Calculated
/BOV Table
Categ A
Calculated
/BOV Table
Categ B
Calculated
/BOV Table
Categ B
Calculated /
Virtis
Category A
Calculated
/ Virtis
Category B
Calculated
/ Virtis
Category C
15 107.8 MIOLT-13A 93.4 MIOLT-13B 81.4 MIOLT-13C n/a n/a n/a n/a n/a n/a
20 120.1 MIOLT-05A 104.1 MIOLT-05B 88.7 MIOLT-11C 120.03 104.03 88.74 n/a n/a n/a n/a n/a n/a 1.0006 1.0005 1.0000
25 131.2 MIOLT-07A 112.0 MIOLT-05B 97.4 MIOLT-04C n/a n/a n/a n/a n/a n/a
30 141.3 MIOLT-07A 121.2 MIOLT-11B 105.2 MIOLT-11C n/a n/a n/a n/a n/a n/a
35 148.8 MIOLT-09A 126.6 MIOLT-11B 112.3 MIOLT-03C n/a n/a n/a n/a n/a n/a
40 161.7 MIOLT-12A 135.9 MIOLT-12B 118.1 MIOLT-03C 161.66 135.92 118.10 n/a n/a n/a n/a n/a n/a 1.0000 1.0000 1.0000
45 173.1 MIOLT-12A 145.5 MIOLT-12B 122.0 MIOLT-12C n/a n/a n/a n/a n/a n/a
50 181.4 MIOLT-12A 152.4 MIOLT-12B 127.8 MIOLT-11C n/a n/a n/a n/a n/a n/a
55 187.6 MIOLT-12A 157.7 MIOLT-12B 134.0 MIOLT-13C n/a n/a n/a n/a n/a n/a
60 192.4 MIOLT-12A 161.8 MIOLT-12B 139.0 MIOLT-13C 192.30 161.63 138.82 n/a n/a n/a n/a n/a n/a 1.0008 1.0007 1.0010
65 196.2 MIOLT-12A 165.7 MIOLT-15B 142.9 MIOLT-13C n/a n/a n/a n/a n/a n/a
70 202.0 MIOLT-15A 173.2 MIOLT-15B 146.1 MIOLT-13C n/a n/a n/a n/a n/a n/a
75 209.2 MIOLT-15A 179.4 MIOLT-15B 149.5 MIOLT-15C n/a n/a n/a n/a n/a n/a
80 215.3 MIOLT-15A 184.5 MIOLT-15B 153.8 MIOLT-15C 215.07 184.34 153.62 n/a n/a n/a n/a n/a n/a 1.0010 1.0010 1.0010
85 220.3 MIOLT-15A 188.9 MIOLT-15B 157.4 MIOLT-15C n/a n/a n/a n/a n/a n/a
90 224.6 MIOLT-15A 192.5 MIOLT-15B 160.4 MIOLT-15C n/a n/a n/a n/a n/a n/a
95 228.9 MIOLT-18A 195.7 MIOLT-15B 163.1 MIOLT-15C n/a n/a n/a n/a n/a n/a
100 235.6 MIOLT-18A 200.9 MIOLT-18B 166.3 MIOLT-18C 235.38 200.76 166.15 n/a n/a n/a n/a n/a n/a 1.0009 1.0009 1.0009
105 241.4 MIOLT-18A 205.9 MIOLT-18B 170.4 MIOLT-18C n/a n/a n/a n/a n/a n/a
110 246.5 MIOLT-18A 210.3 MIOLT-18B 174.0 MIOLT-18C n/a n/a n/a n/a n/a n/a
115 251.0 MIOLT-18A 214.1 MIOLT-18B 177.2 MIOLT-18C n/a n/a n/a n/a n/a n/a
120 255.0 MIOLT-18A 217.5 MIOLT-18B 180.0 MIOLT-18C 254.77 217.31 179.84 n/a n/a n/a n/a n/a n/a 1.0010 1.0010 1.0010
125 258.6 MIOLT-18A 220.6 MIOLT-18B 182.5 MIOLT-18C n/a n/a n/a n/a n/a n/a
130 261.7 MIOLT-18A 223.2 MIOLT-18B 184.8 MIOLT-18C n/a n/a n/a n/a n/a n/a
135 264.6 MIOLT-18A 225.7 MIOLT-18B 186.7 MIOLT-18C n/a n/a n/a n/a n/a n/a
140 267.1 MIOLT-18A 227.8 MIOLT-18B 188.5 MIOLT-18C 266.80 227.57 188.33 n/a n/a n/a n/a n/a n/a 1.0011 1.0010 1.0011
145 269.4 MIOLT-18A 229.7 MIOLT-18B 190.1 MIOLT-18C n/a n/a n/a n/a n/a n/a
150 271.4 MIOLT-18A 231.5 MIOLT-18B 191.6 MIOLT-18C n/a n/a n/a n/a n/a n/a
155 273.3 MIOLT-18A 233.1 MIOLT-18B 192.9 MIOLT-18C n/a n/a n/a n/a n/a n/a
160 274.9 MIOLT-18A 234.5 MIOLT-18B 194.1 MIOLT-18C 274.63 234.24 193.86 n/a n/a n/a n/a n/a n/a 1.0011 1.0011 1.0010
165 276.4 MIOLT-18A 235.8 MIOLT-18B 195.1 MIOLT-18C n/a n/a n/a n/a n/a n/a
170 277.8 MIOLT-18A 237.0 MIOLT-18B 196.1 MIOLT-18C n/a n/a n/a n/a n/a n/a
175 279.1 MIOLT-18A 238.0 MIOLT-18B 197.0 MIOLT-18C n/a n/a n/a n/a n/a n/a
180 280.2 MIOLT-18A 239.0 MIOLT-18B 197.8 MIOLT-18C 280.02 238.84 197.66 n/a n/a n/a n/a n/a n/a 1.0006 1.0006 1.0006
185 281.2 MIOLT-18A 239.9 MIOLT-18B 198.5 MIOLT-18C n/a n/a n/a n/a n/a n/a
190 282.2 MIOLT-18A 240.7 MIOLT-18B 199.2 MIOLT-18C n/a n/a n/a n/a n/a n/a
195 283.1 MIOLT-18A 241.4 MIOLT-18B 199.8 MIOLT-18C n/a n/a n/a n/a n/a n/a
200 283.8 MIOLT-18A 242.1 MIOLT-18B 200.4 MIOLT-18C 283.55 241.85 200.16 n/a n/a n/a n/a n/a n/a 1.0011 1.0011 1.0010
**Note: For shear, there were no origianl BridgeOV values
New BridgeOV Calculated Values (Overload Vehicles Envelope)
Values from Virtis Line
Girder Analysis Original BridgeOV Tables**
Ratio of BridgeOV Tables with New
Bridge OV Overload vehicle
envelope
Ratio of new BridgeOV with Virtis
calculated values
February 25, 2013 [Review and Revision of Overload Permit Classification]
96
ORBP Reference No. OR10-010 Report No. RC-1589
6.1.4 Adding the Maximum Span Length
As described in Section 5.1.6 and 5.1.7, the NBI maximum span length item 48 can be
used to pass some longer vehicles on shorter bridges. BridgeOV was modified to allow
for an upper span range. When this value is set, BridgeOV will only analyze values up
to that span length.
6.1.5 Interface Features
BridgeOV was originally written when graphical user interfaces were less common and
more cumbersome to write and maintain. The updated software is written in the
Microsoft .NET programming environment and is able to take advantage of graphing
and user interface features that are intrinsic to that environment. The following features
have been added to the BridgeOV software:
Graphical plotting of the vehicle curve as compared to the Class A, B, and C
curves.
Input using a GUI (graphical user interface).
Loading of multiple vehicles at one time for comparative plotting.
Envelope plotting of multiple vehicles.
Several windows of BridgeOV can be opened at once.
Graphs can be copied to the clipboard and pasted in other documents.
Data grids can be copied to the clipboard and pasted into spreadsheets.
The features above were vital to this research; all of the graphs produced in this
document were created using the BridgeOV software. The software is delivered as part
of this project and will continue to be of value to MDOT bridge engineers.
6.2 Discussion of Results
The BridgeOV software continues to be a useful tool, and the upgrades to include shear
and enhanced interface features will make the tool even more useful. This software,
coupled with the PVA software discussed in Section 5.1.1 of this document, provides a
mini-toolbox for periodically reviewing and analyzing permit vehicle lists provided by the
TPU or weigh-in-motion (WIM) data.
6.3 Conclusions/Recommendations
Based on the results of this section and of the previous sections where heavier permit
vehicles are reviewed using the revised algorithm, it is recommended that the revised
BridgeOV program be implemented as part of the overall Permit Rating analysis
process. The BridgeOV algorithm has been integrated into the BridgeOV-Virtis software

February 25, 2013 [Review and Revision of Overload Permit Classification]
97
ORBP Reference No. OR10-010 Report No. RC-1589
which will run BridgeOV if the bridge in question is not present in the Virtis database. A
flowchart describing the overall process is provided in Figure 79 and Figure 80.
7 Final Conclusions
Based on the research presented, the following is a summary of the conclusions of this
research:
Phased approach Michigan is a Virtis state and is currently inputting many of the state Bridge structures into Virtis. Rating bridges based on real world analysis taking into account recent condition changes provide the best rating possibility. However, until all bridges can be entered into Virtis and the data validated, a phased approach using a version of BridgeOV as a substitute for Virtis can be used. This approach is implemented in the API described in ‘Appendix G – BridgeOV-Virtis Application Programming Interface (API) interface’.
The phased approach flowchart is shown in Figure 79 and Figure 80
Analysis of vehicles
A review of a yearly list of 16,000+ permit vehicles provided some insight into the size of vehicles being permitted on Michigan roads. This list was reviewed and sorted using a variety of methods outlined in Section 5 of this document comparing the results of this analysis with those of the Michigan Overload vehicles. This analysis provides a benchmark for future review of Michigan permit vehicles.
Using the NBI maximum span length
For non-Virtis structures (i.e. structures that are analyzed using in BridgeOV), it was determined that the NBI data item describing maximum span length could be used to pass some shorter span structures for vehicles that are longer in length.
Vehicle anomalies During the review of the permit vehicle data it was discovered that some of the data appeared anomalous (e.g. axle spacing of 4 inches). This data may be the result of typos in the permit entry process.
February 25, 2013 [Review and Revision of Overload Permit Classification]
98
ORBP Reference No. OR10-010 Report No. RC-1589
BridgeOV-LFR vs. LRFR
LRFR capabilities were added to BridgeOV by incorporating Equation 18 of the Curtis/Till research provided by MDOT (see ‘References’ section). Upon reviewing a simple 3 axle vehicle, it was noted that in shorter spans, the factored moment of a heavier vehicle could be less than a lighter vehicle even though the trucks were of the same length. This was attributable to the different load factors, which are a function of the weight and include probability, calculated for the vehicles.
In addition, when reviewing the other vehicles analyzed in this section using the LRFR revision to BridgeOV, it was noted that for shorter span bridges, LRFR passes vehicles that would otherwise fail using the LFR option.
8 Recommendations for Implementation
The following sections provide recommendations for implementing the results of
research provided in this document.
8.1 Implement the API
The BridgeOV-Virtis API as described in Appendix G should be implemented in the
MiTRIP routing software. In addition to the documentation provided in Appendix G, the
BridgeOV-Virtis application delivered with this project provides an example of its
implementation. The API is described in more detail in Figure 79 and Figure 80, but the
highlights include:
A phased approach, where a BridgeOV analysis is used when a bridge is not
present in the Virtis database.
Using the NBI maximum span length for cases where BridgeOV is used for the
analysis.
Simple span shear and 2 equal span shear checks added to BridgeOV.
The API allows for the use of the LFR or LRFR (MDOT version based on
Curtis/Till load factors). The current default and the researchers recommendation
is to use the LFR option.
Virtis bridges can be added to the process at any time.
8.2 Virtis Database Development
The researchers recommend the continued development of the MDOT Virtis database.
While the tools provided with this research project will work without the Virtis software
and are an improvement over the previous version of the BridgeOV, the overall
recommendation is to provide as much analysis in the Virtis software as possible. Virtis
provides a more refined analysis/rating of bridges that cannot be performed by data

February 25, 2013 [Review and Revision of Overload Permit Classification]
99
ORBP Reference No. OR10-010 Report No. RC-1589
available in the NBI bridge records. MDOT is currently a Virtis licensee and user state
and continues to input more bridges into the Virtis system. As more and more bridges
become available in the Virtis database, a more accurate assessment of bridge rating
for overload permits will be possible.
During the development of the database, methods described in the software user
manual section of this document for increasing the efficiency of the Virtis analysis (see
Section 10.2.3) should be followed. Prioritization of the bridges entered into Virtis and
used by the permitting database should take place. ‘Problem’ bridges (i.e. ones in which
permit rating issues have arisen in the past)
8.3 Periodic Use of the Software Tools
Several tools were developed for this research project that can continue to be used by
the MDOT bridge group in coming years for the periodic analysis of permit vehicles and
WIM data. Using the PVA software and standalone BridgeOV software developed for
this project, the most current vehicle data can be analyzed annually to determine trends
in vehicle loads using the data provided in this report as a benchmark. This includes an
annual review of the permit vehicle list (and possibly WIM data) by sorting the data
using the software according to axle concentration and maximum gross weight.
Envelope curves produced by the BridgeOV-Standalone tool can be compared to
previous years to track any trends in vehicle loading.
8.4 Implementation of Training Course
A four hour training course was developed and presented to MDOT as part of this
research project. The course covers the use of the software developed for this project
and was designed to be presented to others learning to use the software. MDOT can
use this training material as a tutorial to present the software use to others.
9 Recommendations for Further Research The software tools developed for this project allow for additional research by MDOT
staff. The following is a list of suggested future research:
Periodic reviews of the permit vehicle data using the PVA software tool along
with the BridgeOV-Standalone tool. Efforts should be made to compare future
data using these tools with the benchmarks set in this research.
Review of the LRFR load factors as calculated using equation 18 of the Curtis/
Till research to determine if the behavior described in this report was expected or
anomalous.
Review of MDOT WIM data using the software tools created for this project.

February 25, 2013 [Review and Revision of Overload Permit Classification]
100
ORBP Reference No. OR10-010 Report No. RC-1589
10 BridgeOV Software User Manual
This section serves as a User Manual or Guide for the BridgeOV software. The software
has three primary sections:
Running BridgeOV standalone
Running BridgeOV with Virtis
Tool for analyzing permit vehicle axle configurations
Each of these will be described in the following sections along with some tips of for
preparing the Virtis Database to optimize the use of the BridgeOV/Virtis portion of the
software.
Appendix F provides a description of BridgeOV file that stores the Class A, B, and C
moments and shears that are used to compare the calculated moments and shears.
Appendix G provides a description of the BridgeOV/Virtis API form running the calling
the program and interpreting the results from another program (such as MiTRIP).

February 25, 2013 [Review and Revision of Overload Permit Classification]
101
ORBP Reference No. OR10-010 Report No. RC-1589
10.1 Starting the BridgeOV-Virtis program
When starting the BridgeOV-Virtis program, the user is prompted for Virtis database
information similar to the window when starting the Virtis standalone program. Since the
user must connect to the Virtis database in order to analyze bridges in Virtis, the
username, password and data source must be provided (see Figure 77). These will be
the same values use to login into the Virtis system.
Figure 77. BridgeOV-Virtis login screen
If the user selects ‘Cancel’, the program will still open and will be able to run the
BridgeOV-Virtis (as well as PVA, and the BridgeOV-standalone program), but
BridgeOV-Virtis will not be able to analyze bridges from the Virtis database. The ‘Login
to Virtis’ menu option will appear in the ‘File’ menu for the user to retry the login (see
Figure 78).

February 25, 2013 [Review and Revision of Overload Permit Classification]
102
ORBP Reference No. OR10-010 Report No. RC-1589
Figure 78. BridgeOV-Virtis option disabled
Once the program is initialized, the following options are available:
Running BridgeOV-Virtis.
Running BridgeOV standalone tool.
Running the Permit analysis tool.
The following sections provide descriptions for each of these.

February 25, 2013 [Review and Revision of Overload Permit Classification]
103
ORBP Reference No. OR10-010 Report No. RC-1589
10.2 BridgeOV/Virtis
The BridgeOV/Virtis program runs BridgeOV and Virtis in a batch mode. The intention is
to incorporate the software into the MiTRIP routing software to return PASS/FAIL
results. The overall logic of the software is illustrated in Figure 79 and Figure 80.
The program takes the following as input:
List of bridges described by their NBI bridge id number along with specific bridge
parameters including: the ABCD class, the R or S flag, the NBI Maximum span
length.
The vehicle to be analyzed with the specific axle loads, axle spacings and gage
distances for each axle.
The details of the above parameters are discussed in the API document provided in
Appendix G.
The program attempts to analyze all bridges in Virtis using the vehicle provided. If the
bridge is not present in the Virtis database or the Virtis analysis fails for some reason,
the program will analyze the bridge and return a PASS/FAIL based on the BridgeOV
run. The details of the process are described in the flowcharts provided in Figure 79 and
Figure 80.
The following sections provide a description of the interface used to illustrate how the
API can be implemented.

February 25, 2013 [Review and Revision of Overload Permit Classification]
104
ORBP Reference No. OR10-010 Report No. RC-1589
Run BridgeOV
with Standard 8'
Gage*
Save Results for
spans 15'-250'
Is W < 8'? Yes Set W = 8'
No
Is W > 8'? Yes
Run BridgeOV
with Actual gage
width W.
BridgeOV will
factor axle loads
by dividing by
(W + 8/ 16)
Save Results for
spans 15'-250'
No
**Note: Standard 8' gage measured as
out-to-out of tires (as shown in the BAG
manual). For Virtis, the 8' standard
widthe will be taken as the 6' c-c of the
wheels.
The value W will be based on the
<gage_distance> tag provided on the
first axle (see API document).
Virts BridgeOV
Read XML Input file
with bridge list and
vehicle information
(See API Document)
Process Bridge List
Write XML
output File
(See API
Document)
End
Figure 79. BridgeOV/Virtis logic (Part 1)

February 25, 2013 [Review and Revision of Overload Permit Classification]
105
ORBP Reference No. OR10-010 Report No. RC-1589
Do I =
1 to NumBridges
Is RorS = ‘S?’CAT = B or C?
Yes YesIs any axle > 38,000
pounds? Yes
FAIL
No
Run
AASHTOWare
Virts
No
CAT = A?
Virtis produced
Rating?Yes
Operating
RF < 1.0?
PASS
Yes
End Do
Yes
Get Results from
BridgeOV runs.
If RorS = ‘R’
get critical results
using the standard
gage
Otherwise...
get critical results
using actual gage
Use range of
15' to 1.2 * Max Span
Length
When retrieving results.
CAT = D?
No
Yes
FAIL
No
No
Conditional
Pass?
No
Yes
Report passing
criteria
CAT = F?
No
Pass
BridgeOV?
Yes
No
Report Conditions
(i.e. Shear, 2-span
Shear, Moment) and
span lengths that fail.
No
**NOTE: For BridgeOV Category F, G, and H
F = Category A
G = Category B
H = Category C
F,G,H codes to be used when Virtis is to be ignored.
Process Bridge List
Yes
CAT = G or H? Is RorS = ‘S?’
Is any axle > 38,000
pounds?Yes
Yes
No
Yes
No
No
Is RorS = ‘R?’ Yes
No
Factor each axle load by
1/ ((gage + 8) / 16)
FAIL
No
No
Figure 80. BridgeOV/Virtis logic (Part 2)

February 25, 2013 [Review and Revision of Overload Permit Classification]
106
ORBP Reference No. OR10-010 Report No. RC-1589
10.2.1 Running the BridgeOV/Virtis
To start the BridgeOV/Virtis Interface, click on the ‘File-Open BridgeOV-Virtis Window’
menu option or the ‘File-New’ option (see Figure 81).
Figure 81. Starting BridgeOV/Virtis
The ‘New’ option will create a base template of one bridge and one default three-axle
vehicle that the user can then modify.
Upon selecting the ‘Open’ option, the user will be prompted with an open box to browse
to a Michigan DOT routing file (*.mdr). This file is in XML format and is described in
detail in Appendix G – BridgeOV-Virtis Application Programming Interface (API)
interface.
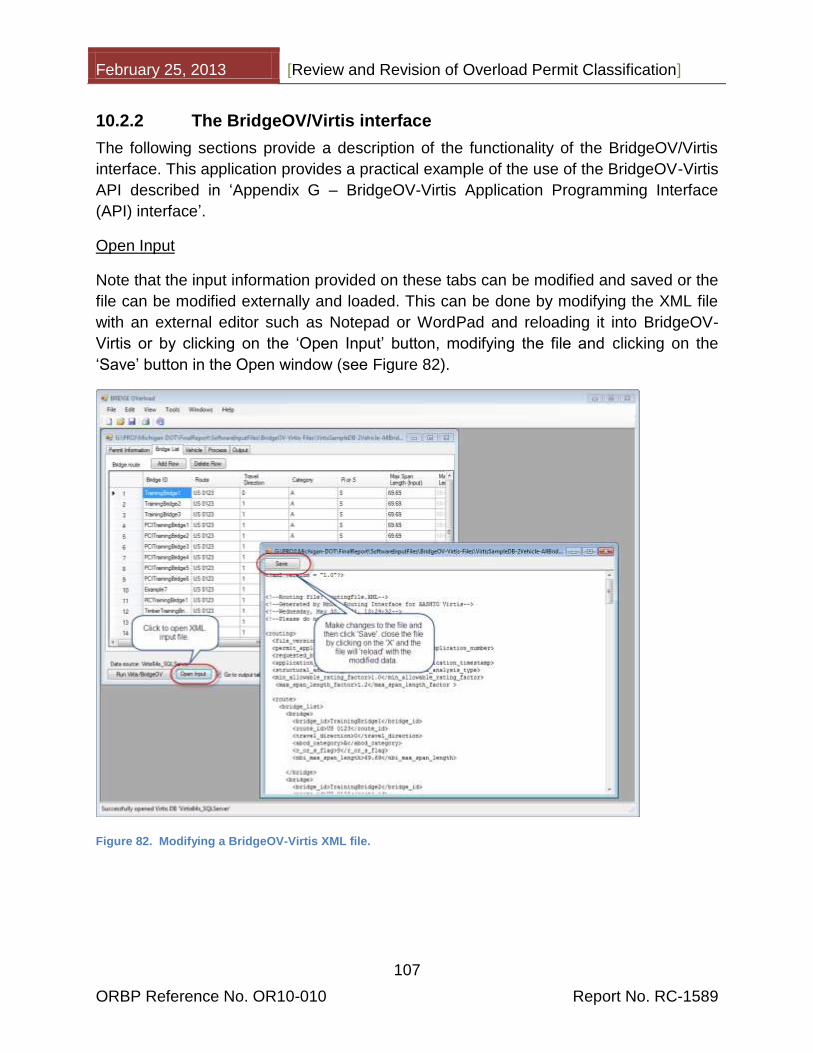
February 25, 2013 [Review and Revision of Overload Permit Classification]
107
ORBP Reference No. OR10-010 Report No. RC-1589
10.2.2 The BridgeOV/Virtis interface
The following sections provide a description of the functionality of the BridgeOV/Virtis
interface. This application provides a practical example of the use of the BridgeOV-Virtis
API described in ‘Appendix G – BridgeOV-Virtis Application Programming Interface
(API) interface’.
Open Input
Note that the input information provided on these tabs can be modified and saved or the
file can be modified externally and loaded. This can be done by modifying the XML file
with an external editor such as Notepad or WordPad and reloading it into BridgeOV-
Virtis or by clicking on the ‘Open Input’ button, modifying the file and clicking on the
‘Save’ button in the Open window (see Figure 82).
Figure 82. Modifying a BridgeOV-Virtis XML file.

February 25, 2013 [Review and Revision of Overload Permit Classification]
108
ORBP Reference No. OR10-010 Report No. RC-1589
File->Save – File->Save As.
Alternatively, the user may modify the file within the BridgeOV-Virtis environment and
either save the file using the pulldown menu ‘File-Save’ or ‘File-Save As’.
NOTE: If a BridgeOV-Virtis file is opened that was prepared externally and contains two
or more vehicle definitions, only the first vehicle will be used. A warning message will be
supplied but all vehicles beyond the first will be ignored. While the API supports multiple
vehicles, this implementation of the API does not.
Go to output tab after analysis
If this box is checked (see Figure 83), the program will pass control to the ‘Output’ tab
immediately after the ‘Run Virtis/BridgeOV’ process is completed. If this is box is not
checked, control is returned to the tab visible when the ‘Run Virtis/BridgeOV’ button was
selected. This option along with ‘Auto Save’ is useful when using BridgeOV-Virtis to
interactively view the BridgeOV plots without running Virtis (see Section 10.3.2).
Auto Save (no prompts)
If this box is checked (see Figure 83), BridgeOV-Virtis will automatically save the input
currently shown in the window. The user will not be prompted to save the file.
Figure 83. Checkboxes on the BridgeOV-Virtis window
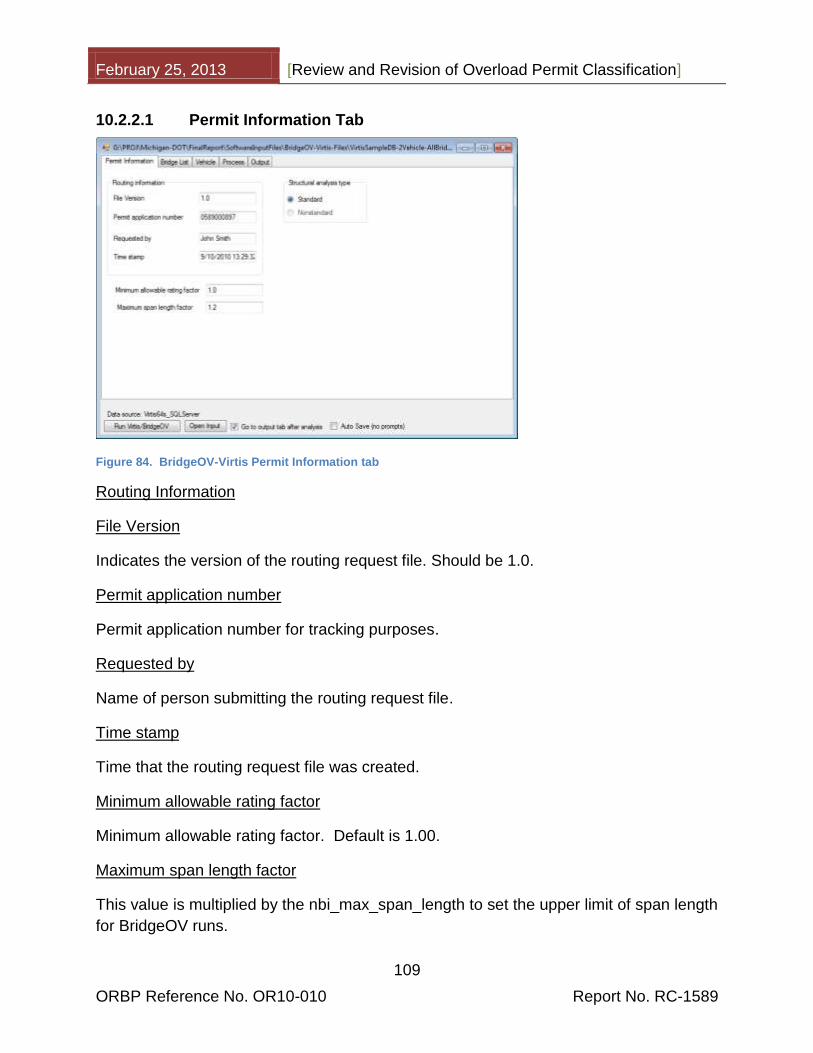
February 25, 2013 [Review and Revision of Overload Permit Classification]
109
ORBP Reference No. OR10-010 Report No. RC-1589
10.2.2.1 Permit Information Tab
Figure 84. BridgeOV-Virtis Permit Information tab
Routing Information
File Version
Indicates the version of the routing request file. Should be 1.0.
Permit application number
Permit application number for tracking purposes.
Requested by
Name of person submitting the routing request file.
Time stamp
Time that the routing request file was created.
Minimum allowable rating factor
Minimum allowable rating factor. Default is 1.00.
Maximum span length factor
This value is multiplied by the nbi_max_span_length to set the upper limit of span length
for BridgeOV runs.

February 25, 2013 [Review and Revision of Overload Permit Classification]
110
ORBP Reference No. OR10-010 Report No. RC-1589
10.2.2.2 Bridge List Tab
Figure 85. BridgeOV-Virtis Bridge List tab
This tab provides a list of the bridges read in from the XML input file.
The user can Add or Delete bridges by clicking on the ‘Add Rows’ or ‘Delete Rows’
button. When the ‘Delete Rows’ button is selected, the row with the focus (i.e. the one
with the little black arrowhead) will be deleted. Added rows are added to the bottom of
the list.
Bridge ID
Agency bridge ID. From the NBI record. Virtis uses this to key on finding the bridge in
the Virtis DB.
Route
Route ID as listed in the Virtis DB.
Direction
Travel Direction. Default value is 0.
-1/down/down milepost = Down Milepost

February 25, 2013 [Review and Revision of Overload Permit Classification]
111
ORBP Reference No. OR10-010 Report No. RC-1589
1/up/up milepost = Up Milepost
0 = Not Specified
Class
This item is specific to Michigan DOT. This is the MDOT specific NBI code Item 193
Overload class.
The item can have the following options:
A – Run Virtis. If bridge not present in Virtis run BridgeOV with Class A.
B – Run Virtis. If bridge not present in Virtis run BridgeOV with Class B.
C – Run Virtis. If bridge not present in Virtis run BridgeOV with Class C.
D – Bridge fails
F – Run BridgeOV always (i.e. don’t try to run Virtis). Use Class A
G – Run BridgeOV always (i.e. don’t try to run Virtis) Use Class B.
H – Run BridgeOV always (i.e. don’t try to run Virtis) Use Class C.
R or S
This can be any of the following:
R – If running BridgeOV use the standard 8’ axle width (i.e. no factoring the axle
loads).
Blank – Use the gage specified on the permit request with axle loads that were
reduced (increased) to account for gage width. In this case each axle load is
divided by
(gage width + 8’)/16.0
S – If the bridge is a Class B or C and any axle exceeds 38,000 pounds, fail the
bridge. Do not run Virtis or BridgeOV.
Max Span length (input)
This is the length of maximum span for the structure (NBI item 48).

February 25, 2013 [Review and Revision of Overload Permit Classification]
112
ORBP Reference No. OR10-010 Report No. RC-1589
Max Span Length (used)
This is the maximum span length * the maximum span length factor used by BridgeOV.
10.2.2.3 Vehicle Tab
Figure 86. BridgeOV-Virtis Vehicle tab
The user can Add or Delete axles by clicking on the ‘Add Rows’ or ‘Delete Rows’ button.
When the ‘Delete Rows’ button is selected, the row with the focus will be deleted.
Added rows are added to the bottom of the list.
Vehicle Name
Enter a string to describe the name of the vehicle. This will appear in the legend of the
BridgeOV plots.
Impact
User defined impact value for the vehicle.

February 25, 2013 [Review and Revision of Overload Permit Classification]
113
ORBP Reference No. OR10-010 Report No. RC-1589
Single lane indicator
Indicates if single lane distribution factors should be used in analysis. Should be either
"TRUE" or "FALSE".
Controlling rating level
Indicates rating factor to be checked to determine pass or fail status of rating. Should be
either "Inventory" or "Operating".
BridgeOV LRFR run
Checking this flag will turn on the LRFR flag and will run BridgeOV using the LRFR flag.
(see Section 10.3.2 for a definition of this flag for BridgeOV). This definition does not
affect the Virtis runs; the input for the specification type (LFR/LRFR) is entered and
stored in the Virtis database.
View vehicles
Click on this button to view the vehicle loaded in the vehicle list. A window, similar to the
one shown below, will open (see Figure 87 below).
Figure 87. Vehicle view
Import BridgeOV
Clicking this button will prompt the user for the location of an existing BridgeOV input file
(see Section 10.3.2). The file will be imported into the ‘Vehicle List’ datagrid and may be
modified after the import.

February 25, 2013 [Review and Revision of Overload Permit Classification]
114
ORBP Reference No. OR10-010 Report No. RC-1589
Export BridgeOV
Clicking this button will prompt the user for the location to export or store a BridgeOV
input file (see Section 10.3.2) using the data currently described by the input on this tab.
The file can then be opened in the BridgeOV Standalone tool (see Section 10.3).
Vehicle List
Lists axle configuration of the vehicle being analyzed. This application permits one
vehicle loaded at a time, but the API provides options for multiple vehicles to be loaded.
The datagrid displays the axle weight, wheel contact width, minimum axle spacing,
maximum axle spacing, and gage distance. If the axle spacing does not vary, the
maximum axle spacing should be input as -1. Varying axle spacing can be used in
Virtis, but will not be used for BridgeOV (BridgeOV does not handle variable axle
spacing).
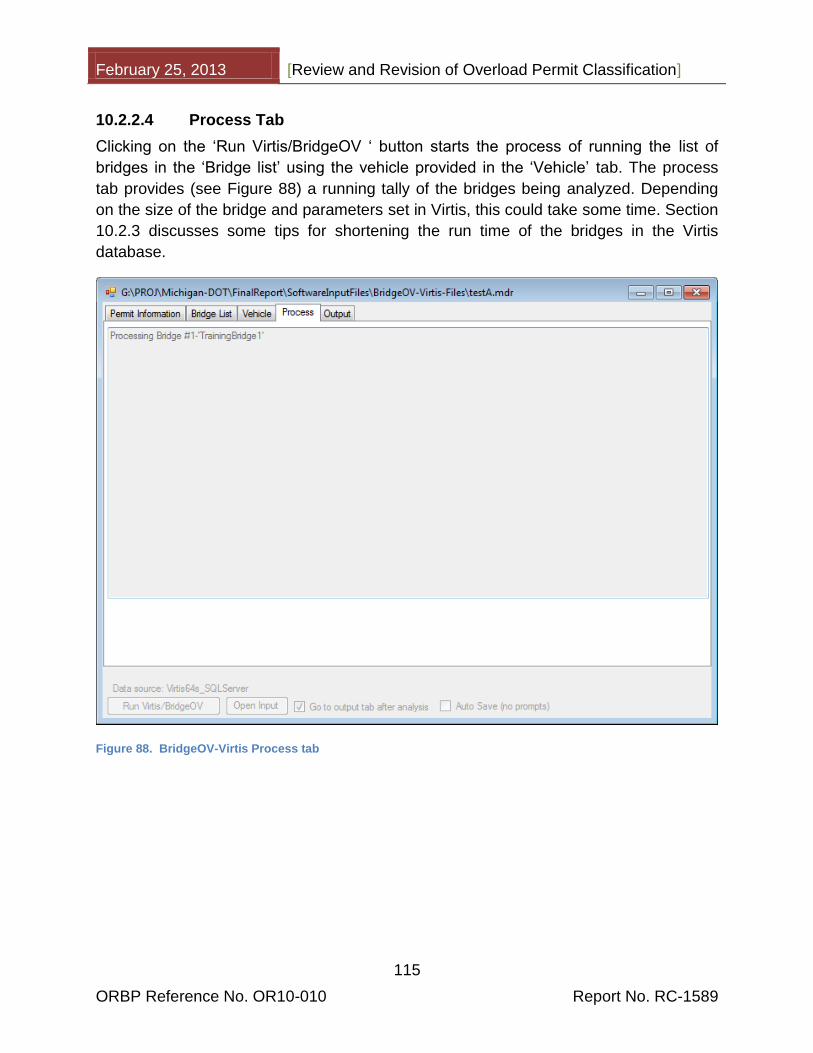
February 25, 2013 [Review and Revision of Overload Permit Classification]
115
ORBP Reference No. OR10-010 Report No. RC-1589
10.2.2.4 Process Tab
Clicking on the ‘Run Virtis/BridgeOV ‘ button starts the process of running the list of
bridges in the ‘Bridge list’ using the vehicle provided in the ‘Vehicle’ tab. The process
tab provides (see Figure 88) a running tally of the bridges being analyzed. Depending
on the size of the bridge and parameters set in Virtis, this could take some time. Section
10.2.3 discusses some tips for shortening the run time of the bridges in the Virtis
database.
Figure 88. BridgeOV-Virtis Process tab
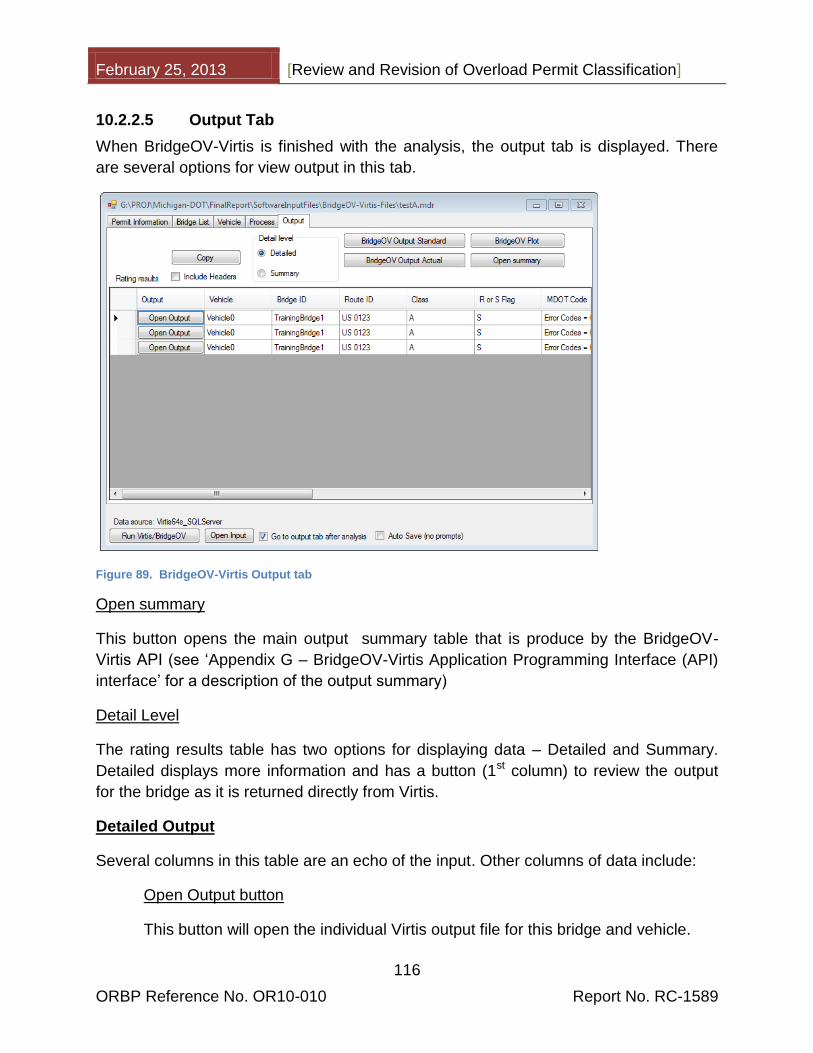
February 25, 2013 [Review and Revision of Overload Permit Classification]
116
ORBP Reference No. OR10-010 Report No. RC-1589
10.2.2.5 Output Tab
When BridgeOV-Virtis is finished with the analysis, the output tab is displayed. There
are several options for view output in this tab.
Figure 89. BridgeOV-Virtis Output tab
Open summary
This button opens the main output summary table that is produce by the BridgeOV-
Virtis API (see ‘Appendix G – BridgeOV-Virtis Application Programming Interface (API)
interface’ for a description of the output summary)
Detail Level
The rating results table has two options for displaying data – Detailed and Summary.
Detailed displays more information and has a button (1st column) to review the output
for the bridge as it is returned directly from Virtis.
Detailed Output
Several columns in this table are an echo of the input. Other columns of data include:
Open Output button
This button will open the individual Virtis output file for this bridge and vehicle.

February 25, 2013 [Review and Revision of Overload Permit Classification]
117
ORBP Reference No. OR10-010 Report No. RC-1589
MDOT code
A list of all failures/successes for this bridge/vehicle combination
MDOT Message
A more verbose description of the MDOT code.
Run time
The actual time that it took to analyze this bridge. Useful for modifying the Virtis
database to increase speed.
Inventory/Operating RF
These values (if present) are returned from Virtis.
Failed BOV span lengths
A list of all of the span lengths the failed in BridgeOV for this bridge/vehicle
combination
Summary Output
This option provides a more concise description of the Detailed Output. The primary
difference is the inclusion of a Pass/Fail column and a lesser number of columns than
the ‘Detailed Output’ option.
Copy button
The ‘Copy’ button will copy the contents of the ‘Rating Results’ grid to the clipboard. It
can then be pasted directly into an Excel spreadsheet where it can be modified and
formatted. If the ‘Include Headers’ checkbox is selected, the clipboard will include the
headings from the table.
BridgeOV Output Standard
Clicking this button opens the BridgeOV output file in Notepad for the standard gage (8-
ft). If more than one vehicle is present, this will open each vehicle file.
BridgeOV Output Actual
Clicking this button opens the BridgeOV output file in Notepad for the actual gage (8-ft).
If more than one vehicle is present, this will open each vehicle file.

February 25, 2013 [Review and Revision of Overload Permit Classification]
118
ORBP Reference No. OR10-010 Report No. RC-1589
BridgeOV Plot
Clicking this button opens the BridgeOV-standalone interface and loads both the with
the actual and standard vehicle options. The BridgeOV-Virtis and BridgeOV-Standalone
windows are arranged automatically as shown in Figure 90. The options for the
BridgeOV-Standalone interface are described in Section 10.3.1.2.
Figure 90. BridgeOV plot with standard gage (STD) and actual gage (ACT)
10.2.3 Setting up the Virtis database
Bridges set up in Virtis may require quite a bit of analysis especially if they are larger
structures (i.e. multiple spans) with several girders. Since Virtis analyzes each girder
independently, the more girders in the system, the longer the analysis run. This section
attempts to provide some tips for reducing the run time of Virtis through and example.
MDOT provided a list of 32 bridges that were primarily multiple span structures with
several girders. The following sections provide a step by step process to reduce the run
time.

February 25, 2013 [Review and Revision of Overload Permit Classification]
119
ORBP Reference No. OR10-010 Report No. RC-1589
10.2.3.1 Identify the run time
Initially all 32 structures were run through BridgeOV-Virtis with the a 3 axle vehicle (8
kip, 32 kip, 32 kip with 14-ft spacing) and they produced the run time shown in Figure
91. As can be seen, the total run time was almost 2 hours.
Processing Bridge #1-'63163192000S010' (Time: 0 hours, 2 min, 49 sec)
Processing Bridge #2-'82182023000S270' (Time: 0 hours, 1 min, 40 sec)
Processing Bridge #3-'82182192000S040' (Time: 0 hours, 0 min, 37 sec)
Processing Bridge #4-'41141064000R020' (Time: 0 hours, 0 min, 10 sec)
Processing Bridge #5-'63163111000R020' (Time: 0 hours, 0 min, 34 sec)
Processing Bridge #6-'19119033000S090' (Time: 0 hours, 0 min, 20 sec)
Processing Bridge #7-'11111016000B013' (Time: 0 hours, 19 min, 20 sec)
Processing Bridge #8-'23123063000S130' (Time: 0 hours, 0 min, 47 sec)
Processing Bridge #9-'82182022000S430' (Time: 0 hours, 3 min, 3 sec)
Processing Bridge #10-'49149025000S050' (Time: 0 hours, 0 min, 24 sec)
Processing Bridge #11-'38138101000S100' (Time: 0 hours, 0 min, 1 sec)
Processing Bridge #12-'50150062000S110' (Time: 0 hours, 4 min, 25 sec)
Processing Bridge #13-'63163191000S010' (Time: 0 hours, 0 min, 36 sec)
Processing Bridge #14-'82182081000S061' (Time: 0 hours, 1 min, 7 sec)
Processing Bridge #15-'50150061000S030' (Time: 0 hours, 1 min, 45 sec)
Processing Bridge #16-'50150061000S140' (Time: 0 hours, 27 min, 51 sec)
Processing Bridge #17-'82182291000B020' (Time: 0 hours, 0 min, 4 sec)
Processing Bridge #18-'63163191000S100' (Time: 0 hours, 2 min, 6 sec)
Processing Bridge #19-'19119043000S020' (Time: 0 hours, 4 min, 56 sec)
Processing Bridge #20-'25125031000S110' (Time: 0 hours, 5 min, 44 sec)
Processing Bridge #21-'58158151000S100' (Time: 0 hours, 7 min, 8 sec)
Processing Bridge #22-'25125132000S230' (Time: 0 hours, 10 min, 4 sec)
Processing Bridge #23-'50150111000S274' (Time: 0 hours, 3 min, 51 sec)
Processing Bridge #24-'82182022000S480' (Time: 0 hours, 2 min, 22 sec)
Processing Bridge #25-'82182022000S420' (Time: 0 hours, 0 min, 36 sec)
Processing Bridge #26-'13113033000B010' (Time: 0 hours, 3 min, 32 sec)
Processing Bridge #27-'82182191000S240' (Time: 0 hours, 7 min, 1 sec)
Processing Bridge #28-'41141027000B020' (Time: 0 hours, 3 min, 22 sec)
Processing Bridge #29-'41141027000B020' (Time: 0 hours, 3 min, 23 sec)
Processing Bridge #30-'a41141064000R020' (Time: 0 hours, 0 min, 0 sec)
Processing Bridge #31-'b41141064000R020' (Time: 0 hours, 0 min, 0 sec)
Processing Bridge #32-'c41141064000R020' (Time: 0 hours, 0 min, 0 sec)
(Total Time: 1 hours, 59 min, 53 sec)
Figure 91. Initial run times for 32 multi-span bridges
Looking at the list, several run times are highlighted as being exceptionally long, but
several of the bridges run for several minutes or more. All of the bridges in this set were
reviewed for reducing the overall run time of the set.
10.2.3.2 Choosing the key members
To determine which members to ‘turn-off’ when running Virtis, all members must first be
analyzed and the rating results reviewed. The example shown here is Bridge #19
(19119043000S020) which required 4 min and 56 sec of analysis time originally to run a
3 axle vehicle with no variable axle spacing. To reduce the run time, Virtis was run for
this bridge using the 20 overload Class A vehicles (see Figure 92) and reviewing the
rating results by sorting them from highest to lowest (see Figure 93).

February 25, 2013 [Review and Revision of Overload Permit Classification]
120
ORBP Reference No. OR10-010 Report No. RC-1589
Figure 92. Entering the 20 Class A Michigan overload vehicles in Virtis

February 25, 2013 [Review and Revision of Overload Permit Classification]
121
ORBP Reference No. OR10-010 Report No. RC-1589
Figure 93. Reviewing the rating results in Virtis
Based on the rating results, it is evident that girder G6 governs for this bridge. This
means that G1, G2, G3, G4, and G5 can be turned off by unchecking the ‘Existing’
checkbox on each girder (see Figure 94)
Figure 94. Turning of the ‘Existing’ flag in Virtis

February 25, 2013 [Review and Revision of Overload Permit Classification]
122
ORBP Reference No. OR10-010 Report No. RC-1589
The final run time for the same 3 axle vehicle while running Virtis through BridgeOv-
Virtis is 0 min and 55 sec. Performing this task for all bridges in the set yielded a total
time of 32 min and 9 sec (see Figure 95).
Processing Bridge #1-'63163192000S010' (Time: 0 hours, 1 min, 49 sec)
Processing Bridge #2-'82182023000S270' (Time: 0 hours, 0 min, 52 sec)
Processing Bridge #3-'82182192000S040' (Time: 0 hours, 0 min, 38 sec)
Processing Bridge #4-'41141064000R020' (Time: 0 hours, 0 min, 11 sec)
Processing Bridge #5-'63163111000R020' (Time: 0 hours, 0 min, 36 sec)
Processing Bridge #6-'19119033000S090' (Time: 0 hours, 0 min, 23 sec)
Processing Bridge #7-'11111016000B013' (Time: 0 hours, 3 min, 25 sec)
Processing Bridge #8-'23123063000S130' (Time: 0 hours, 0 min, 26 sec)
Processing Bridge #9-'82182022000S430' (Time: 0 hours, 0 min, 16 sec)
Processing Bridge #10-'49149025000S050' (Time: 0 hours, 0 min, 26 sec)
Processing Bridge #11-'38138101000S100' (Time: 0 hours, 0 min, 2 sec)
Processing Bridge #12-'50150062000S110' (Time: 0 hours, 0 min, 49 sec)
Processing Bridge #13-'63163191000S010' (Time: 0 hours, 0 min, 38 sec)
Processing Bridge #14-'82182081000S061' (Time: 0 hours, 0 min, 23 sec)
Processing Bridge #15-'50150061000S030' (Time: 0 hours, 0 min, 55 sec)
Processing Bridge #16-'50150061000S140' (Time: 0 hours, 2 min, 54 sec)
Processing Bridge #17-'82182291000B020' (Time: 0 hours, 0 min, 5 sec)
Processing Bridge #18-'63163191000S100' (Time: 0 hours, 1 min, 2 sec)
Processing Bridge #19-'19119043000S020' (Time: 0 hours, 0 min, 55 sec)
Processing Bridge #20-'25125031000S110' (Time: 0 hours, 0 min, 20 sec)
Processing Bridge #21-'58158151000S100' (Time: 0 hours, 3 min, 39 sec)
Processing Bridge #22-'25125132000S230' (Time: 0 hours, 3 min, 39 sec)
Processing Bridge #23-'50150111000S274' (Time: 0 hours, 0 min, 42 sec)
Processing Bridge #24-'82182022000S480' (Time: 0 hours, 0 min, 12 sec)
Processing Bridge #25-'82182022000S420' (Time: 0 hours, 0 min, 39 sec)
Processing Bridge #26-'13113033000B010' (Time: 0 hours, 0 min, 5 sec)
Processing Bridge #27-'82182191000S240' (Time: 0 hours, 1 min, 23 sec)
Processing Bridge #28-'41141027000B020' (Time: 0 hours, 1 min, 52 sec)
Processing Bridge #29-'41141027000B020' (Time: 0 hours, 2 min, 37 sec)
Processing Bridge #30-'a41141064000R020' (Time: 0 hours, 0 min, 0 sec)
Processing Bridge #31-'b41141064000R020' (Time: 0 hours, 0 min, 0 sec)
Processing Bridge #32-'c41141064000R020' (Time: 0 hours, 0 min, 0 sec)
(Total Time: 0 hours, 32 min, 9 sec)
Figure 95. Results after revision of ‘Existing’ flag in Virtis

February 25, 2013 [Review and Revision of Overload Permit Classification]
123
ORBP Reference No. OR10-010 Report No. RC-1589
10.3 BridgeOV-Standalone
This section describes the option to run BridgeOV-Standalone by using a BridgeOV
input file directly. Also described is the method to run BridgeOV-Standalone in tandem
with the BridgeOV-Virtis interface.
10.3.1 Running the BridgeOV-Standalone Program
This section provides a tutorial for running the BridgeOV-Standalone program.
10.3.1.1 Getting Started
To open a BridgeOV-Standalone window, click on the ‘Tools’ menu and select
‘BridgeOV-Standalone’ (see Figure 96).
Figure 96. Opening a BridgeOV-Standalone window
Browse to a directory with BridgeOV input files and select one or more files (see Figure
97). These files have a .TXT extension and have a format as described in Section
10.3.2.

February 25, 2013 [Review and Revision of Overload Permit Classification]
124
ORBP Reference No. OR10-010 Report No. RC-1589
Figure 97. Opening multiple BridgeOV standalone files
This will open the main BridgeOV-Standalone interface and plot all of the input files in
BridgeOV on the same graph.

February 25, 2013 [Review and Revision of Overload Permit Classification]
125
ORBP Reference No. OR10-010 Report No. RC-1589
10.3.1.2 Interface Options
This section provides a description of the various options available in the BridgeOV-
Standalone interface. Figure 98 provides the layout for the interface.
Figure 98. BridgeOV standalone interface
Open
Opens one or more BridgeOV vehicles files.
Run
Runs the file shown in the ‘File List’ in BridgeOV and plots together
Plot envelope of files
If multiple vehicles are loaded into BridgeOV, the envelope (or single series) will plot
when this box is checked. If this is not checked, the individual vehicles will be plotted as
separate series on the same graph.
Show label
Checking this box will label each point with the vehicle description. This box is only
applicable when plotting an envelope of the files.

February 25, 2013 [Review and Revision of Overload Permit Classification]
126
ORBP Reference No. OR10-010 Report No. RC-1589
Truncate label
This field provides an option to control the length of the label when labeling the graph.
Invalid entries will default the number to the length of the vehicle string. The number will
default to '4' if a lesser number is entered.
Auto plot
Checking this box will cause the graph to update as input is changed on this screen. If
the box is unchecked, the user must click the ‘Run’ button to replot the graph. If large
numbers of vehicles are input, it is typically best to uncheck this box as the response
time will be slower.
Vehicles Selection pulldown
Selects an individual file from the pulldown box, runs BridgeOV and plots. This pulldown
lists the BridgeOV output for each vehicle loaded. The output file for each vehicle can
be reviewed individually in the BridgeOV output window (see Figure 98) by selecting a
file in this pulldown.
Don’t Load data grid or combo box
Checking this box, prevents the data grid or the combo box from being loaded. If a
larger number of vehicles is loaded into BridgeOV (e.g. more than 30) and a small span
increment is used, the loading of these portions of the window can take a very long
time. Sometimes it is better to turn these off until the data is set as desired.
Open output
Opens the output currently loaded in the ‘BridgeOV output’ box into a separate window.
Start Span Length
Span length to start BridgeOV.
End Span Length
Final span length to analyze/plot
Span Increment
Increment of span length to analyze/plot.
Action - Moment/Shear
Modify this box to plot either moment, shear, or 2-span shear.
February 25, 2013 [Review and Revision of Overload Permit Classification]
127
ORBP Reference No. OR10-010 Report No. RC-1589
Plot in percent
Check this box to plot the vehicles as a percent of the HS-20 (14’ rear spacing) vehicle.
Legend Font
Changes the font size of the legend
Display vehicle length/wgt in legend
If checked, displays the vehicle length/weight as part of the legend title. If not checked,
legend displays only the vehicle name.
Build Word Document
This feature requires that a blank MS-Word document ‘BridgeOVTemplate.docx’ is
present on your c: drive in the Virtis installation directory (the typically is named
C:\Program Files (x86)\AASHTOWARE\VirtisOpis64). If the file is present, clicking this
button will plot all vehicles currently loaded and insert a copy of each graph into the
Word document. It is recommended that once generated, the BridgeOVTemplate.docx
file be saved as another filename so that the BridgeOVTemplate.docx file remains
blank.
Open output
Displays the BridgeOV output in a text window. The output displayed, corresponds to
the vehicle selected in the vehicle pulldown selection.
Show ABC status datagrid
Checking this box will display the class A,B,C status in a datagrid (see Figure 98).
Unchecking the box will hide this datagrid.
Show vehicle datagrid
Checking this box will display the vehicle datagrid results (see Figure 98). Unchecking
the box will hide this datagrid.

February 25, 2013 [Review and Revision of Overload Permit Classification]
128
ORBP Reference No. OR10-010 Report No. RC-1589
Vehicle Datagrid Results
The vehicle datagrid results only appear if the ‘Show vehicle datagrid’ checkbox is
checked. The datagrid displays a copy of the analysis results by span length for each
vehicle plotted. This data can be copied to the clipboard using the ‘Copy Grid’ command
and pasted directly in an Excel spreadsheet.
Copy Graph
Copies the current graph to the clipboard
Copy Grid
Copies the current data grid to the clipboard. Once copied to the clipboard, the contents
can easily be pasted into an Excel spreadsheet by using the past command while in
Excel. Once pasted, the user can use formatting in Excel to manipulate the data.
Include header in copy
If checked, will include the data grid header when copying the data grid to the clipboard.
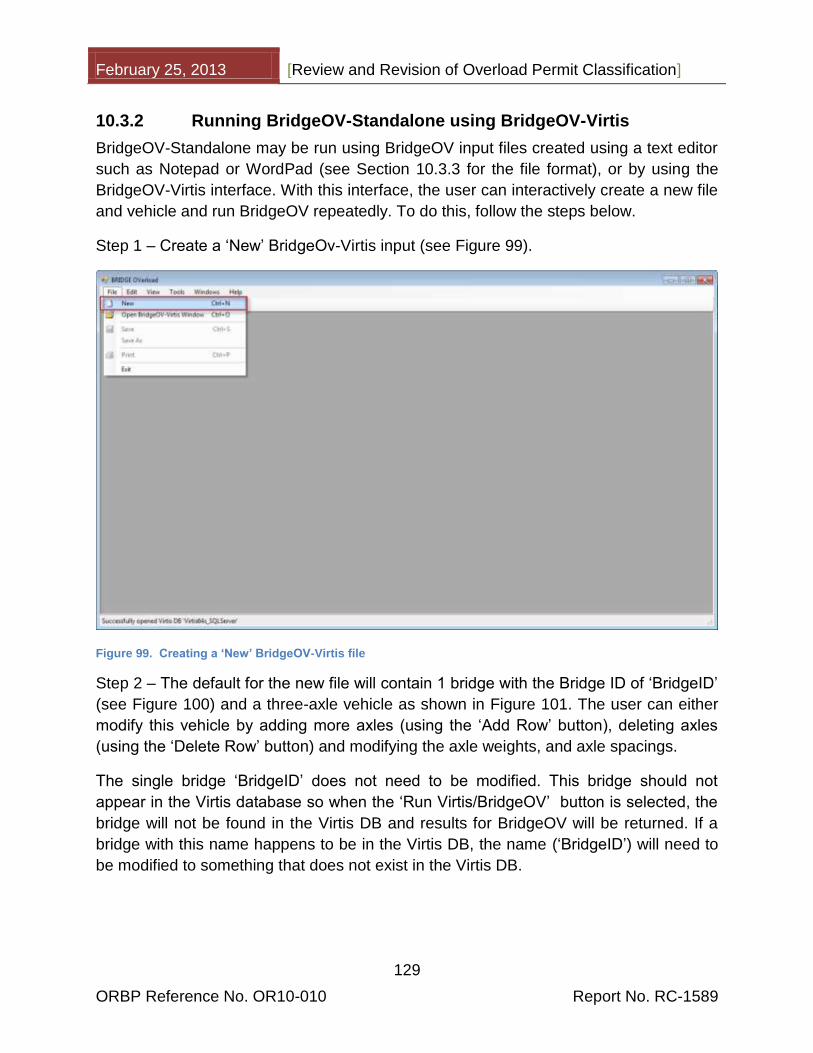
February 25, 2013 [Review and Revision of Overload Permit Classification]
129
ORBP Reference No. OR10-010 Report No. RC-1589
10.3.2 Running BridgeOV-Standalone using BridgeOV-Virtis
BridgeOV-Standalone may be run using BridgeOV input files created using a text editor
such as Notepad or WordPad (see Section 10.3.3 for the file format), or by using the
BridgeOV-Virtis interface. With this interface, the user can interactively create a new file
and vehicle and run BridgeOV repeatedly. To do this, follow the steps below.
Step 1 – Create a ‘New’ BridgeOv-Virtis input (see Figure 99).
Figure 99. Creating a ‘New’ BridgeOV-Virtis file
Step 2 – The default for the new file will contain 1 bridge with the Bridge ID of ‘BridgeID’
(see Figure 100) and a three-axle vehicle as shown in Figure 101. The user can either
modify this vehicle by adding more axles (using the ‘Add Row’ button), deleting axles
(using the ‘Delete Row’ button) and modifying the axle weights, and axle spacings.
The single bridge ‘BridgeID’ does not need to be modified. This bridge should not
appear in the Virtis database so when the ‘Run Virtis/BridgeOV’ button is selected, the
bridge will not be found in the Virtis DB and results for BridgeOV will be returned. If a
bridge with this name happens to be in the Virtis DB, the name (‘BridgeID’) will need to
be modified to something that does not exist in the Virtis DB.
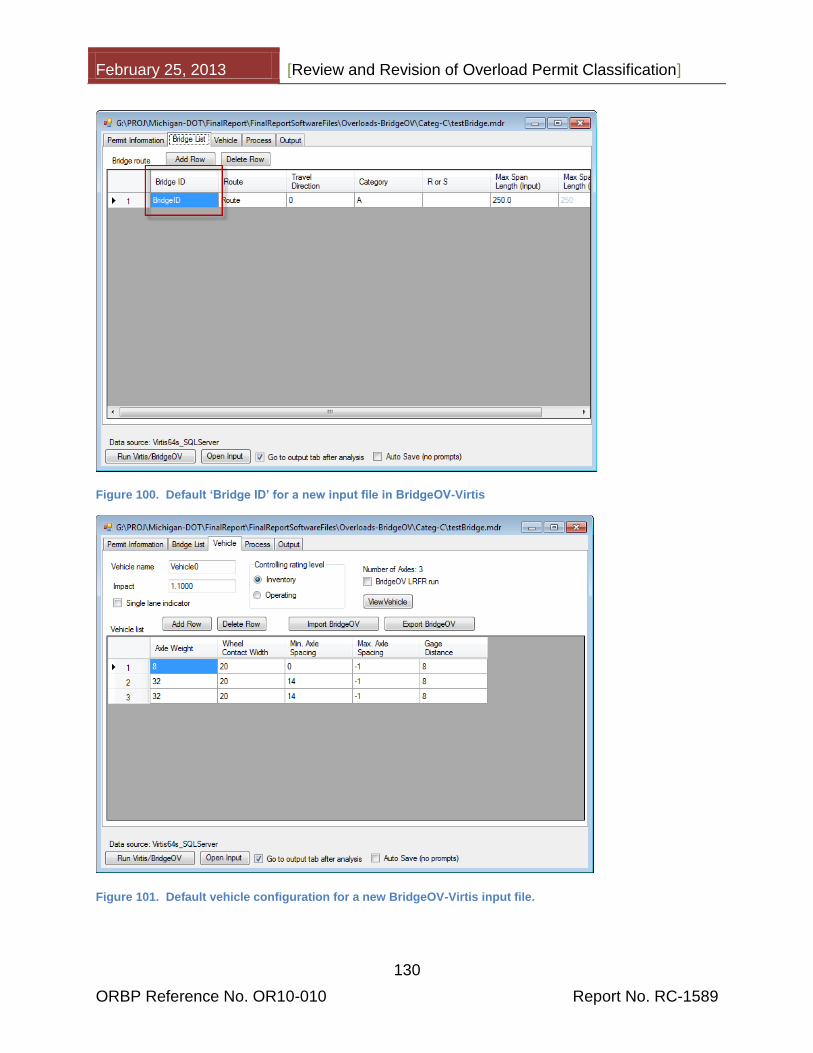
February 25, 2013 [Review and Revision of Overload Permit Classification]
130
ORBP Reference No. OR10-010 Report No. RC-1589
Figure 100. Default ‘Bridge ID’ for a new input file in BridgeOV-Virtis
Figure 101. Default vehicle configuration for a new BridgeOV-Virtis input file.

February 25, 2013 [Review and Revision of Overload Permit Classification]
131
ORBP Reference No. OR10-010 Report No. RC-1589
Step 3 – Click on the ‘Run Virtis/BridgeOV’ button. The program should run very quickly
and automatically move to the ‘Output’ tab when completed. Now click on the ‘BridgeOv
Plot’ button to open BridgeOV-Standalone (see Figure 102). This will display both
windows within the interface; BridgeOV-Virtis on the left and BridgeOV-Standalone on
the right (see Figure 103).
Figure 102. Steps to plot BridgeOV-Standalone from BridgeOV-Virtis
Figure 103. BridgeOV-Virtis and BridgeOV-Standalone

February 25, 2013 [Review and Revision of Overload Permit Classification]
132
ORBP Reference No. OR10-010 Report No. RC-1589
Step 4 – Now go to the ‘Vehicle’ tab of the BridgeOV-Virtis window and uncheck the ‘Go
to output tab after analysis’. Also check the ‘Auto Save (no prompts)’ checkbox (see
Figure 104). Modify the vehicle by adding axles or changing the weights/spacings, etc.
Now click the ‘Run Virtis/BridgeOV’ button. The graph and output in the BridgeOV-
Standalone window will automatically update.
Once the vehicle is defined, it can be saved by either using the ‘Export BridgeOV’
button, or saving the BridgeOV-Virtis input file.
Figure 104. Setting parameters for BridgeOV-Virtis to run in tandem with BridgeOV-Standalone

February 25, 2013 [Review and Revision of Overload Permit Classification]
133
ORBP Reference No. OR10-010 Report No. RC-1589
10.3.3 BridgeOV input file
The BridgeOV input file is relatively simple and has a format as shown in Figure 105.
Figure 105. BridgeOV input format
Comment lines
All lines at the beginning of the file with the ‘#’ symbol in the first column are ignored by
the software. These can be used for placing comments.
First line
This line can contain 3 parameters (the third parameter is optional) and all parameters
must be separated by a space.
Parameter Description
1 Contains the description of the vehicle. This must contain no spaces.
2 Number of axles (required)
3 This parameter is optional. If not entered, a live load factor of 1.0 will be used along with an LFR impact factor.
If entered, It can contain the following input:
LRFRFactor=CALC or LRFRFactor=x.x
The parameter should have no spaces. If ‘CALC’ is used, the program will calculate the LRFR live load factor based on the Curtis/ Till Equation 18 (see Section 5.1.8 of this document).
If a value is input, the live load factor will be set to the value entered.

February 25, 2013 [Review and Revision of Overload Permit Classification]
134
ORBP Reference No. OR10-010 Report No. RC-1589
Second line
Enter axle spacings in feet for the vehicle separated by spaces. The number of values
input must be the Number of Axles – 1.
Third line
Enter axle loads in kips for each axle separated by spaces. The number of values input
must be the equal to the Number of Axles input on the first line.
Fourth line
Enter axle gage distances in feet for each axle separated by spaces. The number of
values input must be the equal to the Number of Axles input on the first line. Each axle
will be factored by 1 / (Gage + 8) /16). If the value is equal to 8.0, the factor is 1.0. If the
value input is less than 8, it will be set equal to 8.0. If the value is greater than 8.0, it has
the effect of reducing the axle weight.

February 25, 2013 [Review and Revision of Overload Permit Classification]
135
ORBP Reference No. OR10-010 Report No. RC-1589
10.3.4 BridgeOV output file
The BridgeOV output is fairly self-explanatory. In addition to an echo of the input, tables
are provided for simple span moment comparison, simple span shear comparison, and
2 equal span shear comparison. Figure 106 provides a diagram of the moment table
comparisons for BridgeOV. The Shear tables are similar in layout. A separate BridgeOV
output is generated for each vehicle and they can be viewed individually using the
‘Vehicles Selection pulldown’ and ‘Open output’ button as described in Section 10.3.1.2.
Figure 106. BridgeOV moment output description

February 25, 2013 [Review and Revision of Overload Permit Classification]
136
ORBP Reference No. OR10-010 Report No. RC-1589
10.4 Permit Vehicle Analyzer
The permit vehicle analyzer (PVA) is a tool available from the ‘Tools’ menu of BridgeOV
Overload (see Figure 107).
Figure 107. Opening the permit analyzer
The program reads in a large list of permit vehicles and provides the following features:
Sorting out exact duplicate vehicles (same axle loads and spacings).
Sorting vehicles by the highest 2,3,4 and 5 axle combinations.
Searching for anomalies in the data (small axle spacings, loads, etc.)
Generating Virtis and BridgeOV input files
The tool was used to research the heaviest of permit vehicles from a 1 year sample of
MDOT vehicles and is provide here as a tool so that it may continue to be used in the
future. A sample permit vehicle CSV file is also provided with the delivery.
The program also has the capability to read in Weigh-in-Motion data (WIM) in a format
as described in Appendix H – Weigh-in-Motion – (WIM) file format. To read this type of
data into PVA, select WIM from the file type pulldown when starting up PVA (see Figure
108).

February 25, 2013 [Review and Revision of Overload Permit Classification]
137
ORBP Reference No. OR10-010 Report No. RC-1589
Figure 108. Opening WIM data in PVA
10.4.1 Preparing an MDOT Excel file
Before the spreadsheet provided by the permits department can be used by the
analyzer, the following steps must be followed to convert the spreadsheet to a CSV file
that can be used by the program.
Make all of the rows the same height (this shows the blank lines between each
record). Highlight all of the cells and set the row height
Unmerge all cells. Keep all cells selected and change the format as shown in
Figure 109 below.
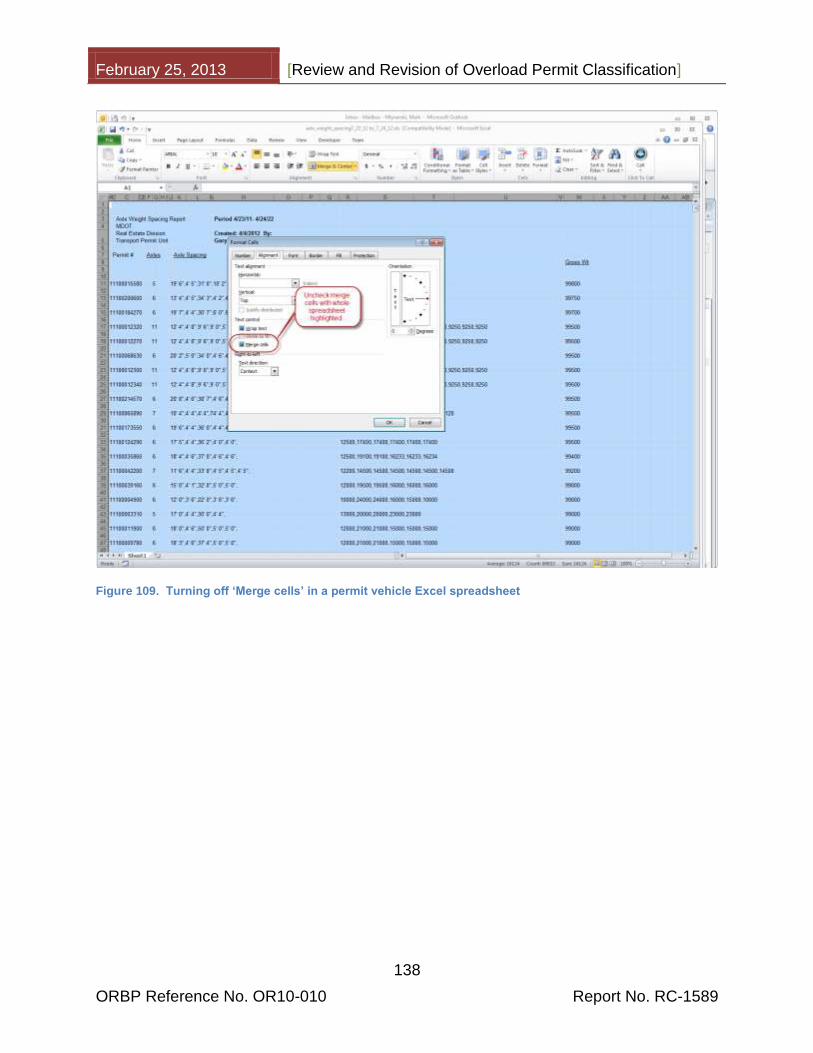
February 25, 2013 [Review and Revision of Overload Permit Classification]
138
ORBP Reference No. OR10-010 Report No. RC-1589
Figure 109. Turning off ‘Merge cells’ in a permit vehicle Excel spreadsheet

February 25, 2013 [Review and Revision of Overload Permit Classification]
139
ORBP Reference No. OR10-010 Report No. RC-1589
Sort by permit number (Column A) (see Figure 110 below)
Figure 110. Sorting the permit vehicle Excel spreadsheet
Delete all rows that did not contain data (These should be at the bottom rows of
the spreadsheet).
Save as a CSV (at this point do NOT open the CSV and save as a CSV again, or
the axle weights will get reformatted)
Open the CSV file in a text editor and get rid of any blank lines at the bottom (or
lines of just commas)
Run Permit Analyzer and open the CSV you just created
10.4.2 Running the Permit Vehicle Analyzer
Once you have generated the CSV file as described in the previous section. Browse to
that file and open it. The ‘Permit Vehicle Analyzer’ Window will appear as shown in
Figure 111.

February 25, 2013 [Review and Revision of Overload Permit Classification]
140
ORBP Reference No. OR10-010 Report No. RC-1589
Figure 111. Permit Vehicle Analyzer screen
Some highlights of the analyzer are:
Find anomalies
This section allows the user to search the list of vehicles for small (or large) axle
spacings and loadings. Clicking the ‘Generate Extremes’ button will search the vehicles
loaded for the extremes specified. The list of vehicles found will appear in the datagrid
area and can be copied elsewhere (e.g. to a spreadsheet).
Duplicate vehicles
This section allows the user to search for exact duplicate vehicles. The results are
plotted in the graphing area (see Figure 112).

February 25, 2013 [Review and Revision of Overload Permit Classification]
141
ORBP Reference No. OR10-010 Report No. RC-1589
Figure 112. Graphing duplicate vehicles
Load Concentration
This section allows the user to sort vehicles by load concentration. This tool was used to
generate the axle concentration lists as describe in Section 5.1.4. The list of the largest
axle concentrations are placed in the datagrid area for copying into the clipboard.
Datagrid Area
For the above operations, the vehicles are copied to the ‘DataGrid Area’. Once vehicles
are placed here, they can also be exported as BridgeOV files and run in the standalone
version of BridgeOV. The options for the data grid are as follows:
Copy datagrid
Copies the highlighted datagrid to the clipboard. Only the highlighted rows will be
copied to the clipboard. If the ‘Include Header’ option is checked, the headings will
February 25, 2013 [Review and Revision of Overload Permit Classification]
142
ORBP Reference No. OR10-010 Report No. RC-1589
be copied to the clipboards as well. Once copied, the vehicles can be pasted
directly into a spreadsheet.
Generate Virtis XML
Will generate Virtis XML files for each row of the datagrid that is selected. The Virtis
XML vehicle files can then be imported into the Virtis Vehicle library.
Generate BridgeOV input files
Will generate BridgeOV input files for each row of the datagrid that is selected. The
BridgeOV input files can then be opened in the BridgeOV-Standalone tool. If the
‘LRFR BOV file’ box is checked, LRFR BridgeOV input files are generated. The
textbox next to the ‘Generate BridgeOV Input Files’ button contains the prefix for
each vehicle name generated.
If the ‘Duplicate Vehicle #’ box is checked, the number of duplicates for the vehicle
will be included in the vehicle name.
Show Vehicle
Clicking on the button will graphically display the vehicle in a separate window for
the current datagrid row. If the graphic vehicle window is already open, the window
will update as the datagrid row is changed.

February 25, 2013 [Review and Revision of Overload Permit Classification]
143
ORBP Reference No. OR10-010 Report No. RC-1589
11 List of Acronyms/Glossary
AASHTO - American Association of State Highway and Transportation Officials.
BridgeOV – Bridge overload software originally written by Michigan Tech and MDOT
and updated for this research project. Analyzes vehicles for span lengths up to 250’ for
simple span moment, simple span shear, and 2 equal span shear.
Final Phase – the final phase of this research project where the recommendations for
the interim phase were implemented.
Interim Phase – the first phase of this research project when the Michigan processes for
overload vehicles were reviewed.
PVA–Permit vehicle analyzer – Software written for this research that reads in large files
of permit vehicles (either CSV format or WIM format) and sorts them by weight, length,
or axle concentration. Also determines the number of duplicate vehicles in the file.
Virtis – (Also known as BrR) – Bridge rating software produced by the American
Association of State Highway and Transportation Officials (AASHTO). Michigan is
current licensee and participant in the development of this software. During the
development of this research project, the name of the AASHTOWareTM Virtis® software
was changed by AASHTO to AASHTOWareTM Bridge Rating (BrR). The research report
has retained the original name ‘Virtis’ throughout this report
WIM data – Weigh-in-Motion data- captured by WIM devices that are designed to
capture and record axle weights and gross vehicle weights as vehicles drive over a
measurement site.
February 25, 2013 [Review and Revision of Overload Permit Classification]
144
ORBP Reference No. OR10-010 Report No. RC-1589
12 References
Curtis, Rebecca and Till, Roger, (2008), Recommendations for Michigan Specific Load
and Resistance Factor Design Loads and Load and Resistance Factor Rating
Procedures, Research Report R-1511, Michigan Department of Transportation,
Lansing, Michigan.
Michigan Department of Transportation (2005), Bridge Analysis Guide, Lansing,
Michigan.

Appendix A – Excerpt from “SUPERLOAD Permitting and Routing Implementation”
A-1
ORBP Reference No. OR10-010 Report No. RC-1589
Appendix A – Excerpt from “SUPERLOAD Permitting and Routing Implementation”
The following is an expert from the manual prepared by Bentley entitled “SUPERLOAD
Permitting and Routing Implementation”.
4.2 MI-specific ABCD Bridge Analysis
For each bridge in the route network, the ABCD bridge classification code and the "R" (standard / non-standard gage / slab controls) code will be stored from the Pontis bridge inventory data (the ABCD_LOAD_CAPACITY and R_RATING fields respectively).
Generally, when a trip is to be analyzed for a permit vehicle, the configuration of the permit vehicle will be run through the "Bridge overload (Bridgeov) Version 1.0" program logic that was jointly developed by the Transportation Technology Transfer Center located at the Michigan Technological University and the Michigan Department of Transportation. It is a freeware program. This program calculates truck moments to determine whether the given truck should be allowed over bridges of various spans and classes. This logic will determine if the truck can cross A, B, and / or C class bridges. The route analysis will know the class of each bridge crossed over based on the bridge inventory data. The class of the bridge will be checked against the computations of whether or not the vehicle can cross that bridge class. Passing and failing analyses will be counted, summarized, and reported. A route analysis must pass all ABCD bridge checks to be successful.
The R code indicates that the main load carrying beams, girders or other members are spaced greater than 10-ft. For these bridges, the allowable axle loads cannot be adjusted for gage width. Whenever an "R" bridge is encountered, the truck must be evaluated for the actual axle loads, not the axle loads that were reduced to account for gage width. Reductions in loads based on axle widths are all computed in the MI process that evaluates the vehicle.
The R code field may also have an "S" value. If the field contains an S, it means that the slab controls. The R and S codes will be treated separately. As mentioned above, R bridges will not allow the adjustment of axle loads based on axle gage, while S bridges will. However, S bridges will be subject to an additional condition that B and C class bridges will not pass if any axle exceeds 38,000 pounds.
Following is the algorithm that will be used for all vehicle / bridge analysis, accounting for all ABCD and R/S codes.
1. Determine the A, B, C values for the actual permit vehicle configuration (inputting actual axle weights, spacings, and widths). Let's call the result of this step the 3 values - TruckA_ActualGage/AdjustedAxleWt, TruckB_ActualGage/AdjustedAxleWt, TruckC_ActualGage/AdjustedAxleWt, where each of these three values indicate whether or not the truck can pass each bridge type given the actual axle widths (reducing the axle weights as appropriate).
2. Determine the A, B, C values for the permit vehicle configuration BUT WITH STD 8' AXLE WIDTHS (inputting actual axle weights, spacings, and hardcoded 8' axle widths). Let's call the result of this step the 3 values - TruckA_StdGage/StdAxleWt, TruckB_StdGage/StdAxleWt, TruckC_StdGage/StdAxleWt, where each of these three values indicate whether or not the truck
Appendix A – Excerpt from “SUPERLOAD Permitting and Routing Implementation”
A-2
ORBP Reference No. OR10-010 Report No. RC-1589
can pass each bridge type given the std gage, hardcoded 8' axle widths (using the standard / actual axle weight with no reduction allowed).
3. For each bridge, do the following evaluation....
If the bridge has the R code, that specifies "the truck would have to be evaluated for the actual axle loads" - meaning the hardcoded std gage. Check the bridge classification against the "StdGage/StdAxleWt" Vehicle classification. For example, if it is a B + R bridge, see if the TruckB_StdGage/StdAxleWt indicates passing. If so, pass it. If not, fail it.
If the bridge DOES NOT have the R code, that specifies we should use "the axle loads that were reduced to account for gage width" - meaning the actual permit vehicle gage (which may or may not be std gage). Check the bridge classification against the "ActualGage/AdjustedAxleWt" Vehicle classification. For example, if it is an A bridge without the R, see if the TruckA_ActualGage/AdjustedAxleWt indicates passing. If so, pass it. If not, fail it. If the bridge passes, AND has the S code, AND is a B or C class bridge, also ensure no axle exceeds 38,000 pounds. If so, pass it. If not, fail it.

Appendix B – Michigan Virtis DB bridge demographics
B-1
ORBP Reference No. OR10-010 Report No. RC-1589
Appendix B – Michigan Virtis DB bridge demographics
This appendix provides a breakdown of the 225 bridge Virtis database provided by
MDOT for use on this project. The database was provided in the Interim Phase of the
project and represents a portion of the total bridges that MDOT has input into Virtis. As
of the date of this report, over 2000 bridges have been input into the MDOT Virtis
database.
Year Built
The total breakdown of bridges by year built is shown below. The year built was
extracted from the Virtis database and the break down seems to represent the typical
nationwide breakdown from the NBI database.
Year Built (NBI year_built) Total Percent %
1900<=Year Built<1910 0 0.00%
1910<=Year Built<1920 1 0.18%
1920<=Year Built<1930 18 3.30%
1930<=Year Built<1940 27 4.95%
1940<=Year Built<1950 27 4.95%
1950<=Year Built<1960 57 10.46%
1960<=Year Built<1970 149 27.34%
1970<=Year Built<1980 79 14.50%
1980<=Year Built<1990 40 7.34%
1990<=Year Built<2000 56 10.28%
2000<=Year Built<=2010 91 16.70%
Total 545 100.00%

Appendix B – Michigan Virtis DB bridge demographics
B-2
ORBP Reference No. OR10-010 Report No. RC-1589
Structure Type
Virtis permits the input of structures in entire systems (i.e. all girders defined for the structure) or as a line
superstructure (i.e. just the girder defined). The vast majority of structures received were ‘Girder System
Superstructures’. These are multi-girder systems. No trusses were in the database and just a few Girder-
Floorbeam-Stringer bridges were included. See chart below for the distribution of bridge types.
System Type (line/System) (NBI sys_type)
Total Percent %
Floor System Superstructure (GFS) 3 0.55%
Girder Line Superstructure 14 2.57%
Girder System Superstructure 528 96.88%
Total 545 100.00%

Appendix B – Michigan Virtis DB bridge demographics
B-3
ORBP Reference No. OR10-010 Report No. RC-1589
Material Type
The overall break down by structure type is as shown in the following table. Note that
the total number (572) is greater than the total number of structures represented in the
previous two charts. This is due to the fact that Virtis structures can be comprised of
multiple types (e.g. you can have a structure that is comprised of steel main spans with
PS approach spans).
Type # bridges %
PS Box Beam 106 18.5%
PS I-beam 125 21.9%
PS T-beam 0 0.0%
PS U-beam 0 0.0%
Rectangular Sawn Timber 1 0.2%
RC I-beam 0 0.0%
RC Slab 11 1.9%
RC T-beam 34 5.9%
Steel Built-Up 15 2.6%
Steel Plate 96 16.8%
Steel Rolled 184 32.2%
Steel Truss 0 0.0%
Total 572 100.0%

Appendix B – Michigan Virtis DB bridge demographics
B-4
ORBP Reference No. OR10-010 Report No. RC-1589
Span Length Breakdown
The following figure and chart represents the breakdown of the structures by span
length. Note that none of the structure maximum span lengths exceeds 220’.
Max. Span Length (ft) (NBI max_span_length) Total Percent %
10.000<=Max. Span Length (ft)<20.000 4 0.73%
20.000<=Max. Span Length (ft)<30.000 32 5.87%
30.000<=Max. Span Length (ft)<40.000 54 9.91%
40.000<=Max. Span Length (ft)<50.000 53 9.72%
50.000<=Max. Span Length (ft)<60.000 65 11.93%
60.000<=Max. Span Length (ft)<70.000 48 8.81%
70.000<=Max. Span Length (ft)<80.000 73 13.39%
80.000<=Max. Span Length (ft)<90.000 53 9.72%
90.000<=Max. Span Length (ft)<100.000 40 7.34%
100.000<=Max. Span Length (ft)<110.000 38 6.97%
110.000<=Max. Span Length (ft)<120.000 32 5.87%
120.000<=Max. Span Length (ft)<130.000 20 3.67%
130.000<=Max. Span Length (ft)<140.000 12 2.20%
140.000<=Max. Span Length (ft)<150.000 7 1.28%
150.000<=Max. Span Length (ft)<160.000 4 0.73%
160.000<=Max. Span Length (ft)<170.000 1 0.18%
170.000<=Max. Span Length (ft)<180.000 3 0.55%
180.000<=Max. Span Length (ft)<190.000 3 0.55%
190.000<=Max. Span Length (ft)<200.000 1 0.18%
200.000<=Max. Span Length (ft)<210.000 1 0.18%
210.000<=Max. Span Length (ft)<=220.000 1 0.18%
Total 545 100.00%

Appendix B – Michigan Virtis DB bridge demographics
B-5
ORBP Reference No. OR10-010 Report No. RC-1589
Maximum Span Count
The following chart and graph represents the maximum span count for the structures in
the Michigan sample database. Note that the vast majority of bridges are simple span
structures.
Max. Number of Spans (NBI max_span_count)
Total Percent %
Max. Number of Spans = 1 376 68.99%
Max. Number of Spans = 2 64 11.74%
Max. Number of Spans = 3 74 13.58%
Max. Number of Spans = 4 21 3.85%
Max. Number of Spans = 5 5 0.92%
Max. Number of Spans = 6 1 0.18%
Max. Number of Spans = 7 2 0.37%
Max. Number of Spans = 8 2 0.37%
Total 545 100.00%

Appendix B – Michigan Virtis DB bridge demographics
B-6
ORBP Reference No. OR10-010 Report No. RC-1589
This page intentionally left blank
Appendix C – Original BridgeOV Documentation
C-1
ORBP Reference No. OR10-010 Report No. RC-1589
Appendix C – Original BridgeOV documentation
Summary:
In summary, the program calculates the moments of simple span lengths of a user
defined vehicle (input file) and compares that with predetermined moments of multiple
classes.
The program is very simple and is written in the ‘C’ programming language. The
software was rebuilt and run in Microsoft Developer Studio, 2008 with few problems.
The source code provided to the researchers appears to be slightly different than the
source code used to build the executable that accompanied the source code. This was
evident because there are some output print statements that appear in the test case
when run in the delivered EXE that don’t appear in the researcher compiled version of
the EXE for the same input. Additionally, the printed messages from the delivered EXE
could not be located in the source code. Other than that, the results were identical.
Below is a flowchart of the program (Figure C-113). The following pages provide a
description of the program functions and output.

Appendix C – Original BridgeOV Documentation
C-2
ORBP Reference No. OR10-010 Report No. RC-1589
Start
read_bridge()
Read predefined Category A, B
and C moments
edit_truck()
Read user provided truck axle
loads, axle spacing and gage
Loop SpanLengths
between 15'-160' in 5'
increments
calculate()
Calculate
moments of
input truck
End Loop
SpanLengths
Move vehicle between
0.4 L and 0.6 L and save
the maximum moment
for each span length
print_output()
Print the results of the
comparison of the
calculated moments with
the Category A,B,C
vehicles
End
Figure C-113. BRIDGEOV.EXE flowchart

Appendix C – Original BridgeOV Documentation
C-3
ORBP Reference No. OR10-010 Report No. RC-1589
Overview of Current Michigan overload program (BRIDGEOV.EXE)
- banner(stdout,0)
o Prints the disclaimer banner to the screen and waits for the user to hit
return
- read_bridge(struct bridge_t *bridge) – Reads moments from a file for 3 truck
classes for different span lengths and stores them in the passed structure
‘bridge’. File is named ‘CLSABC2U.TXT’. The format of the file is as follows:
# Any line beginning with a # sign is a comment line and will be ignored
# This information should not be modified in any way without approval
# It is important that the fields start in the proper columns.
# Anything other than the I, F, G, H, and B columns will be ignored.
#0000000011111111112222222222333333333344444444445
#2345678901234567890123456789012345678901234567890
#AAAA III FFFFFFFF GGGGGGGG HHHHHHHH BBBBBBBB
#MOM CLASS A B C 2U77
#
SPAN= 010 195.0 195.0 195.0 92.9
SPAN= 011 215.4 214.5 214.5 102.2
SPAN= 012 234.8 234.0 234.0 111.5
.
.
SPAN= 199 11912.7 10160.5 7989.6 7691.6
SPAN= 200 11986.2 10223.2 8038.9 7732.9
The ‘SPAN= 010’ is the span length. The A,B, and C columns are used, but the 2U77
(i.e. B), while it is read, it does not appear to be used for anything. The values in the A,
B and C columns are echoed in the output (in increments of 5’ lengths) are compared
against the calculated simple span live load moment
- edit_truck(truck_t *truck) – this function reads in the truck axle load, axle
spacing, and gage from an input file. Once read in, the program permits
modifying of the truck data that is read in. The function also permits entering a
truck manually. The vehicle gage factors the axle load by the following formula
o AxleLoad = InputAxleLoad * ((InputGage + 8.0)/16.0)
Therefore if the InputGage = 8.0, then the AxleLoad = InputAxleLoad
- calculate(struct truck_t *truck, struct results_t *results) – using simple span influence
lines, this function calculates truck moments for the input vehicle.
o Impact is applied to the vehicle and is calculated as
I = Min(1 + (50 / (125 + L)) , 1.3)
With:
L = span length

Appendix C – Original BridgeOV Documentation
C-4
ORBP Reference No. OR10-010 Report No. RC-1589
o Calculates and saves maximum moments for the truck for simple spans (from 15’
to 160’ in increments of 5’) and ultimately compares them with the Class A, B,
and C moments read in from the file ‘CLSABC2U.TXT’.
o Only looks at influence points from 0.4L location to the 0.6L location of the
simple span.
- print_output(FILE *output …) – prints the output results to stdout (for screen
printing) and/or to a file. (Output example shown below)

Appendix D – Permit Vehicle Review
D-1
ORBP Reference No. OR10-010 Report No. RC-1589
Appendix D – Permit Vehicle Review
The following table provides all 31 permit vehicles originally considered, with several similar vehicles removed to reduce
the list to 25. The removed vehicles are shown with a strikethrough and are not represented in the subsequent plots.
Table D-25. List of permit vehicles reviewed
Name PermitID Number Axles
Gross Weigh
t
Total Lengt
h
Axle Spacings Axle Loads
MIPermit0001 111000582302 5 136.65 25.42 7.666667,5.583333,6.583333,5.583333 27.9,27.9,26.95,26.95,26.95
MIPermit0002 111000157102 5 143.50 23.83 7.91667,5.25,5.333, 5.333 28.7,28.7,28.7,28.7,28.7
MIPermit0003 111000222302 6 145.44 44.42 12.16667,4.25,20,4,4 20.36,28.82,28.82,22.48,22.4
8,22.48
MIPermit0004 111000273402 6 150.22 29.92 4.5,4.5,11.91667,4.5,4.5 19.12,19.37,11.17,34.34,34.0
4,32.18
MIPermit0005 111000564202 6 152.00 63.17 12.33333,4.166667,37.66667,4.5,4.5 12,28,28,28,28,28
MIPermit0006 111000391002 7 161.50 53.33 10.5,4.5,4.5,25,4.5,4.333333 16,24,24,24,24.5,24.5,24.5
MIPermit0007 111000361802 6 162.00 58.50 12,4.5,33,4.5,4.5 18,30,30,28,28,28
MIPermit0008 111000036002 6 172.20 34.75 5.583333,10.5,5.416667,7.833333,5.416667 28.7,28.7,28.7,28.7,28.7,28.7
MIPermit0009 111000172302 9 184.40 99.00 18.16667,4.5,14.16667,4.5,34.5,4.5,14.16667,4.5 14,21,21,21,21,22.2,22.2,21,
21
MIPermit0010 111000427300 12 194.00 108.50 16,4.5,4.5,15,4.5,30,4.5,4.5,4.5,16,4.5 12,14,14,14,20,20,15,15,15,1
5,20,20
MIPermit0011 111000180502 7 198.70 64.50 11,4,36,4.5,4.5,4.5 18.7,27.7,27.7,31.7,31.7,30.6
, 30.6
MIPermit0012 111000028002 7 200.90 37.92 6.083333,9,5.416667,5.416667,6.583333,5.4166
67 28.7,28.7,28.7,28.7,28.7,28.7
, 28.7

Appendix D – Permit Vehicle Review
D-2
ORBP Reference No. OR10-010 Report No. RC-1589
Name PermitID Number Axles
Gross Weigh
t
Total Lengt
h
Axle Spacings Axle Loads
MIPermit0013 111000469500 8 207.95 70.33 12.33333,4.833333,5.166667,36,4,4,4 8.141,7.449,31.668,32.013,3
2.108,32.319, 32.154,32.1
MIPermit0014 111000318802 8 208.00 69.00 11,4.5,4.5,36,4.333333,4.333333,4.333333 19,28,30.5,30.5,25,25,25,25
MIPermit0015 111000264000 13 224.00 122.33 14.41667,4.583333,4.583333,15.33333,5,5,39.33
333,5,5,14.08333,5,5 14,18,18,18,18,18,18,17,17,1
7,17,17,17
MIPermit0016 111000122002 9 234.60 72.33 11.16667,4,4.333333,33.83333,4.5,4.5,5,5 18,25,30.8,30.8,28,28,25,
25,24
MIPermit0017 111000256902 9 244.00 83.00 17.5,4.5,4.5,36.5,5,5,5,5 14,30,30,30,28,28,28,28, 28
MIPermit0018 111001079000
18 411.2 150.58 14.75,4.5,4.5,9.416667,4.5,4.5,9.416667,4.5,4.5,48.66667,4.5,9.416667,4.5,4.5,9.416667,4.5,4.5
11.7,23.5,23.5,23.5,23.5,23.5,23.5,23.5,23.5,23.5,23.5,23.5,23.5,23.5,23.5,23.5,23.5,23
.5
MIPermit0019 111000650702 10 270 79.66 11.83333,4.666667,7.25,4.166667,4.166667,35.0
8333,4.166667,4.166667,4.166667 18,28,28,28,28,28,28,28,28,2
8
MIPermit0020 111000552802 10 252 79.66 11.83333,4.666667,7.25,4.166667,4.166667,35.0
8333,4.166667,4.166667,4.166667 18,26,26,26,26,26,26,26,26,2
6
MIPermit0021 111002067902 10 246.5 79.5 12.16667,4.166667,7,4.166667,34,4.5,4.5,4.5,4.5 14,27.5,27.5,27.5,27.5,24.5,2
4.5,24.5,24.5,24.5
MIPermit0022 111000896302 10 246.3 93.41 12,4.5,13.58333,4.5,31.83333,4.5,4.5,13.5,4.5 18,23.65,23.65,28,28,25,25,2
5,25,25
MIPermit0023 111001324800 9 289.2 89.83 12,4.5,12,4.5,43.33333,4.333333,4.833333,4.333
333 16,27.3,27.3,49.7,49.7,29.8,2
9.8,29.8,29.8
MIPermit0024 111001883502 9 217.6 72 11.16667,4,4,33.83333,4.5,4.5,5,5 18,24,30.8,30.8,24,24,22,22,
22
MIPermit0025 111001738902 8 193.88 71.417 15.16667,4.166667,4.416667,35.41667,4.083333
,4.083333,4.083333 14,25.697,25.697,25.697,25.
697,25.697,25.697,25.698
MIPermit0026 111001281802 8 191 71.917 11.75,4,4.25,4.25,39,4.333333,4.333333 16,16,24,27,27,27,27,27

Appendix D – Permit Vehicle Review
D-3
ORBP Reference No. OR10-010 Report No. RC-1589
Name PermitID Number Axles
Gross Weigh
t
Total Lengt
h
Axle Spacings Axle Loads
MIPermit0027 111000751002 8 185.2 62.167 12,4.333333,4.333333,29,4.166667,4.166667,4.1
66667 18,19,26.7,26.7,23.7,23.7,23.
7,23.7
MIPermit0028 111001353402 7 187.6 65 14,4.5,34,4.166667,4.166667,4.166667 14,30.8,30.8,28,28,28,28
MIPermit0029 111001780902 7 172.8 60.833 12.16667,4.166667,32,4.166667,4.166667,4.166
667 14,30.8,30.8,24.3,24.3,24.3,2
4.3
MIPermit0030 111000692602 4 112.04 17 5,7,5 29.7,29.48,26.58,26.28
MIPermit0031 111001491702 3 61.2 19.833 15.5,4.333333 20,20.6,20.6
Note: Vehicles with strikethrough are not shown in the graphs.

Appendix D – Permit Vehicle Review
D-4
ORBP Reference No. OR10-010 Report No. RC-1589
The following table provides a cross reference of the vehicle grouping and the
subsequent figures.
Table D-26. Permit Table groupings for plotting
Vehicle name Permit ID # Axles Weight Length
Figure
MIP-0031 111001491702 3 61.2 19.8 Figure D-115
MIP-0030 111000692602 4 112.0 17.0 MIP-0002 111000157102 5 143.5 23.8 MIP-0008 111000036002 6 172.2 34.8 Figure D-116
MIP-0007 111000361802 6 162.0 58.5 MIP-0004 111000273402 6 150.2 29.9
MIP-0003 111000222302 6 145.4 44.4 MIP-0012 111000028002 7 200.9 37.9 Figure D-117
MIP-0011 111000180502 7 198.7 64.5 MIP-0029 111001780902 7 172.8 60.8 MIP-0006 111000391002 7 161.5 53.3 MIP-0013 111000469500 8 208.0 70.3 Figure D-118
MIP-0025 111001738902 8 193.9 71.4 MIP-0026 111001281802 8 191.0 71.9 MIP-0027 111000751002 8 185.2 62.2 MIP-0023 111001324800 9 289.2 89.8 Figure D-119
MIP-0017 111000256902 9 244.0 83.0 MIP-0016 111000122002 9 234.6 72.3 MIP-0009 111000172302 9 184.4 99.0 MIP-0019 111000650702 10 270.0 79.7 Figure D-120
MIP-0021 111002067902 10 246.5 79.5 MIP-0022 111000896302 10 246.3 93.4 MIP-0010 111000427300 12 194.0 108.5 Figure D-121
MIP-0015 111000264000 13 224.0 122.3 MIP-0018 111001079000 18 411.2 150.6

Appendix D – Permit Vehicle Review
D-5
ORBP Reference No. OR10-010 Report No. RC-1589
Figure D-114. All Michigan permit vehicles (from permit list provided from MDOT)
Figure D-115. Vehicles MIP-0002, 0030, 0031 (3, 4, and 5 axles) moment

Appendix D – Permit Vehicle Review
D-6
ORBP Reference No. OR10-010 Report No. RC-1589
Figure D-116. Vehicles MIP-0003, 0004, 0007,0008 (6 axles) moment
Figure D-117. Vehicles MIP-0006, 0011, 0012, 0029 (7 axles) moment

Appendix D – Permit Vehicle Review
D-7
ORBP Reference No. OR10-010 Report No. RC-1589
Figure D-118. Vehicles MIP-0013, 0025, 0026, 0027 (8 axles) moment
Figure D-119. Vehicles MIP-0009, 0016, 0017, 0023 (9 axles) moment
Appendix D – Permit Vehicle Review
D-8
ORBP Reference No. OR10-010 Report No. RC-1589
Figure D-120. Vehicles MIP-0019, 0021, 0022 (10 axles) moment
Figure D-121. Vehicles MIP-0010, 0015, 0018 (12, 13 and 18 axles) moment

APPENDIX E – Permit Vehicles – Virtis Ratings
E-1
ORBP Reference No. OR10-010 Report No. RC-1589
Appendix E – Permit Vehicles - Virtis Ratings
This appendix provides a review of 17 permit vehicles selected from a list provided by
MDOT. Comparisons to Virtis ratings and MDOT BridgeOV ratings are made.
Table E-27. Summary of results – comparing Virtis/BridgeOV – 225 bridges – 17 permit vehicles
Name PermitID
Number
Axles
Gross
Weight
Total
Length
Oper
Ratings
>= 1.0
Oper
Ratings <
1.0 Total % passed A B C A B C
MIPermit0001 111000582302 5 137 25 156 69 225 69.3% YES NO NO - 35-70 30-125
MIPermit0002 111000157102 5 144 24 127 98 225 56.4% YES NO NO - 25-90 25-160
MIPermit0003 111000222302 6 145 44 204 21 225 90.7% YES YES YES - - -
MIPermit0004 111000273402 6 150 30 123 102 225 54.7% YES NO NO - 15-90 15-160
MIPermit0005 111000564202 6 152 63 194 31 225 86.2% YES YES NO - - 25-50
MIPermit0006 111000391002 7 162 53 197 28 225 87.6% YES YES YES - - -
MIPermit0007 111000361802 6 162 59 186 39 225 82.7% YES YES NO - - 25-50
MIPermit0008 111000036002 6 172 35 129 96 225 57.3% YES NO NO - 40-120 30-160
MIPermit0009 111000172302 9 184 99 218 7 225 96.9% YES YES YES - - -
MIPermit0010 111000427300 12 194 109 218 7 225 96.9% YES YES YES - - -
MIPermit0011 111000180502 7 199 65 117 108 225 52.0% NO NO NO 25-40 20-70 20-160
MIPermit0012 111000028002 7 201 38 85 140 225 37.8% NO NO NO 45-115 30-160 25-160
MIPermit0013 111000469500 8 208 70 93 132 225 41.3% NO NO NO 20-50 15-125 15-160
MIPermit0014 111000318802 8 208 69 158 67 225 70.2% YES NO NO - 25-40
20-75,
90-160
MIPermit0015 111000264000 13 224 122 218 7 225 96.9% YES YES YES - - -
MIPermit0016 111000122002 9 235 72 122 103 225 54.2% YES NO NO -
20-70,
85-160 20-160
MIPermit0017 111000256902 9 244 83 102 123 225 45.3% NO NO NO 30-45 25-160 20-160
HS-20-44 na 3 72 28-44 219 6 225 97.3% YES YES YES - - -
Passed Bridge OV?
Span Lengths Not Passed (ft)
5ft increments
Table E-27 shows a breakdown of the 225 bridges run with the 17 permit vehicles using
BRASS/Virtis LFR in version 6.3 of Virtis. The Number of bridges passed for each
vehicle is represented in column 6, the percentage passed is column 9 (see also Figure
E-122).
Columns 10-12 represent the BridgeOV results (whether or not they passed Classes A,
B, and C) while columns 13-16 represent the span lengths (from 15’-160’ in increments
of 5’) that the vehicle did not pass.
Virtis rating value plots for HS20 and the first 3 permit vehicles are provided in Figure E-
123 through Figure E-126.
A sample BridgeOV file for vehicle MIPer0001 is provided at the end of this appendix
APPENDIX E – Permit Vehicles – Virtis Ratings
E-2
ORBP Reference No. OR10-010 Report No. RC-1589
Figure E-122. Operating rating factors > 1.0 for the 17 vehicles listed in Table E-27
HS-20 Rating Plot
Figure E-123. Operating rating factors vs. Virtis BridgeID for HS 20-44
0.0%
20.0%
40.0%
60.0%
80.0%
100.0%
120.0%M
IPe
rmit
00
01
MIP
erm
it0
00
2
MIP
erm
it0
00
3
MIP
erm
it0
00
4
MIP
erm
it0
00
5
MIP
erm
it0
00
6
MIP
erm
it0
00
7
MIP
erm
it0
00
8
MIP
erm
it0
00
9
MIP
erm
it0
01
0
MIP
erm
it0
01
1
MIP
erm
it0
01
2
MIP
erm
it0
01
3
MIP
erm
it0
01
4
MIP
erm
it0
01
5
MIP
erm
it0
01
6
MIP
erm
it0
01
7
% o
pe
rati
ng
Fact
ors
>=
1.0
Permit Vehicle
% Operating RF > 1.0
Series1

APPENDIX E – Permit Vehicles – Virtis Ratings
E-3
ORBP Reference No. OR10-010 Report No. RC-1589
Operating Rating Plots
Figure E-124. Operating rating factors vs. Virtis Bridge ID for permit vehicle MIPer0001 (see Table E-27)
Figure E-125. Operating rating factors vs. Virtis Bridge ID for permit vehicle MIPer0002 (see Table E-27)

APPENDIX E – Permit Vehicles – Virtis Ratings
E-4
ORBP Reference No. OR10-010 Report No. RC-1589
Figure E-126. Operating rating factors vs. Virtis Bridge ID for permit vehicle MIPer0003 (see Table E-27)
Sample BridgeOV output
Bridge overload (Bridgeov) Version 1.0
Copyright (c) 1991 - Freeware program.
This program is of public domain and may be freely distributed and used.
Any comercial redistribution of this program or part of it is
however prohibited.
This program was jointly developed by the Transportation Technology
Transfer Center located at the Michigan Technological University and
the Michigan Department of Transportation.
Original program written by: David D. Abbott, P.E.
Conversions and Updates by: David Paxson and Markus Varsta.
**************
This program will calculate truck moments to determine whether the
given truck should be allowed over bridges of various spans and classes.
Pathname: MIPermit0001.TXT Run Date: Thu Jun 30 15:59:12 2011
Run name: MIPer0001
Axle # Gage Load Aj-Ld Dist To-Dis To-Load To-Aj Load
(feet) (kips) (kips) (feet) (feet) (kips) (kips)
1 8.00 27.90 27.90 0.00 0.00 27.9 27.9
2 8.00 27.90 27.90 7.67 7.67 55.8 55.8
3 8.00 26.95 26.95 5.58 13.25 82.8 82.8
4 8.00 26.95 26.95 6.58 19.83 109.7 109.7
5 8.00 26.95 26.95 5.58 25.42 136.7 136.7
Maximum allowable moments for

APPENDIX E – Permit Vehicles – Virtis Ratings
E-5
ORBP Reference No. OR10-010 Report No. RC-1589
simple span bridges between 15-160 feet.
Simple span Truck Moment Class A Class B Class C
(ft) (kip [ft]) (kip [ft]) (kip [ft]) (kip [ft])
15 182.3 329.5 292.5 292.5
20 315.2 473.6 410.0 390.0
25 468.4 634.0 537.3 487.5
30 662.3 808.3 690.4 597.0 NO
35 884.4 1022.7 861.3 NO 726.0 NO
40 1106.5 1245.2 1035.9 NO 867.1 NO
45 1322.5 1468.4 1232.0 NO 1019.6 NO
50 1533.5 1723.0 1428.8 NO 1187.6 NO
55 1742.3 1991.5 1647.2 NO 1377.7 NO
60 1949.1 2257.8 1881.8 NO 1578.7 NO
65 2153.9 2522.2 2119.9 NO 1778.5 NO
70 2357.0 2803.7 2356.5 NO 1977.0 NO
75 2558.5 3083.5 2591.7 2181.4 NO
80 2758.5 3361.5 2825.4 2388.0 NO
85 2957.1 3638.0 3069.6 2601.4 NO
90 3154.4 3926.8 3365.8 2813.8 NO
95 3350.5 4270.5 3660.4 3050.4 NO
100 3545.5 4612.4 3953.5 3294.6 NO
105 3739.4 4952.6 4245.1 3537.6 NO
110 3932.4 5291.3 4535.4 3779.5 NO
115 4124.4 5629.1 4824.3 4020.3 NO
120 4315.6 5975.3 5112.0 4260.0 NO
125 4505.9 6360.7 5424.9 4498.7 NO
130 4695.5 6744.5 5752.2 4736.5
135 4884.4 7126.7 6078.3 4973.4
140 5072.5 7507.5 6403.1 5209.4
145 5260.1 7887.0 6726.8 5444.6
150 5447.0 8265.1 7049.3 5679.1
155 5633.3 8642.0 7370.7 5912.8
160 5819.2 9017.6 7691.2 6145.7
For unknown span lengths, MIPer0001 can drive over the
class of bridge listed below:
Class A Class B Class C
YES NO NO
For Bridge Class refer to MDOT map and table titled
"Table of Bridges with Restricted Load Limits" and MDOT table
"Overloads Permissible on Bridges."

APPENDIX E – Permit Vehicles – Virtis Ratings
E-6
ORBP Reference No. OR10-010 Report No. RC-1589
This page intentionally left blank

APPENDIX F – CLSABC2U.TXT file used by BridgeOV
F-1
ORBP Reference No. OR10-010 Report No. RC-1589
Appendix F – Revised CLSABC2U.txt File
The following is the revised file used by BridgeOV and stores the predefined moment
and shear envelopes for the 20 Class A,B, and C vehicles. A similar file with LRFR
moments based on varying load factors is also provided with the program as
CLSABC2U_LRFR.txt.
New File ‘CLSABC2U.TXT’
# Any line beginning with a # sign is a comment line and will be ignored
# This information should not be modified in any way without approval
# It is important that the fields start in the proper columns.
# Anything other than the I, F, G, H, and B columns will be ignored.
#0000000011111111112222222222333333333344444444445
#2345678901234567890123456789012345678901234567890
#AAAA III FFFFFFFF GGGGGGGG HHHHHHHH BBBBBBBB SHEAR Shear 2 equal spans
#MOM CLASS A B C 2U77 HS20 (14 ft) A B C A B C
#
SPAN= 010 195.1 191.9 185.4 92.9 104.0 93.7 81.2 74.2 99.3 86.1 75.1
SPAN= 011 215.5 211.0 203.9 102.2 114.4 95.8 83.1 74.2 101.4 87.9 76.6
SPAN= 012 243.8 230.2 222.4 111.5 124.8 97.6 84.6 74.2 103.0 89.3 77.9
SPAN= 013 272.3 249.4 240.9 120.8 135.2 99.1 85.9 74.9 105.0 91.0 79.4
SPAN= 014 300.8 268.6 259.5 130.1 145.6 100.5 87.0 75.9 106.6 92.4 80.6
SPAN= 015 329.6 287.7 278.0 139.4 156.0 101.8 88.0 76.7 107.9 93.5 81.5
SPAN= 016 358.4 310.6 296.5 160.6 166.4 103.8 88.8 77.5 109.3 94.4 82.3
SPAN= 017 387.2 335.6 315.0 181.7 176.8 105.6 91.6 79.0 111.7 96.8 82.9
SPAN= 018 416.1 360.6 333.6 202.8 187.2 108.4 94.0 80.3 114.9 99.6 84.3
SPAN= 019 445.0 385.7 352.1 223.9 197.6 110.9 96.2 81.9 117.7 102.0 86.7
SPAN= 020 474.0 410.8 370.6 245.1 208.0 113.2 98.1 83.8 120.2 104.2 88.8
SPAN= 021 504.2 435.9 389.1 269.9 218.4 115.2 99.9 85.5 122.4 106.1 90.8
SPAN= 022 536.4 461.0 407.7 295.8 228.8 117.1 101.5 87.1 124.4 107.8 92.5
SPAN= 023 568.5 486.1 426.2 325.3 239.2 119.1 103.0 88.7 126.2 109.4 94.0
SPAN= 024 601.0 511.3 445.8 354.9 249.6 121.6 104.3 90.3 128.7 110.8 95.8
SPAN= 025 634.3 537.3 467.9 384.5 266.2 123.9 105.6 91.8 131.3 112.1 97.5
SPAN= 026 667.7 566.5 493.7 414.1 286.2 126.0 106.7 93.2 133.7 113.9 99.0
SPAN= 027 701.0 597.5 519.4 443.6 306.2 128.0 107.8 94.5 135.9 116.2 100.8
SPAN= 028 735.3 628.5 545.2 476.6 326.1 129.8 108.7 95.7 137.9 118.1 102.5
SPAN= 029 771.6 659.5 571.0 510.2 346.1 131.6 109.7 97.2 139.7 119.8 104.0
SPAN= 030 808.0 690.6 596.8 543.9 366.1 133.2 110.5 98.9 141.4 121.3 105.3
SPAN= 031 846.4 721.8 622.6 577.7 386.0 134.7 111.3 100.5 143.0 122.7 106.5
SPAN= 032 889.5 756.7 648.4 611.4 406.0 136.1 112.4 102.0 144.4 123.9 108.0
SPAN= 033 933.9 791.6 674.1 645.1 426.0 137.4 113.5 103.4 145.8 124.9 109.6
SPAN= 034 978.3 826.4 699.9 678.9 446.4 138.6 114.9 104.7 147.1 125.9 111.0
SPAN= 035 1022.7 861.3 725.7 712.6 469.4 139.8 116.4 106.0 148.9 126.7 112.4
SPAN= 036 1067.1 899.1 751.5 746.4 492.5 140.9 117.8 107.1 151.0 127.5 113.7
SPAN= 037 1111.6 941.6 777.3 780.1 515.5 142.3 119.7 108.2 153.7 129.3 115.0
SPAN= 038 1156.2 984.1 805.8 813.9 538.6 145.1 122.0 109.3 156.3 131.4 116.1
SPAN= 039 1203.8 1026.6 836.4 847.6 561.7 147.7 124.2 110.3 158.9 133.6 117.2
SPAN= 040 1253.8 1069.1 867.2 881.4 584.7 150.3 126.3 111.3 161.8 136.0 118.2
SPAN= 041 1303.8 1111.8 898.0 915.1 607.8 152.6 128.3 112.2 164.5 138.3 119.2
SPAN= 042 1353.2 1153.9 928.6 952.3 630.6 154.8 130.2 113.0 167.0 140.4 120.0
SPAN= 043 1401.2 1194.8 958.3 989.9 652.8 156.8 131.8 113.6 169.2 142.2 120.7
SPAN= 044 1449.1 1235.7 987.9 1027.4 675.0 158.6 133.4 114.3 171.3 144.0 121.3
SPAN= 045 1496.9 1276.5 1019.6 1064.7 697.1 160.4 134.8 114.8 173.2 145.6 122.1
SPAN= 046 1544.6 1317.2 1052.3 1102.0 719.2 162.0 136.2 115.4 175.0 147.2 123.4
SPAN= 047 1592.2 1357.7 1084.9 1142.6 741.3 163.6 137.6 116.3 176.8 148.6 124.6
SPAN= 048 1639.7 1398.2 1117.5 1184.7 763.3 165.1 138.8 117.5 178.4 150.0 125.8
SPAN= 049 1687.1 1438.6 1151.1 1226.7 785.3 166.6 140.0 118.5 180.0 151.3 126.9
SPAN= 050 1734.4 1479.0 1188.3 1268.5 807.2 167.9 141.2 119.6 181.5 152.5 127.9
SPAN= 051 1783.0 1520.4 1225.4 1310.4 829.0 169.2 142.3 120.6 182.8 153.7 129.1
SPAN= 052 1835.1 1564.8 1262.4 1352.4 850.9 170.5 143.3 121.5 184.2 154.8 130.4
SPAN= 053 1887.1 1609.2 1299.5 1394.3 872.7 171.7 144.3 122.4 185.4 155.9 131.7
SPAN= 054 1939.0 1653.4 1336.7 1436.0 894.5 172.8 145.3 123.3 186.6 156.9 132.9
SPAN= 055 1991.5 1697.5 1376.9 1477.8 916.3 173.9 146.2 124.4 187.7 157.8 134.1
SPAN= 056 2045.0 1741.6 1417.0 1519.4 938.0 174.9 147.0 125.4 188.8 158.7 135.2
SPAN= 057 2098.4 1785.6 1457.1 1560.9 959.7 175.9 147.9 126.3 189.8 159.5 136.2
SPAN= 058 2151.7 1829.5 1497.0 1602.4 981.3 176.9 148.7 127.2 190.8 160.4 137.2
SPAN= 059 2204.8 1873.3 1537.0 1643.7 1002.9 177.8 149.4 128.1 191.7 161.1 138.1
SPAN= 060 2257.9 1917.0 1577.3 1676.1 1024.5 178.6 150.2 128.9 192.5 161.9 139.1
SPAN= 061 2310.9 1960.6 1617.6 1722.8 1046.0 179.5 150.9 129.8 193.4 162.5 139.9
SPAN= 062 2363.7 2004.2 1657.7 1769.5 1067.5 180.3 151.6 130.5 194.2 163.2 140.7
SPAN= 063 2416.5 2047.7 1697.8 1816.0 1089.0 181.1 152.2 131.3 194.9 163.8 141.5
SPAN= 064 2469.2 2091.1 1737.7 1862.5 1110.4 181.8 152.8 132.0 195.6 164.4 142.3

APPENDIX F – CLSABC2U.TXT file used by BridgeOV
F-2
ORBP Reference No. OR10-010 Report No. RC-1589
SPAN= 065 2522.1 2134.4 1777.7 1908.8 1131.7 182.5 153.4 132.7 196.3 165.8 143.0
SPAN= 066 2578.6 2177.6 1817.5 1955.1 1153.1 183.2 154.0 133.4 197.0 167.4 143.7
SPAN= 067 2635.0 2220.8 1857.3 2001.4 1174.4 183.9 155.0 134.0 197.6 168.9 144.4
SPAN= 068 2691.3 2263.9 1897.0 2047.5 1195.7 184.5 156.3 134.6 198.8 170.4 145.0
SPAN= 069 2747.6 2308.8 1936.6 2093.6 1217.0 185.1 157.6 135.2 200.5 171.9 145.6
SPAN= 070 2803.7 2356.0 1976.7 2139.6 1238.2 185.7 158.8 135.8 202.1 173.3 146.2
SPAN= 071 2859.8 2403.1 2017.8 2185.5 1259.5 186.7 160.0 136.3 203.7 174.6 146.7
SPAN= 072 2915.7 2450.1 2058.8 2231.4 1280.7 188.1 161.2 136.9 205.2 175.9 147.3
SPAN= 073 2971.6 2497.1 2099.8 2277.2 1301.8 189.4 162.3 137.4 206.6 177.1 147.8
SPAN= 074 3027.4 2543.9 2140.7 2322.9 1322.9 190.7 163.4 137.9 208.0 178.3 148.6
SPAN= 075 3083.1 2590.7 2181.5 2368.5 1344.0 191.9 164.5 138.4 209.3 179.5 149.6
SPAN= 076 3138.9 2637.6 2222.3 2414.1 1365.1 193.1 165.5 138.8 210.6 180.6 150.5
SPAN= 077 3194.7 2684.5 2263.0 2459.6 1386.1 194.3 166.5 139.3 211.9 181.6 151.4
SPAN= 078 3250.4 2731.3 2303.6 2505.0 1407.1 195.4 167.5 139.7 213.1 182.7 152.2
SPAN= 079 3306.0 2778.0 2344.2 2550.4 1428.1 196.5 168.4 140.4 214.3 183.7 153.1
SPAN= 080 3361.5 2824.7 2386.8 2595.7 1449.0 197.5 169.3 141.1 215.4 184.6 153.9
SPAN= 081 3417.0 2871.3 2429.6 2641.0 1469.9 198.6 170.2 141.9 216.5 185.6 154.6
SPAN= 082 3472.4 2917.8 2472.4 2686.2 1490.8 199.6 171.1 142.6 217.5 186.4 155.4
SPAN= 083 3527.6 2964.2 2515.1 2731.3 1511.7 200.5 171.9 143.3 218.5 187.3 156.1
SPAN= 084 3582.8 3010.6 2557.8 2776.3 1532.5 201.5 172.7 143.9 219.5 188.2 156.8
SPAN= 085 3638.0 3069.7 2600.3 2821.3 1553.3 202.4 173.5 144.6 220.4 189.0 157.5
SPAN= 086 3693.0 3129.1 2642.9 2866.3 1574.0 203.3 174.3 145.2 221.4 189.7 158.1
SPAN= 087 3748.0 3188.4 2685.4 2911.2 1594.8 204.1 175.0 145.8 222.2 190.5 158.8
SPAN= 088 3802.9 3247.6 2727.8 2956.0 1615.5 205.0 175.7 146.4 223.1 191.2 159.4
SPAN= 089 3857.8 3306.7 2770.1 3000.7 1636.2 205.8 176.4 147.0 223.9 192.0 160.0
SPAN= 090 3926.7 3365.8 2812.4 3045.5 1656.9 206.6 177.1 147.6 224.7 192.6 160.5
SPAN= 091 3995.5 3424.7 2854.7 3090.1 1677.5 207.4 177.8 148.1 225.5 193.3 161.1
SPAN= 092 4064.2 3483.6 2903.0 3134.7 1698.1 208.1 178.4 148.7 226.3 193.9 161.6
SPAN= 093 4132.8 3542.4 2952.0 3179.2 1718.7 208.9 179.0 149.2 227.0 194.6 162.2
SPAN= 094 4201.3 3601.1 3001.0 3223.7 1739.3 209.7 179.6 149.7 227.7 195.2 162.7
SPAN= 095 4270.0 3660.0 3050.0 3268.2 1759.9 210.5 180.2 150.2 229.0 195.8 163.2
SPAN= 096 4338.7 3718.9 3099.1 3312.6 1780.5 211.2 180.8 150.7 230.4 196.6 163.6
SPAN= 097 4407.2 3777.6 3148.0 3356.9 1801.0 212.0 181.4 151.2 231.8 197.7 164.1
SPAN= 098 4475.7 3836.3 3197.0 3401.2 1821.5 212.7 181.9 151.6 233.1 198.9 164.6
SPAN= 099 4544.1 3894.9 3245.8 3445.4 1842.0 213.9 182.5 152.1 234.4 200.0 165.5
SPAN= 100 4612.4 3953.5 3294.6 3489.6 1862.5 215.1 183.5 152.5 235.7 201.0 166.4
SPAN= 101 4680.6 4012.0 3343.3 3533.7 1882.9 216.2 184.4 152.9 236.9 202.1 167.3
SPAN= 102 4748.8 4070.4 3392.0 3577.8 1903.3 217.3 185.4 153.4 238.1 203.1 168.1
SPAN= 103 4816.8 4128.7 3440.6 3621.8 1923.8 218.4 186.3 154.2 239.3 204.1 168.9
SPAN= 104 4884.8 4187.0 3489.2 3665.8 1944.1 219.4 187.2 154.9 240.4 205.1 169.7
SPAN= 105 4952.7 4245.2 3537.7 3709.7 1964.5 220.5 188.1 155.6 241.5 206.0 170.5
SPAN= 106 5020.5 4303.3 3586.1 3753.6 1984.8 221.5 188.9 156.4 242.6 206.9 171.3
SPAN= 107 5088.3 4361.4 3634.5 3797.5 2005.2 222.4 189.7 157.0 243.6 207.8 172.0
SPAN= 108 5156.0 4419.4 3682.9 3841.3 2025.5 223.4 190.6 157.7 244.7 208.7 172.7
SPAN= 109 5223.6 4477.4 3731.2 3885.0 2045.7 224.3 191.4 158.4 245.7 209.6 173.4
SPAN= 110 5291.1 4535.2 3779.4 3928.8 2066.0 225.3 192.2 159.0 246.6 210.4 174.1
SPAN= 111 5358.5 4593.1 3827.6 3972.4 2086.3 226.2 192.9 159.7 247.6 211.2 174.8
SPAN= 112 5425.9 4650.8 3875.7 4016.1 2106.5 227.0 193.7 160.3 248.5 212.0 175.4
SPAN= 113 5493.2 4708.5 3923.8 4059.6 2126.7 227.9 194.4 160.9 249.4 212.7 176.1
SPAN= 114 5560.5 4766.1 3971.8 4103.2 2146.9 228.7 195.1 161.5 250.3 213.5 176.7
SPAN= 115 5627.6 4823.7 4019.8 4146.7 2167.0 229.6 195.8 162.1 251.1 214.2 177.3
SPAN= 116 5695.6 4881.4 4067.9 4190.2 2187.2 230.4 196.5 162.7 252.0 214.9 177.9
SPAN= 117 5771.4 4939.1 4115.9 4233.6 2207.3 231.2 197.2 163.2 252.8 215.6 178.5
SPAN= 118 5851.9 4996.7 4164.0 4277.0 2227.4 231.9 197.9 163.8 253.6 216.3 179.0
SPAN= 119 5932.3 5059.9 4211.9 4320.3 2247.5 232.7 198.5 164.3 254.4 217.0 179.6
SPAN= 120 6012.6 5128.4 4259.9 4363.6 2267.6 233.5 199.1 164.8 255.1 217.6 180.1
SPAN= 121 6092.9 5196.9 4307.7 4406.9 2287.7 234.2 199.8 165.3 255.9 218.3 180.6
SPAN= 122 6173.0 5265.2 4357.5 4450.1 2307.7 234.9 200.4 165.8 256.6 218.9 181.2
SPAN= 123 6253.1 5333.5 4414.0 4493.3 2327.7 235.6 201.0 166.3 257.3 219.5 181.7
SPAN= 124 6333.1 5401.8 4470.5 4536.4 2347.7 236.3 201.6 166.8 258.0 220.1 182.1
SPAN= 125 6413.0 5469.9 4526.9 4579.5 2367.7 237.0 202.1 167.3 258.7 220.7 182.6
SPAN= 126 6492.8 5538.0 4583.2 4622.6 2387.7 237.6 202.7 167.8 259.3 221.2 183.1
SPAN= 127 6572.6 5606.1 4639.5 4665.7 2407.7 238.3 203.2 168.2 260.0 221.8 183.5
SPAN= 128 6652.3 5674.0 4695.8 4708.7 2427.6 238.9 203.8 168.7 260.6 222.3 184.0
SPAN= 129 6731.9 5741.9 4752.0 4751.6 2447.6 239.5 204.3 169.1 261.2 222.8 184.4
SPAN= 130 6811.4 5809.8 4808.1 4794.6 2467.5 240.1 204.8 169.5 261.8 223.3 184.9
SPAN= 131 6890.9 5877.5 4864.2 4837.5 2487.4 240.7 205.4 170.0 262.4 223.8 185.3
SPAN= 132 6970.3 5945.2 4920.2 4880.4 2507.3 241.3 205.9 170.4 263.0 224.3 185.7
SPAN= 133 7049.6 6012.9 4976.2 4923.2 2527.1 241.9 206.3 170.8 263.6 224.8 186.1
SPAN= 134 7128.8 6080.5 5032.1 4966.0 2547.0 242.5 206.8 171.2 264.1 225.3 186.5
SPAN= 135 7208.2 6148.2 5088.2 5008.8 2566.8 243.0 207.3 171.6 264.7 225.8 186.8
SPAN= 136 7287.7 6216.0 5144.3 5051.5 2586.7 243.6 207.8 172.0 265.2 226.2 187.2
SPAN= 137 7367.0 6283.6 5200.3 5094.2 2606.5 244.1 208.2 172.3 265.7 226.6 187.6
SPAN= 138 7446.3 6351.2 5256.2 5136.9 2626.3 244.6 208.7 172.7 266.2 227.1 187.9
SPAN= 139 7525.5 6418.8 5312.1 5179.5 2646.1 245.2 209.1 173.1 266.7 227.5 188.3
SPAN= 140 7604.6 6486.3 5368.0 5222.1 2665.8 245.7 209.6 173.4 267.2 227.9 188.6
SPAN= 141 7683.7 6553.7 5423.8 5264.7 2685.6 246.2 210.0 173.8 267.7 228.3 189.0
SPAN= 142 7762.7 6621.1 5479.6 5307.3 2705.3 246.7 210.4 174.1 268.1 228.7 189.3
SPAN= 143 7841.6 6688.5 5535.3 5349.8 2725.1 247.1 210.8 174.5 268.6 229.1 189.6
SPAN= 144 7920.5 6755.7 5591.0 5392.3 2744.8 247.6 211.2 174.8 269.0 229.5 189.9
SPAN= 145 7999.3 6823.0 5646.6 5434.7 2766.8 248.1 211.6 175.1 269.5 229.8 190.2

APPENDIX F – CLSABC2U.TXT file used by BridgeOV
F-3
ORBP Reference No. OR10-010 Report No. RC-1589
SPAN= 146 8078.1 6890.1 5702.2 5477.2 2798.1 248.5 212.0 175.5 269.9 230.2 190.5
SPAN= 147 8156.8 6957.3 5757.7 5519.6 2829.6 249.0 212.4 175.8 270.3 230.6 190.8
SPAN= 148 8235.4 7024.3 5813.2 5561.9 2861.2 249.4 212.8 176.1 270.7 230.9 191.1
SPAN= 149 8314.0 7091.3 5868.7 5604.3 2893.0 249.9 213.1 176.4 271.1 231.3 191.4
SPAN= 150 8392.5 7158.3 5924.1 5646.6 2925.0 250.3 213.5 176.7 271.5 231.6 191.7
SPAN= 151 8470.9 7225.2 5979.5 5688.9 2957.1 250.7 213.9 177.0 271.9 231.9 192.0
SPAN= 152 8549.3 7292.1 6034.8 5731.2 2989.4 251.1 214.2 177.3 272.3 232.2 192.2
SPAN= 153 8627.7 7358.9 6090.1 5773.4 3021.9 251.5 214.6 177.6 272.6 232.6 192.5
SPAN= 154 8705.9 7425.7 6145.4 5815.6 3054.5 251.9 214.9 177.9 273.0 232.9 192.7
SPAN= 155 8784.2 7492.4 6200.6 5857.8 3087.3 252.3 215.2 178.1 273.4 233.2 193.0
SPAN= 156 8862.3 7559.1 6255.8 5900.0 3120.2 252.7 215.6 178.4 273.7 233.5 193.2
SPAN= 157 8940.4 7625.7 6310.9 5942.1 3153.3 253.1 215.9 178.7 274.0 233.8 193.5
SPAN= 158 9018.5 7692.3 6366.0 5984.2 3186.6 253.5 216.2 179.0 274.4 234.0 193.7
SPAN= 159 9096.5 7758.8 6421.1 6026.3 3220.0 253.8 216.5 179.2 274.7 234.3 193.9
SPAN= 160 9174.4 7825.3 6476.1 6068.4 3253.6 254.2 216.8 179.5 275.0 234.6 194.2
SPAN= 161 9252.3 7891.7 6531.1 6110.4 3287.4 254.6 217.1 179.7 275.3 234.9 194.4
SPAN= 162 9330.2 7958.1 6586.0 6152.4 3321.3 254.9 217.4 180.0 275.6 235.1 194.6
SPAN= 163 9408.0 8024.5 6641.0 6194.4 3355.4 255.3 217.7 180.2 275.9 235.4 194.8
SPAN= 164 9485.7 8090.8 6695.8 6236.3 3389.6 255.6 218.0 180.5 276.2 235.6 195.0
SPAN= 165 9563.4 8157.0 6750.7 6278.3 3424.0 255.9 218.3 180.7 276.5 235.9 195.2
SPAN= 166 9641.0 8223.3 6805.5 6320.2 3458.6 256.3 218.6 180.9 276.8 236.1 195.4
SPAN= 167 9718.6 8289.4 6860.2 6362.1 3493.3 256.6 218.9 181.2 277.1 236.4 195.6
SPAN= 168 9796.2 8355.6 6915.0 6404.0 3528.2 256.9 219.2 181.4 277.4 236.6 195.8
SPAN= 169 9873.7 8421.7 6969.7 6445.8 3563.3 257.2 219.4 181.6 277.6 236.8 196.0
SPAN= 170 9951.1 8487.7 7024.3 6487.6 3598.5 257.5 219.7 181.8 277.9 237.1 196.2
SPAN= 171 10028.5 8553.7 7079.0 6529.4 3633.9 257.9 219.9 182.0 278.2 237.3 196.4
SPAN= 172 10105.9 8619.7 7133.6 6571.2 3669.5 258.2 220.2 182.3 278.4 237.5 196.6
SPAN= 173 10183.3 8685.7 7188.2 6613.0 3705.2 258.4 220.5 182.5 278.7 237.7 196.7
SPAN= 174 10260.7 8751.8 7242.9 6654.7 3741.0 258.7 220.7 182.7 278.9 237.9 196.9
SPAN= 175 10338.2 8817.9 7297.6 6696.4 3777.1 259.0 221.0 182.9 279.2 238.1 197.1
SPAN= 176 10415.6 8883.9 7352.2 6738.1 3813.3 259.3 221.2 183.1 279.4 238.3 197.2
SPAN= 177 10492.9 8949.9 7406.8 6779.8 3849.6 259.6 221.4 183.3 279.6 238.5 197.4
SPAN= 178 10570.2 9015.8 7461.4 6821.4 3886.2 259.9 221.7 183.5 279.9 238.7 197.6
SPAN= 179 10647.5 9081.7 7515.9 6863.0 3922.9 260.1 221.9 183.7 280.1 238.9 197.7
SPAN= 180 10724.7 9147.6 7570.4 6904.7 3959.7 260.4 222.1 183.8 280.3 239.1 197.9
SPAN= 181 10801.9 9213.4 7624.9 6946.2 3996.7 260.7 222.4 184.0 280.5 239.3 198.0
SPAN= 182 10879.0 9279.2 7679.3 6987.8 4033.9 260.9 222.6 184.2 280.7 239.5 198.2
SPAN= 183 10956.1 9344.9 7733.8 7029.4 4071.2 261.2 222.8 184.4 280.9 239.6 198.3
SPAN= 184 11033.2 9410.7 7788.1 7070.9 4108.7 261.4 223.0 184.6 281.1 239.8 198.5
SPAN= 185 11110.2 9476.3 7842.5 7112.4 4146.4 261.7 223.2 184.8 281.3 240.0 198.6
SPAN= 186 11187.1 9542.0 7896.8 7153.9 4184.2 261.9 223.4 184.9 281.5 240.1 198.8
SPAN= 187 11264.1 9607.6 7951.1 7195.4 4222.2 262.2 223.6 185.1 281.7 240.3 198.9
SPAN= 188 11340.9 9673.2 8005.4 7236.8 4260.3 262.4 223.8 185.3 281.9 240.5 199.0
SPAN= 189 11417.8 9738.7 8059.6 7278.3 4298.7 262.7 224.0 185.4 282.1 240.6 199.2
SPAN= 190 11494.6 9804.2 8113.9 7319.7 4337.1 262.9 224.2 185.6 282.3 240.8 199.3
SPAN= 191 11571.3 9869.7 8168.0 7361.1 4375.8 263.1 224.4 185.8 282.5 240.9 199.4
SPAN= 192 11648.1 9935.1 8222.2 7402.4 4414.6 263.3 224.6 185.9 282.6 241.1 199.5
SPAN= 193 11724.8 10000.5 8276.3 7443.8 4453.5 263.6 224.8 186.1 282.8 241.2 199.7
SPAN= 194 11801.4 10065.9 8330.4 7485.2 4492.6 263.8 225.0 186.2 283.0 241.4 199.8
SPAN= 195 11878.0 10131.3 8384.5 7526.5 4531.9 264.0 225.2 186.4 283.2 241.5 199.9
SPAN= 196 11954.6 10196.6 8438.6 7567.8 4571.4 264.2 225.4 186.5 283.3 241.7 200.0
SPAN= 197 12031.1 10261.9 8492.6 7609.1 4611.0 264.4 225.6 186.7 283.5 241.8 200.1
SPAN= 198 12107.6 10327.1 8546.6 7650.4 4650.7 264.6 225.7 186.8 283.6 241.9 200.2
SPAN= 199 12184.1 10392.3 8600.6 7691.6 4690.7 264.8 225.9 187.0 283.8 242.1 200.4
SPAN= 200 12260.5 10457.5 8654.5 7732.9 4730.8 265.0 226.1 187.1 283.9 242.2 200.5
SPAN= 201 12336.9 10522.7 8708.4 7732.9 4771.0 265.2 226.2 187.3 284.1 242.3 200.6
SPAN= 202 12413.2 10587.8 8762.3 7732.9 4811.4 265.4 226.4 187.4 284.2 242.5 200.7
SPAN= 203 12489.6 10652.9 8816.2 7732.9 4852.0 265.6 226.6 187.5 284.4 242.6 200.8
SPAN= 204 12565.8 10717.9 8870.0 7732.9 4892.8 265.8 226.7 187.7 284.5 242.7 200.9
SPAN= 205 12642.1 10783.0 8923.9 7732.9 4933.7 266.0 226.9 187.8 284.7 242.8 201.0
SPAN= 206 12718.3 10848.0 8977.7 7732.9 4974.7 266.2 227.1 187.9 284.8 242.9 201.1
SPAN= 207 12794.5 10913.0 9031.4 7732.9 5016.0 266.4 227.2 188.1 285.0 243.1 201.2
SPAN= 208 12870.6 10977.9 9085.2 7732.9 5057.3 266.6 227.4 188.2 285.1 243.2 201.3
SPAN= 209 12946.7 11042.8 9138.9 7732.9 5098.9 266.7 227.5 188.3 285.2 243.3 201.4
SPAN= 210 13022.8 11107.7 9192.6 7732.9 5140.6 266.9 227.7 188.4 285.3 243.4 201.4
SPAN= 211 13098.9 11172.6 9246.3 7732.9 5182.5 267.1 227.8 188.6 285.5 243.5 201.5
SPAN= 212 13174.9 11237.4 9300.0 7732.9 5224.5 267.3 228.0 188.7 285.6 243.6 201.6
SPAN= 213 13250.9 11302.2 9353.6 7732.9 5266.7 267.4 228.1 188.8 285.7 243.7 201.7
SPAN= 214 13326.8 11367.0 9407.2 7732.9 5309.1 267.6 228.3 188.9 285.8 243.8 201.8
SPAN= 215 13402.7 11431.8 9460.8 7732.9 5351.6 267.8 228.4 189.0 286.0 243.9 201.9
SPAN= 216 13478.6 11496.5 9514.4 7732.9 5394.3 267.9 228.6 189.2 286.1 244.0 202.0
SPAN= 217 13554.5 11561.2 9567.9 7732.9 5437.1 268.1 228.7 189.3 286.2 244.1 202.0
SPAN= 218 13630.3 11625.9 9621.4 7732.9 5480.1 268.3 228.8 189.4 286.3 244.2 202.1
SPAN= 219 13706.1 11690.5 9674.9 7732.9 5523.3 268.4 229.0 189.5 286.4 244.3 202.2
SPAN= 220 13781.9 11755.1 9728.4 7732.9 5566.6 268.6 229.1 189.6 286.5 244.4 202.3
SPAN= 221 13857.6 11819.7 9781.9 7732.9 5610.1 268.7 229.2 189.7 286.6 244.5 202.4
SPAN= 222 13933.3 11884.3 9835.3 7732.9 5653.8 268.9 229.4 189.8 286.7 244.6 202.4
SPAN= 223 14009.0 11948.9 9888.7 7732.9 5697.6 269.0 229.5 189.9 286.8 244.7 202.5
SPAN= 224 14084.6 12013.4 9942.1 7732.9 5741.6 269.2 229.6 190.0 286.9 244.8 202.6
SPAN= 225 14160.3 12077.9 9995.5 7732.9 5785.7 269.3 229.7 190.1 287.0 244.8 202.6
SPAN= 226 14235.8 12142.4 10048.9 7732.9 5830.0 269.5 229.9 190.3 287.1 244.9 202.7

APPENDIX F – CLSABC2U.TXT file used by BridgeOV
F-4
ORBP Reference No. OR10-010 Report No. RC-1589
SPAN= 227 14311.4 12206.8 10102.2 7732.9 5874.5 269.6 230.0 190.4 287.2 245.0 202.8
SPAN= 228 14386.9 12271.2 10155.5 7732.9 5919.1 269.8 230.1 190.5 287.3 245.1 202.9
SPAN= 229 14462.4 12335.6 10208.8 7732.9 5963.9 269.9 230.2 190.6 287.4 245.2 202.9
SPAN= 230 14537.9 12400.0 10262.1 7732.9 6008.8 270.0 230.3 190.7 287.5 245.3 203.0
SPAN= 231 14613.4 12464.4 10315.4 7732.9 6053.9 270.2 230.5 190.7 287.6 245.3 203.0
SPAN= 232 14688.8 12528.7 10368.6 7732.9 6099.2 270.3 230.6 190.8 287.7 245.4 203.1
SPAN= 233 14764.2 12593.0 10421.8 7732.9 6144.6 270.5 230.7 190.9 287.8 245.5 203.2
SPAN= 234 14839.6 12657.3 10475.0 7732.9 6190.2 270.6 230.8 191.0 287.9 245.6 203.2
SPAN= 235 14914.9 12721.5 10528.2 7732.9 6236.0 270.7 230.9 191.1 288.0 245.6 203.3
SPAN= 236 14990.2 12785.8 10581.4 7732.9 6281.9 270.8 231.0 191.2 288.0 245.7 203.4
SPAN= 237 15065.5 12850.0 10634.5 7732.9 6328.0 271.0 231.1 191.3 288.1 245.8 203.4
SPAN= 238 15140.8 12914.2 10687.6 7732.9 6374.2 271.1 231.2 191.4 288.2 245.8 203.5
SPAN= 239 15216.0 12978.4 10740.7 7732.9 6420.6 271.2 231.4 191.5 288.3 245.9 203.5
SPAN= 240 15291.2 13042.5 10793.8 7732.9 6467.2 271.3 231.5 191.6 288.4 246.0 203.6
SPAN= 241 15366.4 13106.7 10846.9 7732.9 6513.9 271.5 231.6 191.7 288.4 246.0 203.6
SPAN= 242 15441.6 13170.8 10900.0 7732.9 6560.8 271.6 231.7 191.7 288.5 246.1 203.7
SPAN= 243 15516.9 13235.0 10953.2 7732.9 6607.8 271.7 231.8 191.8 288.6 246.2 203.7
SPAN= 244 15592.2 13299.2 11006.3 7732.9 6655.0 271.8 231.9 191.9 288.7 246.2 203.8
SPAN= 245 15667.4 13363.4 11059.4 7732.9 6702.4 271.9 232.0 192.0 288.7 246.3 203.8
SPAN= 246 15742.7 13427.6 11112.5 7732.9 6749.9 272.1 232.1 192.1 288.8 246.4 203.9
SPAN= 247 15817.9 13491.7 11165.6 7732.9 6797.6 272.2 232.2 192.2 288.9 246.4 203.9
SPAN= 248 15893.0 13555.8 11218.6 7732.9 6845.5 272.3 232.3 192.2 288.9 246.5 204.0
SPAN= 249 15968.2 13619.9 11271.7 7732.9 6893.5 272.4 232.4 192.3 289.0 246.5 204.0
SPAN= 250 16043.3 13684.0 11324.7 7732.9 6941.7 272.5 232.4 192.4 289.1 246.6 204.1

APPENDIX G – BridgeOV-Virtis API
G-1
ORBP Reference No. OR10-010 Report No. RC-1589
Appendix G – BridgeOV-Virtis Application Programming Interface (API) interface
There is a wrapper class in C# that is the interface that MiTRIP would use to invoke
bridge permit applications. A description of the wrapper classes, the input required, and
the output generated are provided in the following sections.
The wrapper class functions, the input required for the functions, and output produced
by the functions are described in the following sections. In order to access these
classes, Virtis must be fully installed on the machine being used. The classes are
available in the
Wrapper class functions
The wrapper class for the Michigan program has three basic functions Start, End, and
ProcessRequest. The sample code show below starts a session and performs a permit
and then ends the session.
Sample Code:
SessionReturnCode retCode = Session.Instance.Start("virtis", "virtis", "Virtis62s");
Session.Instance.ProcessRequest(sInputFileName, sOutputFileName, StatusFileName,
ref sErrorMessages, ref sWarningMessages);
Session.Instance.End();
The Start() and End() function calls can be moved out so that Start is called when the
application starts and End is called when the application exits, and multiple
ProcessPermitRequest function calls could be invoked while the session is active.
A detailed description of these functions along with their passed parameters is provided
in the following sections.
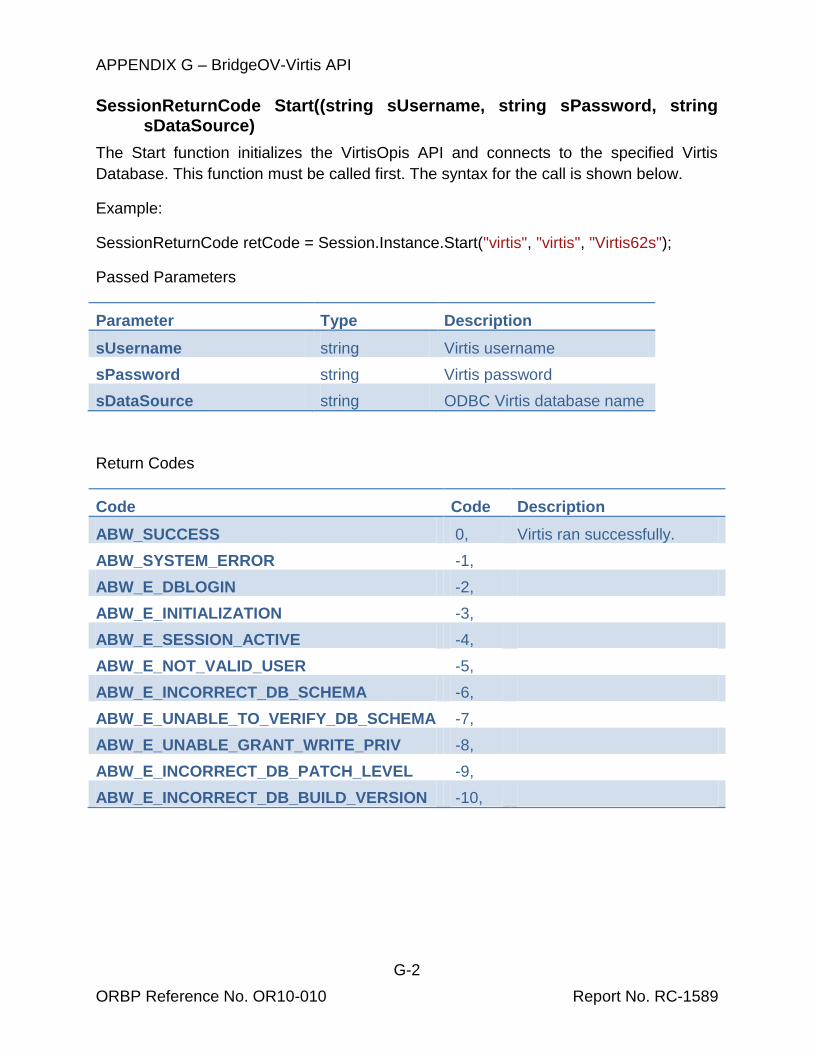
APPENDIX G – BridgeOV-Virtis API
G-2
ORBP Reference No. OR10-010 Report No. RC-1589
SessionReturnCode Start((string sUsername, string sPassword, string sDataSource)
The Start function initializes the VirtisOpis API and connects to the specified Virtis
Database. This function must be called first. The syntax for the call is shown below.
Example:
SessionReturnCode retCode = Session.Instance.Start("virtis", "virtis", "Virtis62s");
Passed Parameters
Parameter Type Description
sUsername string Virtis username
sPassword string Virtis password
sDataSource string ODBC Virtis database name
Return Codes
Code Code Description
ABW_SUCCESS 0, Virtis ran successfully.
ABW_SYSTEM_ERROR -1,
ABW_E_DBLOGIN -2,
ABW_E_INITIALIZATION -3,
ABW_E_SESSION_ACTIVE -4,
ABW_E_NOT_VALID_USER -5,
ABW_E_INCORRECT_DB_SCHEMA -6,
ABW_E_UNABLE_TO_VERIFY_DB_SCHEMA -7,
ABW_E_UNABLE_GRANT_WRITE_PRIV -8,
ABW_E_INCORRECT_DB_PATCH_LEVEL -9,
ABW_E_INCORRECT_DB_BUILD_VERSION -10,

APPENDIX G – BridgeOV-Virtis API
G-3
ORBP Reference No. OR10-010 Report No. RC-1589
bool ProcessRequest(string sInputFileName, string sOutputFileName, string sStatusFileName, ref string sErrorMessages, ref string sWarningMessages, ref object objtextbx)
This function processes a permit request file. The permit request file is an XML file and
is described in detail in a subsequent section. The output of the process is also and
XML file which provides a list of the results for each bridge analyzed for each vehicle.
The output file is described in detail in a later section.
Passed Parameters
Parameter Type Description
sInputFileName string XML input file listing the bridges to be analyzed and the vehicles to use to analyze them. Described in more detail in a later section
sOutputFileName string XML output file listing the results of the Virtis analysis/ BridgeOV run. Described in more detail in later sections
sStatusFileName string XML listing the status of the run. Described in more detail in later sections
sErrorMessages ref string String containing any error messages encountered when running Virtis
sWarningMessages ref string String containing any warning messages encountered when running Virtis
Objtextbx Object If the function is going to return messages while running each bridge, place a Forms.TextBox object in this parameter.
If no messages are to be returned, as would be the case when running from MiTRIP, pass a null for this parameter.

APPENDIX G – BridgeOV-Virtis API
G-4
ORBP Reference No. OR10-010 Report No. RC-1589
Return Codes
Code Description
True Virtis ran successfully.
False Virtis did not run successfully.
API Input File
This section provides a detail description of the API input file that is required to run
BridgeOV/Virtis in the patch mode. This file would be generated by the calling program
and the name/location of the file passed through the API as described in the calls
provided in the previous section.
Sample input file
For the sample application (BridgeOV-Virtis) described in this appendix the API input file
has an *.mdr extension but is in XML format. Below is a sample file.
<?xml version="1.0" encoding="UTF-8"?>
<routing>
<file_version>1.0</file_version>
<permit_application_number>6857asdf </permit_application_number>
<requested_by>John Doe</requested_by>
<application_timestamp>12:42
</application_timestamp>
<structural_analysis_type>Standard</structural_analysis_type>
<min_allowable_rating_factor>1.0</min_allowable_rating_factor>
<max_span_length_factor>1.2</max_span_length_factor >
<route>
<bridge_list>
<!-- Class A - Virtis - S flag -->
<bridge>
<bridge_id>82182023000S270</bridge_id>
<route_id>00006</route_id>
<travel_direction>0</travel_direction>
<abcd_category>A</abcd_category>
<r_or_s_flag>S</r_or_s_flag>
<nbi_max_span_length>69.69</nbi_max_span_length>
</bridge>
<!-- Class B - Virtis - S flag -->
<bridge>
<bridge_id>82182023000S270</bridge_id>
<route_id>00006</route_id>
<travel_direction>0</travel_direction>
<abcd_category>B</abcd_category>
<r_or_s_flag>S</r_or_s_flag>
<nbi_max_span_length>69.69</nbi_max_span_length>
</bridge>
<!-- Class F - BridgeOV - S flag - Short 5' span -->
<bridge>
<bridge_id>82182023000S270</bridge_id>
<route_id>00006</route_id>
<travel_direction>0</travel_direction>
<abcd_category>F</abcd_category>
<r_or_s_flag>S</r_or_s_flag>
<nbi_max_span_length>5</nbi_max_span_length>
</bridge>
<!-- Class G - BridgeOV - S flag - Short 5' span -->
<bridge>

APPENDIX G – BridgeOV-Virtis API
G-5
ORBP Reference No. OR10-010 Report No. RC-1589
<bridge_id>82182023000S270</bridge_id>
<route_id>00006</route_id>
<travel_direction>0</travel_direction>
<abcd_category>G</abcd_category>
<r_or_s_flag>S</r_or_s_flag>
<nbi_max_span_length>85</nbi_max_span_length>
</bridge>
<!-- Class C - Virtis - R flag -->
<bridge>
<bridge_id>junk bridge C</bridge_id>
<route_id>00006</route_id>
<travel_direction>0</travel_direction>
<abcd_category>C</abcd_category>
<r_or_s_flag>R</r_or_s_flag>
<nbi_max_span_length>69.69</nbi_max_span_length>
</bridge>
<!-- Class X - invalid Class -->
<bridge>
<bridge_id>junk bridge C</bridge_id>
<route_id>00006</route_id>
<travel_direction>0</travel_direction>
<abcd_category>X</abcd_category>
<r_or_s_flag>R</r_or_s_flag>
<nbi_max_span_length>69.69</nbi_max_span_length>
</bridge>
<!-- Incomplete bridge in database - Should run sucessfully in BridgeOV -->
<bridge>
<bridge_id>MDOT-Failed</bridge_id>
<route_id>00006</route_id>
<travel_direction>0</travel_direction>
<abcd_category>A</abcd_category>
<r_or_s_flag>R</r_or_s_flag>
<nbi_max_span_length>69.69</nbi_max_span_length>
</bridge>
</bridge_list>
</route>
<routing_vehicle_list>
<vehicle_description>
<name>Test Vehicle</name>
<controlling_rating_level>Operating</controlling_rating_level>
<single_lane_ind>FALSE</single_lane_ind>
<impact>1.00</impact>
<units>
<weight_unit>kip</weight_unit>
<wheel_contact_width_unit>inch</wheel_contact_width_unit>
<axle_spacing_unit>foot</axle_spacing_unit>
</units>
<axle_list>
<axle_description>
<weight>8.000</weight>
<wheel_contact_width>20.000</wheel_contact_width>
<gage_distance>8.0</gage_distance>
</axle_description>
<axle_description>
<weight>32.000</weight>
<wheel_contact_width>20.000</wheel_contact_width>
<axle_spacing>14.000</axle_spacing>
<gage_distance>10.0</gage_distance>
</axle_description>
<axle_description>
<weight>39.000</weight>
<wheel_contact_width>20.000</wheel_contact_width>
<axle_spacing>14</axle_spacing>
<gage_distance>9.0</gage_distance>
</axle_description>
</axle_list>
</vehicle_description>
</routing_vehicle_list>
</routing>

APPENDIX G – BridgeOV-Virtis API
G-6
ORBP Reference No. OR10-010 Report No. RC-1589
Input File Format
The permit request file format has a similar format as Virtis application’s routing request
file format. It is an XML file conforming to the following specifications. It is assumed that
the user has an understanding of XML syntax so an explanation of XML is not provided
here. Descriptions of individual wheels composing of an axle are only supported for
non-standard gage vehicle.
XML Tag Description
<routing> Indicates the beginning of the routing information
<file_version> Indicates the version of the routing request file.
Should be 1.0.
<permit_application_number> Permit application number for tracking purposes
<requested_by> Name of person submitting the routing request
file
<application_timestamp> Time that the routing request file was created
<structural_analysis_type> Type of structural analysis. Should be either
"StandardGage" or "NonStandardGage".
<min_allowable_rating_factor> Minimum allowable rating factor.
Default is 1.00.
<max_span_length_factor> This value is multiplied by the
nbi_max_span_length factor to set the upper limit
of span length for BridgeOV runs.
<comment> Indicates start of comments

APPENDIX G – BridgeOV-Virtis API
G-7
ORBP Reference No. OR10-010 Report No. RC-1589
XML Tag Description
<route> Indicates start of route
<bridge_list> Indicates start of list of bridges on route
<bridge> Indicates start of data for a bridge on the route
<bridge_id> Agency bridge ID
<route_id> Route ID
<travel_direction> Travel Direction. Default value is 0.
-1/down/down milepost = Down Milepost
1/up/up milepost = Up Milepost
0 = Not Specified

APPENDIX G – BridgeOV-Virtis API
G-8
ORBP Reference No. OR10-010 Report No. RC-1589
XML Tag Description
<abcd_cateogry> This item is specific to Michigan DOT. This is the
MDOT specific NBI code Item 193 Overload
class.
The item can have the following options:
A – Run BridgeOV always (i.e. don’t try to run
Virtis). Use Class A
B – Run BridgeOV always (i.e. don’t try to run
Virtis) Use Class B.
C – Run BridgeOV always (i.e. don’t try to run
Virtis) Use Class C.
D - Fail
F – Run Virtis. If bridge not present in Virtis run
BridgeOV with Class A.
G – Run Virtis. If bridge not present in Virtis run
BridgeOV with Class B.
H – Run Virtis. If bridge not present in Virtis run
BridgeOV with Class C.
<r_or_s_flag> This can be any of the following:
R – If running BridgeOV use the standard 8’ axle
width (i.e. no factoring the axle loads).
Blank – Use the actual gage with axle loads that
were reduced (increased) to account for gage
width. In this case each axle load is divided by
(gage width + 8’)/16.0
This is from the original BridgeOV program.
S – If the bridge is a Class B or C and any axle
exceeds 38,000 pounds, fail the bridge

APPENDIX G – BridgeOV-Virtis API
G-9
ORBP Reference No. OR10-010 Report No. RC-1589
XML Tag Description
<nbi_max_span_length> If the bridge is analyzed using BridgeOV, use the
maximum span length * max_span_length_factor
as the upper span length limit for BridgeOV
<routing_vehicle_list> Indicates start of list of vehicles for analysis
<vehicle_description> Indicates start of data for a vehicle
<adjacent_lane_vehicle_description> Indicates start of data for a adjacent lane vehicle
<name> Name of vehicle
<vehicle_gage_type> Type of vehicle gage. Should be either
"StandardGage" or "NonStandardGage".
<controlling_rating_level> Indicates rating factor to be checked to
determine pass or fail status of rating. Should be
either "Inventory" or "Operating".
<single_lane_ind> Indicates if single lane distribution factors should
be used in analysis. Should be either "TRUE" or
"FALSE".
<bov_lfr_lrfr> Enter ‘LFR’ or ‘LRFR’ to set the method to run
BridgeOV. This value is not used by Virtis.
<impact> User defined impact value for the vehicle.
<units> Indicates start of list of units for the vehicle
<weight_unit> Unit for the axle or wheel weight. Should be "kip",
"pound", "kilonewton", or "newton".
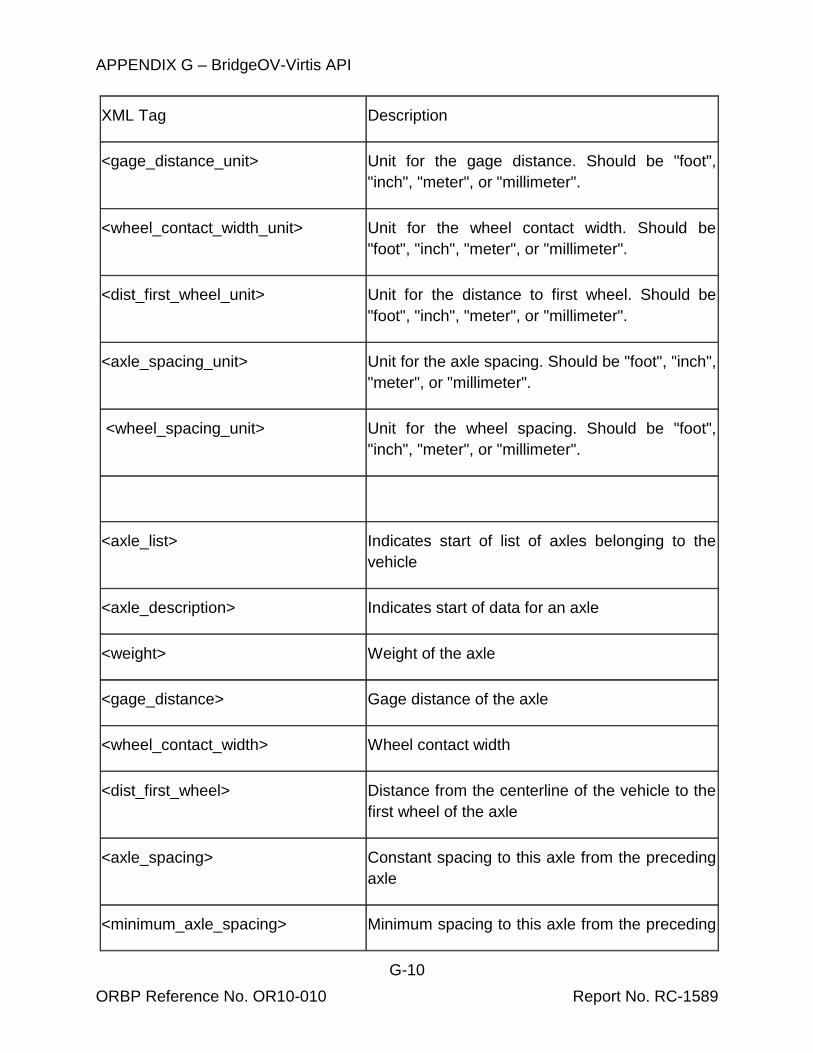
APPENDIX G – BridgeOV-Virtis API
G-10
ORBP Reference No. OR10-010 Report No. RC-1589
XML Tag Description
<gage_distance_unit> Unit for the gage distance. Should be "foot",
"inch", "meter", or "millimeter".
<wheel_contact_width_unit> Unit for the wheel contact width. Should be
"foot", "inch", "meter", or "millimeter".
<dist_first_wheel_unit> Unit for the distance to first wheel. Should be
"foot", "inch", "meter", or "millimeter".
<axle_spacing_unit> Unit for the axle spacing. Should be "foot", "inch",
"meter", or "millimeter".
<wheel_spacing_unit> Unit for the wheel spacing. Should be "foot",
"inch", "meter", or "millimeter".
<axle_list> Indicates start of list of axles belonging to the
vehicle
<axle_description> Indicates start of data for an axle
<weight> Weight of the axle
<gage_distance> Gage distance of the axle
<wheel_contact_width> Wheel contact width
<dist_first_wheel> Distance from the centerline of the vehicle to the
first wheel of the axle
<axle_spacing> Constant spacing to this axle from the preceding
axle
<minimum_axle_spacing> Minimum spacing to this axle from the preceding

APPENDIX G – BridgeOV-Virtis API
G-11
ORBP Reference No. OR10-010 Report No. RC-1589
XML Tag Description
axle. Not required if constant axle spacing was
specified.
<maximum_axle_spacing> Maximum spacing to this axle from the preceding
axle. Not required if constant axle spacing was
specified.
<wheel_list> Indicates start of list of wheels belonging to the
axle
<wheel_description> Indicates start of data for a wheel
<weight> Weight of the wheel
<wheel_contact_width> Wheel contact width
<wheel_spacing> Spacing to this wheel from the preceding wheel
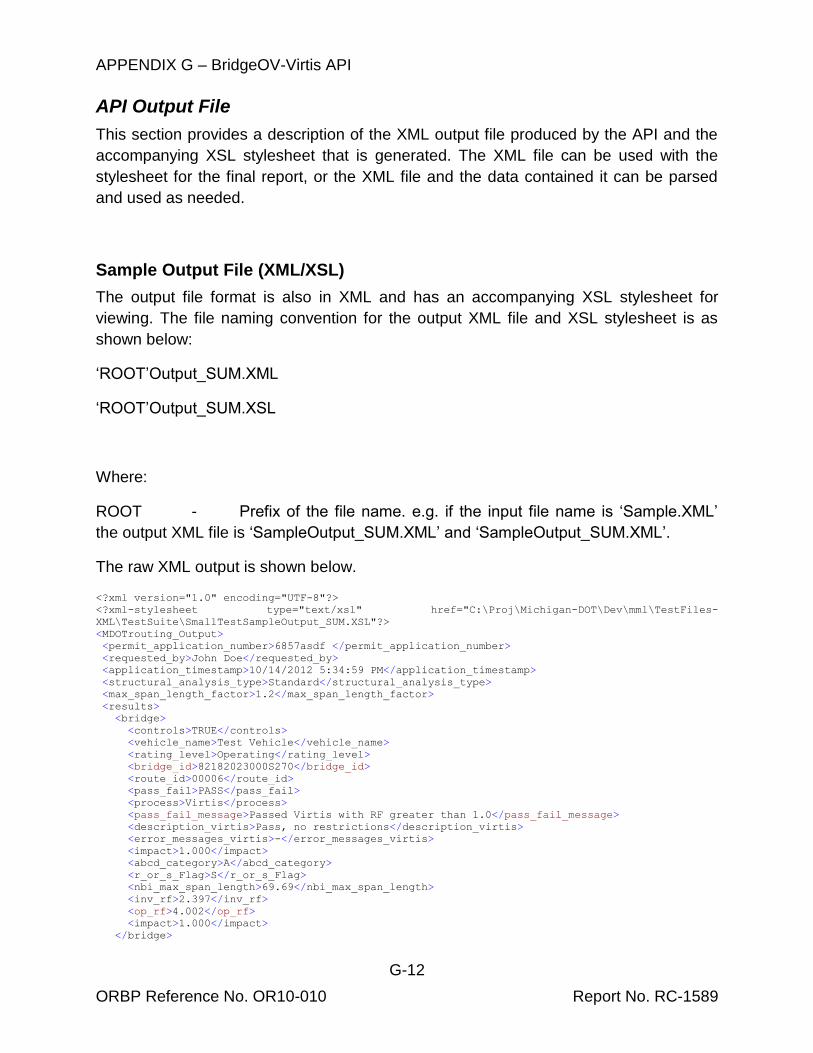
APPENDIX G – BridgeOV-Virtis API
G-12
ORBP Reference No. OR10-010 Report No. RC-1589
API Output File
This section provides a description of the XML output file produced by the API and the
accompanying XSL stylesheet that is generated. The XML file can be used with the
stylesheet for the final report, or the XML file and the data contained it can be parsed
and used as needed.
Sample Output File (XML/XSL)
The output file format is also in XML and has an accompanying XSL stylesheet for
viewing. The file naming convention for the output XML file and XSL stylesheet is as
shown below:
‘ROOT’Output_SUM.XML
‘ROOT’Output_SUM.XSL
Where:
ROOT - Prefix of the file name. e.g. if the input file name is ‘Sample.XML’
the output XML file is ‘SampleOutput_SUM.XML’ and ‘SampleOutput_SUM.XML’.
The raw XML output is shown below.
<?xml version="1.0" encoding="UTF-8"?>
<?xml-stylesheet type="text/xsl" href="C:\Proj\Michigan-DOT\Dev\mml\TestFiles-
XML\TestSuite\SmallTestSampleOutput_SUM.XSL"?>
<MDOTrouting_Output>
<permit_application_number>6857asdf </permit_application_number>
<requested_by>John Doe</requested_by>
<application_timestamp>10/14/2012 5:34:59 PM</application_timestamp>
<structural_analysis_type>Standard</structural_analysis_type>
<max_span_length_factor>1.2</max_span_length_factor>
<results>
<bridge>
<controls>TRUE</controls>
<vehicle_name>Test Vehicle</vehicle_name>
<rating_level>Operating</rating_level>
<bridge_id>82182023000S270</bridge_id>
<route_id>00006</route_id>
<pass_fail>PASS</pass_fail>
<process>Virtis</process>
<pass_fail_message>Passed Virtis with RF greater than 1.0</pass_fail_message>
<description_virtis>Pass, no restrictions</description_virtis>
<error_messages_virtis>-</error_messages_virtis>
<impact>1.000</impact>
<abcd_category>A</abcd_category>
<r_or_s_Flag>S</r_or_s_Flag>
<nbi_max_span_length>69.69</nbi_max_span_length>
<inv_rf>2.397</inv_rf>
<op_rf>4.002</op_rf>
<impact>1.000</impact>
</bridge>

APPENDIX G – BridgeOV-Virtis API
G-13
ORBP Reference No. OR10-010 Report No. RC-1589
<bridge>
<controls>TRUE</controls>
<vehicle_name>Test Vehicle</vehicle_name>
<rating_level>-</rating_level>
<bridge_id>82182023000S270</bridge_id>
<route_id>00006</route_id>
<pass_fail>FAILED</pass_fail>
<process>S-Flag</process>
<pass_fail_message>One axle is greater than 38 kip</pass_fail_message>
<description_virtis>-</description_virtis>
<error_messages_virtis>Failed S-Flag</error_messages_virtis>
<impact>-</impact>
<abcd_category>B</abcd_category>
<r_or_s_Flag>S</r_or_s_Flag>
<nbi_max_span_length>69.69</nbi_max_span_length>
<inv_rf>-</inv_rf>
<op_rf>-</op_rf>
<impact>-</impact>
</bridge>
<bridge>
<controls>TRUE</controls>
<vehicle_name>Test Vehicle</vehicle_name>
<rating_level>-</rating_level>
<bridge_id>82182023000S270</bridge_id>
<route_id>00006</route_id>
<pass_fail>PASS</pass_fail>
<process>BridgeOV</process>
<pass_fail_message>Passed BridgeOV for Category A</pass_fail_message>
<description_virtis>-</description_virtis>
<error_messages_virtis>-</error_messages_virtis>
<impact>-</impact>
<abcd_category>F</abcd_category>
<r_or_s_Flag>S</r_or_s_Flag>
<nbi_max_span_length>50</nbi_max_span_length>
<inv_rf>-</inv_rf>
<op_rf>-</op_rf>
<impact>-</impact>
</bridge>
<bridge>
<controls>TRUE</controls>
<vehicle_name>Test Vehicle</vehicle_name>
<rating_level>-</rating_level>
<bridge_id>82182023000S270</bridge_id>
<route_id>00006</route_id>
<pass_fail>FAILED</pass_fail>
<process>S-Flag</process>
<pass_fail_message>One axle is greater than 38 kip</pass_fail_message>
<description_virtis>-</description_virtis>
<error_messages_virtis>Failed S-Flag</error_messages_virtis>
<impact>-</impact>
<abcd_category>G</abcd_category>
<r_or_s_Flag>S</r_or_s_Flag>
<nbi_max_span_length>85</nbi_max_span_length>
<inv_rf>-</inv_rf>
<op_rf>-</op_rf>
<impact>-</impact>
</bridge>
<bridge>
<controls>TRUE</controls>
<vehicle_name>Test Vehicle</vehicle_name>
<rating_level>-</rating_level>
<bridge_id>junk bridge C</bridge_id>
<route_id>00006</route_id>
<pass_fail>PASS</pass_fail>
<process>BridgeOV</process>
<pass_fail_message>Passed BridgeOV for Category C</pass_fail_message>
<description_virtis>-</description_virtis>
<error_messages_virtis>-</error_messages_virtis>
<impact>-</impact>
<abcd_category>C</abcd_category>
<r_or_s_Flag>R</r_or_s_Flag>

APPENDIX G – BridgeOV-Virtis API
G-14
ORBP Reference No. OR10-010 Report No. RC-1589
<nbi_max_span_length>69.69</nbi_max_span_length>
<inv_rf>-</inv_rf>
<op_rf>-</op_rf>
<impact>-</impact>
</bridge>
<bridge>
<controls>-</controls>
<vehicle_name>
</vehicle_name>
<rating_level>-</rating_level>
<bridge_id>junk bridge C</bridge_id>
<route_id>00006</route_id>
<pass_fail>ERROR</pass_fail>
<process>BridgeOV</process>
<pass_fail_message>Invalid Category: X
: Must be A,B,C,D,F,G, or H</pass_fail_message>
<description_virtis>-</description_virtis>
<error_messages_virtis>-</error_messages_virtis>
<impact>-</impact>
<abcd_category>X</abcd_category>
<r_or_s_Flag>R</r_or_s_Flag>
<nbi_max_span_length>69.69</nbi_max_span_length>
<inv_rf>-</inv_rf>
<op_rf>-</op_rf>
<impact>-</impact>
</bridge>
<bridge>
<controls>TRUE</controls>
<vehicle_name>Test Vehicle</vehicle_name>
<rating_level>-</rating_level>
<bridge_id>MDOT-Failed</bridge_id>
<route_id>00006</route_id>
<pass_fail>PASS</pass_fail>
<process>BridgeOV</process>
<pass_fail_message>Passed BridgeOV for Category A</pass_fail_message>
<description_virtis>-</description_virtis>
<error_messages_virtis>-</error_messages_virtis>
<impact>-</impact>
<abcd_category>A</abcd_category>
<r_or_s_Flag>R</r_or_s_Flag>
<nbi_max_span_length>69.69</nbi_max_span_length>
<inv_rf>-</inv_rf>
<op_rf>-</op_rf>
<impact>-</impact>
</bridge>
</results>
</MDOTrouting_Output>

APPENDIX G – BridgeOV-Virtis API
G-15
ORBP Reference No. OR10-010 Report No. RC-1589
The XSL style sheet for this example is shown below:
<xsl:stylesheet version="1.0" xmlns:xsl="http://www.w3.org/1999/XSL/Transform"
xmlns:xs="http://www.w3.org/2001/XMLSchema">
<xsl:template match="/">
<HTML>
<HEAD>
<TITLE>
<xsl:for-each select="MDOTrouting_Output">
<xsl:value-of select="permit_application_number"/>:
<xsl:value-of select="application_timestamp"/>
<xsl:value-of select="requested_by"/>
<xsl:value-of select="max_span_length_factor"/>
</xsl:for-each> <!--routing_output-->
</TITLE>
</HEAD>
<BODY>
<H4>
<xsl:for-each select="MDOTrouting_Output">
<p> Permit Application Number: <xsl:value-of select="permit_application_number"/> </p>
<p> Application Date: <xsl:value-of select="application_timestamp"/> </p>
<p> Requested By: <xsl:value-of select="requested_by"/> </p>
<p> <RIGHT>Process Date: <xsl:value-of select="process_timestamp"/> </RIGHT> </p>
<p> <RIGHT>Maximum Span Length Factor: <xsl:value-of select="max_span_length_factor"/>
</RIGHT> </p>
</xsl:for-each>
</H4>
<xsl:for-each select="MDOTrouting_Output">
<xsl:for-each select="results">
<CAPTION><LEFT><BR/><BR/><B>ROUTING RESULTS OUTPUT</B></LEFT></CAPTION>
<TABLE BORDER="2">
<THEAD>
<TR>
<TH WIDTH="180">Vehicle</TH>
<TH WIDTH="180">Rating Level</TH>
<TH WIDTH="180">Bridge ID</TH>
<TH WIDTH="100">Route ID</TH>
<TH WIDTH="100">PASS-FAIL</TH>
<TH WIDTH="100">Process</TH>
<TH WIDTH="100">PASS-FAIL Message</TH>
<TH WIDTH="100">Description</TH>
<TH WIDTH="100">Additional Message</TH>
<TH WIDTH="100">Conditions</TH>
<TH WIDTH="80">Impact</TH>
<TH WIDTH="80">A,B,C,D Category</TH>
<TH WIDTH="200">R or S Flag</TH>
<TH WIDTH="100">NBI Max Span Length</TH>
<TH WIDTH="100">Inventory RF</TH>
<TH WIDTH="100">Operating RF</TH>
</TR>
</THEAD>
<TBODY>
<xsl:for-each select="bridge">
<TR>
<TD ALIGN="center" VALIGN="top"><xsl:value-of select="vehicle_name"/></TD>
<TD ALIGN="center" VALIGN="top"><xsl:value-of select="rating_level"/></TD>
<TD ALIGN="center" VALIGN="top"><xsl:value-of select="bridge_id"/></TD>
<TD ALIGN="center" VALIGN="top"><xsl:value-of select="route_id"/></TD>
<xsl:for-each select="pass_fail">
<xsl:choose>
<xsl:when test="text() = 'PASS'">
<TD ALIGN="center" VALIGN="top" style="color:blue">
<xsl:value-of select="text()"/></TD>
</xsl:when>
<xsl:when test="text() = 'FAILED'">
<TD ALIGN="center" VALIGN="top" style="color:red">
<xsl:value-of select="text()"/></TD>
</xsl:when>
<xsl:when test="text() = 'ERROR'">

APPENDIX G – BridgeOV-Virtis API
G-16
ORBP Reference No. OR10-010 Report No. RC-1589
<TD ALIGN="center" VALIGN="top" style="color:red">
<xsl:value-of select="text()"/></TD>
</xsl:when>
<xsl:otherwise>
<TD ALIGN="center" VALIGN="top" style="color:green">
<xsl:value-of select="text()"/></TD>
</xsl:otherwise>
</xsl:choose>
</xsl:for-each>
<TD ALIGN="center" VALIGN="top"><xsl:value-of select="process"/></TD>
<TD ALIGN="center" VALIGN="top"><xsl:value-of select="pass_fail_message"/></TD>
<TD ALIGN="center" VALIGN="top"><xsl:value-of select="description_virtis"/></TD>
<TD ALIGN="center" VALIGN="top"><xsl:value-of select="error_messages_virtis"/></TD>
<TD ALIGN="center" VALIGN="top">
<TABLE>
<xsl:for-each select="conditional_pass/condition">
<TR>
<TD ALIGN="left">
<xsl:if test="text() = 10">
<xsl:value-of select="text()"/> - Truck speed restriction to 5 mph</xsl:if>
<xsl:if test="text() = 11">
<xsl:value-of select="text()"/> - Bridge restricted to all other vehicles</xsl:if>
</TD>
</TR>
</xsl:for-each> <!--conditional_pass/condition-->
</TABLE>
</TD>
<TD ALIGN="center" VALIGN="top"><xsl:value-of select="impact"/></TD>
<TD ALIGN="center" VALIGN="top"><xsl:value-of select="abcd_category"/></TD>
<TD ALIGN="center" VALIGN="top"><xsl:value-of select="r_or_s_Flag"/></TD>
<TD ALIGN="center" VALIGN="top"><xsl:value-of select="nbi_max_span_length"/></TD>
<TD ALIGN="center" VALIGN="top"><xsl:value-of select="inv_rf"/></TD>
<TD ALIGN="center" VALIGN="top"><xsl:value-of select="op_rf"/></TD>
</TR>
</xsl:for-each>
</TBODY>
</TABLE>
</xsl:for-each> <!--results-->
</xsl:for-each> <!--routing_output-->
</BODY>
</HTML>
</xsl:template>
</xsl:stylesheet>

APPENDIX G – BridgeOV-Virtis API
G-17
ORBP Reference No. OR10-010 Report No. RC-1589
The browser view of the XML file with the XSL style sheet is shown below:

APPENDIX G – BridgeOV-Virtis API
G-18
ORBP Reference No. OR10-010 Report No. RC-1589
Output File Format
The following table provides a description for the XML output file produced by
BridgeOV-Virtis.
XML Tag Description
<MDOTrouting_Output> Indicates the beginning of the routing information
<file_version> Indicates the version of the routing request file. Should be 1.0.
<permit_application_number> Permit application number for tracking purposes
<requested_by> Name of person submitting the routing request file
<application_timestamp> Time that the routing request file was created
<structural_analysis_type> This can be either ‘Standard’ or ‘Nonstandard’. ‘Nonstandard’ is for non-standard gage analysis in Virtis.
<max_span_length_factor> This value is an echo of the value provided in the input
<results> Indicates start of list of results for each bridge.
<bridge> Indicates start of data for a bridge on the route
<controls> Set to TRUE if this version of the bridge run controls. Note: some bridges may have multiple results or <bridge> nodes since Virtis will analyze for different scenarios.
<vehicle_name> Vehicle name as provided in the input.
<rating_level> Rating level to govern as provided in the user input. Can be either ‘Inventory’ or ‘Operating’
<bridge_id> Bridge ID as provided in the user input.
<route_id> Route ID as provided in the user input
<pass_fail> Field indicating one of the following: ‘PASS’ – vehicle passes this bridge ‘PASS-(Conditional)’ – Passes Virtis but with some conditions that are displayed in the <conditional_pass>-<condition> tags. ‘FAILED’ – bridge did not pass ‘ERROR’ – some type of error has occurred. See error message column for details.

APPENDIX G – BridgeOV-Virtis API
G-19
ORBP Reference No. OR10-010 Report No. RC-1589
XML Tag Description
<process> Lists the process used to analyze the bridge. The choices are: ‘Virtis’ – results are from Virtis ‘BridgeOV’ –results are from BridgeOV ‘S-Flag’ – bridge failed using the 38 kip axle check.
<pass_fail_message> A description field providing more information on the PASS/FAIL message.
<error_messages_virtis> Any error messages produced by Virtis are provided here.
<conditional_pass>
<condition> Multiple ‘condition’ tags may be listed. The options for conditional passing may be: 10 - Truck speed restriction to 5 mph 11 - Bridge restricted to all other vehicles
<impact> The controlling impact factor
<abcd_category> ABCD class as provided in the input.
<r_or_s_Flag> R or S flag as provided in the input
<nbi_max_span_length> The maximum structure span length as provided in the input
<inv_rf> Inventory rating factor as provided by Virtis. If this bridge was not in the Virtis database or was not able to be analyzed in Virits, the value will be a ‘-‘.
<op_rf> Operating rating factor as provided by Virtis. If this bridge was not in the Virtis database or was not able to be analyzed in Virits, the value will be a ‘-‘.

APPENDIX G – BridgeOV-Virtis API
G-20
ORBP Reference No. OR10-010 Report No. RC-1589
Auxiliary Files
In addition to the API input and output files, the BridgeOV-Virtis process creates several
auxiliary files. These files are used interface. For all files the ‘Root’ represents the main
part of the initial input file. For example if the input routing file is named:
SmallTestSample.mdr
The prefix or ‘SmallTestSample’ is considered the ‘Root’. Using this definition, the
auxiliary files produced by the process are defined in the following table.
File name Description
‘Root’.mdr Initial input file. Created by the user or process that call BridgeOV-Virtis
‘Root’Output_SUM.XML Main output summary file in XML. This file would be used as the final output file for MiTRIP
‘Root’Output_SUM.XSL The accompanying style sheet for the formatting the ‘Root’Output_SUM.XML file. This style sheet can be used to display the XML output file or the file can be parsed directly and the results presented in another form within MiTRIP.
‘Root’-XXX-‘BridgeID’.XMI Individual Bridge input file for running Virtis. Each bridge ID in the routing list is run individually through Virtis if applicable. Each ‘BridgeID’ has its own input file created that is fed into Virtis.
The ‘XXX’ in the file name represents a sequential number for the BridgeID.
Note: This file will only be generated if an attempt is made to run Virtis. E.g. if this is a class B or C bridge with an ‘S’ flag and one of the vehicle axles is over 38 kips, there is no need to run Virtis, so the input file is not generated. See the system flow chart if Figure 79 and Figure 80 for more details.
‘Root’Output-XXX-‘BridgeID’.XML
‘Root’Output-XXX-‘BridgeID’.XSL
‘Root’Output-XXX-‘BridgeID’.XMS
Individual Bridge input file for running Virtis. Each bridge ID in the routing list is run individually through Virtis if applicable. Each ‘BridgeID’ has its own output XML file created by Virtis and an accompanying XSL stylesheet for viewing the output file.
Also available is an XMS file. This is a status file with some information on when the bridge was

APPENDIX G – BridgeOV-Virtis API
G-21
ORBP Reference No. OR10-010 Report No. RC-1589
run (including a start and end time).
The ‘XXX’ in the file name represents a sequential number for the BridgeID.
Note: This file will only be generated if an attempt is made to run Virtis. E.g. if this is a class B or C bridge with an ‘S’ flag and one of the vehicle axles is over 38 kips, there is no need to run Virtis, so the input file is not generated. See the system flow chart if Figure 79 and Figure 80 for more details.
‘Root’-STD-‘VehicleID’.txt
‘Root’-STD-‘VehicleID’.out
BridgeOV input (.txt) and output (.out) files for the standard 8’ gage vehicle. These files contain the input into BridgeOV and the output produced by BridgeOV. Since multiple vehicles may be run for the same bridge list, the ‘VehicleID’ is the vehicle description provided in the input XML file.
For a description on the BridgeOV input and output see Sections 10.3.3 and 10.3.4 of this manual.
‘Root’-ACT-‘VehicleID’.txt
‘Root’-ACT-‘VehicleID’.out
BridgeOV input (.txt) and output (.out) files for the actual gages input for the vehicle. These files contain the input into BridgeOV and the output produced by BridgeOV. Since multiple vehicles may be run for the same bridge list, the ‘VehicleID’ is the vehicle description provided in the input XML file.
For a description on the BridgeOV input and output see sections 10.3.3 and 10.3.4 of this manual.
APPENDIX G – BridgeOV-Virtis API
G-22
ORBP Reference No. OR10-010 Report No. RC-1589
This page intentionally left blank

APPENDIX H – Weigh-in-Motion (WIM) file format
H-1
ORBP Reference No. OR10-010 Report No. RC-1589
Appendix H – Weigh-in-Motion – (WIM) file format
The following format is for WIM files for MDOT. These WIM files can be read in as an
alternate file format in the Permit Vehicle Analyzer (PVA) program.
Each vehicle record will be 112 characters long.
Description Value/comments Columns
Record type Always ‘W’ 0
State Code Always ‘26’ for Michigan 1-2
County Code 2 digit 3-4
Site ID 4 digit 5-8
Direction code
1 digit – 1 1 north, 2 NE, 3 East, 4 SE, 5 South, 6 SW, 7 West, 8 NW.
9
Lane number 1 digit right lane for any direction is always 1 then next lane 2 etc...
10
Year 2 digit 11-12
Month 2 digit 13-14
Day 2 digit 15-16
Hour 2 digit 01-24 (e.g. midnit to 1 AM – 00)
17-18
Vehicle class 2 digit – Standard FHWA 13 class scheme
19-20
Speed 3 digit 21-23
Gross weight 4 digit 24-27
Number of axles
2 digit 28-29
Axle wgts spacings
75 digit – Ax 1 wgt, ax(1-2) spcg, Ax2 wght, Ax(2-3) spcg, Ax3 wgt …. Ax (n-1) wgt, Ax (n-1)-n spcg, Ax n wgt
30-104
Minute 2 digit 105-106
Second 2 digit 107-108
Millisecond 3 digit 109-111
The 4 digit gross weight, the 3 digit weight and the 3 digit spacings are set up with a single place decimal implied. So a weight of 104 would equate to 10.4 kips or 10,400 lbs. A spacing of 434 would be 43.4 ft. A 4 digit gross weight of 1057 would equate to 105.7 kips or 105,700 lbs.
APPENDIX H – Weigh-in-Motion (WIM) file format
H-2
ORBP Reference No. OR10-010 Report No. RC-1589
This page intentionally left blank