rced-88-155fs flood insurance: statistics on the national ... · federal emergency management...
TRANSCRIPT
.
United bates General ACCOM~~~ Office .
Fact Sheet for Congressional Requesters .
April 1988 FLOOD INSURANCE Statistics on the National Flood Insurance Program


United States GAO---- General Accounting Office Washington, D.C. 20548
Resources, Community, and Economic Development Division
B-226596
Apri129, 1988
The Honorable Walter B. Jones Chairman, Committee on Merchant
Marine and Fisheries House of Representatives
The Honorable Henry B. Gonzalez Chairman, Subcommittee on Housing
and Community Development Committee on Banking, Finance and
Urban Affairs House of Representatives
The Honorable Thomas R. Carper House of Representatives
Your August 4, 1987, letter requested that we study the National Flood Insurance Program (NFIP) administered by the Federal Emergency Management Agency's (FEMA) Federal Insurance Administration. You expressed concern about the inconsistency of the federal government's role in coastal development and protecting coastal resources and the American taxpayer's apparent exposure to undesired levels of liability. As requested in your letter, and subsequently agreed with your offices, we obtained statistical information from FEMA on various aspects of NFIP. On March 1, 1988, we briefed representatives of your offices and agreed to provide a fact sheet on the results of our work. This fact sheet, together with FEMA's written response to certain additional questions you raised, completes our work on this assignment.
The National Flood Insurance Act of 1968 (P.L. 90-448) established NFIP. Under this program, property owners are eligible to purchase federal flood insurance if their flood-prone community adopts and enforces adequate flood plain management regulations, such as elevating new structures, designed to protect lives and property from future floods. Also, under a program begun in fiscal year 1980, FEMA can purchase flood-prone property for subsequent transfer to state or local agencies.

B-226596
We obtained statistical information from FEMA on (1) NFIP's annual operating income/deficit, (2) number of policies in coastal areas and Great Lakes states,1 (3) total and repetitive 10sses,2 (4) flood-damaged property purchases by FEMA, (5) damages in excess of the maximum flood insurance available, and (6) the annual average premiums and losses on policies for property in coastal high-hazard areas.
In summary, these statistics show that:
-- As of December 31, 1987, NFIP had about 2.1 million flood insurance policies with a face value of about $162 billion and a cumulative net operating deficit of about $652 million for the period 1978 through 1987. (See section 1.)
-- About 72 percent of the approximately 2.0 million flood insurance policies in force as of August 31, 1987, were for properties in coastal communities and about 10 percent were for properties in the eight Great Lakes states. (See section 2.)
-- From January 1, 1978, through October 31, 1987, losses totaled about $2.4 billion. Repetitive losses accounted for about $1 billion, or about 43 percent of the total. (See section 3.)
-- From when the program began in fiscal year 1980 through January 12, 1988, FEMA purchased 727 flood-damaged properties at a cost of about $21.4 million. ( See section 4.)
-- From January 1, 1978, through December 31, 1986, insured property had flood damages of about $204 million in excess of the maximum flood insurance available. ( See section 5.)
1The eight states bordering the Great Lakes are: Illinois, Indiana, Michigan, Minnesota, New York, Ohio, Pennsylvania, and Wisconsin.
2A loss is the total claims paid and loss adjustment expense for an insured property from a single flood event. A loss could involve more than one claim: e.g., a claim for building damages and another claim for contents damage. According to FEMA, a repetitive loss occurs when a property has two or more losses of $1,000 or more each within a lo- year period.
2

B-226596
-- Average NFIP premiums for coastal high-hazard policies increased from $98 in 1978 to $437 in 1986; the average loss for such policies fluctuated from a low of $1 in 3981 to a high of $1,221 in 1979. (See section 6.)
Sections 1 through 6 of this fact sheet present the above information in greater detail.
As agreed with your offices, we did not independently verify the information provided to us by FEMA. The information presented covers different periods of time because of the various methods that FEMA used in collecting and/or reporting the information. We conducted our work from October 1987 through March 1988.
As arranged with your offices, unless you publicly announce its contents earlier, we plan no further distribution of this fact sheet until 3 days from the date of this letter. At that time, we will send copies to interested parties and make copies available to others upon request. If we can be of further assistance, please contact me at (202) 275-6111.
Major contributors are listed in appendix I.
/John H. Luke Associate Director

CONTENTS
LETTER
SECTION
1
2
3
4
5
6
APPENDIX
I
TABLE
1.1
2.1
3.1
3.2
3.3
4.1
4.2
4.3
Page
1
TOTAL POLICIES, ESTIMATED MAXIMUM LOSS, AND OPERATING INCOME/DEFICIT - 1978 TO 1987 6
NUMBER OF POLICIES IN COASTAL AREAS AND GREAT LAKES STATES AS OF AUGUST 31, 1987 8
NUMBER AND AMOUNT OF LOSSES AND REPETITIVE LOSSES - 1978 TO 1987 11
FLOODED PROPERTY PURCHASES - FISCAL YEARS 1980 'IQ 1987 14
DAMAGES IN EXCESS OF INSURANCE AVAILABLE - 1978 THROUGH 1986 19
NFIP RATE REVISIONS AND PREMIUMS AND LOSSES FOR COASTAL HIGH-HAZARD AREAS - 1978 TO 1986 22
MAJOR CONTRIBUTORS TO THIS FACT SHEET 24
NFIP Operating Income/Deficit for Calendar Years 1978 to 1987 7
NFIP Policies, Premiums, and Insurance in Force as of August 31, 1987 10
NFIP Losses 12
NFIP Repetitive Losses 13
NFIP Repetitive Losses Due to Nonhurricanes and Hurricanes 13
Section 1362 Funds - 1980 to 1988 16
Section 1362 Applications, Approvals, and Purchases for Fiscal Years 1980 to 1987 17
Justifying Criteria Used for Property Purchased - Fiscal Years 1985 to 1987 18
4

TABLE Page
4.4
5.1
5.2
6.1 NFIP Rate Revisions Since January 1, 1974
6.2 NFIP Average Premiums and Losses for Coastal High-Hazard Policies with Rate Maps 23
AFMD FEMA GAO NFIP
Section 1362 Purchases - Fiscal Years 1980 to 1987 18
Maximum Flood Insurance Available 20
Damages in Excess of NFIP Insurance Available for Buildings and Contents 21
22
ABBREVIATIONS
Accounting and Financial Management Division Federal Emergency Management Agency General Accounting Office National Flood Insurance Program
5

SECTION 1
TOTAL POLICIES, ESTIMATED MAXIMUM LOSS, AND OPERATING INCOME/DEFICIT
1978 TO 1987
Question: What is the total face value of the flood insurance policies in the National Flood Insurance Program (NFIP)?
Resoonsel
According to the Federal Emergency Management Agency (FEMA), as of December 31, 1987, NFIP had about 2.1 million policies with a total insurance in force of about $162 billion.2
Question: In the event of a catastrophic year, what is the maximum amount of claims that PEMA estimates NFIP would have to pay?
Response
Using its flood loss simulation model, FEMA estimates that in a catastrophic year the probable maximum loss for 2.1 million policies would be about $3.5 billion to $4.0, billion.
Question: How much has been earned in premiums and spent in policy claims on an average annual basis from 1978 to 1987?
Response
Although the program has had a net cumulative operating deficit of about $652 million over the past 10 years, it has had an operating gain in each of the last 2 years. See table 1.1 for operating income/deficit information for calendar years 1978 to 1987.
lResponses to questions in sections 1 through 6 are based on information provided by FEMA that was not independently verified _ by GAO.
2Total insurance in force is the face value of all policies in effect; i.e., the amount for which buildings and/or contents are insured.
6

Table 1.1: NFIP Operating Income/Deficit for Calendar Years 1978 to 1987
Other Operating Calendar operating income year Premiuma Lossb expense (deficit)
------------(dollars in millions)------------
1978 $ 84.6 $ 155.6 $ 28.9 1979 126.5 505.5 38.8 1980 151.5 243.9 58.0 1981 181.1 133.9 62.2 1982 246.6 208.5 73.2 1983 296.4 456.1. 78.2 1984 336.6 260.2 92.1 1985 358.7 376.7 102.7 1986 408.1 133.5 130.3 1987c 481.3 100.6 84.0
$ (99.9) (417.8) (150.4)
(15.0) (35.1)
(237.9) (15.8)
(120.7) i44.3 296.7
Totald $2,671.3 $2,574.4 $748.5 ($651.6)
Annual average $267.1 $257.4 $74.9 ($65.2)
aTotal premiums earned during each calendar year.
bIncludes claims paid and loss adjustment expense.
CEstimated from NFIP Monthly Technical Progress Narrative reports,
dTotals may not add due to rounding.
Source: Compiled by GAO from information provided by FEMA.
7

SECTION 2
NUMBER OF POLICIES IN COASTAL AREAS AND GREAT LAKES STATES AS OF AUGUST 31, 1987
Question: What portion of all policies under NFIP is for property in coastal areas?3
Response
About 72 percent of the approximately 2 million policies in force as of August 31, 1987, were for properties located in coastal communities.
Question: What portion of all policies is for property located in coastal high-hazard areas?4
Response
Coastal high-hazard areas accounted for about 3 percent of the total number of policies in force as of August 31, 1987.
Question: What portion of all policies is for property in the Great Lakes states?
Response
About 10 percent of the policies were for properties in the eight Great Lakes states.
Question: What portion of all policies is for property in Great Lakes coastal areas?
Response
About 3 percent of all policies, or about one-third of the policies in the Great Lakes states, were for properties in coastal communities.
Question: What are the average premiums paid by property holders in coastal and Great Lakes areas and for all property covered under NFIP?
3FEMA defines a coastal area as a community that has part of its area on the coast, including the Great Lakes.
~FEMA defines a coastal high-hazard area as an area in a coastal community that has additional flood hazards due to wind and wave action.
8

Response
The average premium per flood insurance policy for property in coastal areas was about $262 and the average for property in the Great Lakes States was about $258. The U.S. average for all policies was about $259 (see table 2.1).
Question: What is the total insurance in force for these areas and for the total program?
Response
About $121 billion of the $157 billion insurance in force as of August 31, 1987, or about 77 percent, was for policies in coastal communities and about $11 million, or about 7 percent, was for property in the Great Lakes states (see table 2.1).
Question: what is the average insurance in force per policy for these areas and for the total program?5
Response
The average insurance in force per flood insurance policy in the United States was $77,277, the average in coastal areas was $82,986, the average in coastal high-hazard areas was $81,793, and the average in the eight Great Lakes states was $55,330 (see table 2.1).
5Average insurance in force per policy is the total insurance in force divided by the number of policies.
9

Table 2.1: NFIP Policies, Premiums, and Insurance in Force as of August 31, 1987
Average Number of lotal Average Insurance
premiumsa premiumb insurance
policies in force in forceC
(000) (000) (000)
Program total 2,031 $525,134 $ 259 $156,941,202 $77,277 Percent of total 100.0 100.0 100.0
mastal 1,454 381,502 262 120,673,721 82,986 Percent of total 71.6 72.6 76.9
Coastal high hazard 64 29,796 469 5,200,729 81,793 Percent of total 3.1 5.7 3.3
Great Lakes states 197 50,827 258 10,899,118 55,330 Percent of total 9.7 9.7 6.9
Great Lakes coastal 65 18,552 285 4,868,312 74,681 Percent of total 3.2 3.5 3.1
aWritten premiums , or the total premiums for policies in effect on August 31, 1987.
bfhe average premium was determined by dividing the written premiums by the number of policies. Dividing the amounts shown may result in a variance due to rounding.
c~he average insurance in force was determined by dividing the insurance in force by the number of policies. Dividing the amounts shown may result in a variate due to rounding.
Source: Wnpiled by GAO from policy information provided by FEMA.
10

SECTION 3
NUMBER AND AMOUNT OF LOSSES AND REPETITIVE LOSSES 1978 TO 1987
Question: What were the number and amount of losses since 1978 in the coastal areas and Great Lakes states described in section 2 and overall?
Response
From January 1, 1978, through October 31, 1987, of about $2.4 billion in losses, about $1.3 billion, or 53 percent, were in coastal communities and about $315 million, or 13 percent, were in Great Lakes states (see table 3.1).
Question: What was the average loss for each of the geographical areas and overall?
Response
The average loss was about $6,907 in coastal areas, about $8,260 in coastal high-hazard areas, about $4,246 in Great Lakes states, and about $3,589 in Great Lakes coastal areas. The overall average loss was about $7,069 (see table 3.1).
Question: During this time, what percentage of the total losses involved repetitive losses?
Response
Repetitive losses accounted for about $1 billion, or about 43 percent, of the $2.4 billion in losses since January 1978 (see table 3.1).
Question: For each area and overall, how many repetitive losses occurred since 1978 and what percent of the total losses did the repetitive losses represent?
Response
About $555 million, or about 53 percent of the repetitive losses, were for properties in coastal communities. Table 3.2 shows the repetitive losses for the coastal areas and Great Lakes states and overall.
Question: During this time frame, what were the number and amount of repetitive losses that were nonhurricane-related and hurricane- related?
11

Response
Most of the repetitive losses resulted from nonhurricane floods.6 Table 3.3 shows the repetitive losses resulting from nonhurricanes and from hurricanes.
Table 3.1: NFIP LOSSeSa (Jan. 1, 1978, through Oct. 31, 1987)
Program total Coastal Coastal high
hazard Great Lakes
coastal Great Lakes
states Repetitive
lossesb
Number of
losses
342,616 100.0 $2,421,944 185,873 54.3 1,283,753
11,253 3.3 92,948
30,045
74,302
147,245
Percent of Losses
number amounts
---(OOO)--
8.8 107,844
21.7 315,459
43.0 1,044,774
Percent of
amount Average
100.0 $7,069 53.0 6,907
3.8 8,260
4.5 3,589
13.0 4,246
43.1 7,095
aLosses include claims paid and loss adjustment expenses.
bA repetitive loss occurs when a property has two or more losses of $1,000 or more each within a lo-year period.
Source: Compiled by GAO from information provided by FEMA.
6A nonhurricane flood is a general and temporary condition of partial or complete inundation of normally dry land areas from overflow of inland or tidal waters or from the unusual and rapid accumulation or runoff of surface waters from any source other than a hurricane.
12

Table 3.2: NFIP Repetitive Losses (Jan. 1, 1978, through Oct. 31, 1987)
Number Percent of of
losses number
Program total 147,245 Coastal 77,918 Coastal high
hazard 3,002 Great Lakes
coastal 15,126 Great Lakes
states 34,153
Source: Compiled by GAO
100.0 52.9
2.0
10.3
23.2
Losses amounts
---(OOO)--
$11044,774 555,205
24,435
55,648
152,001
Percent of
amount Average
100.0 $7,095 53.1 7,126
2.3 8,140
5.3 3,679
14.5 4,451
from information provided by FEMA.
Table 3.3: NFIP Repetitive Losses Due to Nonhurricanes and Hurricanes (Jan. 1, i978, through Oct. 31, 1987)
Type of flood
Nonhurricanea Hurricanea
Number of losses
126,757 4,310
Losses amounts
$836,577,650 62,657,575
aThese losses do not account for all repetitive losses because those resulting from a combination of hurricane- and nonhurricane- related floods are not included.
Source: Compiled by GAO from information provided by FEMA.
13

SECTION 4
FLOODED PROPERTY PURCHASES7 FISCAL YEARS 1980 l-0 1987
Question: How much money has been available for purchases under Section 1362 of the National Flood Insurance Act of 1968, as amended (P-L. 90-448)?
Resz,onse
For fiscal years 1980 through 1988, the Congress appropriated a total of $42.5 million for the purchase of properties under section 1362. Table 4.1 shows, by fiscal year, the total amount of funds available for purchases under the program.
Question: On an annual basis since 1980, how many properties have communities applied to have FEIYA purchase?
Response
Through fiscal year 1987, communities applied for FEMA to purchase a total of 1,727 properties, ranging from 52 properties in 1982 to 797 properties in 1984 (see table 4.2).
Question: What was the estimated cost of purchasing those properties?
Response
The total estimated cost to purchase these properties was about $58.5 million, ranging from about $2.9 million in 1982 to $16.4 million in 1984 (see table 4.2).
Question: How many of the purchases applied for did FJZMA approve and at what estimated purchase price?
Response
FEMA approved 1,257 properties for purchase at a total estimated cost of $36 million (see table 4.2).
7Section 1362 authorizes FEMA to purchase flood-insured properties that are subject to heavy and/or repetitive flood damages. Under this program, FEMA may purchase flood-prone property for subsequent transfer to state or local agencies. The communities where the properties are located must agree to accept title to the land and manage the land for open space or nondevelopment purposes. FEMA began making purchases under this program after the Congress initially appropriated funds in fiscal year 1980.
14

Quest ion : How many properties did FEMA acquire and at what purchase price?
Response
As of January 1988, FEMA purchased 727 properties at a cost of $21.4 million (see table 4.2).
Question: What justifying criteria were used for purchases made during fiscal years 1985 throagh 19871
Re sp on se
FEMA can offer to purchase currently damaged properties if they are covered by flood insurance and at least one other criterion is met. These criteria include: (1) the building has suffered damages equal to 25 percent or more of its value on at least three occasions over a S-year period, (2) a single flood caused damage to the building equal to 50 percent or more of its value, or beyond repair to its preflood condition, or (3) a single casualty has left the building irreparable because a statute, ordinance, or regulation either precludes its repair or permits repair only at significantly increased building costs. The qualifying criterion most frequently used for the purchases was that three or more losses occurred in a S-year period. Table 4.3 shows the frequency that the justifying criterion was used for purchases made during fiscal years 1985 through 1987.
Question: What portion of the section 1362 funds has been spent in coastal areas and Great Lakes states?
Re sp on se
Of the 727 properties purchased, 94, or about 13 percent, were in Great Lakes states, and 195, or about 27 percent, were in coastal communities. Table 4.4 compares, by fiscal year, total purchases with those in Great Lakes states and coastal communities.
15

Table 4.1: Section 1362 Funds - 1980 to 1988
Fiscal year
Obligation Amount authority Funds
appropriated brought forward available
1980 $ 5,400,000 1981 5,400,000 1982 1,600,OOO 1983 4,778,OOO 1984b 6,778,000 1985 4,778,000 1986 4,522,248 1987 4,720,000 1988 4,531,ooo
a a a a
$5,6;8,236 6,778,OOO 4,522,248 4,720,OOO
$5,400,000 5,400,000 1,600,OOO 4,778,000 6,778,OOO
10,476,236 11,300,248
9,242,248 9,251,ooo
Total appropriated $42,507,248.
aInitially, funds were appropriated for 1 year, and any funds that remained unobligated at the end of the year expired. Beginning in fiscal year 1984, appropriations were made available for a 2-year period.
bIncludes a supplemental appropriation of $2 million for the purchase of structures in Tulsa, Oklahoma. These funds were made available through the end of fiscal year 1986.
Source: Compiled by GAO from data provided by FEMA.
16

Table 4.2: Section 1362 Applications, Approvals, and Purchases for Fiscal Years 1980 to 1987 (as of Jan. 12, 1988)
Applied Fiscal Estimated year Numbera cost
(millions)
1980 101 $ 5.9 1981 71 3.6 1982 52 2.9 1983 174 7.9 1984 797 16.4 1985 135 5.4 1986 224 7.7 1987 173 8.7
Totalc 1,727 $58.5
Percent 100.0 100.0
aNumber of structures.
bWe could not reconcile the
Approved Estimated
Numbera cost Numbera cost
101 $ 5.9 101 $ 5.9b 69 3.4 69 3.4 36 1.5 33 1.3
120 4.3 128 4.3 454 5.2 323 4.1 116 4.6 54 1.7 216 5.4 3 0.2 145 5.6 16 0.5
(millions)
1,257 $36.0 727 $21.4
72.8 61.5 42.1 - 36.5
Purchased
(millions)
$5.9 million spent with the $5.4 million appropriated for fiscal year 1980 (see table 4.1). Throughout fiscal year 1980, FEMA did not maintain accounting control over the flood insurance program. For more information on this problem, see our report entitled Terminating the Audit of the National Flood Insurance Program's Fiscal 1980 Financial Statements, (AFMD-81-93, Sept. 21, 1981).
CTotals may not add due to rounding.
Source: Compiled by GAO from data provided by FEMA.
17
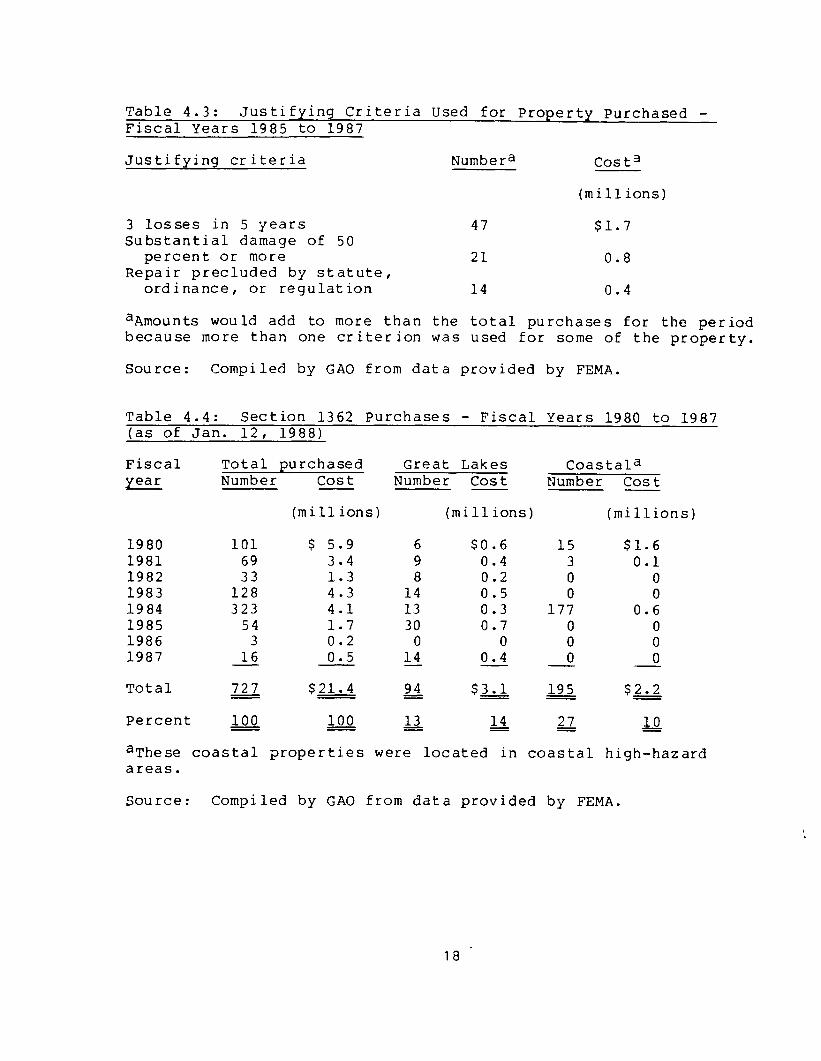
Table 4.3: Justifying Criteria used for Property Purchased - Fiscal Years 1985 to 1987
Justifying criteria Numbera Cost3
(millions)
3 losses in 5 years Substantial damage of 50
percent or more Repair precluded by statute,
ordinance, or regulation
47 $1.7
21 0.8
14 0.4
aAmounts would add to more than the total purchases for the period because more than one criterion was used for some of the property.
Source: Compiled by GAO from data provided by FEMA.
Table 4.4: Section 1362 Purchases - Fiscal Years 1980 to 1987 (as of Jan. 12, 1988)
Fiscal year
Total purchased Great Lakes Coastala Number cost Number cost Number cost
(millions) (millions) (millions)
1980 101 1981 69 1982 33 1983 128 1984 323 1985 54 1986 3 1987 16
Total
Percent
$ 5.9 6 $0.6 15 $1.6 3.4 9 0.4 3 0.1 1.3 8 0.2 0 0 4.3 14 0.5 0 0 4.1 13 0.3 177 0.6 1.7 30 0.7 0 0 0.2 0 0 0 0 0.5 14 0.4 0 0 -
$21.4 94 $3.1 195 $2.2
aThese coastal properties were located in coastal high-hazard areas.
Source: Compiled by GAO from data provided by FEMA.
18 -

SECTION 5
DAMAGES IN EXCESS OF INSURANCE AVAILABLE 1978 THROUGH 1986
Ouestion: What is the maximum amount of flood insurance available?
Response
The maximum coverage available depends on the type of building and whether a community is in the emergency or regular program.8 For example, for a single- family residence, the maximum building coverage available under the emergency program is $35,000 and $185,000 under the regular program. Table 5.1 shows the maximum amounts of insurance available for the various types of buildings and their contents.
Question: From January 1, 1978, throagh December 31, 1986, how many claims involved damages in excess of the maximum flood insurance available, and what was the amoant of damages in excess of the insurance available?
Response
From January 1, 1978, through December 31, 1986, flood insurance claims involved about $88 million in damages in excess of the insurance available for buildings and about $116 million in damages in excess of the insurance available for contents. Table 5.2 shows damages in excess of the insurance available for buildings and contents.
8A community initially enters the "emergency" program by adopting adequate flood plain management regulations to guide new construction in flood-prone areas. The community enters the "regular" program after a detailed flood insurance rate map is completed by FEMA and local officials enact regulations that require all new or substantially improved structures to be built in accordance with federal flood plain management criteria. A flood insurance rate map is an official map of a community on which the Administrator, Federal Insurance Administration, has delineated the applicable special flood hazard areas and risk premium zones.
19

Table 5.1: Maximum Flood Insurance Available
Program and building type Amount available
Buildinga Contentsab
Emergency program: Single-family residenceC Other residentialc,d Nonresidentiale
$ 35,000 $ 10,000 100,000 10,000 100,000 100,000
Regular program: Single-family residence 2-4 family residence Other residentialf Small businessg Other nonresidentialh
185,000 60,000 250,000 60,000 250,000 60,000 250,000 300,000 200,000 200,000
aThe maximum flood insurance available is set forth by the National Flood Insurance Act of 1968 (P.L. 90-448), as amended by the Disaster Assistance Act of 1973 (P.L. 93-234).
bLimit per unit.
CHigher maximum amounts are available in Alaska, Guam, Hawaii, and the U.S. Virgin Islands.
dA residential building, excluding hotels and motels with normal room rentals for less than 6 months, that contains 2 or more dwelling units.
eA nonresidential building includes, but is not limited to: small businesses, churches, schools, nursing homes, farm buildings, government buildings, mercantile structures, industrial plants, and warehouses.
fA residential building, excluding hotels and motels with normal room rentals for less than 6 months, containing more than 4 dwelling units.
gA business having assets not in excess of $5 million, net worth not in excess of $2.5 million, and an average net income, after federal income taxes, for the preceding 2 years not in excess of $250,000.
hA nonresidential building other than a small business.
Source: FEMA.
20
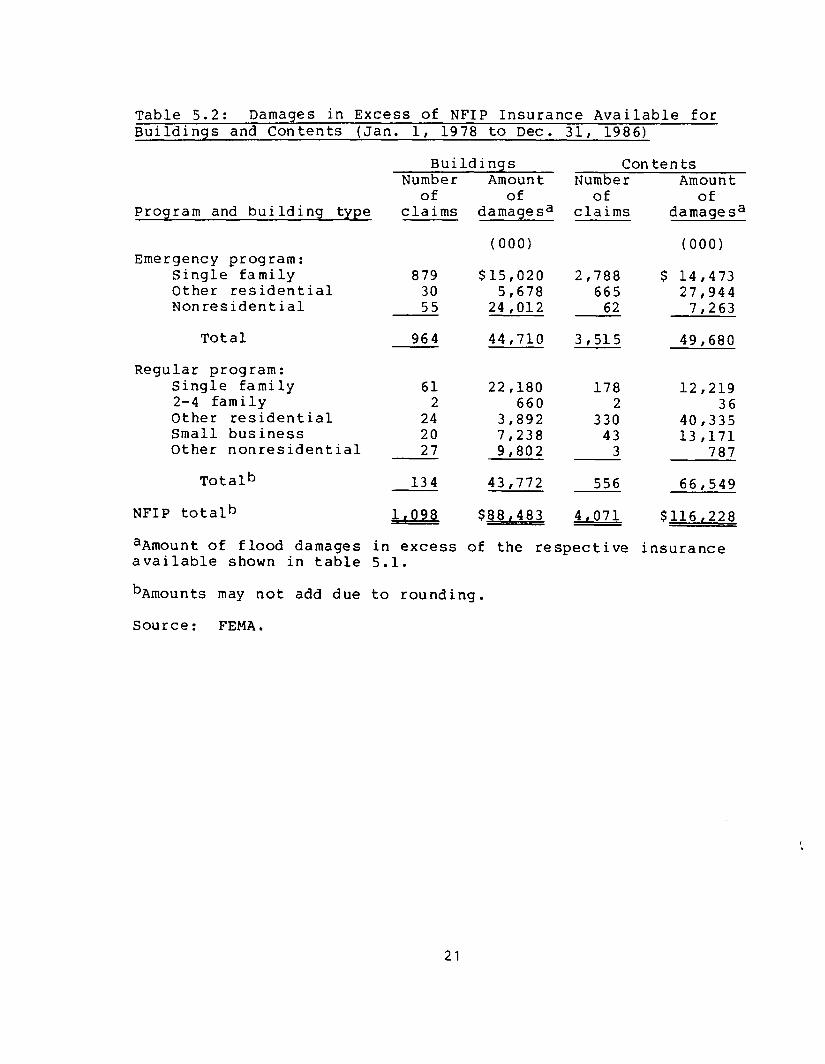
Table 5.2: Damages in Excess of NFIP Insurance Available for Buildings and Contents (Jan. 1, 1978 to Dec. 31, 1986)
Program and building type
Emergency program: Single family Other residential Nonresidential
879 $15,020 2,788 30 5,678 665 55 24,012 62
$ 14,473 27,944
7,263
Total 964 44,710 3,515 49,680
Regular program: Single family 2-4 family Other residential Small business Other nonresidential
61 22,180 178 12,219 2 660 2 36
24 3,892 330 40,335 20 7,238 43 13,171 27 9,802 3 787
Totalb 43,772 556
NFIP totalh 1,098 $88,483 4,071
66,549
$116,228
insurance
Buildings Number Amount
of of claims damagesa
(000)
Contents Number
of claims
aAmount of flood damages in excess of the respective available shown in table 5.1.
bAmounts may not add due to rounding.
Amount of
damagesa
(000)
Source: FEMA.
21
SECTION 6
NFIP RATE REVISIONS AND PREMIUMS AND LOSSES FOR COASTAL HIGH-HAZARD AREAS
1978 TO 1986
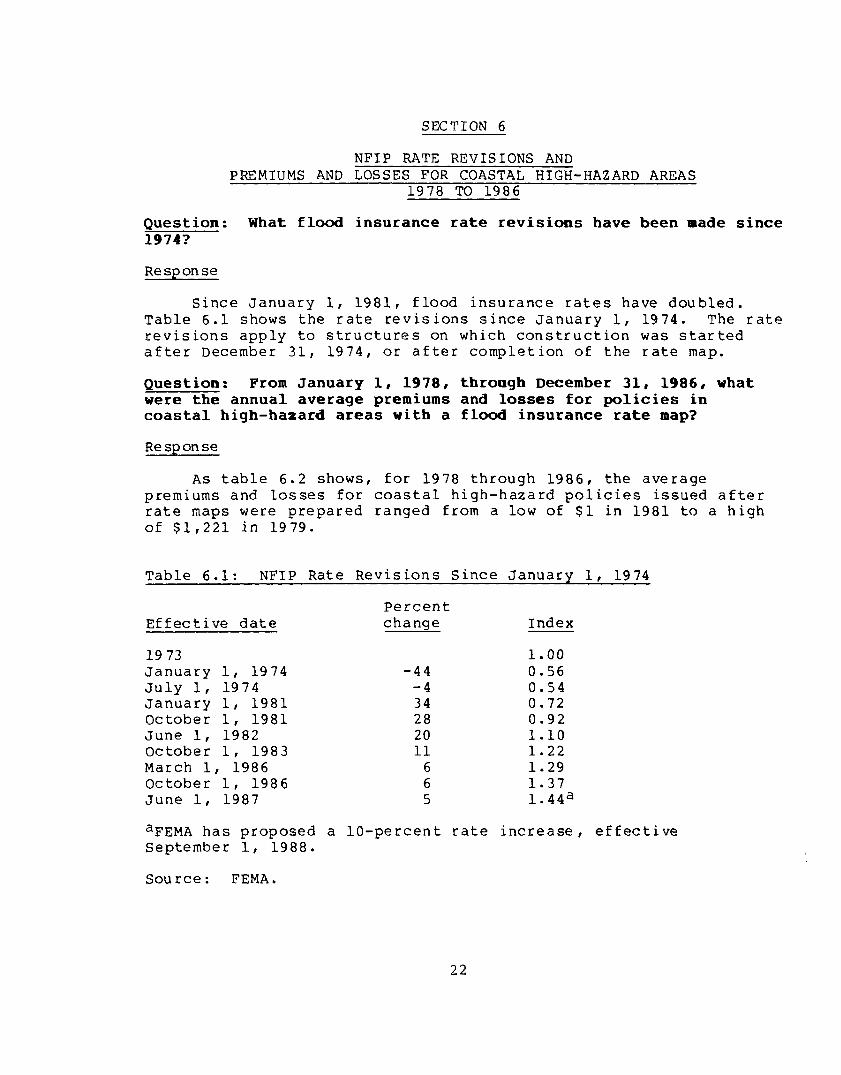
Question: What flood insurance rate revisions have been made since 1974?
Response
Since January 1, 1981, flood insurance rates have doubled. Table 6.1 shows the rate revisions since January 1, 1974. The rate revisions apply to structures on which construction was started after December 31, 1974, or after completion of the rate map.
Question: From January 1, 1978, throagh December 31, 1986, what were the annual average premiums and losses for policies in coastal high-hazard areas with a flood insurance rate map?
Response
As table 6.2 shows, for 1978 through 1986, the average premiums and losses for coastal high-hazard policies issued after rate maps were prepared ranged from a low of $1 in 1981 to a high of $1,221 in 1979.
Table 6.1: NFIP Rate Revisions Since January 1, 1974
Effective date Percent change Index
1973 January 1, 1974 July 1, 1974 January 1, 1981 October 1, 1981 June 1, 1982 October 1, 1983 March 1, 1986 October 1, 1986 June 1, 1987
-44 -4 34 28 20 11
6 6 5
1.00 0.56 0.54 0.72 0.92 1.10 1.22 1.29 1.37 1.44a
aFEMA has proposed a lo-percent rate increase, effective September 1, 1988.
Source: FEMA.
22

Table 6.2: NFIP Average Premiums and Losses for Coastal High- Hazard Policies with Rate Maps (Jan. 1, 1978 to Dec. 31, 1986)
Calendar Average year premiuma
Average loss per policyb
1978c $ 98 $ 11 1979c 103 1,221 1980c 106 45 1981c 149 1 1982c 290 17 1983c 313 421 1984c 389 54 1985 425 220 1986 437 2
aAverage premiums earned during each calendar year.
bAmount of claims paid and loss adjustment expense, divided by the number of coastal high-hazard policies with rate maps in effect.
CDuring 1985 and 1986 FEMA's contractor, Computer Sciences Corporation, recompiled all loss experience. Corrections and changes made are reflected in 1985 and 1986 amounts but not for 1978 through 1984.
Source: Compiled by GAO from data provided by FEMA.
23

APPENDIX I APPENDIX I
MAJOR CONTRIBUTORS TO THIS FACT SHEET
RESOURCES, COMMUNITY, AND ECONOMIC DEVELOPMENT DIVISION, WASHINGTON, D.C.
John H. Luke, Associate Director, (202) 275-6111 Frank V. Subalusky, Group Director Sumikatsu J. Arima, Evaluator-in-Charge Margaret C. Earman, Evaluator Shirley A. Perry, Writer-Editor Vernesia J. Middleton, Typist
(068255)
24

Requests for copies of GAO reports shouM be sent t;o:
U.S. General Accounting Offi post Office Box 6015 Gaithersburg, Maryland 20877
Telephone 202-275-6241
The fust five copies of each report are free. A&Wonal copks are $2.00 each.
Thereisa25%discountoarordersfor100srllRoreeopies~ledtoa single address.
OrdersmustbeprepaidbycashorbydaeckorRRoRey~ outto the Superintendent of Documee.

United States General Accounting OffIce Washington, D.C. 20648
Ofliciai Business Penalty for Private Use $300
T
t