rd meeting of the board of directors thursday, november … meeting... · 203rd meeting of the...
TRANSCRIPT

.DISTRICT OF COLUMBIA WATER AND SEWER AUTHORITY
203rd MEETING OF THE BOARD OF DIRECTORSThursday, November 6, 2014
9:30 a.m.5000 Overlook Avenue, SW
Room 407
AGENDA
I. Call to Order (Chairman Allen Lew)
II. Roll Call (Linda Manley, Board Secretary)
Ill. Approval of October 2, 2014 Minutes (Chairman Allen Lew)
lV. Chairman’s Overview
V. Committee Reports
1. Audit Committee (Nicholas Majett)2. Environmental Quality and Sewerage Services Committee (David Lake)3. Water Quality and Water Services Committee (Rachna Butani)
VI. General Manager’s Report
VII. Summary of Contracts
VIII. Consent Items (Joint-use)
1. Approval to Execute Option Year Two of Contract No. WAS-12-035-AA-RE, G4S Integrated Fleet Services, LLC – Resolution No. 14-67 (Recommended by Environmental Quality and Sewerage Services Committee 10/16/14)
2. Approval to Execute Option Year Two and Additional Funds for Services of Contract No. WAS-12-033-AA-RE, G4S Integrated Fleet Services, LLC – Resolution No. 14-68(Recommended by Environmental Quality and Sewerage Services Committee10/16/14)
3. Approval to Execute Option Year Four of Contract No. WAS-10-052-AA-RE, Maryland Environmental Service – Resolution No. 14-69 (Recommended by Environmental Quality and Sewerage Services Committee 10/16/14)
4. Approval to Execute Supplemental Agreement No. 1 of Contract No. DCFA #426, O’Brien & Gere Engineers – Resolution No. 14-70 (Recommended by Environmental Quality and Sewerage Services Committee 10/16/14)
5. Approval to Execute Option Year One of Contract No. WAS-12-056-AA-SC, Urban Services Systems Corporation – Resolution No. 14-71 (Recommended by Environmental Quality and Sewerage Services Committee 10/16/14)
DC Water Board of Directors - I. Call to Order (Chairman Allen Lew)
1

2
lX. Consent Item (Non-Joint Use)
1. Approval to Execute Contract No. 140010, Capitol Paving of D.C., Inc. – Resolution No. 14-72 (Recommended by Water Quality and Water Services Committee10/16/14)
X. Executive Session – To discuss legal, confidential and privileged matters pursuant to Section 2-575(b) of the D.C. Official Code1
Xl. Adjournment1 The DC Water Board of Directors may go into executive session at this meeting pursuant to the District of Columbia Open Meetings Act of 2010, if such action is approved by a majority vote of the Board members who constitute a quorum to discuss: matters prohibited from public disclosure pursuant to a court order or law under D.C. Official Code § 2-575(b)(1); contract negotiations under D.C. Official Code § 2-575(b)(1); legal, confidential or privileged matters under D.C. Official Code § 2-575(b)(4); collective bargaining negotiations under D.C. Official Code § 2-575(b)(5); facility security under D.C. Official Code § 2-575(b)(8); disciplinary matters under D.C. Official Code § 2-575(b)(9); personnel matters under D.C. Official Code § 2-575(b)(10);proprietary matters under D.C. Official Code § 2-575(b)(11); decision in an adjudication action under D.C. Official Code § 2-575(b)(13); civil or criminal matters where disclosure to the public may harm the investigation under D.C. Official Code § 2-575(b)(14), and other matters provided in the Act.
Upcoming Committee Meetings (5000 Overlook Avenue SW (Blue Plains – 4th Floor)
∑ Governance Committee – Wednesday, November 12th @ 9:00 a.m. (5000 Overlook Avenue SW)
∑ Human Resource and Labor Relations Committee – Wednesday, November 12th @ 11:00 a.m. (5000 Overlook Avenue SW)
∑ Environmental Quality and Sewerage Services Committee – Thursday, November 20th @ 9:30 a.m. (5000 Overlook Avenue, SW)
∑ Water Quality and Water Services Committee – Thursday, November 20th @ 11:00 a.m. (5000 Overlook Avenue, SW)
∑ D.C. Retail Water and Sewer Rates Committee – Tuesday, November 18th @ 9:30 a.m.
∑ Finance and Budget Committee – Friday, November 21st @ 11:00 a.m. (5000 Overlook Avenue, SW)
DC Water Board of Directors - I. Call to Order (Chairman Allen Lew)
2

Board of Directors
Audit Committee
Thursday, October 2, 2014
10:30 a.m.
Meeting Minutes
COMMITTEE MEMBERS PRESENTNicholas Majett, ChairmanEdward Long, Jr.Ellen Boardman Shirley Branch
INTERNAL AUDIT STAFF PRESENTDan Whelan, McGladrey LLP (by telephone)Pat Hagan, McGladrey LLP (by telephone)Jennifer Murtha, McGladrey LLPCharles Barley Jr., McGladrey LLPJill Reyes, McGladrey LLPKelly Johnson, McGladrey LLP
DC WATER STAFF PRESENTGeorge Hawkins, General ManagerMark Kim, Chief Financial OfficerGregory Hope, Principal CounselLinda Manley, Secretary to the Board
Call to Order (Item 1)
The audit committee meeting began at 10:38 a.m. The meeting was called to order by Mr. Majett. Mr. Majett then turned the meeting over to Mr. Kim.
Internal Audit Activities (Item 2)
Mr. Kim turned the meeting over to Mrs. Murtha from McGladrey LLP to review the FY15 audit plan. Mrs. Murtha indicated that Mr. Dan Whelan and Mr. Pat Hagan were attending via conference call and introduced the additional McGladrey team members. Mrs. Murtha indicated that this was the core team that would be serving DC Water but as needed, subject matter experts would be utilized.
Mrs. Murtha provided a brief overview of McGladrey. She then began to discuss the internal audit methodology, informing the audit committee that a diagram of this methodology was also included on the back of the laminated handout. Mrs. Murtha stated the risk assessment and brainstorming step and the planning and scoping step have been completed and upon review and approval of the audit plan today, McGladrey would be able to begin the execution of the audits.
DISTRICT OF COLUMBIAWATER AND SEWER AUTHORITY
DC Water Board of Directors - V. Committee Reports
11

Page 3 of 3
Mrs. Murtha communicated that there are currently 75 open audit items from previous firm from the last five years. She indicated that these open items and corrective actions will be reviewed and McGladrey will conduct the appropriate follow-up procedures.
Mrs. Murtha reviewed the risk assessment process which began during the proposal phase. When the RFP was issued, McGladrey reviewed the website and strategic plan and began to understand DC Water’s risks and needs. She then stated the team then conducted interviews of key process owners.
Mrs. Murtha then presented the risk-based audit plan, which was detailed on the laminated handout. Mr. Majett asked if McGladrey was asking the committee to approve the methodology. Mr. Kim clarified that the overview was to brief the committee and that approval was needed for the fiscal year 2015 audit plan.
Mrs. Murtha continued to review the laminated schematic explaining that it continued the proposed plan for FY15, FY16 and FY17 and highlighted that the plan was a real-time document that can change as risks are further assessed, such as review of the 75 open items.
Mrs. Boardman asked for clarification of how the 75 open items are indicated on the schematic. Mrs. Murtha clarified that the yellow boxes, relating to a specific report, contains open audit items. She also highlighted that this will change moving forward and will contain the number of open items or could be closed upon completion of follow-up activity. Mr. Majett asked for confirmation if the two delayed audits were included in the audit plan. Mrs. Murtha confirmed that they had been considered in the process of developing the audit plan.
Mrs. Murtha directed the audit committee to review the plan for FY15 and discussed each proposed audit. Mrs. Murtha turned the meeting over to Mr. Charles Barley to discuss the four proposed information technology audits which were also reviewed and agreed upon with DC Water’s CIO.
Mrs. Boardman asked how McGladrey prioritized which audits we are starting and the open items, including the procurement report and issues from FY14. Mrs. Murtha explained that we will be reviewing the 75 open items and will come to the next audit committee meeting with our analysis of those open items. She also indicated the new audits were prioritized using a risk-based approach. Mr. Long expressed the importance of the procurement area and his concern that the 75 open items might cause more work in FY15. Mrs. Murtha indicated that re-conducting an audit of procurement would not be the best course until the full reports and the currently unresolved action items were reviewed and understood, allowing McGladrey to better assess whether a full-scopeaudit of procurement would replace / complement another audit from the proposed annual audit plan.
Mr. Kim added that management is trying to balance remediating 75 outstanding audit findings which are at various stages of remediation and allowing McGladrey to conduct their own independent assessment of the risks of DC Water. He clarified that a lack of initiation of a new audit of procurement does not mean that McGladrey will not be focusing on that area. Additionally, he stated that if the audit plan needs to be re-adjusted to open an independent new audit of procurement, McGladrey will do so.
DC Water Board of Directors - V. Committee Reports
12

Page 3 of 3
Mrs. Boardman asked if the FY15 plan contained high significance, high risk audits. Mrs. Murtha confirmed that they were. Mr. Kim added that all the open audit items from the last 5 year spanned the spectrum of risk.
Mrs. Murtha continued to discuss the FY15 audit plan. She clarified that FY16 and FY17 were also a proposed preliminary plan and that they could change. Mr. Kim directed the committee to the last line in the audit plan, Contingency and requested audits and projects, noting that it was a reserve in McGladrey’s time to complete any special requests from the Board, Audit Committeeor management.
Mr. Hagan notified the committee that McGladrey considered major compliance subject areas as well as DC Water’s strategic initiatives.
Mrs. Murtha clarified that the naming convention of the procurement-related audit reports remained the same from the prior auditor for Mrs. Boardman.
Mrs. Murtha reviewed the next steps for the internal audit function and Mr. Long clarified that the specific issues that arise from the fraud hotline need to go to the appropriate committee.
Mrs. Boardman requested clarification on the internal audit methodology diagram on the back of the audit plan schematic. Mrs. Murtha reviewed the process explaining the assessment of design effectiveness and operational effectiveness.
Mr. Kim indicated that McGladrey has already added value by suggesting that IT reports and related findings should not be published, as that poses certain security-related risks for the organization. He also suggested that IT issues should be discussed during executive session, and the suggestion has been discussed with the attorney.
Mr. Kim also recommended that the audit committee meeting schedule be moved to quarterly, at the committee’s pleasure. Mr. Long was in agreement with quarterly meetings as long as audit reports were provided as completed. The next quarterly meeting would occur during January. The remaining committee members confirmed their agreement.
Executive Session (Item 3)
Mr. Majett asked Mr. Kim to confirm that there were no other items on the agenda. Mr. Kim confirmed that there were no other items, and that there was no need for an executive session.
Adjournment (Item 4)
At 11:20a.m., the meeting was adjourned by Mr. Majett.
DC Water Board of Directors - V. Committee Reports
13

District of ColumbiaWater and Sewer Authority
Board of Directors
Environmental Quality and Sewerage Services CommitteeThursday, Oct 16, 2014
9:30 a.m.
MEETING MINUTES
Committee Members Present DC Water Staff Present David Lake, Acting Chairperson David McLaughlin, Director, EngineeringHoward Gibbs Randy Hayman, General Counsel
Linda Manley, Secretary to the Board
I. Call to Order
Mr. David Lake, Interim Chairperson, called the meeting to order at 9:30 AM.
II. AWTP STATUS UPDATES
1. BPAWTP Performance
Mr. Walt Bailey, Assistant General Manager for Wastewater Treatment, reported that the monthly average influent flow was 263 MGD, bringing the 12-month average to 302MGD. 1.1-inches of precipitation fell during the September reporting period. Biosolids production was 1091 wet tons per day, compared with the annual average production of 1090 wet tons per day. Total nitrogen concentration averaged 3.3 mg/l for the month, below the annual average of 4.4 mg/l, which Mr. Bailey attributed to the new ENR facilities. Overall, plant performance was excellent, with 100% permit compliance.
Mr. Bailey informed the committee that the first digester was now being fed with sludge from Blue Plains through the Cambi process, and that Class A biosolids production and dewatering through the new belt filter presses is expected by mid November.
DC Water Board of Directors - V. Committee Reports
14

2
III. UPDATES: POTOMAC INTERCEPTOR SEWER
1. Odor Abatement Project
Mr. David McLaughlin, Director of Engineering and Technical Services, reported thatconstruction at the Loudoun County site has been delayed due to late equipmentdelivery. Despite this delay, Mr. McLaughlin expects both Virginia sites (Loudon and Fairfax) to be operational by the end of the year.
Mr. McLaughlin informed the committee that modification of the odor abatement system at Old Anglers Inn continues and that staff were onsite this week testing the systems’performance. Mr. Lake requested a one page summary of actions taken to date at this site, together with a list of anticipated future activities.
IV. ACTION ITEM - JOINT USE
1. Contract No. WAS-12-033-AA-RE, G4S Integrated Fleet Services, LLC2. Contract No. WAS-12-035-AA-RE, G4S Integrated Fleet Services, LLC3. Contract No. WAS-12-056-AA-SC, Urban Services Corporation4. Contract No. WAS-10-052-AA-RE, Maryland Environmental Service5. Contract No. DCFA # 426, O’Brien & Gere Engineers
Teresa Scott, Acting Director of Procurement, presented action items 1 though 4.
Action item 1 is a request for a contract modification allowing for the addition of funds and approval of option year 2. This contract is for fleet management services for the maintenance and repair of vehicles.
The Committee asked why the additional funds were needed and added that the fact sheet was not specific on this point. Ms. Scott explained that the need for additional funds was a result of an unusual amount of emergency repairs to equipment due to the harsh weather. Ms. Scott agreed to add additional information to the fact sheet to explain the funding increase request.
Action item 2 is a request to exercise option year 2 of the contract to provide supply management services for Fleet Services.
The Committee asked what the difference is between action item 1 and 2. Ms. Scott responded by clarifying the difference. Ms. Scott stated that action item 1 provides for maintenance and repair of vehicles, while action item 2 is for supply of parts to support fleet maintenance activities. The Committee questioned whether local staff is hired by the company to work on DC Water’s fleet. Ms. Scott replied that this is the case.
Action item 3 is a request to exercise option year 1 of the contract to haul grit, screenings and scum from the solids building to the disposal facility.
Action item 4 is a request to exercise option year 4 for the monitoring of the biosolids
DC Water Board of Directors - V. Committee Reports
15

3
disposal sites. The committee inquired about the contractor performance. Chris Peot, Director of Resource Recovery, responded that the contractor, Maryland Environmental Service, is doing an excellent job.
David McLaughlin, Director of Engineering and Technical Services, presented action item 5.
Action item 5 is a request to execute a supplemental agreement to provide for final design services to rehabilitate existing equipment at the Main and O Street Pump Stations, and to replace the existing storm pumps at Main.
Mr. McLaughlin drew the Committee’s attention to the extended duration of the contract and explained that the review of storm pumping capacity necessitated an updated hydraulic analysis of the existing system. This analysis added approximately 10 months to the overall contract time. The Committee asked that the fact sheet be modified toinclude this information.
V. BIOSOLIDS MARKETING UPDATE
Chris Peot, Director of Resource Recovery, presented the Committee with an update on the biosolids marketing process. Mr. Peot stressed that the message to all involved parties is that we are exporting carbon, nutrients and energy from Blue Plains, in the form of biosolids and that DC Water is not realizing this value. The long term plan for the use of DC Water’s biosolids is to market to both farmers and general consumersalike a blended soil mix. This marketing effort, when combined with the planned increased production of class A biosolids should offset costs of disposal and may be profitable in the future.
Mr. Peot’s presentation also touched on future plans, the start-up schedule and regulatory issues. Mr. Peot presented information on the experience of other water utilities in marketing biosolids, and noted that examples exist of profitable programs, albeit on a smaller scale than Blue Plains. The Committee asked if there has been any progress in naming the product for marketing purposes. Mr. Peot responded that expert advice in this area has been solicited, but we are not yet ready to invite public input.
VI. EMERGENCY PREPARDNESS AT BLUE PLAINS
Jonathan Reeves, Manager, Office of Emergency Preparedness presented the Committee with an overview of DC Water’s Critical Infrastructure Protection Program. Mr. Reeves explained that the program leverages Federal resources to minimize cost to DC Water, quantifies risks and consequences to DC Water personnel and facilities into actionable CIP activities, and supports operations with actionable intelligence and information. Mr. Reeves noted the comprehensive involvement DC Water staff has with federal and local agencies in cross training and vulnerability assessment. DC Water recently dedicated a full time position to work as a liaison with responding agencies. This position requires a high level security clearance due to the sensitivity of topics and
DC Water Board of Directors - V. Committee Reports
16

4
response plans. Mr. Reeves noted that DC Water has benefited from access to federal funding for emergency preparedness activities.
Mr. Reeves explained that Homeland Security produces a report on water agencies’preparedness plans that includes an overall score when compared to peer organizations. DC Water has typically scored high in DHS reviews.
The Committee complimented Mr. Reeves’ efforts and initiatives, and noted that DC Water appears to be leading the nation’s water utilities in this area.
VII: OTHER BUSINESS/EMERGING ISSUES
No other business items were raised.
VIII: EXECUTIVE SESSION
The Committee voted to move to executive session to discuss legal matters.
IX: ADJOURNMENT
After returning from executive session, the meeting was adjourned at 11:05 am.
Follow-up Items
1. Provide a one page summary of completed and planned activities to respond to odor problems at Old Angler’s Inn;
2. Add additional information to the fact sheet for Contract WAS-12-033-AA-RE to explain the funding increase request;
3. Provide more detail related to the time extension on the fact sheet for Contract DCFA # 426.
DC Water Board of Directors - V. Committee Reports
17

1
DISTRICT OF COLUMBIA WATER AND SEWER AUTHORITY
BOARD OF DIRECTORSWATER QUALITY AND WATER SERVICES COMMITTEE
MEETING MINUTESThursday, October 16, 2014
(Meeting Via Telephone Conferencing)
Present Board Members Present D.C. Water StaffRachna Butani, Chair George Hawkins, General ManagerHoward Gibbs Randy Hayman, General CounselAlan Roth Charles Kiely, Assistant, GMRobert Mallett Customer Care and Operations
Linda Manley, Board Secretary
I. Call to Order
Ms. Butani called the meeting to order. Mr. Kiely, Assistant General Manager for Customer Care and Operations, indicated that they wanted to call an Executive Session after providing an update on water quality monitoring and the fire hydrants program. The Executive Session would be used to update the Committee on an issue before the fact sheet action items were voted on.
II. Water Quality Monitoring
A. Total Coliform Rule (TCR) Testing
Mr. Kiely stated that he was pleased to report that for the month of September they had 3 coliform positives. Typically what they find in the distribution system after upstream and downstream testing that it was fine and they were not repeated in any of the buildings. It was 1.2 percent, well under the target rule. As the weather gets colder, these things will dissipate and go away. Relatively speaking the distribution system is in excellent shape. Mr. Kiely reported that there has been one positive in October and this is very good. Ms. Butani asked if the positives were all in the same place as last month. Mr. Kiely replied that they were in three locations and those things happen. They took it off the agenda for October but in November they will give a presentation to the Committee on what they do to prevent instances where it happens in buildings. He
DC Water Board of Directors - V. Committee Reports
18

2
noted that these things happen normally in distribution systems. D.C. Water is well under any action level. From a treatment perspective everything is fine.
B. Lead and Copper Rule Monitoring
Mr. Kiely stated that D.C. Water is doing good with the LCR monitoring. In the summer the numbers are usually higher only because the weather gets warmer it can cause some leeching. It was under 4 parts per billion, exceptional for the summer time. Forty-five samples are already collected and twenty-five are waiting to be analyzed. One hundred and fifty have been distributed so far.
III. Fire Hydrant Updating Program
Mr. Kiely reported that Water Services will give a presentation next month and a breakdown of all the outstanding ones. For the month of September out of 9,400 public hydrants that D.C. Water is responsible for, they are at 61 out of service. There were no clusters of out of service hydrants on the map. Everything is in good shape. Mr. Gibbs asked if they had spoken to the Fire Department about any concerns they have with hydrants. Mr. Kiely stated that they still have a technical committee with the Fire Department and they are working with them on some of the issues and concerns as part of the Capital Improvement Program. No problems have been called in about out of service hydrants. They get the same information that is reported and if they call in they go out immediately and make a replacement on that particular hydrant as quickly as possible. Every question that the Committee has raised in the recent past will be reported on next month.
General Counsel Randy Hayman stated that a motion was needed to move into closed session to discuss legal, confident, and privileged matters under D.C. Official Code Section 2-575(b)(4). The motion was moved and seconded. Ms. Manley conducted a roll call vote and the motion was approved unanimously by the Committee members. The Executive Session was held and the meeting moved back in the public session.
The Committee recommended approval of Contract No. 140010, Capitol Paving of D.C., Inc. Management requested removal of the public restoration contract for further consideration.
There being no other questions or concerns, Ms. Butani adjourned the meeting.
DC Water Board of Directors - V. Committee Reports
19

George S. Hawkins General Manager November 2014
Water is life
RM: FY 2014-12
DC Water Board of Directors - Vl. General Manager's Report (George S. Hawkins, General Manager)
20

Table of Contents Executive Summary ............................................................................................................................. I
Message from CFO ....................................................................................................................... ..VII
Organizational Performance Dashboard .............................................................................................. i
Financial Highlights ............................................................................................................................ 1
Financial Performance Summary .............................................................................................................................. 1
Revenues and Operating Expenses ........................................................................................................................... 2
Capital Spending ........................................................................................................................................................ 2
Operating Cash and Receivables ............................................................................................................................... 3
Investment Earnings .................................................................................................................................................. 3
Investment Yield........................................................................................................................................................ 4
Customer Care and Operations Highlights ........................................................................................... 5
Customer Service ...................................................................................................................................................... 5
Fire Hydrants ............................................................................................................................................................. 6
Permit Processing ...................................................................................................................................................... 7
Low Income Assistance Program......................................................................................................... 8
SPLASH Program ........................................................................................................................................................ 8
Customer Assistance Program(CAP) ......................................................................................................................... 8
Operational Highlights ....................................................................................................................... 9
Drinking Water Quality.............................................................................................................................................. 9
Waste Water Treatment ......................................................................................................................................... 10
Water Distribution Operations................................................................................................................................ 11
Water Balance ......................................................................................................................................................... 11
Sewer System Operations ....................................................................................................................................... 12
Combined Sewer System ......................................................................................................................................... 12
Human Resources ................................................................................................................................................... 13
Electricity Usage Summary ...................................................................................................................................... 14
Electricity Usage by Service Area ............................................................................................................................ 14
Safety ...................................................................................................................................................................... 15
Vendor Payments .................................................................................................................................................... 15
Interpretation of Charts .................................................................................................................... A
Color Key
Red Did not meet Target Yellow Missed Target but within acceptable range Green Met/Exceeded Target Gray Budget/Target Value <transparent> Green/Yellow/Red based on comparison
DC Water Board of Directors - Vl. General Manager's Report (George S. Hawkins, General Manager)
21

I
EXECUTIVE SUMMARY
Greetings to the Board. The new fiscal year has jumped off to a blistering start! 2016 Budget We have been fully engaged developing a proposed budget for 2016, along with the associated two year capital disbursement budget, ten year capital improvement plan and ten year financial plan. We have pushed back the presentation of the proposed budget until December because of a host of challenges – and therefore opportunities – that have become even more prominent. The first is the reality of a capital budget where we are spending at or above projected levels after typically being below projected budgets for many years. In 2016 we will be actively engaged on at least four tunneling projects: completing the Blue Plains Tunnel, completing the First Street Tunnel, in the middle of the Anacostia Tunnel, and deep in the planning stages for the Northeast Boundary Tunnel. This work is combined with completing the huge pump station and clarification treatment works at Blue Plains to lift the combined sewage out of the tunnel and up to the clarification facility. The scale of these projects, in concert with reaching the 1% replacement target for water and sewer mains and a host of scheduled capital maintenance projects – means the capital program is still at or near peak spending levels within a ten year progression – which after 2016 thankfully declines in total amount for several years. We are developing these budgets with an eye on several factors: a) reduced consumption by all our customers; b) conclusion of the largest joint-use projects with a greater emphasis on District-only work; and c) a reduction in use by the federal government as it downsizes. Moreover, we are adding substantial new resources that are covered by our operating budgets as the reality of managing nearly 20,000 new assets works its way through the system and our costs. Finally, we are very mindful of the concerns of our lower income customers, which become even more important as costs and rates increase. Working through these issues does present us with many opportunities to save funds and improve service – but we do need some additional time to be thoughtful, prudent and accurate. We look forward to presenting the fruits of our labors to the Board in December. Financing the Budget On October 21, in a difficult and volatile market, DC Water issued approximately $377 million refunding bonds to refinance existing debt with lower interest rates, saving DC Water ratepayers in excess of $50 million over the life of the bonds. In present value (PV) dollars, the transaction generated over $35 million (or 10%) of PV savings. DC Water’s historic century green bond transaction from this past summer was awarded The Bond Buyer’s 2014 Regional Deal of the Year Award and we’re a finalist for the National Award! Green Infrastructure I am glad to report that we are finally entering into negotiations with the US Environmental Protection Agency and US Department of Justice to finalize (we hope) our proposal to modify the Clean Rivers tunneling plan for the Potomac and the Rock Creek to highlight the role and importance of Green Infrastructure. In short, we would like to build green infrastructure on roads, other public spaces and roofs – generating all sorts of immediate water, air and community benefits – and downsize the Potomac Tunnel and eliminate the Piney Branch Tunnel. We are working closely with our brethren at the District Department of the Environment and the
DC Water Board of Directors - Vl. General Manager's Report (George S. Hawkins, General Manager)
22

II
EXECUTIVE SUMMARY
City Administrator’s office to come to a final arrangement with the federal government, taking into account the extensive public comment we received earlier this year. I hope I will have much to report in time for the December Board meeting! PILOT, ROW and Bloomingdale MOUs These three agreements collectively represent the successful resolution of years of on-going negotiations with the District. The PILOT resolves all outstanding disputes and establishes a new schedule of payments that will save DC ratepayers in excess of $130 million over the next 10 years and already resulted in a reduction in FY15 rates by over 1%. The ROW removes the uncertainty and risk associated with this payment and establishes a fixed payment over the next 10 years. The Bloomingdale agreement establishes a capital contribution by the District to DC Water of approximately $58 million to remediate flooding in the LeDroit Park and Bloomingdale neighborhoods of the District. Government Relations DC Water is developing comments on EPA’s proposed definition of “Waters of the United States”, which ultimately determines the scope of the Agency’s regulatory authority under the Clean Water Act. The comment period has been extended to November 14, 2014. The proposed definition is one of the more controversial regulatory proposals in years. Critics claim the proposal is an overreach by EPA while supporters believe the proposal will provide more regulatory certainty by clarifying the definition. DC Water is generally in favor of the rule, however there is a need to clarify several sections of the proposal to avoid what we believe would be unintended consequences for DC Water’s operations. The rule is likely to be finalized in close to its present form before the last days of the Obama administration. External Affairs Website Session totals for the period of September 16, 2013 through October 15, 2014:
• Total Sessions: 76,334 • Total New Sessions: 41,117
Media Relations Media coverage and inquiries included:
• V Street water main repairs • Pharmaceutical take-back day • Refunding bond sale • Biodiesel in fleet • Bravo for the Anacostia Watershed Society (GM George Hawkins a speaker) • Anaerobic digestion of biosolids • Toast to Tap event • Nutrient reduction • The following press releases and media or traffic advisories were issued:
o October 14: M Street Restoration Work Begins October 14 o October 10: Manhole Repair Inside of Rock Creek Park to Begin On or About
October 15 o October 3: MEDIA ADVISORY: DC Water to Issue Revenue Refunding Bonds
DC Water Board of Directors - Vl. General Manager's Report (George S. Hawkins, General Manager)
23

III
EXECUTIVE SUMMARY
o October 3: Extensive Construction Activities will take place at 4th Street NE and Rhode Island Avenue NE
o October 2: "Toast to Tap" Event to Celebrate Value of Safe Drinking Water for Our Health and Local Economy
o September 29: MEDIA ADVISORY: "Toast to Tap" Event to Celebrate Value of Safe Drinking Water for Our Health and Local Economy
o September 25: National Drug Take Back Day Promotes Safe Communities and Water Supplies
o September 18: Construction and Road Closures Continue on Beach Drive NW o September 17: DC Water to participate in “PARK(ing) Day” to promote benefits of
green infrastructure Award Entries (Strategic Plan Initiative 2.1.3)
• OEA submitted an award entry to the AWWA award program for Public Communications for its work in recent years.
• OEA working with departments (Clean Rivers, Wastewater) to submit NACWA Environmental Achievement Awards.
• DC Water was notified that we won the following awards: o Membership of the Year Awards, The Greater Washington Region Clean Cities
Coalition, Awarded: October 31, 2014 o Legal Champions, WBJ: Randy Hayman, Awarded: October 28, 2014 o Chamber of Commerce Business Leader of the Year: George Hawkins, Awarded:
October 25, 2014 Customer Newsletter The October customer newsletter was the fall issue of the Clean Rivers Project News, the bi-annual update on DC Water’s CSO control efforts. The front page story described the update on the First Street Tunnel, including four sub-projects. Inside, there were updates on the tunneling project for the Anacostia River, with Lady Bird’s progress as well as an introduction to the newest TBM. The standard FAQs required by consent decree were included as well as a discussion of green infrastructure projects at DC Water facilities. Community Meetings/Press Events
• DC Water held the seventh of this year’s “Water Wednesdays” Taste Test Challenges, in Ward 7, at the intersection between Pennsylvania Avenue SE, Minnesota Avenue SE and L’Enfant Square SE. There were 103 participants who took the challenge.
• As a creative way in which to highlight its innovative Green Infrastructure program during this year’s Park(ing) Day event, DC Water erected a temporary park in front of 1227 Wisconsin Avenue NW to demonstrate various ‘greening’ techniques that can be followed to help with stormwater management at home, and other useful benefits.
• DC Water participated in the annual H Street Festival, providing the Misting Tent, Cooling Station, “Wendy the Water Drop” Mascot, Quench Buggy, literature and giveaways.
• DC Water participated in the annual Fiesta DC Festival, providing the misting tent, cooling Station, “Wendy the Water Drop” mascot, Quench Buggy, literature and giveaways.
DC Water Board of Directors - Vl. General Manager's Report (George S. Hawkins, General Manager)
24

IV
EXECUTIVE SUMMARY
• DC Water held the eighth of this year’s “Water Wednesdays” Taste Test Challenges, in front of the Ward 8 Constituent Services Building, located at 2100 Martin Luther King, Jr. Avenue SE. There were 86 participants who took the challenge.
• In support of the Clean Rivers-Northeast Boundary Tunnel Project, DC Water hosted a public meeting for ANC 6E residents to provide important information on the future construction staging area at Cooper Gordon Park, located at the intersection between 6th Street NW, R Street NW and Rhode Island Avenue NW, and also the proposed plan for permanent restoration at the park upon completion of the project.
• In support of the Clean Rivers-Northeast Boundary Tunnel Project, DC Water attended the monthly meeting of ANC 6E to provide important information on the future construction staging area at Cooper Gordon Park, located at the intersection between Sixth Street NW, R Street NW and Rhode Island Avenue NW, and also the proposed plan for permanent restoration at the park upon completion of the project.
• For a third consecutive year, DC Water’s outreach team and Waterdrop mascot rose at the wake of dawn to greet bright-eyed youngsters at Lincoln Park as they received goodies and photo opportunities with Wendy the Waterdrop during the annual Walk-To-School Day event.
Drinking Water Marketing and Communications
• Issued a joint press release with Metropolitan Washington Council of Governments, District Department of Health, regional law enforcement officials, and regional water/wastewater utilities to promote National Prescription Drug Take Back Day on Sept. 27.
• Participated in the U.S. Environmental Protection Agency’s Water Sense Partner Marketing webinar.
• Joined the Drinking Water Division and Washington Aqueduct wholesale customers for the quarterly water quality meeting.
• Participated in the U.S. Environmental Protection Agency’s Water Research Webinar: Pharmaceutical Residues in Municipal Wastewater.
• Hosted ‘Toast to Tap’ in partnership with the U.S. Environmental Protection Agency, regional water utilities, and national water organizations to commemorate the 40th anniversary of the Safe Drinking Water Act and to celebrate the value of safe water in the metro region.
• Promoted TapIt Metro D.C. and household water quality at the annual Arnold and Porter Health and Fitness Fair.
• Chaired the monthly meeting for the regional Community Engagement Campaign committee.
Tours
• Mixed group - engineering students from Puerto Rico, ANC commissioner, two DC residents
• 18 guests from COG Chesapeake Bay & Water Resource Policy Committee • 6 guests from Service Source • 62 Notre Dame University students • 4 guests from Singapore PUB Delegation • 44 University of Maryland graduate students
DC Water Board of Directors - Vl. General Manager's Report (George S. Hawkins, General Manager)
25

V
EXECUTIVE SUMMARY
• 6 team members from IT department • 3 graduate students from John Hopkins University Whiting School of Engineering • 24 students environmental health from University of Maryland • 5 guests from ANC 8D04 and two University of Washington graduate students • 8 students from American University- Office of Sustainability
Social Media DC Water’s new Digital Communications Manager Andy Le is onboard and already working to expand the Authority’s social media presence. Twitter is currently the main point of digital engagement. Andy has set a baseline for growth at 250 followers/month but we’re currently closer to 300 new followers a month. Our Facebook has low levels of engagement. We’ll continue to look for and create interesting content to attract more traffic. We’ll also begin to look for more ways to publicize our social presence. Our Instagram (IG) had a very small following but it is easily our greatest avenue for growth. IG is still relatively new to government agencies and is still growing in popularity. At our current growth rate, we’ll be past 1,000 followers by next summer, which would easily put us ahead of any other utility. It’s also a great tool to reach younger ratepayers and tell our “green” story. Much of DC Water’s work translates visually. Two weeks ago, we began a photo essay project that will tell our Tap Water story which is Storified here: http://bit.ly/tapwaterstory. We are now doing another photo essay on the Anacostia Watershed as a way to talk about our Clean Rivers project. Social Media Stats (Past 30 Days)
• Twitter - o 298 new followers (7,635 total followers) o 478 @Mentions (Coarse measurement for responsiveness) o 298 Retweets (Coarse measurement for content resonance with audience) o 112 Clicks on links o Our analytics tool, Sprout Social, gives us a score of 100/100 for influence and
75/100 for engagement. • Facebook -
o 38 new fans - (1,655 total) 50.5K impressions (Total possible views) by 24,000 Users (Total possible viewers)
o Engagement Points or Facebook Stories - Anytime a user interacts with (e.g. Likes, Shares, Comments, Tags) a piece of content that we post on Facebook.
o 734 Stories by 561 Users • Instagram -
o 87 new followers - 128 Total o 246 Likes o 8 Comments
DC Water Board of Directors - Vl. General Manager's Report (George S. Hawkins, General Manager)
26

VI
EXECUTIVE SUMMARY
Internal Communications • The Office of External Affairs is working closely with the Office of Emergency
Management, the Department of Occupational Safety and health to monitor the Ebola pandemic and communicate information to employees to educate them and also dispel myths. As part of the communication strategy, the Office of External Affairs is working with IT to develop a page on Pipeline, the DC Water intranet to house Ebola-related information.
• The Office of External Affairs is working with the Department of Occupational Safety and Health to launch a safety video contest. Employees are challenged to develop original videos about safety, with messages about the importance of safety at work and at home. The contest ends Nov. 21 and the winner will receive a prize.
• As a supplement to FOCUS, the Office of External Affairs developed a video featuring small craft operator Chris Jones. In the video, Jones talks about how his views of the Anacostia River have changed as a result of his work at DC Water. The video was shared with external audience via social media platforms and was featured in the weekly newsletter of the Interstate Commission on the Potomac River Basin. http://youtu.be/KAjYlAdFdp0?list=UU3vIgap-mWgptYeW-gnlDPw
• The October issue of FOCUS includes stories about the completion of the Enhanced Nitrogen Removal Facility and a feature about Gregory Stephens, who was among the first class of professional operators recognized by the Association of Boards of Certification.
DC Water Board of Directors - Vl. General Manager's Report (George S. Hawkins, General Manager)
27

VII
SUMMARY OF FINANCIAL ACTIVITIES FROM THE CFO
DC Water ended FY 2014 with revenues above budget, estimated operating expenditures within budget and capital expenditures higher than expectations. The year-to-date actual numbers below are estimates and subject to change based on results of the audit and annual financial report. Operating Revenues & Receipts Cash receipts totaled $484.5 million, or 104 percent of the revised FY 2014 budget of $467.2 million. Several categories of customers make payments on a quarterly basis, including the Federal and District governments, and wholesale customers. Operating Expenditures Operating expenditures (including debt service and the right of way and PILOT fees) totaled $422.8 million, or 96 percent of the revised FY 2014 budget of $441.7 million. These numbers include estimated, incurred but unpaid, invoices and are subject to results of the final year end close out process. Capital Disbursements The year to date actual disbursements totaled $682.3 million or approximately 23 percent over the revised FY 2014 disbursements budget of $557.1 million. The spending variance is higher by $125.1 million due to higher spending in the Wastewater and Combined Sewer Overflow service areas as previously reported. Cash Reserves and Investments The operating reserve balance was $157.6 million as compared to the FY 2014 operating reserve level objective of $125.5 million. The balances in the Rate Stabilization and DC PILOT funds are $22.5 million and $30.1 million, respectively, while the DC ROW fund is at $5.1 million. The CSO LTCP Appropriations Account balance is $32.3 million. Public Financial Management – Asset Management (PFAM) invested approximately $60 million of operating reserve funds and will manage the proceeds from the 2014A&B bond sales. Overall Portfolio Performance DC Water’s total investment portfolio performed well and complied with the Authority’s Investment Policy. Returns exceeded the established benchmarks for short term (less than one year) and core (one plus years) funds. Operating funds interest income for September (on a cash basis) was $36,806, with year-end totals of $330,916 as compared to the budget of $380,527 for the year. Grants Report The Authority receives grants to fund a portion of its capital costs from the U.S. Environmental Protection Agency (EPA) under two acts, the Clean Water Act of 1972 and the Safe Drinking Water Act of 1974. As of September 30, 2014, including the CSO appropriation, DC Water has a total of $326.8 million awarded in federal funds for active projects. In FY 2014, EPA funding allocation for the District included $6.8 million in Clean Water and $8.8 million in Safe Drinking Water.
DC Water Board of Directors - Vl. General Manager's Report (George S. Hawkins, General Manager)
28

VIII
SUMMARY OF FINANCIAL ACTIVITIES FROM THE CFO
DC Water received the fifteenth Congressional CSO appropriation in June 2014, increasing the cumulative federal appropriation to $196.8 million. The cumulative CSO appropriation life-to-date cash disbursement request for reimbursement is $195.7 million through September 30, 2014. Based on the projected FY 2014 and FY 2015 capital spending on the Clean Rivers’ projects and no additional funding, all remaining CSO funds including interest is projected to be depleted before the end of FY 2015. Accounts Payable Performance During the fiscal year 2014, a total of 17,847 vendor payments were processed and paid compared to 12,251 in FY 2013. Approximately 99.1% of the invoices in FY 2014 were paid within 30 days, compared to 95.7% for FY 2013. The Authority’s goal is to pay 97 percent of all undisputed invoices within 30 days. Highlights:
• The audit of the FY 2014 Financial Statements is currently underway and will be conducted in accordance with auditing standards generally accepted in the U.S.
• The GM’s proposed FY 2016 budget, 10-year CIP and 10-year Financial Plan are currently being prepared.
DC Water Board of Directors - Vl. General Manager's Report (George S. Hawkins, General Manager)
29

ORGANIZATIONAL PERFORMANCE DASHBOARD (SEPTEMBER, 2014)
Financial Highlights
Net Operating Cash
Actual 71842Target 38316
( $ tho )
Operating Revenues
Actual 485Target 467
( $ mil )
Operating Expenses
Actual 423Target 442
( $ mil )
Capital Disbursements
Actual 682Target 557
( $ mil )
Operating Cash Balance
Actual 169Target 126
( $ mil )
Delinquent Account Receivables
Actual 1Target 3
( % )
Core Investments Yield
Actual 0.6Target 0.51
( % )
Short Term Investment Yield
Actual 0.41Target 0.03
( % )
Customer Care and Operations Highlights
Call Center Performance
Sep
8685 (% of calls rec)
Command Center Performance
Sep
9285 (% of calls rec)
First Call Resolution
Sep
9875 (% of calls rec)
Emergency Response Time
Sep
9290 (% of calls rec)
Fire Hydrants out of Service
Sep
6196 ( count )
Fire Hydrant Inspection
0( count )
Fire Hydrants Repaired
7( count )
Fire Hydrants Replaced
Sep
185250 ( YTD count )
Permit Processing within SLA
92( % )
Low Income Assistance Program
Splash Contributions
Actual 116Target 80
( $ tho )
Customer Assistance Program
Previous 107Current 95
( $ tho )
Operational Highlights
Lead Concentration
0
2550
75( ppb )
Total Coliform Rule
0
24 6
8
( % )
Biosolids Production
1092( wet tons )
Total Nitrogen
0
24 6
8
( lbs /yr mil )
Plant Influent Flow
0
250500
750( ga l mil )
Excess Flow
4( gal mil )
Water Main Leaks
23( count )
Water Valve Leaks
0( count )
Non-Revenue Water
Sold 10Purchased 13
( CCF mil )
Sewer Main Backups
6( count )
Sewer Lateral Backups
158( count )
Dry Weather CSO
0( events )
Recruitment Activity
Filled 25Open 127
( count )
Electricity Usage
23496(MWh)
Employee Lost Time Accidents
15( count )
Vendor Payments
Actual 98Target 97
( % )
Page i
DC Water Board of Directors - Vl. General Manager's Report (George S. Hawkins, General Manager)
30

FINANCIAL PERFORMANCE SUMMARY
REVENUE , EXPENDITURE, CAPITAL DISBURSEMENT
467 485442
423 557 682
4% 4%
(23%)
0
100
200
300
400
Am
ount
( M
illio
ns $
)
Revenues Expenditures Capital Disbursements
(25%)
0%
25%
Var
ianc
e (%
)
(Cumulative Revenue, Expenditure & Capital Disbursements compared to Budget)Budget FY-2014 (in millions) - RevisedActual YTD Totals FY-2014 (in millions)Variance % : favorable / (unfavorable)
Year to Date Analysis
122%83%
96%90%
104%103%
100%100%
Capital Disbursements
Expenditures
Revenues
Budget Period Elapsed
0% 10% 20% 30% 40% 50% 60% 70% 80% 90% 100% 110%
FY-2013 Ratio (%) FY-2014 Ratio (%)
NET OPERATING CASH
11,456 11,220
1,447
(220)
10,046
(989)
1,154
10,017
(3,129)
951
23,234
6,6553,193
6,3869,579
12,77215,965
19,15822,351
25,54428,737
31,93035,123
38,316
11,456
22,676 24,123 23,903
33,949 32,960 34,114
44,13141,002 41,953
65,187
71,842
(10,000)
0
10,000
20,000
30,000
40,000
50,000
60,000
70,000
80,000
Am
ount
(in
000'
s $)
Oct Nov Dec Jan Feb Mar Apr May Jun Jul Aug Sep
Net cash to date for September was above budget by $34 Million
(Monthly and YTD Net Operating Cash Provided / Used compared to Budget)
Monthly Net Cash Provided/Used (in 000's)YTD Cumulative Net Cash FY-2014 (in 000's)YTD Budget FY-2014 (in 000's)
FINANCIAL HIGHLIGHTS
Page 1
DC Water Board of Directors - Vl. General Manager's Report (George S. Hawkins, General Manager)
31

REVENUES AND OPERATING EXPENSES
OPERATING REVENUES
46.4 46.2 27.7 36.5 43.7 32.6 43.2 42 28.8 40.2 58.4 38.838.9
77.9
116.8
155.7
194.7
233.6
272.5
311.5
350.4
389.3
428.3
467.2
46.4
92.6
120.3
156.8
200.5
233.1
276.3
318.3
347.1
387.3
445.7
484.5
0
100
200
300
400
500
Am
ount
(M
illio
ns $
)
Oct Nov Dec Jan Feb Mar Apr May Jun Jul Aug Sep
Revenue to date for September was above budget by $17 Million
Monthly & Cumulative Revenue compared to YTD Budget
Actual Monthly RevenueYTD Cumulative Revenue FY-2014YTD Cumulative Budget FY-2014
OPERATING EXPENSES
31.9 31.3 34 38 37 37.7 35.7 33.8 37.4 34.1 33 38.936.8
73.6
110.4
147.2
184
220.9
257.7
294.5
331.3
368.1
404.9
441.7
31.9
63.2
97.2
135.2
172.2
209.9
245.6
279.4
316.8
350.9
383.9
422.8
0
100
200
300
400
500
Am
ount
(M
illio
ns $
)
Oct Nov Dec Jan Feb Mar Apr May Jun Jul Aug Sep
Expenditure to date for September was below budget by $19 Million
Monthly & Cumulative Expenditure compared to YTD Budget
Actual Monthly ExpensesYTD Cumulative Expenditure FY-2014YTD Cumulative Budget FY-2014
CAPITAL SPENDING
CAPITAL DISBURSEMENTS
78.734.1
80.336.2 52.7 37.7
81.7 60 46.278.7
35.7 60.3
57.1
116.2
176
232
278.6
322.5
365.6
403.1
440.2
482.4
520.4
557.1
78.7
112.8
193.1
229.3
282
319.7
401.4
461.4
507.6
586.3
622
682.3
0
100
200
300
400
500
600
700
Am
ount
(M
illio
ns $
)
Oct Nov Dec Jan Feb Mar Apr May Jun Jul Aug Sep
Disbursements to date for September were above budget by $125 MillionDisbursements to date for September were above budget by $125 Million
Monthly & Cumulative Disbursements compared to YTD BudgetActual Monthly DisbursementsYTD Cumulative Disbursements FY-2014YTD Cumulative Budget FY-2014
FINANCIAL HIGHLIGHTS
Page 2
DC Water Board of Directors - Vl. General Manager's Report (George S. Hawkins, General Manager)
32

OPERATING CASH AND RECEIVABLES
OPERATING CASH BALANCE
157
176180 180 178 176 173 171 169 168 169 169
0
25
50
75
100
125
150
175
200
Am
ount
(M
illio
ns $
)
Oct Nov Dec Jan Feb Mar Apr May Jun Jul Aug Sep
Cash Balance for September was above target by $43 millionCash Balance for September was above target by $43 million
Average Daily Cash Balance compared to Operating Reserve Target
Actual Cash BalanceOperating Reserve Target - (126 Million)
DELINQUENT ACCOUNT RECEIVABLES
1.39% 1.48% 1.51% 1.56% 1.53% 1.57% 1.48% 1.51% 1.48% 1.45% 1.41% 1.42%
4.945.28 5.44 5.6 5.55 5.72
5.41 5.52 5.53 5.36 5.2 5.33
0%
1%
2%
3%
4%
Rec
eiva
bles
to R
even
ueR
atio
(%
)
Oct Nov Dec Jan Feb Mar Apr May Jun Jul Aug Sep
4
6
8
Del
inqu
ency
(Mill
ions
$)
September Receivables to Revenue Ratio 1.4%, Delinquency $5.3 MillionSeptember Receivables to Revenue Ratio 1.4%, Delinquency $5.3 Million
Delinquency & Receivables to Revenue Ratio compared to Target
Receivables to Revenue RatioDelinquencies (in millions)Target: Receivables to Revenue Ratio (3%)
INVESTMENT EARNINGS
INVESTMENT CASH EARNINGS
6 11 4
133.4
48.7
26 6.7 15.7 32.3 2.5 7.936.9
32
64
96
128
160
192
224
256
288
320
352
384
617 21
154.4
203.1
229.1 235.8251.5
283.8 286.3 294.2
331.1
0
100
200
300
400
Am
ount
(in
000
's $
)
Oct Nov Dec Jan Feb Mar Apr May Jun Jul Aug Sep
Earnings to date for September were below Projected Budget by $53,000Earnings to date for September were below Projected Budget by $53,000
Monthly & Cumulative Earnings compared to YTD Budget
Monthly Earnings (in 000's)YTD Cumulative Earnings FY-2014 (in 000's)YTD Cumulative Earnings Budget FY-2014 (in 000's)
FINANCIAL HIGHLIGHTS
Page 3
DC Water Board of Directors - Vl. General Manager's Report (George S. Hawkins, General Manager)
33

INVESTMENT YIELD
CORE INVESTMENTS YIELD
0.33
0.42
0.32
0.42
0.32
0.37
0.4
0.41
0.36
0.51
0.35
0.48
0.44
0.48
0.42
0.48
0.39
0.48
0.45
0.54
0.48
0.56
0.51
0.6
0
0.1
0.2
0.3
0.4
0.5
0.6
0.7
Inve
stm
ent Y
ield
(%
)
Oct Nov Dec Jan Feb Mar Apr May Jun Jul Aug Sep
Yield for September was higher than the treasury index by 0.09%
Monthly Yield compared to Merrill Lynch Benchmark
Actual Monthly Yield (%)Merrill Lynch 1-3 Year Treasury Index - Book Value (%)
SHORT TERM INVESTMENT YIELD
0.01
0.32
0.04
0.34
0.07
0.33
0.06
0.31
0.04
0.32
0.04
0.33
0.01
0.38
0.2
0.45
0.04
0.73
0.03
0.29
0.03
0.35
0.03
0.41
0
0.1
0.2
0.3
0.4
0.5
0.6
0.7
0.8
Shor
t Ter
m Y
ield
(%
)
Oct Nov Dec Jan Feb Mar Apr May Jun Jul Aug Sep
Short Term Yield for September was above than the Merill Lynch yield by 0.38%
Short Term Yield compared to Merrill Lynch Benchmark
Actual Monthly Yield (%)Merrill Lynch 3-Month Treasury Index - Book Value (%)
FINANCIAL HIGHLIGHTS
Page 4
DC Water Board of Directors - Vl. General Manager's Report (George S. Hawkins, General Manager)
34

CUSTOMER SERVICE
CALL CENTER PERFORMANCE
94%86% 85% 83% 83%
87%81% 84% 87% 87% 85% 86%
11.51 11.32
14.515.7
13.7 13.12
16.514.2 14.52 15.36 14.37 14.89
0%
25%
50%
75%
100%
Perc
ent o
f C
alls
Ans
wer
ed
Oct Nov Dec Jan Feb Mar Apr May Jun Jul Aug Sep
0
10
20
Num
ber
ofC
alls
Rec
eive
d(i
n 00
0's)
Performance for September was above target by 1%
Calls Answered within 40 Seconds compared to Target
Call Center: Calls answered (%)No of Calls - Call Center (in 000's)Target -Call Center (85%)
COMMAND CENTER PERFORMANCE
95% 96% 96%
80%
94%86%
81% 84%89%
93% 92% 92%
3.1 2.9 3.8
9.1
3.8 3.9 3.5 3.7 3.8 3.3 3.2 3
0%
25%
50%
75%
100%
Perc
ent o
f C
alls
Ans
wer
ed
Oct Nov Dec Jan Feb Mar Apr May Jun Jul Aug Sep
0
10
20
Num
ber
ofC
alls
Rec
eive
d(i
n 00
0's)
Performance for September was above target by 7%
Calls Answered within 40 Seconds compared to Target
Command Center: Calls answered (%)No of Calls - Command Center (in 000's)Target -Command Center (85%)
FIRST CALL RESOLUTION (FCR)
82%83%
81% 80% 81% 80% 80% 79% 79%
90%
79%
98%
0%
25%
50%
75%
100%
Perc
ent o
f FC
R C
alls
Res
olve
d
Oct Nov Dec Jan Feb Mar Apr May Jun Jul Aug Sep
Performance for September was above target by 23%
Calls resolved on first contact compared to Target
FCR (%)FCR Target (75%)
EMERGENCY RESPONSE TIME
82%
92% 94%
45%
85%93% 90% 90% 92%
97%91% 92%
60 48 62
527
68 67 43 52 39 37 57 36
0%
50%
100%
Em
erge
ncy
Res
pons
ew
ithin
45
Min
utes
(%
)
Oct Nov Dec Jan Feb Mar Apr May Jun Jul Aug Sep
0
500
1,000
Tot
al C
alls
Dis
patc
hed
Performance for September was above target by 2%
Calls responded to within 45 Minutes compared to Target
Response (%) within TargetTotal Emergency Calls DispatchedResponse Target (90%)
CUSTOMER CARE AND OPERATIONS HIGHLIGHTS
Page 5
DC Water Board of Directors - Vl. General Manager's Report (George S. Hawkins, General Manager)
35

FIRE HYDRANTS
FIRE HYDRANTS OUT OF SERVICE (OOS)
70
58
74
57
60
59
69
60
76
52
75
51
70
61
74
66
79
61
71
58
62
61
61
64
0
25
50
75
100
125
150
Hyd
rant
sO
ut o
f Se
rvic
e
Oct Nov Dec Jan Feb Mar Apr May Jun Jul Aug Sep
Total Hydrants Out of Service against Target
Out of Service Fire Hydrants (Defective OOS Hydrants)In-Operational - OOS Due to Inaccessibility or TemporaryWorkOut of Service Hydrants Target (96)
FIRE HYDRANT INSPECTION
343
0 0 0 0 0 0 0 0 0 0 0
0
50
100
150
200
250
300
350
Fire
and
EM
S H
ydra
nt I
nspe
ctio
ns
Oct Nov Dec Jan Feb Mar Apr May Jun Jul Aug Sep
Total Hydrants Inspected per Month
Total No of Fire and EMS Hydrant Inspections
FIRE HYDRANT REPAIRS
496
628665
388
654
888
1,470
1,310
948
833
537
0
250
500
750
1,000
1,250
1,500
Fire
Hyd
rant
s R
epai
red
Oct Nov Dec Jan Feb Mar Apr May Jun Jul Aug Sep
Total Hydrants Repaired per Month
Total No of Hydrants Repaired
FIRE HYDRANT REPLACEMENTS
67
20
4
7
23
20
16
27
23
18
14
0
5
10
15
20
25
30
Fire
Hyd
rant
sR
epla
ced
Oct Nov Dec Jan Feb Mar Apr May Jun Jul Aug Sep
Total replacements as of September were 185 against annual projections of 250
Total Hydrants Replaced per Month
Hydrants ReplacedAnnual Replacement Target (250)
CUSTOMER CARE AND OPERATIONS HIGHLIGHTS
Page 6
DC Water Board of Directors - Vl. General Manager's Report (George S. Hawkins, General Manager)
36
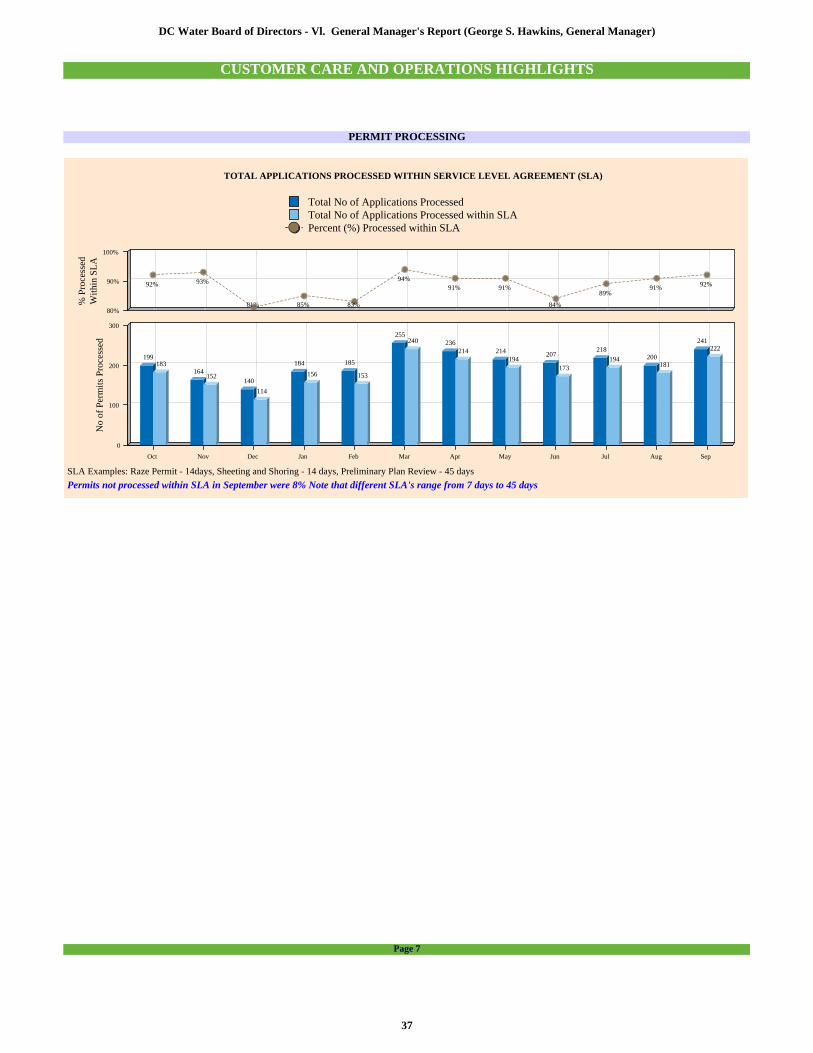
PERMIT PROCESSING
TOTAL APPLICATIONS PROCESSED WITHIN SERVICE LEVEL AGREEMENT (SLA)
199183
164152
140
114
184
156
185
153
255240 236
214 214194
207
173
218
194 200181
241222
92% 93%
81% 85% 83%
94%91% 91%
84%
89%91% 92%
0
100
200
300
No
of P
erm
its P
roce
ssed
Oct Nov Dec Jan Feb Mar Apr May Jun Jul Aug Sep
80%
90%
100%
% P
roce
ssed
With
in S
LA
Permits not processed within SLA in September were 8% Note that different SLA's range from 7 days to 45 days
SLA Examples: Raze Permit - 14days, Sheeting and Shoring - 14 days, Preliminary Plan Review - 45 days
Total No of Applications ProcessedTotal No of Applications Processed within SLAPercent (%) Processed within SLA
CUSTOMER CARE AND OPERATIONS HIGHLIGHTS
Page 7
DC Water Board of Directors - Vl. General Manager's Report (George S. Hawkins, General Manager)
37

SPLASH PROGRAM
SPLASH CONTRIBUTIONS
7 11 10 10 8 11 9 12 9 9 9 10713
20
27
33
40
47
53
60
67
73
80
7
18
29
39
47
58
67
79
88
96
106
116
0
25
50
75
100
125
Am
ount
(in
000
's $
)
Oct Nov Dec Jan Feb Mar Apr May Jun Jul Aug Sep
Total SPLASH Contributions to date for September were above target by $36,000
Monthly and Cumulative Contributions compared to YTD Target
Monthly Contributions (in 000's)YTD Cumulative Contributions FY-2014 (in 000's)Projected YTD Target FY-2014 (in 000's)
CUSTOMER ASSISTANCE PROGRAM (CAP)
CUSTOMER ASSISTANCE PROVIDED
61
53
1 6 13
40
130
36
103 101
133
83
132
102 101
158
144147
142
160
135
148
107
95
0
25
50
75
100
125
150
175
Am
ount
(in
000
's $
)
Oct Nov Dec Jan Feb Mar Apr May Jun Jul Aug Sep
Monthly Assistance Provided compared to corresponding Previous Year Periods
Actual Monthly Amount - Previous Year (in 000's)Actual Monthly Amount - Current Year (in 000's)
LOW INCOME ASSISTANCE PROGRAM
Page 8
DC Water Board of Directors - Vl. General Manager's Report (George S. Hawkins, General Manager)
38

DRINKING WATER QUALITY
LEAD AND COPPER RULE (LCR) COMPLIANCE
4
6
2
4
15 15
0
5
10
15
20
90th
Per
cent
ile L
ead
Res
ults
(pp
b)
Jan-Jun Jul-Dec
Jul-Dec 2014 results to date
Semi-Annual LCR Monitoring Results
2013 LCR Results2014 LCR ResultsAction Level : 15 parts per billion (ppb)
TOTAL COLIFORM RULE (TCR)
0 0 0 0 0 0 0
0.8 0.8
0 0
1.2
5 5 5 5 5 5 5 5 5 5 5 5
0
1
2
3
4
5
TC
R %
Oct Nov Dec Jan Feb Mar Apr May Jun Jul Aug Sep
Coliform Positives were recorded in September at 1.2%
Total Coliform Positives compared to EPA Maximum Contaminant Level (MCL)
TCR LevelEPA Maximum Contaminant Level (5%)
OPERATIONAL HIGHLIGHTS
Page 9
DC Water Board of Directors - Vl. General Manager's Report (George S. Hawkins, General Manager)
39

WASTEWATER TREATMENT
BIOSOLIDS PRODUCTION
1,148
967
1,128
1,0661,123
1,003
1,1131,086
1,240
1,109
967
1,092
0
200
400
600
800
1,000
1,200
1,400
Bio
solid
s (w
et to
ns p
er d
ay)
Oct Nov Dec Jan Feb Mar Apr May Jun Jul Aug Sep
Biosolids Average Daily Production for September was 1092 wet tons per day
Average Daily Biosolids Production
Average Daily Biosolids Hauled
TOTAL NITROGEN
3.23.4 3.3
3.53.7
4 4 4.1 4.2 4.4 4.44.1
0
5
10
Nitr
ogen
Lev
el(i
n m
illio
n po
unds
per
yea
r)
Oct Nov Dec Jan Feb Mar Apr May Jun Jul Aug Sep
Nitrogen level for September was below permit by 4.3 million lbs/yr
Total Nitrogen compared to Current and 2015 Permit Levels
Nitrogen Rolling 12 months (lbs/yr)Proposed Limit for 2015 - 4.38 Million (lbs/yr)Current Permit Limit - 8.47 Million (lbs/yr)
PLANT INFLUENT FLOW
284
264
303298
327319
335
351
316
288
271263
200
225
250
275
300
325
350
375
400
Infl
uent
Flo
w (
MG
D)
Oct Nov Dec Jan Feb Mar Apr May Jun Jul Aug Sep
In September, influent flow was below design by 107 MGD
Influent Flow compared to Plant Design Average Limit
Influent FlowDesign Average (370 mgd)
EXCESS FLOW
210
68
106
56
71
159
286 287
14 15
43
4
210
68
106
56
71
159
286 287
14 15
43
4
0
50
100
150
200
250
300
Exc
ess
Flow
(M
G)
Oct Nov Dec Jan Feb Mar Apr May Jun Jul Aug Sep
4 Million Gallons per day excess flow were recorded in September 2014
Excess Flow
OPERATIONAL HIGHLIGHTS
Page 10
DC Water Board of Directors - Vl. General Manager's Report (George S. Hawkins, General Manager)
40

WATER DISTRIBUTION OPERATIONS
WATER MAIN LEAKS
12
21
13
32
21
55
38
134
19
62
9
22
1410
13
19
11
25
15
26
13
30
9
23
30 30
60
99 81
31
12 1425
18
3625
0
25
50
75
100
125
150
Lea
ks R
epor
ted
Oct Nov Dec Jan Feb Mar Apr May Jun Jul Aug Sep
0
100
Lea
ksR
epai
red
There were 23 main leaks reported in September
Pending Main Leaks Main Leaks ReportedMain Leaks Repaired
WATER VALVE LEAKS
11
1
12
1
10
2
11
2
11
1
11
0
12
2
15
3
15
1
13
1
00 00
3
2 2
1
0
1 1
0
4
1
0 0
0
5
10
15
20
Lea
ks R
epor
ted
Oct Nov Dec Jan Feb Mar Apr May Jun Jul Aug Sep
0
5
Lea
ksR
epai
red
No leak was resolved in September
Pending Valve Leaks Valve Leaks ReportedValve Leaks Repaired
WATER BALANCE
NON-REVENUE WATER
11.04
7.8
10.76
7.88
11.86
8.32
12.75
9.92
7.21 7.21 7.417.7 7.56 7.386.89
1
3
5
7
9
11
13
Wat
er (
in m
illio
n cc
f)
Quarter1 Quarter2 Quarter3 Quarter4
5
10
ILI
Inde
x
In the fourth quarter 9.9 out of 12.8 million cubic feet of water was sold
Volume of Water Purchased and Sold per Quarter
FY-2014: Water PurchasedFY-2014: Water SoldFY-2013: Infrastructure Leakage IndexFY-2014: Infrastructure Leakage Index
OPERATIONAL HIGHLIGHTS
Page 11
DC Water Board of Directors - Vl. General Manager's Report (George S. Hawkins, General Manager)
41

SEWER SYSTEM OPERATIONS
SEWER MAIN BACKUPS
0
5
0
6
0
3
0
5
0
7
0
5
0
8
0
8
0
6
0
6
0
5
0
6
56
3
5
7
5
8 8
6 65
6
0
2
4
6
8
10
Bac
kups
Rep
orte
d
Oct Nov Dec Jan Feb Mar Apr May Jun Jul Aug Sep
0
10
Bac
kups
Res
olve
d
No pending main backups reported
Sewer Mains Backed Up and Relieved per Month
Pending Main Backups Main Backups ReportedMain Backups Resolved
SEWER LATERAL BACKUPS
0
188
0
185
0
167
0
143
0
153
0
174
0
162
0
182
0
139
0
140
0
202
0
158
188 185 167 143 153 174 162 182139 140
202158
0
50
100
150
200
250
Bac
kups
Rep
orte
d
Oct Nov Dec Jan Feb Mar Apr May Jun Jul Aug Sep
0
200
400
Bac
kups
Res
olve
d
No pending lateral backups reported
Sewer Laterals Backed Up and Relieved per Month
Pending Lateral Backups Lateral Backups ReportedLateral Backups Resolved
COMBINED SEWER SYSTEM
DRY WEATHER CSO EVENTS
0 0 0 0 0 0 0 0 0 0
1
0
0 0 0 0 0 0 0 0 0 0 0 0
0
1
2
3
CSO
Eve
nts
Oct Nov Dec Jan Feb Mar Apr May Jun Jul Aug Sep
0
1
CSO
Vol
ume
(MG
)
No dry weather Combined Sewer Overflow event was recorded in September 2014
Combined Sewer Overflow Volume and No of Events per Month
Number of CSO EventsOverflow Volume (MG)
OPERATIONAL HIGHLIGHTS
Page 12
DC Water Board of Directors - Vl. General Manager's Report (George S. Hawkins, General Manager)
42

HUMAN RESOURCES
RECRUITMENT ACTIVITY
38
7 59
31 3113
2 2
40 4024
10
0
54 54
23
93
65 65
713
1
58 58
6 40
60 60
26
70
79 79
139
0
83 83
1511
3
84 84
28
17
0
95 95
45
5 2
133 133
2025
1
127
0
25
50
75
100
125
150
No
of P
ositi
ons
Oct Nov Dec Jan Feb Mar Apr May Jun Jul Aug Sep
In September, we began the month with 133 positions, received 20 new positions, filled 25, 1 cancellations and ended the month with 127 positions
FY-2014:Rolled Over Open PositionsFY-2014:New Positions AddedFY-2014:Positions FilledFY-2014:Positions CanceledFY-2014:Net Remaining Open Positions
OPERATIONAL HIGHLIGHTS
Page 13
DC Water Board of Directors - Vl. General Manager's Report (George S. Hawkins, General Manager)
43

ENERGY
ELECTRICITY USAGE SUMMARY
20,381 20,755
24,218 24,433
21,796
24,602
21,659 20,95222,862 22,793
21,88323,496
0
5,000
10,000
15,000
20,000
25,000
Con
sum
ptio
n (i
n M
Wh)
Oct Nov Dec Jan Feb Mar Apr May Jun Jul Aug Sep
Electricity Consumption in September was 23,496 MWh
Total Consumption (MWh)
ELECTRICITY USAGE BY SERVICE AREA
17,314 17,328
20,895 20,586
18,344
21,182
18,512 18,126
20,09518,906
17,918
20,533
1,807 2,301 2,130 2,364 1,949 2,131 1,792 1,472 1,484 1,427 1,456 1,724
1,260 1,127 1,194 1,483 1,504 1,289 1,354 1,354 1,283 2,460 2,509 1,2390
5,000
10,000
15,000
20,000
25,000
Con
sum
ptio
n (i
n M
Wh)
Oct Nov Dec Jan Feb Mar Apr May Jun Jul Aug Sep
Wastewater treatment had the highest electricity consumption in September at 20,533 MWh
Sewer Pumping Water Pumping Waste Water Treatment
OPERATIONAL HIGHLIGHTS
Page 14
DC Water Board of Directors - Vl. General Manager's Report (George S. Hawkins, General Manager)
44

SAFETY
EMPLOYEE LOST TIME INCIDENCE RATE
2.6
3.6
4.2
5.7
1.2
5
2.7
4.5
6.5
3.2
4.9
5.6
6
14
7 89
3
12 1311 1318
15
0
5
10
Los
t Tim
eIn
cide
nce
Rat
e
Q1 Q2 Q3 Q4
0
10
20
Los
t Tim
eA
ccid
ents
In the Fourth quarter, 15 lost time accidents were reported
FY-2012: LT Incidence RateFY-2013: LT Incidence RateFY-2014: LT Incidence RateFY-2012: No of LT AccidentsFY-2013: No of LT AccidentsFY-2014: No of LT AccidentsTarget/National: LT Incidence Rate
CONTRACTOR LOST TIME INCIDENCE RATE
0 0 0
10.7
0.3
0
1.4 1.2
0.8
1.2
0.3
0
2
01
0
2
4
3
01
4
1
0
0.5
1
1.5
Los
t Tim
eIn
cide
nce
Rat
e
Q1 Q2 Q3 Q4
0
5
Los
t Tim
eA
ccid
ents
In the Fourth quarter, 1 lost time accident was reported
FY-2012: LT Incidence RateFY-2013: LT Incidence RateFY-2014: LT Incidence RateFY-2012: No of LT AccidentsFY-2013: No of LT AccidentsFY-2014: No of LT Accidents
VENDOR PAYMENTS
VENDOR PAYMENT PERFORMANCE
100% 99% 100% 99% 99% 100% 98% 99% 99% 99% 99% 98%
100% 99% 100% 99% 99% 99% 99% 99% 99% 99% 99% 99%
0%
25%
50%
75%
100%
Mon
thly
Per
form
ance
(%
)
Oct Nov Dec Jan Feb Mar Apr May Jun Jul Aug Sep
0%
50%
100%
YT
DPe
rfor
man
ce (
%)
Monthly performance for September was above target by 1%
Percentage of Invoices Paid within 30 days
Monthly Performance (%)YTD Performance (%)Monthly Target - (97%)
OPERATIONAL HIGHLIGHTS
Page 15
DC Water Board of Directors - Vl. General Manager's Report (George S. Hawkins, General Manager)
45

Dynamic Color Coding Legend * ** Red - when the actual is lower than 3% of budget or target Yellow - when the actual is within 3% of budget or target Green - when the actual is equal to or higher than budget or target
Red - when the actual is higher than 3% of budget or target Yellow - when the actual is within 3% of budget or target Green - when the actual is equal to or lower than budget or target
Symbols where the color code applies- (Δ, □) A
INTERPRETATION OF CHARTS:
FINANCIAL HIGHLIGHTS
Revenue, Expenditure, Capital Disbursement
• Bulls eye shows the variance for YTD budget against actual for revenues, expenditures and capital disbursements • Bar graph shows total for the fiscal year budgeted(grey)-revenues, expenditures and capital disbursements against YTD
actual(blue) • Horizontal line graph shows a YTD progress analysis as compared to the previous year
Net Operating Cash
• Bar graph shows monthly net operating cash provided/used • Line graph denoted by (Δ) compares YTD actual against budget (Ο). This element is dynamically color coded*
Operating Revenues
• Bar graph shows monthly operating revenues • Line graph denoted by (Δ) compares YTD revenue against budget (Ο). This element is dynamically color coded*
Operating Expenses
• Bar graph shows monthly operating expenses • Line graph denoted by (Δ) compares YTD expenditure against budget (Ο). This element is dynamically color coded**
Capital Disbursements
• Bar graph shows monthly capital disbursements • Line graph denoted by (Δ) compares YTD disbursements against budget (Ο). This element is dynamically color coded**
Operating Cash Balance
• Bar graph shows monthly average cash balance compared to the target of $125 million; indicated by grey dotted line Delinquent Account Receivables
• Bar graph shows monthly Receivables to Revenue ratio against target of 3%; indicated by grey dotted line. This element is dynamically color coded**
• Line graph denoted by (Δ) shows delinquency in actual dollars Investment Cash Earnings
• Bar graph shows monthly investment cash earnings • Line graph denoted by (Δ) compares the YTD earnings against budget (Ο). This element is dynamically color coded*
Core Investments Yield
• Bar graph shows the monthly investment yield compared to the monthly target (grey) benchmark as set by the US Treasury Bill. This element is dynamically color coded*
Short Term Investment Yield
• Bar graph shows the monthly short term investment yield compared to the monthly short term target (grey) benchmark as set by the US Treasury Bill. This element is dynamically color coded*
DC Water Board of Directors - Vl. General Manager's Report (George S. Hawkins, General Manager)
46

Dynamic Color Coding Legend *** **** Red- when the actual is lower than 5% of budget or target Yellow- when the actual is within 5% of budget or target Green- when the actual is equal to or higher than budget or target
Red- when the actual is higher than 5% of budget or target Yellow- when the actual is within 5% of budget or target Green- when the actual is equal to or lower than budget or target
Symbols where the color code applies- (Δ, □) B
CUSTOMER CARE AND OPERATIONS HIGHLIGHTS
Call Center Performance
• Bar graph shows monthly percentage of calls answered within 40 seconds against target of 85%; indicated by grey dotted line. This element is dynamically color coded***
• Line graph denoted by (Ο) shows the number of calls received by the call center every month Command Center Performance
• Bar graph shows monthly percentage of calls answered within 40 seconds against target of 85%; indicated by grey dotted line. This element is dynamically color coded***
• Line graph denoted by (Ο) shows the number of calls received by the command center every month First Call Resolution (FCR)
• Bar graph shows monthly percentage of calls resolved on first contact against target of 75%; indicated by grey dotted line. This element is color dynamically coded***
Emergency Response Time
• Bar graph shows the percentage of emergency calls responded to within 45 minutes against target of 90%; indicated by grey dotted line. This element is dynamically color coded***
• Line graph denoted by (Ο) shows the total calls dispatched per month Fire Hydrants Out of Service (OOS)
• Bar graph shows total hydrants not available for use against target of 91; indicated by grey dotted line. This element is dynamically color coded****
• The bar graph is stacked (blue) to show hydrants that are inaccessible. Inaccessible hydrants are not measured against the target of 91
Fire Hydrant Inspection
• Bar graph shows the total number of Fire and EMS hydrant inspections per month Fire Hydrant Repairs
• Bar graph shows the total number of fire hydrants repaired per month Fire Hydrant Replacements
• Bar graph shows the total number of hydrants replaced per month against target of 21; indicated by grey dotted line. This element is dynamically color coded***
Total Applications Processed within Service Level Agreement (SLA)
• Bar graph shows the number of permits processed per month(dark blue) the number of permits processed within SLA per month(light blue)
• Line graph denoted by (Ο) shows the percentage of permits processed vs. processed within SLA
DC Water Board of Directors - Vl. General Manager's Report (George S. Hawkins, General Manager)
47

Dynamic Color Coding Legend *** **** Red- when the actual is lower than 5% of budget or target Yellow- when the actual is within 5% of budget or target Green- when the actual is equal to or higher than budget or target
Red- when the actual is higher than 5% of budget or target Yellow- when the actual is within 5% of budget or target Green- when the actual is equal to or lower than budget or target
Symbols where the color code applies- (Δ, □) C
LOW INCOME ASSISTANCE PROGRAM
SPLASH Contributions • Bar graph shows monthly SPLASH contributions • Line graph denoted by (Δ) shows the YTD contributions against target (Ο). This element is color coded*** Customer Assistance Program (CAP) • Bar graph shows monthly CAP assistance • Line graph denoted by (Δ) shows the YTD contributions against budget (Ο). This element is color coded***
OPERATIONAL HIGHLIGHTS
Lead and Copper Rule (LCR) Compliance • Line graph denoted by (Δ, Ο) shows semi-annual LCR monitoring results against target of 15ppb; indicated by grey dotted line.
This element is color coded**** Total Coliform Rule (TCR) • Line graph denoted by (Δ)shows total coliform positives against the EPA maximum contaminant level of 5%. This element is
color coded**** Biosolids Production • Bar graph shows monthly average daily biosolids production Total Nitrogen • Line graph denoted by (Δ) shows monthly total nitrogen level against the current permit (dark grey) and 2015 permit (light grey)
levels. This element is color coded**** Plant Influent Flow • Line graph denoted by (Δ) shows monthly influent flow against the plant design average limit of 370MGD. This element is color
coded**** Excess Flow • Line graph denoted by (Δ) shows monthly excess flow Water Main Leaks • Bar graph shows the water main leaks reported • The bar graph is stacked(dark blue) to show the pending leaks carried over from the previous month if any; bar graph(light blue)
shows new water main leaks reported for the given month • Line graph denoted by (Ο) shows the number of main leaks repaired per month Water Valve Leaks • Bar graph shows the water valve leaks reported • The bar graph is stacked(dark blue) to show the pending leaks carried over from the previous month if any; bar graph(light blue)
shows new water valve leaks reported for the given month • Line graph denoted by (Ο) shows the number of valve leaks repaired per month
DC Water Board of Directors - Vl. General Manager's Report (George S. Hawkins, General Manager)
48

Dynamic Color Coding Legend *** **** Red- when the actual is lower than 5% of budget or target Yellow- when the actual is within 5% of budget or target Green- when the actual is equal to or higher than budget or target
Red- when the actual is higher than 5% of budget or target Yellow- when the actual is within 5% of budget or target Green- when the actual is equal to or lower than budget or target
Symbols where the color code applies- (Δ, □) D
Non Revenue Water • Bar graph shows the volume of water purchased(dark blue) and water sold(light blue) per quarter • Line graph denoted by (Δ, Ο) shows the Infrastructure Leakage Index(ILI) for the current and previous year Sewer Main Backups • Bar graph shows the sewer main backups reported • The bar graph is stacked(dark blue) to show the pending backups carried over from the previous month if any; bar graph(light
blue) shows new sewer main backups reported for the given month • Line graph denoted by (Ο) shows the number of main backups resolved per month Sewer Lateral Backups • Bar graph shows the sewer lateral backups reported • The bar graph is stacked(dark blue) to show the pending backups carried over from the previous month if any; bar graph(light
blue) shows new sewer laterals backups reported for the given month • Line graph denoted by (Ο) shows the number of lateral backups resolved per month
Combined Sewer dry weather Overflow (CSO) Events • Bar graph shows dry weather CSO events per month • Line graph denoted by (Ο) shows the volume in Million Gallons(MG) per dry weather CSO event Open Positions • Bar graph (dark blue) shows open positions carried over from the previous month. • Bar graph (light blue) shows new positions added in the given month. • Bar graph (olive green) shows positions filled in the given month. • Bar graph (orange) shows positions cancelled in the given month. • Bar graph (light green) shows net remaining open positions at the end of the given month. Electricity Usage Summary • Bar graph shows total electricity consumption per month Electricity Usage by Service Area • Shows a monthly breakdown by service area of electricity usage • Dark blue shows for Waste Water Treatment Service Area • Light blue shows Water Pumping Service Area • Brown shows Sewer Pumping Service Area Employee Lost Time Incidence Rate • Bar graph shows quarterly Employee Lost Time (LT) incidence rate as compared to the National average LT rate of 2.0; indicated
by grey dotted line. Light blue represents the previous year, brown represents the year before previous and dark blue the current fiscal year.
• Scatter graph denoted by (Δ, Ο) shows the number of Lost Time accidents and comparison is also made between the current year and the previous years.
Contractor Lost Time Incidence Rate • Bar graph shows quarterly Contractor Lost Time (LT) incidence rate. Light blue represents the previous year, brown represents
the year before previous and dark blue the current fiscal year. • Scatter graph denoted by (Δ, Ο) shows the number of Lost Time accidents and comparison is also made between the current year
and the previous years.
DC Water Board of Directors - Vl. General Manager's Report (George S. Hawkins, General Manager)
49

Dynamic Color Coding Legend *** **** Red- when the actual is lower than 5% of budget or target Yellow- when the actual is within 5% of budget or target Green- when the actual is equal to or higher than budget or target
Red- when the actual is higher than 5% of budget or target Yellow- when the actual is within 5% of budget or target Green- when the actual is equal to or lower than budget or target
Symbols where the color code applies- (Δ, □) E
Vendor Payment Performance
• Bar graph shows monthly Vendor Payment Performance percentage against monthly target of 97%; indicated by grey dotted line. This element is dynamically color coded**
• Line graph denoted by (Ο) shows the YTD vendor payment performance %.
DC Water Board of Directors - Vl. General Manager's Report (George S. Hawkins, General Manager)
50

District of Columbia Water and Sewer Authority
Summary of Contracts on Consent Agenda
203rd Meeting of the DC Water Board of Directors
Thursday, November 6, 2014
Joint Use Contracts
1. Resolution No. 14-67 - Execute Option Year Two of Contract No. WAS-12-035-AA-RE, G4S. The purpose of the option is to provide continued supply management services in an effort to maintain DC Water’s vehicles and equipment. The option amount is $1,054,654. (Recommended by the Environmental Quality and Sewerage Services Committee 10/16/14)
2. Resolution No. 14-68 - Execute Option Year Two and addition of funds for services for Contract No. WAS-12-033-AA-RE, G4S. The purpose of the option is to provide continued supply management services in an effort to maintain DC Water’s vehicles and equipment. The additional funds was due to the overtime cost of FEMS-ambulance repairs, harsh winter events, and Emergency Management Deployments. The option and additional funds amount is $1,054,654. (Recommended by the Environmental Quality and Sewerage Services Committee 10/16/14)
3. Resolution No. 14-69 - Execute Option Year Four of Contract No.WAS-10-052-AA-RE, Maryland Environmental Services. The purpose of the option is to inspect the application of biosolids on all designated land application sites in the region and the hauling of grit and screening from the Blue Plains Facility. The option amount is $650,347. (Recommended by the Environmental Quality and Sewerage Services Committee 10/16/14)
4. Resolution No. 14-70 - Execute Supplemental Agreement No. 1 of Contract No. DCFA #426, O’Brien & Gere Engineers. The purpose of the supplemental agreement is to provide final design services for the rehabilitation of existing equipment and to restore the operational capacity of the Main Pumping Station pumping apparatus and improve the flow control at the O Street Pumping Station. The supplemental agreement amount is $3,839,556. (Recommended by the Environmental Quality and Sewerage Services Committee 10/16/14)
DC Water Board of Directors - VIl. Summary of Contracts
51

5. Resolution No. 14-71 - Execute Option Year One of Contract No. WAS-12-056-AA-SC, Urban Services Systems Corporation. The purpose of the option is to continue providing for hauling of grit, screening and scum from the solids screening building to the disposal facility. The supplemental agreement amount is $702,818. (Recommended by the Environmental Quality and Sewerage Services Committee 10/16/14)
Non-Joint Use Contract
6. Resolution No. 14-72 - Execute Contract No. 140010, Capitol Paving of D.C., Inc. The purpose of the contract is to replace water mains that have experienced failures, or have a history of low water pressure or water quality complaints. The contract amount is $10,190,671. (Recommended by the Water Quality and Water Services Committee 10/16/14)
DC Water Board of Directors - VIl. Summary of Contracts
52

DC Water Board of Directors - Vlll. Consent Items (Joint Use)
53

DC Water Board of Directors - Vlll. Consent Items (Joint Use)
54

DC Water Board of Directors - Vlll. Consent Items (Joint Use)
55

DC Water Board of Directors - Vlll. Consent Items (Joint Use)
56

DC Water Board of Directors - Vlll. Consent Items (Joint Use)
57

DC Water Board of Directors - Vlll. Consent Items (Joint Use)
58

DC Water Board of Directors - Vlll. Consent Items (Joint Use)
59

DC Water Board of Directors - Vlll. Consent Items (Joint Use)
60

DC Water Board of Directors - Vlll. Consent Items (Joint Use)
61

DC Water Board of Directors - Vlll. Consent Items (Joint Use)
62

DC Water Board of Directors - Vlll. Consent Items (Joint Use)
63

DC Water Board of Directors - Vlll. Consent Items (Joint Use)
64

DC Water Board of Directors - Vlll. Consent Items (Joint Use)
65

DC Water Board of Directors - Vlll. Consent Items (Joint Use)
66

DC Water Board of Directors - Vlll. Consent Items (Joint Use)
67

DC Water Board of Directors - lX. Consent Item (Non-Joint Use)
68

DC Water Board of Directors - lX. Consent Item (Non-Joint Use)
69

DC Water Board of Directors - lX. Consent Item (Non-Joint Use)
70