re-analysis climate data as an important input for energy ...obukhov length: 1500m (z/l =0.033)...
TRANSCRIPT

2nd Open Energy Modelling Workshop
Re-analysis climate data as an important input for energy
system modeling
13.04.2015 Berlin
Dr. Beate Geyer

Objectives
overview on climate data sets for wind and solar time series
the challenge of wind data on different heights
(handling of the license problem for coastDat II data)
2

Meteorological data
You need climate/meteorological data sets for wind and radiation -
but why using Reanalyses or hindcasts for calculation of energy potentials?
3

Wind measurements are very strongly influenced by changes in, e.g., surface
roughness and by shadowing effects from trees and buildings,
but also changes in the instrument, the measuring height or the location are reasons
for the inhomogeneity of the data.
A homogenization of wind measurement is critical due the influence of local wind
effects.
Stations history is often incomplete and changes in the stations surrounding
(growing trees, new buildings in the neighbourhood) are rarely documented.
gaps
Inhomogenities in measurement time series
4 by courtesy: I.Anders

Gidded measurements
Cross-Calibrated Multi-Platform Ocean Surface Wind Vector Analyses 1987 to 2011
CCMP
gap-free, 6-hourly gridded database of global ocean surface wind vector 0.25°
basis: ERA-40 (1987-1998) and ECMWF operational since 1999
CCMP assimilates measurements
TRMM-TMI, QuikSCAT, WindSat, SSM/I, SSMIS, AMSR-E and other
satellites, and also data from in situ measurements (ships, buoys, etc.).
not homogenious
5

6
Reanalysis
0.22° Auflösung (ca. 24km) 1h - Output
1.875° Auflösung (ca. 200km) 6h - Output

7
Globale Reanalyses
NCEP/NCAR
NCEP1 1948 – ongoing 6h: 1.875º Kalnay et al.,The NCEP/NCAR 40-year reanalysis project,
Bull. Amer. Meteor. Soc., 77, 437-470, 1996
NCEPII 1979 – 2014 6h: 1.875º Kanamitsu M, Ebisuzaki W,Woollen J, Yang SK, Hnilo JJ, Fiorino M, Potter GL. 2002. NCEP-
DOE AMIP-II reanalysis (R-2). Bulletin of the American Meteorological Society 83(11): 1631–
1643.
NCEP-CFSR 1979 – 03/2011 6h: 0.3° Saha, S., S. Moorthi, H.-L. Pan, X. Wu, J. Wang, S. Nadiga, P. Tripp, R. Kistler, J. Woollen,
D. Behringer, et al., 2010: The NCEP climate forecast system reanalysis. Bull. Amer. Meteor.
Soc., 91(8), 1015–1057.
ECMWF
ERA40 1958 – 08/2002 6h: 1.125º Uppala, S.; Kallberg, P.; Simmons, A.; Andrae, U.; et al. The ERA-40 re-analysis
Quart. J. Roy. Meteor. Soc., 2005, 131, 2961-3012
ERAint 1979 – ongoing 6h: 0.7° Dee, D.P., et al., 2011: The ERA-Interim reanalysis: configuration and performance of the data
assimilation system, Q. J. R. Meteorol. Soc. 137: 553–597. DOI:10.1002/qj.828
ERA-20C 1900-2010 3h: 1.125º -
NASA
MERRA 1979 – ongoing 0.66°x0.5° 2D-diagn. fields: 1h
Rienecker, M.M., M.J. Suarez, R. Gelaro, R. Todling, et al. (2011), MERRA: NASA's Modern-
Era Retrospective Analysis for Research and Applications. J. Climate, 24, 3624-3648,
doi:10.1175/JCLI-D-11-00015.1.
JMA
JRA-25 1979 – 02/2014 6h: 1.125° Onogi, K., J. Tsutsui, H. Koide, M. Sakamoto, S. Kobayashi, H. Hatsushika, T. Matsumoto, N.
Yamazaki, H. Kamahori, K. Takahashi, S. Kadokura, K. Wada, K. Kato, R. Oyama, T. Ose, N.
Mannoji, and R. Taira, 2007: The JRA-25 Reanalysis. J. Met. Soc. Jap., 85(3), 369-432.
JRA-55 1958-2012 3h/6h: 0.5° Kobayashi et al., 2015: The JRA-55 Reanalysis: General Specifications and Basic
Characteristics, Journal of the Meteorological Society of Japan. Ser. II, Vol. 93, No. 1 p. 5-48
NOAA-CIRES 20th Century Reanalysis
20CR version 2
1871-2012 6h: 1.875º Compo, G.P. et al., 2011: The Twentieth Century Reanalysis Project. Quart. J. Roy. Meteor.
Soc., 137, 1-28. DOI:10.1002/qj.776.

Regional Reanalyses
NCEP/NCAR
North American
Regional Reanalysis
(NARR)
1979-2014 North America 3h: 0.3° NORTH AMERICAN REGIONAL
REANALYSIS: A long-term, consistent, high-
resolution climate dataset for the North
American domain, as a major improvement
upon the earlier global reanalysis datasets in
both resolution and accuracy, Fedor Mesinger
et. al, submitted to BAMS 2004.
PMG
Arctic System
Reanalysis (ASR)
2000-2012 Artic 3h: 30 km
Byrd Polar Research Center, T. O. S. U.
Arctic System Reanalysis (ASR) Project
Research Data Archive at the National Center
for Atmospheric Research, Computational and
Information Systems Laboratory, 2012
DWD
COSMO-REA6 and
COSMO-REA2
2007–2011
Sel. month
Europe
Germany
2D: 15min;6.2km
2D: 15min;2km
Bollmeyer, Ch. et al.: A high-resolution regional
reanalysis for the European CORDEX region,
Vol. 17, EGU2015-11209, 2015
KIK Estonian Environmental Investment Centre
BaltAn65+ HIRLAM (ERA-40 forcing)
1965-2005 Baltic Sea
region
6h: 0.1°
MetOffice
UKMO Europe, NA 3h: 0.18° Bush 2006: Development of the North
Atlantic European Model (NAE) into an
operational model
8

10
Reanalysis and Regional Hindcast
0.22° Auflösung (ca. 24km) 1h - Output
1.875° Auflösung (ca. 200km) 6h - Output

11
coastDat 2 – Atmospheric part
1948-2014
COSMO-CLM Version 4.8
- horizontal resolution 0.22°
- 40 vertical layers
- hourly output
- rotated coordinates
- for good representation of the general circulation: spectral nudging for the upper windfields
-Number of grid points: 254x248
(~6000x6000km)

Other Hindcasts by HZG
12
Southeast Asia & Sibiria: 0.5° resolution
Bohai Sea: 7 km resolution

more regional data
Other instutions do hindcasts as well, e.g.
CORDEX – EU founded projects, but output is stored 3hly
13

Abb. wie Sotillo et al. 2005 für coatsDat1
Added value of the regional hindcast
Quantitative Erfassung des
Mehrwertes durch modifizierten Brier
skill score:
Maßstab sind Satellitenmessungen v.
QuikSCAT2.0 L2B12, Referenz ist die
globale Reanalyse
> 0 : CCLM näher an Satellitenwert
~ 0 : CCLM und NCEP gleich nahe an
Satellitenwert
< 0 : NCEP näher an Satellitenwert
K1 Boje Athos
Windgeschwindigkeit in 10m Höhe für 2000-2009
Wertebereich: 3-25 m/s entspricht 3-9 Bf

Added value of the regional hindcast
15
Windgeschwindigkeit in 10m Höhe für 2000-2009
Wertebereich: a) 12-25 m/s (6-9 Bft) und b) 17-25 m/s (7-9 Bft)

B.Geyer •
14.04.2015 16
coastDatII – Validierung: Wind
Häufigkeitsverteilung: Cabauw in 140m Höhe; 2001-2010

Wind data on different heights
Interpolation is necessary:
- measurements in the network of WMO: in 10 m height in an open area
- measurements on platforms/ship (20-50m)
- measuremants on buoys (3m)
- height of interest 80m to 200m
Different strategries are possible:
Ingenieurs take the power law which is comparable to the logarythmic wind profile used by the
meteorologists.
17

Figure 3.7 (Emeis, 2012): Three normalisised non-neutral windprofiles extrapolated from the 50 m
wind speed for increasing stability (from left to right)
Full lines: logarithmic profiles
Dashed lines: power law (exponent given in the middle)
Middle: roughness length:0.023 m (z/z0=2174)
Obukhov Length: 1500m (z/L =0.033) -> power law and logarithmic wind profile deliver the nearly
the same curve: in 100 m the difference is 0.1% in 10m 0.9%
Left (unstable)
in 100 m the difference is 4.5% in 10m 90%
Right (very stable)
in 100 m the difference is -3.5% in 10m -14%
18
Reference:
Stefan Emeis: Wind Energy Meteorology: Atmospheric Physics for Wind Power Generation (Green Energy and Technology)

Interpolation of simulated data: 3D – model grid
19
Abb.: Michael Böttinger, DKRZ

Errors due to interpolation
20
Long-term average difference between EFLH based on wind speeds at a height of 10 m extrapolated using a power law and
the direct model output at a height of 100 m for the period of 1958-2012.

21
longterm mean of 100m wind speed (1958-2012)
difference ‚power law‘ - modeled
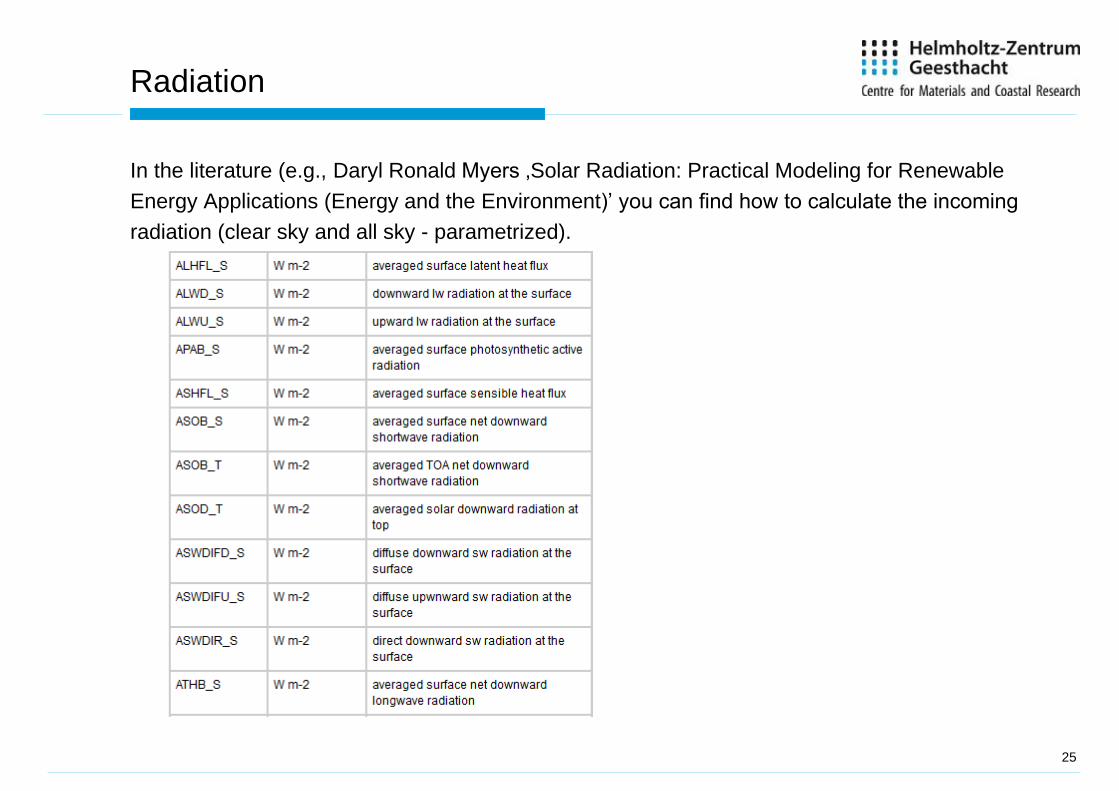
Radiation
In the literature (e.g., Daryl Ronald Myers ‚Solar Radiation: Practical Modeling for Renewable
Energy Applications (Energy and the Environment)’ you can find how to calculate the incoming
radiation (clear sky and all sky - parametrized).
25

Thanks for listening!
26

27