re: annual environmental report - avara shannon ... dutch intervention target s
TRANSCRIPT
Verdé Environmental Consultants Ltd is registered in Ireland No. 432891. Registered offices at The Bush, Dunshaughlin, Co. Meath – part of the Verdé Environmental Group
Directors: P. Van den Bergh B.A., Dip. Mkt. Mgt. (Managing), H.P. Van den Bergh B.E., O. Van den Bergh B.A. (Mod) MSISS, K. Cleary BSc., MSc., FGS, PGeo., EurGeol.
Lourda Moloney, Environmental Officer, Avara Shannon Pharmaceutical Services Ltd., Shannon Industrial Estate, Shannon, Co. Clare.
21st March 2017 Verdé Ref: 50374
RE: Annual Environmental Report - Avara Shannon Pharmaceutical Services Ltd
Dear Lourda,
Verdé Environmental Consultants (Verdé) are pleased to submit this report providing a review of
groundwater quality at the Avara Shannon Pharmaceutical Services Ltd (Avara) facility located in Shannon
Industrial Estate, Shannon, Co Clare.
In this report, Verdé’s objective is to provide a summary on current groundwater quality at the site in
relation to published standards, to make observations of trends in groundwater quality over time and also a
discussion of potential impacts to nearby environmental receptors.
If you have any queries in relation to the report please do not hesitate to contact us.
Yours sincerely,
Cyril Tynan Kevin Cleary Senior EHS Consultant Operations Director
For
insp
ectio
n pur
pose
s only
.
Conse
nt of
copy
right
owne
r req
uired
for a
ny ot
her u
se.
EPA Export 29-05-2017:03:19:20
Avara Groundwater Review 2016 Verdé Ref: 50374
Page 2
1 INTRODUCTION
1.1 Project Contractual Basis & Personnel Involved
Verdé have completed works in accordance with Verdé Proposal Ref: 50374 issued on 7th July 2016. The
Verdé personnel involved in the project included Ronan Doyle, a qualified Environmental Scientist with 20+
years’ experience in environmental monitoring. The report was prepared by Daniel Moore, an environmental
scientist with 7 years’ experience and Cyril Tynan, a Senior EHS Consultant with 17 years’ experience in
environmental monitoring and consultancy. The report was reviewed by Kevin Cleary a Verdé Director with
19 years’ experience in environmental consultancy and management.
The majority of the laboratory analysis was managed by Avara; some parameters were analysed in their in-
house laboratory whilst remaining parameters were analysed by the independent laboratory City Analysts
Ltd, an ISO17025 accredited laboratory in Ireland. Verdé managed the analysis of Total Petroleum
Hydrocarbons-Criteria Working Group (TPH-CWG) through Exova Jones Environmental, an independent
UKAS accredited laboratory.
1.2 Background and Scope
Avara is a medium sized Bulk Pharmaceutical Manufacturing facility, operating under Industrial Emissions
Licence No. P0020-02. Biannual groundwater monitoring is undertaken at the site under the terms of its
licence at seven licenced wells; GS01, G02, GS03, GS04, GS06, GS11, GS12. Historically, additional monitoring
wells were included which are referenced also in this report. Verdé’s objective is to provide a review of
current groundwater quality at the site in relation to published standards, make comparisons with previous
groundwater quality records and also to discuss potential impacts to nearby environmental receptors. In
order to meet these objectives, the following scope was completed:
Biannual groundwater sampling (conducted in May and November 2016);
A review of current groundwater quality at the site;
Comparison of groundwater results with historical data where significant trends are relevant;
A discussion of results with respect to current published standards and relevance to nearby
environmental receptors.
In completion of this report, Verdé have reviewed Laboratory data provided by Avara for 2016 and also bi-
annual data from 2015. This report focuses on the current groundwater status of the site.
For
insp
ectio
n pur
pose
s only
.
Conse
nt of
copy
right
owne
r req
uired
for a
ny ot
her u
se.
EPA Export 29-05-2017:03:19:20

Avara Groundwater Review 2016 Verdé Ref: 50374
Page 3
2 SITE DETAILS
2.1 Site Activities
The Avara site (formerly known as UCB Manufacturing Ltd.) began operations in 1982 and has expanded
over the years. The facility currently contains two Bulk Pharmaceutical synthesis facilities known as SP1 and
SP3 in which Synthetic Chemistry is undertaken to produce Bulk Pharmaceutical Product. The site also
contains a Pharmaceutical Finishing Facility. The relevant classes of activity at the site are:
The use of a chemical or biological process for the production of basic pharmaceutical products.
The recovery or disposal of waste in a facility, within the meaning of the Act of 1996, which facility is
connected or associated with another activity specified in this Schedule in respect of which a licence
or revised licence under Part IV is in force or in respect of which a licence under the said Part is or
will be required.
The key contaminants of potential concern (COPC) at the site are organic solvents involved in the
pharmaceutical manufacturing process. Solvent types include primarily alcohols, ketones, acetates and
organic acids. Chlorinated solvents and petroleum based organics are also included in the assessment to
account for small scale or historical activities and fuel storage. The assessment also provides for the
assessment of general parameters from other potential contamination sources such as wastewater or trade
effluent releases to surface water or potential uncontrolled discharges from on –site and off site sources.
2.2 Site Location & Environmental Setting
The site is located on the north-west corner of the Shannon Industrial Estate adjacent to the Shannon
International Airport and approximately 1 kilometre from Shannon town centre (See Figure 1). The site
occupies approximately 6.9 hectares (see Figure 2) and is physically separated from the Airport by an open
culvert used to carry surface water from the immediate catchment area to the Shannon River, which is
located approximately 1.5km from the site. To the east, the site is overlooked by the Westpark development.
Details of the site environmental setting are outlined in Table 2.1. The information on the site location,
hydrology, geology, hydrogeology and ecology of the area has been obtained from records held by the
Geological Survey of Ireland (GSI), Environmental Protection Agency (EPA), Ordnance Survey of Ireland (OSI),
Water Framework Directive (WFD) maps, National Parks and Wildlife Service (NPWS) databases and on-line
resources of Department of Environment, Community and Local Government (www.myplan.ie).
For
insp
ectio
n pur
pose
s only
.
Conse
nt of
copy
right
owne
r req
uired
for a
ny ot
her u
se.
EPA Export 29-05-2017:03:19:20

Avara Groundwater Review 2016 Verdé Ref: 50374
Page 4
Table 2.1 – Site Environmental Setting
FEATURE DETAILS & COMMENTS
Topography The site is predominantly flat and the surrounding lands are also regionally flat
Geology Overburden:
The overburden for the region consists of made ground, adjacent lands are underlain by
marine/estuarine silts and clays
Solid Geology:
The underlying bedrock is classified as Dinantian Lower Impure Limestones. Dark muddy
limestones and shales of the Ballysteen Formation
Hydrogeology Regional Classification:
The underlying aquifer is classified as Locally Important; bedrock which is moderately
productive only in Local Zones.
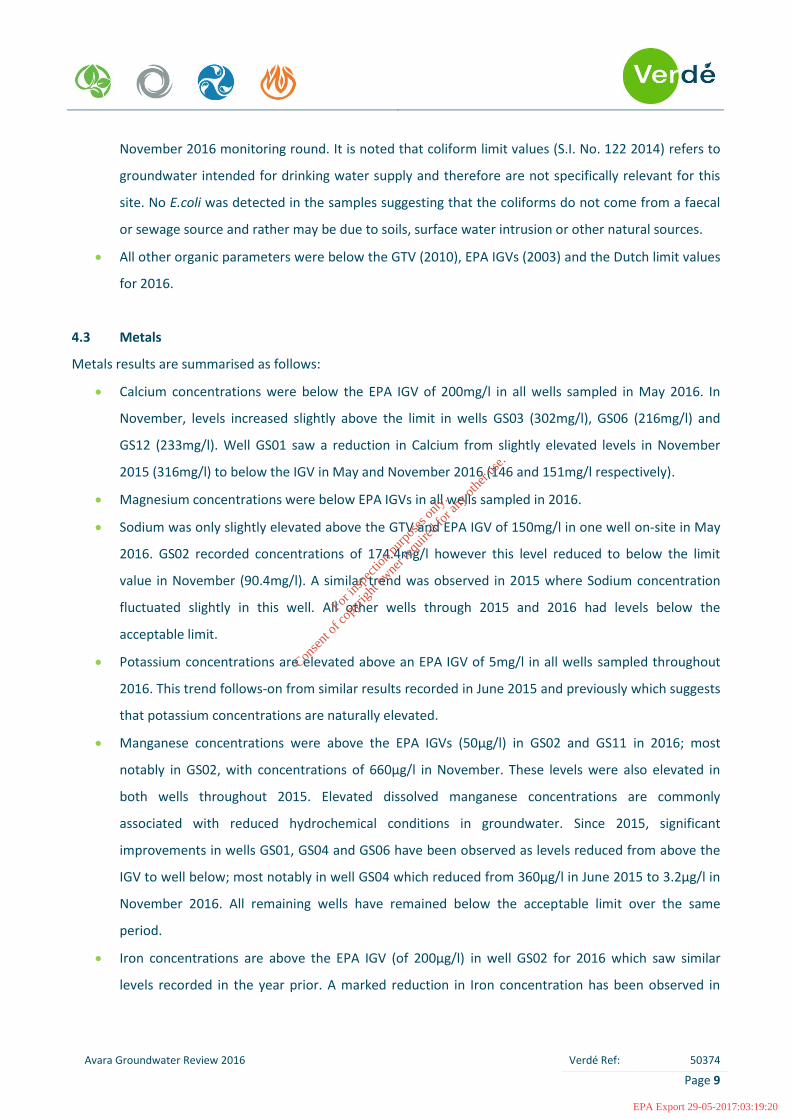
Vulnerability:
The underlying bedrock aquifer is described by the GSI as having Low vulnerability. A review of
historical borehole logs from the wells drilled at the site however suggests that a High to
Extreme vulnerability rating may be more appropriate for the site as bedrock was encountered
between 1.7 and 7.6mBGL. See Figure 3 for a cross section of the site showing areas of high
and extreme vulnerability. .
Well Search:
There are four recorded monitoring wells on the site according to the GSI. From site
documentation reviewed there are 19 monitoring wells on the site, seven of which are used for
EPA licence monitoring. There are 15 other wells recorded as being within 1km of the site with
agricultural and domestic wells to the north west and four wells of unknown use to the south
east within 500m of the site.
One water abstraction well is located on-site and is used for Avara industrial use and not for
drinking water.
Hydrology/Ecology Surface Water Courses/ Abstractions
An open culvert flows north east to south west along the western boundary of the site and into
the Urlan Beg River near the southern boundary of the site. The Urlan Beg River enters the
Shannon Estuary approximately 2.0km south of the site (tidal)
Water Framework Directive status:
The site is within the Tulla-Newmarket on Fergus Groundwater body region with a WFD 2007 -
2017 Good status. The Urlan Beg River and the Clongloghan Stream WFD 2010-2012 status is
unassigned. The Upper Shannon Estuary Transitional Waterbody has a 2010-2012 Moderate
For
insp
ectio
n pur
pose
s only
.
Conse
nt of
copy
right
owne
r req
uired
for a
ny ot
her u
se.
EPA Export 29-05-2017:03:19:20

Avara Groundwater Review 2016 Verdé Ref: 50374
Page 5
Status.
Protected Areas:
The nearest protected area is the Lower Shannon Estuary approximately 1.5km south of the
site. (SAC code 002165).
Surface Drainage and Flooding:
According to the OPW (Office of Public Works) there have been no recorded flood events in the
area for at least 1km.
3 SITE WORKS
3.1 Groundwater Monitoring
Verdé completed biannual groundwater monitoring at the site on 31st May and 28th November 2016.
Monitoring was undertaken on seven groundwater monitoring wells; GS01; GS02; GS03; GS04; GS06; GS11
and GS12 (see Figure 2). The seven monitoring wells sampled range from 2.0 to 16.2 meters in depth and are
50mm diameter installations.
All sampling was undertaken as per best practice and sampling guidelines including using dedicated sampling
equipment and purging three well volumes from the monitoring wells prior to sampling. Electrical
conductivity, pH and temperature field measurements were recorded using a calibrated water quality meter.
Samples were provided to Avara for internal and selected outsourcing of chemical analysis. Verdé also
submitted samples to an independent UKAS accredited laboratory for TPH-CWG analysis.
3.2 Well Surveying
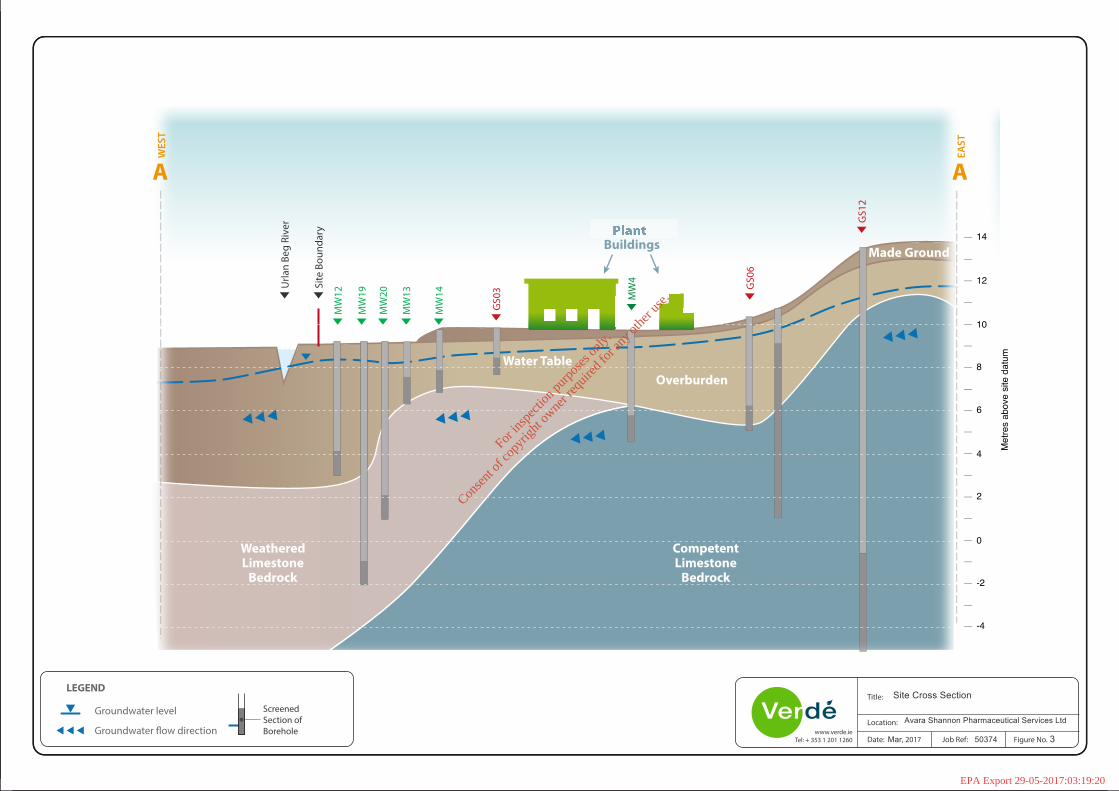
A groundwater topographic survey was completed in February 2016 during which monitoring wells on site
were surveyed against an arbitrary site datum to allow calculation of groundwater flow direction at the site.
Groundwater level measurements taken in November 2016 suggest that groundwater flow direction on site
is in a westerly direction towards the culvert/ Urlan Beg River. This agrees with groundwater flow
calculations completed in February 2016 (see Table 3.1 below).
For
insp
ectio
n pur
pose
s only
.
Conse
nt of
copy
right
owne
r req
uired
for a
ny ot
her u
se.
EPA Export 29-05-2017:03:19:20

Avara Groundwater Review 2016 Verdé Ref: 50374
Page 6
Table 3.1- Well Survey
Well ID Elevation (mbtoc)
Groundwater Level (mbtoc)
Groundwater Level (mASD )
Groundwater Level (mbtoc)
Groundwater Level (mASD )
Date: 15/02/2016 28/11/2016
GS01 10.41 0.59 9.82 0.94 9.47
GS02 10.715 1.79 8.925 1.81 8.905
GS03 10.85 2 8.85 1.96 8.89
GS04 10.68 1.93 8.75 1.65 9.03
GS06 10.635 1.23 9.405 2.33 8.305
GS11 11.08 2.22 8.86 2.25 8.83
GS12 13.935 2.64 11.295 2.9 11.035
MW-4 10 0.86 9.14 - -
Notes: mASD = meters Above Site Datum, in this case MW-4 is taken as 10m site datum. mbtoc= meters below top of casing
It is noted that during analysis of groundwater levels, a strong influence in groundwater flow direction is
caused by the on-site water abstraction well located near well GS06 (see Figure 4).
A visual inspection of all wells indicates that they are all in good condition. No erroneous groundwater levels
were recorded across the site therefore results and observations indicate that all monitoring wells are
functioning correctly on site.
For
insp
ectio
n pur
pose
s only
.
Conse
nt of
copy
right
owne
r req
uired
for a
ny ot
her u
se.
EPA Export 29-05-2017:03:19:20

Avara Groundwater Review 2016 Verdé Ref: 50374
Page 7
4 GROUNDWATER RESULTS
Verdé completed biannual groundwater monitoring at the site in May and November 2016. Monitoring was
undertaken on seven groundwater monitoring wells; GS01; GS02; GS03; GS04; GS06; GS11 and GS12. Results
are discussed below. Comparisons are made with the Groundwater Regulations 2010 Threshold Values (GTV)
where available. In the absence of a GTV, comparison is made with EPA Interim Guideline Values 2003 (EPA
IGV) or Dutch Intervention (I values) or Target (S Values). Groundwater analytical results are presented in
Table 1.
4.1 Field Readings & Observations
An organic odour was evident in well GS04 during both monitoring rounds in 2016. In May, a slight organic
odour was evident in wells GS03 and GS11 and in November, a slight organic odour was observed in well
GS02. The odours identified in these wells were not described as being solvent-based organic odours and are
likely to be naturally-derived from the peaty subsoils found on-site. Otherwise, no physical evidence of
contamination was noted in the remaining wells throughout 2016. Groundwater physicochemical
parameters were within acceptable ranges across the site with key observations as follows:
Groundwater levels were slightly lower in May than November 2016 with average groundwater
levels at 2.09mbtoc in summer and 1.98mbtoc in winter.
pH trends are consistent across the site, ranging between pH 6.86 and pH 7.27 for the year and
averaging pH 7.05.
Groundwater temperatures were consistent throughout 2016 with an average summer temperature
of 12.8°C and an average winter temperature of 12.1°C with no significant localised variation.
Conductivity readings in summer averaged 831uS/cm and in winter averaged 994uS/cm.
Conductivity levels were slightly high in some wells in November 2016 but in general are low across
the site and within acceptable ranges. The slightly higher levels in winter are likely to be influenced
by lower temperatures leading to less dissolution of dissolved solids.
The site is located close to the Shannon estuary therefore there may be slight regional saline
influence on groundwater.
There were no spillages reported in the vicinity of any of the Groundwater wells in 2016.
4.2 Organics
The organics suite was developed with the laboratory in order to capture the relevant chemicals, solvents
and fuels used on-site. Organic compounds tested for include alcohols, ketones, acetates, organic acids,
For
insp
ectio
n pur
pose
s only
.
Conse
nt of
copy
right
owne
r req
uired
for a
ny ot
her u
se.
EPA Export 29-05-2017:03:19:20

Avara Groundwater Review 2016 Verdé Ref: 50374
Page 8
chlorinated solvents, and petroleum based organics and various hydrocarbon breakdown products. Results
are summarised as follows:
In May 2016, slightly elevated levels of Diesel Range Organics (DRO) were evident in all wells
sampled. Well GS04 recorded the highest DRO concentration of 207μg/l whilst the remaining wells
ranged between 21 and 45μg/l. In November 2016 however, DROs in all wells sampled were below
the laboratory Limit of Detection (LOD) of <21μg/l showing an overall improvement at the site. It is
noted that the EPA IGV of 0.01mg/l applies to Total Hydrocarbons to include mineral oil by gas
chromatography which includes Gasoline Range Organics, the separate BTEX parameters including
MTBE and DRO (to determine mineral oil concentration). Laboratory detection limits in this instance
are not sufficiently low to allow direct comparison with this value. It is noted however that this
analysis technique is not as reliable as the more detailed TPH analysis which was also completed at
the site and is discussed further in Section 4.5 below. Some hydrocarbons occur naturally due to
humic acids or peaty subsoils which are evident on-site.
In general, alkalinity levels (expressed as HCO3 and CaCO3) have remained relatively constant
throughout 2015 and 2016 for all wells sampled. In May 2016 a notable change in alkalinity was
observed in well GS12 (dropping below laboratory LODs for the first time). A review of related
parameters does not suggest any pollution issues on-site. Alkalinity results returned again to typical
levels in November 2016.
In 2016, cyclohexane levels were below laboratory LODs in all wells sampled. It is noted that in June
2015, low level cyclohexane (1.3mg/l) was observed in both GS02 and GS03, therefore an
improvement in conditions has been observed during 2016.
MTBE concentrations in all wells sampled throughout 2016 were below acceptable limits and the
laboratory LODs. Historically, low level MTBE was detected in GS04, GS11 and GS12 at separate
intervals during 2015 (though still below acceptable levels) showing an improvement over time in
these wells. MBTE is commonly associated with unleaded petrol but is also present in some
laboratory solvent and pharmaceutical agents. It is understood that no MTBE has been used at the
site since 2008.
Bacterial analysis is not typically a licence requirement but was undertaken on this occasion to
further investigate the reason for elevated phosphates and nitrate concentrations recorded in 2015.
Bacterial analysis was chosen to investigate the possibility of waste water sources contributing to
these elevated results. Coliform bacteria numbers exceeded the European Union (Drinking Water)
Regulations 2014 (S.I. No. 122) and EPA IGV in relation to groundwater in both monitoring rounds in
2016 in wells GS03, GS04 and GS12. Elevations were also observed in the remaining wells during the
For
insp
ectio
n pur
pose
s only
.
Conse
nt of
copy
right
owne
r req
uired
for a
ny ot
her u
se.
EPA Export 29-05-2017:03:19:20
Avara Groundwater Review 2016 Verdé Ref: 50374
Page 9
November 2016 monitoring round. It is noted that coliform limit values (S.I. No. 122 2014) refers to
groundwater intended for drinking water supply and therefore are not specifically relevant for this
site. No E.coli was detected in the samples suggesting that the coliforms do not come from a faecal
or sewage source and rather may be due to soils, surface water intrusion or other natural sources.
All other organic parameters were below the GTV (2010), EPA IGVs (2003) and the Dutch limit values
for 2016.
4.3 Metals
Metals results are summarised as follows:
Calcium concentrations were below the EPA IGV of 200mg/l in all wells sampled in May 2016. In
November, levels increased slightly above the limit in wells GS03 (302mg/l), GS06 (216mg/l) and
GS12 (233mg/l). Well GS01 saw a reduction in Calcium from slightly elevated levels in November
2015 (316mg/l) to below the IGV in May and November 2016 (146 and 151mg/l respectively).
Magnesium concentrations were below EPA IGVs in all wells sampled in 2016.
Sodium was only slightly elevated above the GTV and EPA IGV of 150mg/l in one well on-site in May
2016. GS02 recorded concentrations of 174.4mg/l however this level reduced to below the limit
value in November (90.4mg/l). A similar trend was observed in 2015 where Sodium concentration
fluctuated slightly in this well. All other wells through 2015 and 2016 had levels below the
acceptable limit.
Potassium concentrations are elevated above an EPA IGV of 5mg/l in all wells sampled throughout
2016. This trend follows-on from similar results recorded in June 2015 and previously which suggests
that potassium concentrations are naturally elevated.
Manganese concentrations were above the EPA IGVs (50μg/l) in GS02 and GS11 in 2016; most
notably in GS02, with concentrations of 660μg/l in November. These levels were also elevated in
both wells throughout 2015. Elevated dissolved manganese concentrations are commonly
associated with reduced hydrochemical conditions in groundwater. Since 2015, significant
improvements in wells GS01, GS04 and GS06 have been observed as levels reduced from above the
IGV to well below; most notably in well GS04 which reduced from 360μg/l in June 2015 to 3.2μg/l in
November 2016. All remaining wells have remained below the acceptable limit over the same
period.
Iron concentrations are above the EPA IGV (of 200μg/l) in well GS02 for 2016 which saw similar
levels recorded in the year prior. A marked reduction in Iron concentration has been observed in
For
insp
ectio
n pur
pose
s only
.
Conse
nt of
copy
right
owne
r req
uired
for a
ny ot
her u
se.
EPA Export 29-05-2017:03:19:20

Avara Groundwater Review 2016 Verdé Ref: 50374
Page 10
well GS11 however; which saw levels at 291μg/l in November 2015 reduce to below the IGV in
November 2016 (162.9μg/l). All other wells were below the EPA IGV over the same period.
In May 2016, Cadmium concentrations were slightly elevated above the GTV (3.75μg/l) in wells GS02
(4.29μg/l), GS06 (3.88μg/l) and GS11 (6.17μg/l). Well GS11 also exceeded the EPA IGV of 5μg/l. In
the most recent monitoring round however, these levels reduced to below these acceptable limits.
All remaining wells sampled through 2016 were below the GTV and IGVs.
Results for Aluminium, Chromium, Nickel, Zinc, Boron, Cobalt, Silver, Tin, Copper, Mercury, Lead,
Selenium and Beryllium are all below relevant guidelines and similar to observed results from 2015.
The above metal and major ion exceedances have been detected on-site historically and are most likely
associated with naturally occurring properties of groundwater in limestone bedrock and overlying glacial
till subsoils.
4.4 Major Ions
Results for major anions are summarised as follows:
Chloride results were within the GTV range of 24-187.5mg/l in all wells sampled throughout 2016
with the exception of two in November. GS01 recorded levels slightly below the GTV range
(17.3mg/l) whilst GS03 recorded the highest Chloride concentration of all wells (at 269.7mg/l). The
remaining wells sampled in 2016 had slightly elevated Chlorine concentrations exceeding the lower
IGV standard (of 30mg/l), a trend which was observed in 2015 also.
Ammoniacal Nitrogen was above the GTV and EPA IGV acceptable limits in all wells sampled
throughout 2016. The maximum concentrations were observed in wells GS04 (2.6mg/l) and GS11
(2.4mg/l) in November. Comparison with 2015 data shows Ammoniacal Nitrogen concentrations
have increased across all wells on-site. Typically, ammoniacal nitrogen levels above 0.1 mg/l indicate
potential sewage or industrial contamination; however it may also be an indication of slightly
reduced hydrochemical conditions. Nitrate and Nitrite concentrations were below the GTV and EPA
IGV limits throughout 2016 with the exception of well GS12 which recorded a one-off minor
exceedance of Nitrate (at 60.25mg/l). All remaining well results are similar to or show an improved
trend on those recorded in 2015.
Phosphate was above GTV and EPA IGVs in all wells in both the May and November 2016 sampling
rounds with a maximum of 0.93mg/l observed in well GS02 in May. This well has seen a marked
improvement from its June 2015 result of 1.18mg/l. All remaining wells recorded similar results to
2015.
For
insp
ectio
n pur
pose
s only
.
Conse
nt of
copy
right
owne
r req
uired
for a
ny ot
her u
se.
EPA Export 29-05-2017:03:19:20

Avara Groundwater Review 2016 Verdé Ref: 50374
Page 11
Potassium concentrations were slightly elevated above the EPA IGV of 5mg/l for all wells on-site
throughout 2016. The most elevated results being exhibited in well GS11 at 15.3mg/l in May
however all results are similar in those of 2015 in each well.
Sulphate was above the GTV of 187.5mg/l in wells GS01 and GS06 for both monitoring rounds in
2016. The most elevated result being in 254.5mg/l in GS01 in May which is a slight improvement
from 2015 results. Sulphate concentrations show localised variations across the site but overall are
quite stable and similar to results recorded for 2015 in all remaining wells.
Sulphide concentrations were below detection limits in all wells apart from low level sulphides in
GS04 (0.31-0.39mg/l). No limit value is available for sulphides but their presence may be an indicator
of reduced hydrochemical conditions.
Bromide is present at low levels across the site (0.313-1.726mg/l) at concentrations similar to those
recorded in 2015.
Overall the presence of slightly elevated potassium, chloride and sulphate ions maybe attributed to the
brackish water influence of the nearby Shannon Estuary as these parameters are elevated in brackish water.
4.5 Aliphatic & Aromatic Hydrocarbons
Results for Aliphatic and Aromatic Hydrocarbons are summarised as follows:
TPH concentrations reported in groundwater samples taken from all wells on-site throughout 2016
were below the EPA IGVs and laboratory LOD with the exception of two wells (GS01 and GS02).
Slightly elevated concentrations of aliphatic carbon chains C10-C16 were reported in wells GS01 and
GS02 in May 2016. These levels exceed the IGVs however; results from the same wells in November
saw concentration return to below the acceptable limits.
4.6 Potential Pollutant Linkages
Based on laboratory results from 2015 and 2016, the following observations are made in relation to
pollutant linkages between contamination sources, migration pathways and sensitive receptors.
4.6.1 Contamination sources summary
Direct and indirect contamination sources are listed below:
No evidence of groundwater solvent contamination was detected in 2015 or 2016 from on-site
activities.
For
insp
ectio
n pur
pose
s only
.
Conse
nt of
copy
right
owne
r req
uired
for a
ny ot
her u
se.
EPA Export 29-05-2017:03:19:20

Avara Groundwater Review 2016 Verdé Ref: 50374
Page 12
Slightly elevated DRO was recorded in all wells on-site in May 2016 with the highest level recorded in
well GS04. These results were similar to those observed throughout the 2015 monitoring rounds. In
November 2016 however, DRO levels in all wells were below the laboratory LODs. The more up-to-
date analysis for TPH (TPH Criteria Working Group) provides for more accurate banding of petroleum
components and results are less affected by naturally occurring or interfering substances. This
analysis suggests only slightly elevated concentrations of aliphatic carbon chains C10-C16 were
evident in wells GS01 and GS02 in May 2016. It is therefore likely that DRO results are affected by
natural humic acids from peaty clay subsoils in the area.
No elevated results for contaminants of potential concern (COPCs) from organic solvents on-site
have been observed.
Phosphates were elevated in all wells. Elevated Ammoniacal Nitrogen was also observed in all wells
throughout 2016. Localised elevations were also recorded for various other parameters including
Potassium, Manganese, Iron and Sulphates; these parameters may possibly be affected by site
activities but are more likely associated with naturally occurring ground and groundwater conditions.
4.5.2 Contamination Pathways
Contamination pathways are discussed below:
Localised contaminants may potentially migrate in shallow groundwater beneath the site. Although
the GSI has recorded the aquifer as having a low vulnerability, a review of site logs suggests that a
high to extreme vulnerability may be more appropriate.
Dissolved ions in groundwater potentially flowing towards sensitive environmental receptors such as
nearby streams and SPA of the Lower Shannon Estuary.
The groundwater flow direction has been measured to be in a westerly direction towards the Urlan
Beg River. This places a particular importance on the most downgradient monitoring wells on the
western side of the site; GS11, GS04 and GS03.
4.5.3 Receptors
Based on desk survey findings, the following potential environmental receptors have been identified:
Urlan Beg River and tributary streams adjacent to the western boundary;
SPA of the Lower Shannon Estuary;
Locally important aquifer of potentially high to extreme vulnerability;
One abstraction well is located on-site and used for industrial purposes only.
For
insp
ectio
n pur
pose
s only
.
Conse
nt of
copy
right
owne
r req
uired
for a
ny ot
her u
se.
EPA Export 29-05-2017:03:19:20

Avara Groundwater Review 2016 Verdé Ref: 50374
Page 13
There are several recorded off-site wells for agricultural and domestic use within 1km north-west of
the site; these are considered to be up-gradient of the site based on groundwater surveying data.
Four wells of unknown exact locations are recorded within 500m south east of the site. These are
considered to be up-gradient or side gradient and not at risk from any potential on-site releases. It is
noted that an accurate location of these wells is not available but considering local hydraulic flow is
towards the Urlan Beg River and no abstraction wells are between the site and the river,
groundwater abstraction wells are excluded as a potential receptor.
5 SUMMARY CONCLUSIONS AND RECOMMENDATIONS
5.1 Conclusions
Based on survey findings, the following conclusions are made:
Slightly elevated Diesel Range Organics (DRO) was recorded in all wells on-site in May 2016 with the
highest level recorded in well GS04. A more up-to-date analysis for TPH (TPH Criteria Working
Group) provides for more accurate banding of petroleum components and results are less affected
by naturally occurring or interfering substances. This detailed analysis indicated only slightly elevated
concentrations of aliphatic carbon chains C10-C16 evident in wells GS01 and GS02 in May 2016. It is
likely therefore that DRO results are affected by natural humic acids from peaty clay subsoils in the
area rather than a petroleum source.
Laboratory results indicate that organic solvent COPCs associated directly with site manufacturing
activities are below relevant groundwater limits or guidelines.
Phosphates and Ammoniacal Nitrogen were somewhat elevated in all wells together with localised
elevations for Potassium, Manganese, Iron and Sulphates. These parameters may be affected by
source releases from site e.g. wastewater or surface releases permeating beneath hardstanding but
considering trends across the site, it is likely that these results are mostly reflective of naturally
occurring levels. This is supported by the bacterial analysis which confirm the presence of elevated
Coliform bacterial in all wells on-site but the absence of E.coli; suggesting that the coliforms do not
come from a faecal / sewage source but rather may be due to natural sources or possibly run-off
from agricultural activities such as the spreading of fertilisers nearby.
Bacterial analysis is not a licence requirement but was undertaken to investigate the possibility of a
waste water source contributing to elevated phosphate and nitrate concentrations recorded in 2015.
Coliform bacteria exceeded drinking water standards in some wells however E.coli was not detected
For
insp
ectio
n pur
pose
s only
.
Conse
nt of
copy
right
owne
r req
uired
for a
ny ot
her u
se.
EPA Export 29-05-2017:03:19:20

Avara Groundwater Review 2016 Verdé Ref: 50374
Page 14
in any well during both monitoring rounds, indicating that the coliforms are not from sewage
sources.
5.2 Recommendations
Based on groundwater review findings, the following recommendations are made:
Continue biannual groundwater monitoring to identify trends in the data.
It is suggested that that DRO / PRO analysis is no longer required at the site considering that analysis
for TPH CWG including BTEX and MTBE is now currently being undertaken. Older analysis techniques
for TPH include analysis of DRO / PRO fractions which are less reliable that current techniques. More
up-to-date analysis for TPH (TPH Criteria Working Group) provides for more accurate banding of
petroleum components and results are less affected by naturally occurring or interfering substances.
For
insp
ectio
n pur
pose
s only
.
Conse
nt of
copy
right
owne
r req
uired
for a
ny ot
her u
se.
EPA Export 29-05-2017:03:19:20

Verdé Environmental Consultants Ltd | Part of the Verdé Environmental Group
Figures
For
insp
ectio
n pur
pose
s only
.
Conse
nt of
copy
right
owne
r req
uired
for a
ny ot
her u
se.
EPA Export 29-05-2017:03:19:20

B A L L Y C A L L Y
C A H E R T E I G E
S M I T H S T O W N
T U L L Y V A R R A G AT U L L Y G L A S S
K N O C K A U N
F I R G R O V E
B A L L Y C U N N E E N
C L O N L O G H A N
L I S C O N O R
C A R R O W
B A L L Y C A S E YB E G
B A L L Y C A S E YM O R E
C L O N M O N E YW E S T
C L O N M O N E YS O U T H
S T O N E H A L L
SHANNON
Ballycasey
SHANNONAIRPORT
SiteLocation
S H A N N O N E S T U A R Y
R472
R471
N19
N18
M18
www.verde.ieTel: + 353 1 201 1260 Date: Feb. 2016 Job Ref: 50953
Title:
Clien Avarat:
Site Location Map
Services armaceuticalhP annonhS Ltd.
Figure No. 1
VerdeScale 1:25,000 (at A4 size) Kilometres
0 0.2 0.4 0.6 0.8 1 2
For
insp
ectio
n pur
pose
s only
.
Conse
nt of
copy
right
owne
r req
uired
for a
ny ot
her u
se.
EPA Export 29-05-2017:03:19:20

URLA
N B
EG R
IVER
www.verde.ieTel: + 353 1 201 1260 Date: Mar. 2016 Job Ref: 50953
Title:
Clien varaAt: Ltd Services aceuticalmharP Shannon Verde
Scale 1:2,500 (at A4 size) Metres
0 20 40 60 80 100 120 140 160 180 200
LEGEND
Borehole LocationSite Boundary
MW/GS
Site Layout Map
Figure No. 2
MW19
MW20MW21
GS03
GS06
GS11
GS01
GS12
MW4
MW3
MW5
MW14
GS04
MW12
GS02
MW13
MW9
MW10
OPEN
CULVERT
A Section) Cross 3 Fig (See
East
A Section) Cross 3 Fig (See
West
For
insp
ectio
n pur
pose
s only
.
Conse
nt of
copy
right
owne
r req
uired
for a
ny ot
her u
se.
EPA Export 29-05-2017:03:19:20
Scale 1:500 (at A4 size) Metres
0 5 10 15 20 25 30 35 40
Water Table
UCB PlantBuildings
Overburden
Made Ground
WeatheredLimestone
Bedrock
GS0
6
GS0
3
GS1
2
MW
4
MW
12
MW
19
MW
20
MW
13
MW
14
CompetentLimestone
Bedrock
Site
Bou
ndar
y
Urla
n Be
g Ri
ver
www.verde.ieTel: + 353 1 201 1260 Dat Mare: , 7201 Job Ref: 37450
Title:
Location:Verde
rossSite Section C
Figure No. 3
Avara Ltd Services Pharmaceutical Shannon
Met
res
abov
e si
te d
atum
14
12
10
8
6
2
0
-2
-4
4
LEGEND
Groundwater level
Groundwater �ow direction
Screened Section of Borehole
AWES
TA
EAST
For
insp
ectio
n pur
pose
s only
.
Conse
nt of
copy
right
owne
r req
uired
for a
ny ot
her u
se.
EPA Export 29-05-2017:03:19:20

Verdewww.verde.ie
Tel: + 353 1 201 1260
Title:
Client:
Date: Job Ref: Figure No.
Avara Shannon Pharmaceutical Services Ltd.
50374Feb. 2017Scale 1:2,500 (at A4 size) Metres
0 20 40 60 80 100 120 140 160 180 200
Groundwater Contour Map(Feb. 2017)
BH
LEGENDBorehole LocationXXXSite Boundary
LEGEND
Borehole LocationSubsoil InstallationSubsoil & Bedrock InstallationBedrock InstallationWater Abstraction WellOOUT93UT93Groundwater ContourGroundwater Flow DirectionMetres above Site DatumGroundwater Level (mASD)Site Boundary
MW/GS
(mASD)
10
8.0
8.0
8.5
8.5
9.0
9.0
9.5
9.5
10.0
10.510.0
10.5
11.0
(8.84)
MW19
MW20MW21
GS03
GS06
GS11
GS01
GS12
MW4
MW3
MW5
MW14
GS04
MW12
GS02
MW13
MW9MW10
(8.90)
(9.03)
(9.47)
(8.30)
(11.04)
(8.83)WAW
WAW
(8.89)
4
For
insp
ectio
n pur
pose
s only
.
Conse
nt of
copy
right
owne
r req
uired
for a
ny ot
her u
se.
EPA Export 29-05-2017:03:19:20
Verdé Environmental Consultants Ltd | Part of the Verdé Environmental Group
Tables
For
insp
ectio
n pur
pose
s only
.
Conse
nt of
copy
right
owne
r req
uired
for a
ny ot
her u
se.
EPA Export 29-05-2017:03:19:21
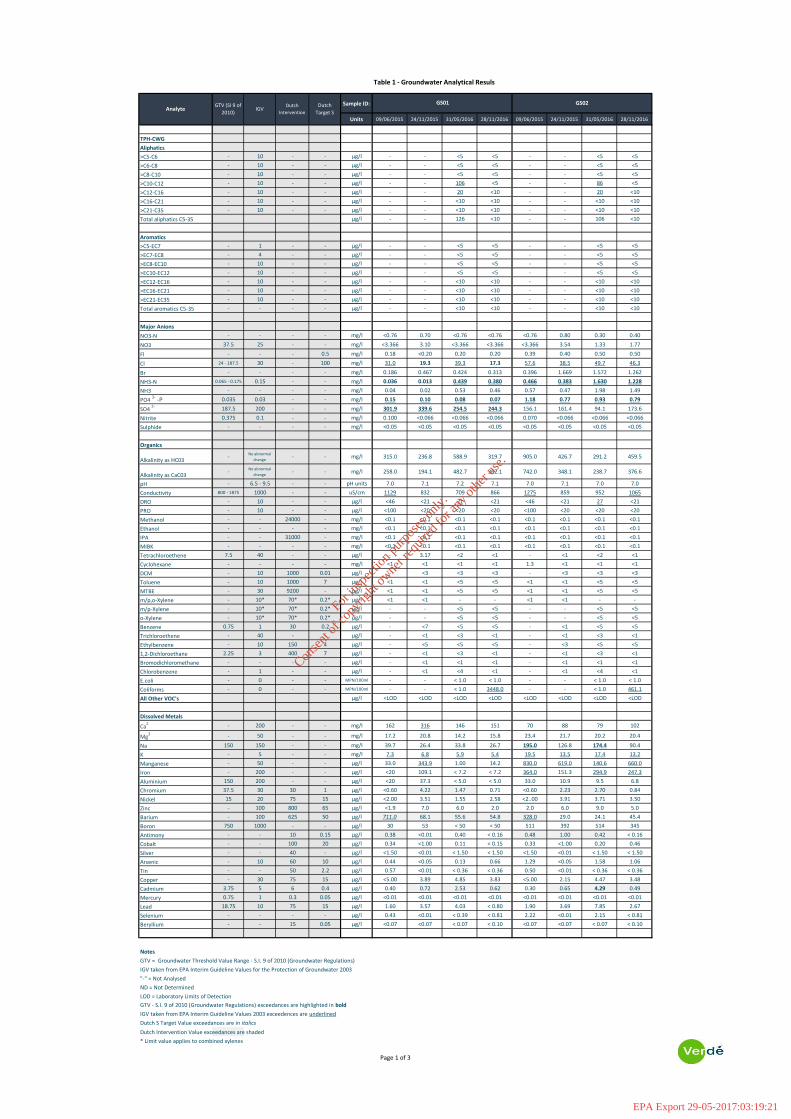
Table 1 - Groundwater Analytical Resuls
Sample ID:
Units 09/06/2015 24/11/2015 31/05/2016 28/11/2016 09/06/2015 24/11/2015 31/05/2016 28/11/2016
TPH-CWG
Aliphatics
>C5-C6 - 10 - - μg/l - - <5 <5 - - <5 <5
>C6-C8 - 10 - - μg/l - - <5 <5 - - <5 <5
>C8-C10 - 10 - - μg/l - - <5 <5 - - <5 <5
>C10-C12 - 10 - - μg/l - - 106 <5 - - 86 <5
>C12-C16 - 10 - - μg/l - - 20 <10 - - 20 <10
>C16-C21 - 10 - - μg/l - - <10 <10 - - <10 <10
>C21-C35 - 10 - - μg/l - - <10 <10 - - <10 <10
Total aliphatics C5-35 μg/l - - 126 <10 - - 106 <10
Aromatics
>C5-EC7 - 1 - - μg/l - - <5 <5 - - <5 <5
>EC7-EC8 - 4 - - μg/l - - <5 <5 - - <5 <5
>EC8-EC10 - 10 - - μg/l - - <5 <5 - - <5 <5
>EC10-EC12 - 10 - - μg/l - - <5 <5 - - <5 <5
>EC12-EC16 - 10 - - μg/l - - <10 <10 - - <10 <10
>EC16-EC21 - 10 - - μg/l - - <10 <10 - - <10 <10
>EC21-EC35 - 10 - - μg/l - - <10 <10 - - <10 <10
Total aromatics C5-35 - - - - μg/l - - <10 <10 - - <10 <10
Major Anions
NO3-N - - - - mg/l <0.76 0.70 <0.76 <0.76 <0.76 0.80 0.30 0.40
NO3 37.5 25 - - mg/l <3.366 3.10 <3.366 <3.366 <3.366 3.54 1.33 1.77
Fl - - - 0.5 mg/l 0.18 <0.20 0.20 0.20 0.39 0.40 0.50 0.50
Cl 24 - 187.5 30 - 100 mg/l 31.0 19.3 39.3 17.3 57.6 38.5 49.7 46.3
Br - - - - mg/l 0.186 0.467 0.424 0.313 0.396 1.669 1.572 1.262
NH3-N 0.065 - 0.175 0.15 - - mg/l 0.036 0.013 0.439 0.380 0.466 0.383 1.630 1.228
NH3 - - - - mg/l 0.04 0.02 0.53 0.46 0.57 0.47 1.98 1.49
PO4 3-
-P 0.035 0.03 - - mg/l 0.15 0.10 0.08 0.07 1.18 0.77 0.93 0.79
SO4 2- 187.5 200 - - mg/l 301.9 339.6 254.5 244.3 156.1 161.4 94.1 173.6
Nitrite 0.375 0.1 - - mg/l 0.100 <0.066 <0.066 <0.066 0.070 <0.066 <0.066 <0.066
Sulphide - - - - mg/l <0.05 <0.05 <0.05 <0.05 <0.05 <0.05 <0.05 <0.05
Organics
Alkalinity as HC03-
No abnormal
change- - mg/l 315.0 236.8 588.9 319.7 905.0 426.7 291.2 459.5
Alkalinity as CaC03-
No abnormal
change- - mg/l 258.0 194.1 482.7 262.1 742.0 348.1 238.7 376.6
pH - 6.5 - 9.5 - - pH units 7.0 7.1 7.2 7.1 7.0 7.1 7.0 7.0
Conductivity 800 - 1875 1000 - - uS/cm 1129 832 709 866 1275 859 952 1065
DRO - 10 - - μg/l <46 <21 21 <21 <46 <21 27 <21
PRO - 10 - - μg/l <100 <20 <20 <20 <100 <20 <20 <20
Methanol - - 24000 - mg/l <0.1 <0.1 <0.1 <0.1 <0.1 <0.1 <0.1 <0.1
Ethanol - - - - mg/l <0.1 <0.1 <0.1 <0.1 <0.1 <0.1 <0.1 <0.1
IPA - - 31000 - mg/l <0.1 <0.1 <0.1 <0.1 <0.1 <0.1 <0.1 <0.1
MIBK - - - - mg/l <0.1 <0.1 <0.1 <0.1 <0.1 <0.1 <0.1 <0.1
Tetrachloroethene 7.5 40 - - μg/l - 3.17 <2 <1 - <1 <2 <1
Cyclohexane - - - - mg/l <1 <1 <1 <1 1.3 <1 <1 <1
DCM - 10 1000 0.01 μg/l - <3 <3 <3 - <3 <3 <3
Toluene - 10 1000 7 μg/l <1 <1 <5 <5 <1 <1 <5 <5
MTBE - 30 9200 - μg/l <1 <1 <5 <5 <1 <1 <5 <5
m/p,o-Xylene - 10* 70* 0.2* μg/l <1 <1 - - <1 <1 - -
m/p-Xylene - 10* 70* 0.2* μg/l - - <5 <5 - - <5 <5
o-Xylene - 10* 70* 0.2* μg/l - - <5 <5 - - <5 <5
Benzene 0.75 1 30 0.2 μg/l - <7 <5 <5 - <1 <5 <5
Trichloroethene - 40 - - μg/l - <1 <3 <1 - <1 <3 <1
Ethylbenzene - 10 150 4 μg/l - <5 <5 <5 - <3 <5 <5
1,2-Dichloroethane 2.25 3 400 7 μg/l - <1 <3 <1 - <1 <3 <1
Bromodichloromethane - - - - μg/l - <1 <1 <1 - <1 <1 <1
Chlorobenzene - 1 - - μg/l - <1 <4 <1 - <1 <4 <1
E.coli - 0 - - MPN/100ml - - < 1.0 < 1.0 - - < 1.0 < 1.0
Coliforms - 0 - - MPN/100ml - - < 1.0 3448.0 - - < 1.0 461.1
All Other VOC's μg/l <LOD <LOD <LOD <LOD <LOD <LOD <LOD <LOD
Dissolved Metals
Ca2 - 200 - - mg/l 162 316 146 151 70 88 79 102
Mg2 - 50 - - mg/l 17.2 20.8 14.2 15.8 23.4 21.7 20.2 20.4
Na 150 150 - - mg/l 39.7 26.4 33.8 26.7 195.0 126.8 174.4 90.4
K - 5 - - mg/l 7.3 6.8 5.9 5.4 19.5 13.5 17.4 13.2
Manganese - 50 - - μg/l 33.0 343.9 1.00 14.2 830.0 619.0 140.6 660.0
Iron - 200 - - μg/l <20 109.1 < 7.2 < 7.2 364.0 151.3 294.9 247.3
Aluminium 150 200 - - μg/l <20 37.3 < 5.0 < 5.0 33.0 10.9 9.5 6.8
Chromium 37.5 30 30 1 μg/l <0.60 4.22 1.47 0.71 <0.60 2.23 2.70 0.84
Nickel 15 20 75 15 μg/l <2.00 3.51 1.55 2.58 <2..00 3.91 3.71 3.50
Zinc - 100 800 65 μg/l <1.9 7.0 6.0 2.0 2.0 6.0 9.0 5.0
Barium - 100 625 50 μg/l 711.0 68.1 55.6 54.8 328.0 29.0 24.1 45.4
Boron 750 1000 - - μg/l 30 53 < 50 < 50 511 392 514 345
Antimony - - 10 0.15 μg/l 0.38 <0.01 0.40 < 0.16 0.48 1.00 0.42 < 0.16
Cobalt - - 100 20 μg/l 0.34 <1.00 0.11 < 0.15 0.33 <1.00 0.20 0.46
Silver - - 40 - μg/l <1.50 <0.01 < 1.50 < 1.50 <1.50 <0.01 < 1.50 < 1.50
Arsenic - 10 60 10 μg/l 0.44 <0.05 0.13 0.66 1.29 <0.05 1.58 1.06
Tin - - 50 2.2 μg/l 0.57 <0.01 < 0.36 < 0.36 0.50 <0.01 < 0.36 < 0.36
Copper - 30 75 15 μg/l <5.00 3.89 4.85 3.83 <5.00 2.15 4.47 3.48
Cadmium 3.75 5 6 0.4 μg/l 0.40 0.72 2.53 0.62 0.30 0.65 4.29 0.49
Mercury 0.75 1 0.3 0.05 μg/l <0.01 <0.01 <0.01 <0.01 <0.01 <0.01 <0.01 <0.01
Lead 18.75 10 75 15 μg/l 1.60 3.57 4.03 < 0.80 1.90 3.69 7.85 2.67
Selenium - - - - μg/l 0.43 <0.01 < 0.39 < 0.81 2.22 <0.01 2.15 < 0.81
Beryllium - - 15 0.05 μg/l <0.07 <0.07 < 0.07 < 0.10 <0.07 <0.07 < 0.07 < 0.10
Notes
GTV = Groundwater Threshold Value Range - S.I. 9 of 2010 (Groundwater Regulations)
IGV taken from EPA Interim Guideline Values for the Protection of Groundwater 2003
"-" = Not Analysed
ND = Not Determined
LOD = Laboratory Limits of Detection
GTV - S.I. 9 of 2010 (Groundwater Regulations) exceedances are highlighted in bold
IGV taken from EPA Interim Guideline Values 2003 exceedences are underlined
Dutch S Target Value exceedances are in italics
Dutch Intervention Value exceedances are shaded
* Limit value applies to combined xylenes
GS02IGV
Dutch
InterventionAnalyte
GTV (SI 9 of
2010)
Dutch
Target S
GS01
Page 1 of 3
For
insp
ectio
n pur
pose
s only
.
Conse
nt of
copy
right
owne
r req
uired
for a
ny ot
her u
se.
EPA Export 29-05-2017:03:19:21

Sample ID:
Units
TPH-CWG
Aliphatics
>C5-C6 - 10 - - μg/l
>C6-C8 - 10 - - μg/l
>C8-C10 - 10 - - μg/l
>C10-C12 - 10 - - μg/l
>C12-C16 - 10 - - μg/l
>C16-C21 - 10 - - μg/l
>C21-C35 - 10 - - μg/l
Total aliphatics C5-35 μg/l
Aromatics
>C5-EC7 - 1 - - μg/l
>EC7-EC8 - 4 - - μg/l
>EC8-EC10 - 10 - - μg/l
>EC10-EC12 - 10 - - μg/l
>EC12-EC16 - 10 - - μg/l
>EC16-EC21 - 10 - - μg/l
>EC21-EC35 - 10 - - μg/l
Total aromatics C5-35 - - - - μg/l
Major Anions
NO3-N - - - - mg/l
NO3 37.5 25 - - mg/l
Fl - - - 0.5 mg/l
Cl 24 - 187.5 30 - 100 mg/l
Br - - - - mg/l
NH3-N 0.065 - 0.175 0.15 - - mg/l
NH3 - - - - mg/l
PO4 3-
-P 0.035 0.03 - - mg/l
SO4 2- 187.5 200 - - mg/l
Nitrite 0.375 0.1 - - mg/l
Sulphide - - - - mg/l
Organics
Alkalinity as HC03-
No abnormal
change- - mg/l
Alkalinity as CaC03-
No abnormal
change- - mg/l
pH - 6.5 - 9.5 - - pH units
Conductivity 800 - 1875 1000 - - uS/cm
DRO - 10 - - μg/l
PRO - 10 - - μg/l
Methanol - - 24000 - mg/l
Ethanol - - - - mg/l
IPA - - 31000 - mg/l
MIBK - - - - mg/l
Tetrachloroethene 7.5 40 - - μg/l
Cyclohexane - - - - mg/l
DCM - 10 1000 0.01 μg/l
Toluene - 10 1000 7 μg/l
MTBE - 30 9200 - μg/l
m/p,o-Xylene - 10* 70* 0.2* μg/l
m/p-Xylene - 10* 70* 0.2* μg/l
o-Xylene - 10* 70* 0.2* μg/l
Benzene 0.75 1 30 0.2 μg/l
Trichloroethene - 40 - - μg/l
Ethylbenzene - 10 150 4 μg/l
1,2-Dichloroethane 2.25 3 400 7 μg/l
Bromodichloromethane - - - - μg/l
Chlorobenzene - 1 - - μg/l
E.coli - 0 - - MPN/100ml
Coliforms - 0 - - MPN/100ml
All Other VOC's μg/l
Dissolved Metals
Ca2 - 200 - - mg/l
Mg2 - 50 - - mg/l
Na 150 150 - - mg/l
K - 5 - - mg/l
Manganese - 50 - - μg/l
Iron - 200 - - μg/l
Aluminium 150 200 - - μg/l
Chromium 37.5 30 30 1 μg/l
Nickel 15 20 75 15 μg/l
Zinc - 100 800 65 μg/l
Barium - 100 625 50 μg/l
Boron 750 1000 - - μg/l
Antimony - - 10 0.15 μg/l
Cobalt - - 100 20 μg/l
Silver - - 40 - μg/l
Arsenic - 10 60 10 μg/l
Tin - - 50 2.2 μg/l
Copper - 30 75 15 μg/l
Cadmium 3.75 5 6 0.4 μg/l
Mercury 0.75 1 0.3 0.05 μg/l
Lead 18.75 10 75 15 μg/l
Selenium - - - - μg/l
Beryllium - - 15 0.05 μg/l
Notes
GTV = Groundwater Threshold Value Range - S.I. 9 of 2010 (Groundwater Regulations)
IGV taken from EPA Interim Guideline Values for the Protection of Groundwater 2003
"-" = Not Analysed
ND = Not Determined
LOD = Laboratory Limits of Detection
GTV - S.I. 9 of 2010 (Groundwater Regulations) exceedances are highlighted in bold
IGV taken from EPA Interim Guideline Values 2003 exceedences are underlined
Dutch S Target Value exceedances are in italics
Dutch Intervention Value exceedances are shaded
* Limit value applies to combined xylenes
IGVDutch
InterventionAnalyte
GTV (SI 9 of
2010)
Dutch
Target S
Table 1 - Groundwater Analytical Resuls
09/06/2015 24/11/2015 31/05/2016 28/11/2016 09/06/2015 24/11/2015 31/05/2016 28/11/2016
- - <5 <5 - - <5 <5
- - <5 <5 - - <5 <5
- - <5 <5 - - <5 <5
- - <5 <5 - - <5 <5
- - <10 <10 - - <10 <10
- - <10 <10 - - <10 <10
- - <10 <10 - - <10 <10
- - <10 <10 - - <10 <10
- - <5 <5 - - <5 <5
- - <5 <5 - - <5 <5
- - <5 <5 - - <5 <5
- - <5 <5 - - <5 <5
- - <10 <10 - - <10 <10
- - <10 <10 - - <10 <10
- - <10 <10 - - <10 <10
- - <10 <10 - - <10 <10
0.90 <0.76 <0.76 <0.76 0.10 <0.76 1.10 <0.76
3.99 <3.366 <3.366 <3.366 0.44 <3.366 4.87 <3.366
0.22 <0.20 0.20 0.20 0.33 0.40 0.40 0.40
39.9 21.0 52.3 269.7 66.7 115.7 72.3 96.7
0.243 0.659 1.156 0.995 0.402 2.160 1.726 1.609
0.045 0.016 0.564 0.795 0.530 0.593 2.642 1.749
0.05 0.02 0.68 0.97 0.65 0.72 3.21 2.12
0.22 0.17 0.10 0.26 0.37 0.38 0.12 0.25
98.1 164.4 102 100 112.3 102.6 152.9 123.8
0.330 0.121 <0.066 <0.066 0.030 <0.066 <0.066 <0.066
<0.05 0.095 <0.05 <0.05 0.39 0.307 <0.05 <0.05
243.0 4163.8 376.0 351.0 592.0 486.0 371.6 408.2
199.0 3412.9 308.2 287.7 485.0 398.4 304.6 334.6
7.3 7.5 7.2 7.3 7.2 7.2 7.2 7.2
744 519 870 1084 1051 880 820 1050
<46 <21 45 <21 50.4 223 207 28
<100 <28 <20 <20 <100 23 <20 <20
<0.1 <0.1 <0.1 <0.1 <0.1 <0.1 <0.1 <0.1
<0.1 <0.1 <0.1 <0.1 <0.1 <0.1 <0.1 <0.1
<0.1 <0.1 <0.1 <0.1 <0.1 <0.1 <0.1 <0.1
<0.1 <0.1 <0.1 <0.1 <0.1 <0.1 <0.1 <0.1
- <1 <2 <1 - 6.5 <2 <1
1.3 <1 <1 <1 <1 <1 <1 <1
- <3 <3 <3 - <3 <3 <3
<1 <1 <5 <5 <1 <1 <5 <5
<1 <1 <5 <5 <1 1.19 <5 <5
<1 <1 - - <1 <1 - -
- - <5 <5 - - <5 <5
- - <5 <5 - - <5 <5
- <1 <5 <5 - <1 <5 <5
- <1 <3 <1 - <1 <3 <1
- <1 <5 <5 - <1 <5 <5
- <1 <3 <1 - <1 <3 <1
- <1 <1 <1 - <1 <1 <1
- <1 <4 <1 - <1 <4 <1
- - < 1.0 < 1.0 - - < 1.0 < 1.0
- - 26.2 165.0 - - 83.3 121.0
<LOD <LOD <LOD <LOD <LOD <LOD <LOD <LOD
87 87 96 302 120 126 125 123
14.5 12.6 17.5 19.2 17.7 17.7 19.9 19.3
37.1 15.3 95.0 114.0 75.7 109.7 65.8 86.5
7.8 5.2 11.4 11.7 11.0 8.6 11.8 11.3
21.0 17.4 0.8 42.9 360.0 87.8 5.3 3.2
<20.0 15.6 10.4 < 7.2 <20.0 11.6 60.8 < 7.2
<20.0 21.3 5.3 < 5.0 <20.0 22.7 < 5.0 < 5.0
<0.60 2.62 2.11 < 0.60 <0.60 2.80 11.49 < 0.60
<2.00 3.49 3.44 1.68 2.80 3.86 10.93 1.75
<1.9 6.0 14.0 7.0 <1.9 7.0 11.0 5.0
182.0 21.5 35.9 32.6 441.0 44.8 45.4 42.6
55 59 68 60 84 97 65 97
0.75 <0.01 0.61 0.25 0.65 <0.01 0.51 0.20
0.19 <1.00 0.11 0.41 0.42 <1.00 0.16 0.19
<1.50 <0.01 < 1.50 < 1.50 <1.50 <0.01 < 1.50 < 1.50
1.39 <0.05 1.75 0.77 1.26 <0.05 1.43 0.79
0.62 <0.01 < 0.36 < 0.36 0.85 <0.01 < 0.36 < 0.36
<5.00 2.79 4.27 3.54 <5.00 2.35 4.12 3.10
0.40 0.56 4.24 0.98 0.30 0.75 2.16 0.77
<0.01 <0.01 <0.01 <0.01 <0.01 <0.01 <0.01 <0.01
<0.8 3.97 6.08 1.31 1.30 4.56 7.83 0.82
3.60 1.00 5.41 0.93 2.95 <0.01 3.65 < 0.81
<0.07 <0.07 < 0.07 < 0.10 <0.07 <0.07 < 0.07 < 0.10
GS03 GS04
Page 2 of 3
For
insp
ectio
n pur
pose
s only
.
Conse
nt of
copy
right
owne
r req
uired
for a
ny ot
her u
se.
EPA Export 29-05-2017:03:19:21

Sample ID:
Units
TPH-CWG
Aliphatics
>C5-C6 - 10 - - μg/l
>C6-C8 - 10 - - μg/l
>C8-C10 - 10 - - μg/l
>C10-C12 - 10 - - μg/l
>C12-C16 - 10 - - μg/l
>C16-C21 - 10 - - μg/l
>C21-C35 - 10 - - μg/l
Total aliphatics C5-35 μg/l
Aromatics
>C5-EC7 - 1 - - μg/l
>EC7-EC8 - 4 - - μg/l
>EC8-EC10 - 10 - - μg/l
>EC10-EC12 - 10 - - μg/l
>EC12-EC16 - 10 - - μg/l
>EC16-EC21 - 10 - - μg/l
>EC21-EC35 - 10 - - μg/l
Total aromatics C5-35 - - - - μg/l
Major Anions
NO3-N - - - - mg/l
NO3 37.5 25 - - mg/l
Fl - - - 0.5 mg/l
Cl 24 - 187.5 30 - 100 mg/l
Br - - - - mg/l
NH3-N 0.065 - 0.175 0.15 - - mg/l
NH3 - - - - mg/l
PO4 3-
-P 0.035 0.03 - - mg/l
SO4 2- 187.5 200 - - mg/l
Nitrite 0.375 0.1 - - mg/l
Sulphide - - - - mg/l
Organics
Alkalinity as HC03-
No abnormal
change- - mg/l
Alkalinity as CaC03-
No abnormal
change- - mg/l
pH - 6.5 - 9.5 - - pH units
Conductivity 800 - 1875 1000 - - uS/cm
DRO - 10 - - μg/l
PRO - 10 - - μg/l
Methanol - - 24000 - mg/l
Ethanol - - - - mg/l
IPA - - 31000 - mg/l
MIBK - - - - mg/l
Tetrachloroethene 7.5 40 - - μg/l
Cyclohexane - - - - mg/l
DCM - 10 1000 0.01 μg/l
Toluene - 10 1000 7 μg/l
MTBE - 30 9200 - μg/l
m/p,o-Xylene - 10* 70* 0.2* μg/l
m/p-Xylene - 10* 70* 0.2* μg/l
o-Xylene - 10* 70* 0.2* μg/l
Benzene 0.75 1 30 0.2 μg/l
Trichloroethene - 40 - - μg/l
Ethylbenzene - 10 150 4 μg/l
1,2-Dichloroethane 2.25 3 400 7 μg/l
Bromodichloromethane - - - - μg/l
Chlorobenzene - 1 - - μg/l
E.coli - 0 - - MPN/100ml
Coliforms - 0 - - MPN/100ml
All Other VOC's μg/l
Dissolved Metals
Ca2 - 200 - - mg/l
Mg2 - 50 - - mg/l
Na 150 150 - - mg/l
K - 5 - - mg/l
Manganese - 50 - - μg/l
Iron - 200 - - μg/l
Aluminium 150 200 - - μg/l
Chromium 37.5 30 30 1 μg/l
Nickel 15 20 75 15 μg/l
Zinc - 100 800 65 μg/l
Barium - 100 625 50 μg/l
Boron 750 1000 - - μg/l
Antimony - - 10 0.15 μg/l
Cobalt - - 100 20 μg/l
Silver - - 40 - μg/l
Arsenic - 10 60 10 μg/l
Tin - - 50 2.2 μg/l
Copper - 30 75 15 μg/l
Cadmium 3.75 5 6 0.4 μg/l
Mercury 0.75 1 0.3 0.05 μg/l
Lead 18.75 10 75 15 μg/l
Selenium - - - - μg/l
Beryllium - - 15 0.05 μg/l
Notes
GTV = Groundwater Threshold Value Range - S.I. 9 of 2010 (Groundwater Regulations)
IGV taken from EPA Interim Guideline Values for the Protection of Groundwater 2003
"-" = Not Analysed
ND = Not Determined
LOD = Laboratory Limits of Detection
GTV - S.I. 9 of 2010 (Groundwater Regulations) exceedances are highlighted in bold
IGV taken from EPA Interim Guideline Values 2003 exceedences are underlined
Dutch S Target Value exceedances are in italics
Dutch Intervention Value exceedances are shaded
* Limit value applies to combined xylenes
IGVDutch
InterventionAnalyte
GTV (SI 9 of
2010)
Dutch
Target S
Table 1 - Groundwater Analytical Resuls
09/06/2015 24/11/2015 31/05/2016 28/11/2016 09/06/2015 24/11/2015 31/05/2016 28/11/2016 09/06/2015 24/11/2015 31/05/2016 28/11/2016
- - <5 <5 - - <5 <5 - - <5 <5
- - <5 <5 - - <5 <5 - - <5 <5
- - <5 <5 - - <5 <5 - - <5 <5
- - <5 <5 - - <5 <5 - - <5 <5
- - <10 <10 - - <10 <10 - - <10 <10
- - <10 <10 - - <10 <10 - - <10 <10
- - <10 <10 - - <10 <10 - - <10 <10
- - <10 <10 - - <10 <10 - - <10 <10
- - <5 <5 - - <5 <5 - - <5 <5
- - <5 <5 - - <5 <5 - - <5 <5
- - <5 <5 - - <5 <5 - - <5 <5
- - <5 <5 - - <5 <5 - - <5 <5
- - <10 <10 - - <10 <10 - - <10 <10
- - <10 <10 - - <10 <10 - - <10 <10
- - <10 <10 - - <10 <10 - - <10 <10
- - <10 <10 - - <10 <10 - - <10 <10
1.60 <0.76 1.10 <0.76 <0.76 <0.76 1.40 <0.76 <0.76 <0.76 0.10 13.60
7.09 <3.366 4.87 <3.366 <3.366 <3.366 6.20 <3.366 <3.366 0.00 0.44 60.25
0.16 <0.20 0.20 0.20 0.38 0.40 0.40 0.50 0.14 <0.20 0.10 0.20
64.6 47.6 55.0 47.8 72.2 62.3 70.3 74.8 42.1 44.2 40.9 98.2
0.261 1.342 0.975 0.488 0.320 2.040 1.338 1.224 0.147 0.889 0.575 0.382
0.253 0.190 1.005 0.640 0.715 0.578 2.401 1.418 0.026 0.013 0.601 0.562
0.31 0.23 1.22 0.78 0.87 0.71 2.92 1.72 0.03 0.02 0.73 0.68
0.38 0.35 0.09 0.58 0.54 0.20 0.27 0.10 0.43 0.18 0.19 0.33
205.8 210.2 179.2 211.3 111 138.9 75.4 99.3 136.8 189.9 99.8 123.8
0.030 <0.066 <0.066 <0.066 0.030 <0.066 <0.066 <0.066 0.070 0.125 <0.066 <0.066
<0.05 <0.05 <0.05 <0.05 <0.05 <0.05 <0.05 <0.05 <0.05 <0.05 <0.05 <0.05
336.0 356.9 516.1 341.9 720.0 542.8 462.1 554.9 528.0 340.6 < 36.9 485.6
275.0 292.5 423.1 280.3 590.0 444.9 378.7 454.8 433.0 279.2 < 30.0 398.1
6.8 7.1 7.1 7.0 6.9 7.2 6.9 7.0 6.9 7.0 6.9 6.9
1168 792 784 906 1238 888 882 1076 1062 731 800 912
<46 <21 21 <21 <46 <21 21 <21 <46 <21 21 <21
<100 <20 <20 <20 <100 <20 <20 <20 <100 <20 <20 <20
<0.1 <0.1 <0.1 <0.1 <0.1 <0.1 <0.1 <0.1 <0.1 <0.1 <0.1 <0.1
<0.1 <0.1 <0.1 <0.1 <0.1 <0.1 <0.1 <0.1 <0.1 <0.1 <0.1 <0.1
<0.1 <0.1 <0.1 <0.1 <0.1 <0.1 <0.1 <0.1 <0.1 <0.1 <0.1 <0.1
<0.1 <0.1 <0.1 <0.1 <0.1 <0.1 <0.1 <0.1 <0.1 <0.1 <0.1 <0.1
- <1 <2 <1 - <1 <2 <1 - <1 <2 <1
<1 <1 <1 <1 <1 <1 <1 <1 <1 <1 <1 <1
- <3 <3 <3 - <3 <3 <3 - <3 <3 <3
<1 <1 <5 <5 <1 <1 <5 <5 <1 <1 <5 <5
<1 <1 <5 <5 10.4 3.29 <5 <5 11 <1 <5 <5
<1 <1 - - <1 <1 - - <1 <1 - -
- - <5 <5 - - <5 <5 - - <5 <5
- - <5 <5 - - <5 <5 - - <5 <5
- <1 <5 <5 - <1 <5 <5 - <1 <5 <5
- <1 <3 <1 - <1 <3 <1 - <1 <3 <1
- <1 <5 <5 - <1 <5 <5 - <5 <5 <5
- <1 <3 <1 - <1 <3 <1 - <1 <3 <1
- <1 <1 <1 - <1 <1 <1 - <1 <1 <1
- <1 <4 <1 - <1 <4 <1 - <1 <4 <1
- - < 1.0 < 1.0 - - < 1.0 < 1.0 - - < 1.0 < 1.0
- - < 1.0 2.0 - - < 1.0 3.0 - - 5.2 18.5
<LOD <LOD <LOD <LOD <LOD <LOD <LOD <LOD <LOD <LOD <LOD <LOD
134 153 152 216 102 116 111 106 111 347 166 233
19.2 17.6 15.0 16.5 37.1 39.4 33.1 33.6 15.6 19.3 16.6 17.6
49.2 45.7 48.8 35.3 116.0 121.0 86.9 84.7 25.3 26.1 29.1 26.1
5.9 5.2 6.5 6.9 16.8 14.7 15.3 15.2 5.1 5.8 6.1 5.6
188.0 218.5 1.0 29.6 278.0 173.7 417.3 279.4 <5 1.0 < 0.7 1.2
<20 51.8 < 7.2 < 7.2 291.0 68.7 142.2 162.9 <20.0 <7.20 9.4 < 7.2
<20 8.6 < 5.0 < 5.0 <20.0 11.3 < 5.0 < 5.0 <20.0 <5 < 5.0 < 5.0
<0.60 2.15 1.69 < 0.60 <0.60 2.44 1.72 < 0.60 <0.60 0.87 1.44 < 0.60
<2.00 2.82 4.64 3.10 <2.00 2.44 2.16 < 0.25 <2.00 1.89 2.57 1.24
<1.9 6.0 12.0 5.0 2.0 8.0 11.0 7.0 2.0 10.0 8.0 2.0
425.0 37.2 39.8 43.3 128.0 21.9 21.9 < 20.0 856.0 83.7 71.6 82.7
39 52 < 50 < 50 285 313 245 278 33 <50 < 50 < 50
0.68 <0.01 0.66 < 0.16 0.82 <0.01 0.55 < 0.16 0.93 <0.01 0.47 < 0.16
0.69 <1.00 0.22 0.90 0.53 1.00 0.24 < 0.15 0.24 <1.00 0.33 < 0.15
<1.50 <0.01 < 1.50 < 1.50 <1.50 <0.01 < 1.50 < 1.50 <1.50 <0.01 < 1.50 < 1.50
0.92 <0.05 0.36 0.87 1.62 <0.05 0.97 2.13 0.80 <0.05 0.53 0.70
0.94 <0.01 0.90 < 0.36 1.12 <0.01 0.43 < 0.36 1.19 <0.01 < 0.36 < 0.36
<5.00 2.77 4.30 3.10 <5.00 2.53 3.54 3.39 <5.00 2.82 4.36 3.29
0.40 0.79 3.88 0.48 0.20 0.78 6.17 0.58 0.40 0.61 3.02 0.59
<0.01 <0.01 <0.01 <0.01 <0.01 <0.01 <0.01 <0.01 <0.01 <0.01 <0.01 <0.01
2.30 3.50 6.33 1.71 1.20 3.41 4.81 < 0.80 1.30 3.07 4.36 < 0.80
1.16 <0.01 0.53 < 0.81 1.73 <0.01 1.32 < 0.81 1.80 <0.01 1.27 < 0.81
<0.07 <0.07 < 0.07 < 0.10 <0.07 <0.07 < 0.07 < 0.10 <0.07 <0.07 < 0.07 < 0.10
GS06 GS11 GS12
Page 3 of 3
For
insp
ectio
n pur
pose
s only
.
Conse
nt of
copy
right
owne
r req
uired
for a
ny ot
her u
se.
EPA Export 29-05-2017:03:19:21