re co mme n dat i o n : b uy re a l e s t a te cur re n t
TRANSCRIPT
Krause Fund ResearchSpring 2021April 12th, 2021
Crown Castle InternationalCorporation (NYSE: CCI)Real Estate
Recommendation: BUYCurrent Price $177.93Target Price $280-288
Analysts
Adam [email protected] [email protected] [email protected] [email protected] [email protected]
Investment Thesis
We recommend a BUY rating for Crown Castle InternationalCorporation.
CCI Exhibits Potential Strength:
● As 5G becomes the standard for broadband networks,infrastructure REITs must adapt accordingly. Crown CastleInternational (CCI) has positioned itself by focusingoperations on small cells that support the change.
● Compared to its competitors, the Company has already madethe switch to focus operations on small cell technology thathas many advantages over its predecessor in wirelesscommunication.
● If the democrat’s and FCC’s proposed infrastructure billspass, Crown Castle’s market will significantly expand to ruraland suburban areas where it has not yet focused itsoperations.
● Crown Castle has recently signed new contracts andagreements with its tenants and some of the largesttelecommunication companies in the world, AT&T, Verizon,and T-Mobile, to continue small cell operations over the next15 years
Company Overview
Crown Castle International Corp. is a REIT that engages in theprovision of access to wireless infrastructure to internet and cellservice providers via long-term lease agreements. CCI operatesthrough its Towers and Fiber segments. The Towers segmentencompasses cell towers dispersed throughout the United States.The Fiber segment encompasses infrastructure used to supportsmall-cell networks and fiber solutions.
Valuation Methods
DCF/EP $283.01DDM $244.47Relative P/FFO (EPS21) $180.70
Stock Performance Highlights
52 Week High $180.0052 Week Low $146.15Beta Value 0.74
Key Statistics
Market Cap (M) $76,545Shares Outstanding (M) 423Dividend (Yield) 24.09 (3.04%)EPS (2021E) 3.66
Company Performance Highlights
ROE 21.30%FFO (M) $2,605P/FFO $23.50Dividend Payout Ratio 85.87%
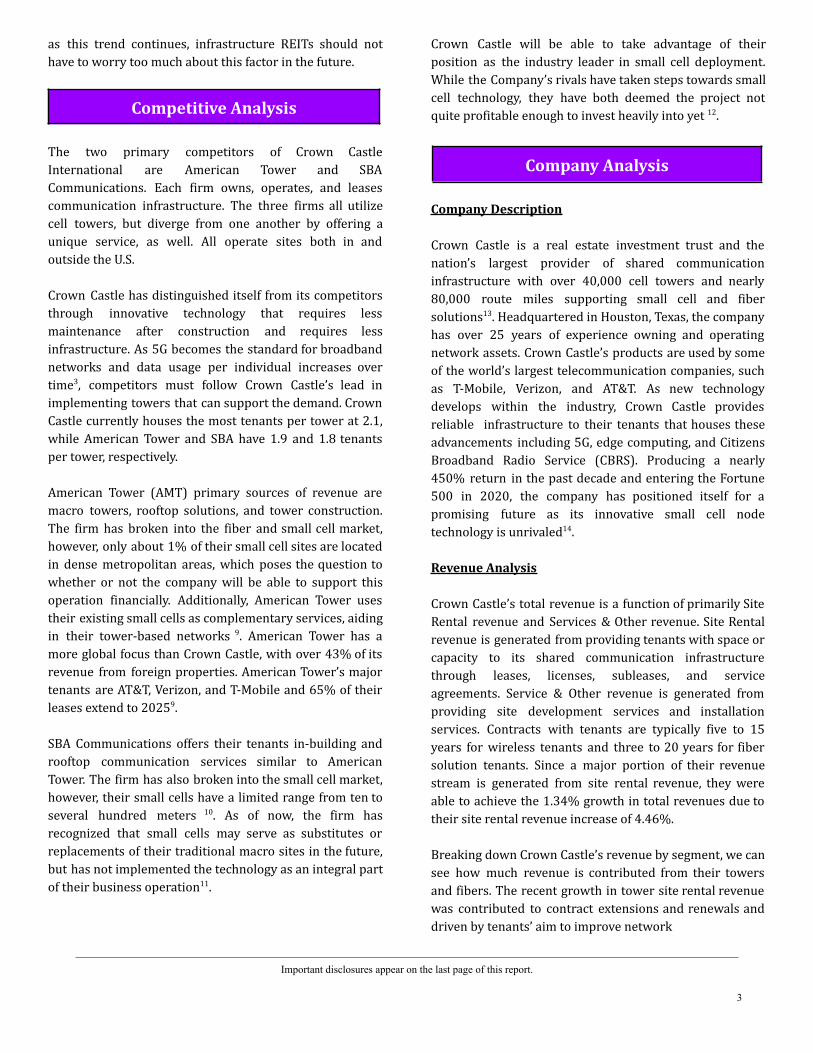
12 Month Performance (excluding dividends)

Executive Summary
Crown Castle International (CCI) has positioned itself tolead the infrastructure REIT industry by expanding itsfiber and small cell operations to support the increasingdemand of data. Crown Castle will be able to capitalize onthe expansion of 5G to underserved and unserved parts ofthe country as federal funding of fiber infrastructureincreases. All of the firm’s major tenants have entered intonew long-term contracts and agreements with theCompany to continue leasing the Company's fibertechnology. Given the fact that their lease agreements arebetween three to 20 years in length, Crown Castle will havea steady stream of revenue in the following years.
Industry Analysis
Industry Description
Crown Castle International (CCI) is in the infrastructureREITs industry within the real estate sector. CCI and itscompetitors' primary business segment focus on owning,operating, and leasing shared communicationsinfrastructure. This includes cell tower and rooftopinfrastructure that is rented out to companies like AT&T,Verizon Wireless, and T-Mobile. On average, 86.74% ofthese companies' total revenue came from property leasingin 2019. We identified 4 major players in this industry,American Tower (AMT), Crown Castle (CCI), SBACommunications (SBAC), along with small-cap Uniti Group(UNIT) which owns a large fiber optic cable network alongwith a smaller cell tower portfolio. CCI and its competitorsmain growth strategy is increasing the number of tenantsthey have under contract while maintaining lowincremental operating costs.
We believe the infrastructure REITs industry is in themature stage of its life cycle. The COVID-19 pandemic didnot disrupt these companies' business models to thedegree of other industries; as revenue was still generatedin the form of rental payments. However, their growthprospects are limited. The YTD weighted average return ofthe industry as a whole was -3.88% compared to 16.44%return of the market1. Therefore, we would classify thisindustry as “defensive” in the business cycle.
However, there are a few ways they differentiatethemselves from their competitors. CCI operates all of itstowers exclusively out of the US, and is investing heavilyinto fiber solutions for small cell networks. AmericanTower Corporation (AMT) is the leader in the internationalmarket as most of their towers are located overseas. All ofthese companies attempt to achieve economies of scale bysigning more tenants to their operating infrastructure.
Source: Seeking Alpha1
Recent Development and Industry Trends
Technological Change
The implementation of 5G hardware has allowedcommunities access to information nearly a hundred timesfaster than its broadband antecedent 4G. Introduced in2019, 5G took over many urban areas, however, 4G is stillcommon in rural areas. Companies within this industrymay take advantage of this surge in demand by purchasing5G infrastructure once it becomes more popular across therural areas in the next following years. 54% of all mobiledata will be transmitted via 5G2. Furthermore, 49GB ofdata will be consumed per month and smartphone inNorth America by 2026. That is a 315% increase from2020.
Source: Telefonaktiebolaget LM Ericsson3
Important disclosures appear on the last page of this report.
1

Small cell nodes, or small cells, have been growing in useamong the infrastructure REIT firms. Small cell nodesdiffer from traditional macro cell towers in many ways.First, the compact cylinders are small enough to beattached to existing infrastructure in a community, such asa light pole or utility pole. Secondly, they use fiber opticcable which makes them a better option in urban areassince they take up far less than regular towers since thecables may be stored underground. Similar to cell towers,the small cells connect to the internet over radio waves.Furthermore, small cells provide similar capacity andcoverage as a regular tower. Small cells are designed tosupport multiple carriers, therefore much lessconstruction and maintenance as a tower. Since multiplesmall cells may be implemented in a single area, wirelessdensity increases and the chance one’s signal could be lostsignificantly decreases. Finally, because the cells arepowered by fiber, this also allows them to be replaced orupgraded quickly and efficiently 4.
Government and Regulatory Change
COVID-19 has significantly decreased people’s face-to-faceinteractions in the past year, and this will continue untilstates declare it’s safe to return to the office, hold in personclasses, etc. To make up for this, people have had to use theinternet significantly more than they had to hold meetings,attend class, and other social activities. State mandatedlockdowns have been beneficial for wirelesscommunication infrastructure REITS. Many believe thatsome changes due to COVID may be permanent, includingthe work from home structure. If this holds to be true, itwill be beneficial for the internet providers and theinfrastructure owners.
The FCC regulates telecommunication by processinglicences, implementing regulatory action, and conductinginvestigations. The Emergency Broadband Connections Actof 2020 was enacted to enable access of high-speedinternet for low-income houses during the pandemic5.Individuals who’ve been laid off are entitled to $50 fortheir monthly internet bill. The $7 billion in total fundingallowed internet providers to maintain their clientele andincome. The funding was most likely promising news toinvestors and may have played a role in the steady increasein infrastructure REITS stock prices over the last couplemonths.
Social and Demographic Changes
As previously stated, COVID-19 has caused many people tocommunicate virtually. Even in states where governmentmandated lockdowns weren’t authorized, many peoplewere resorting to Zoom and other services tocommunicate. Because of this, people have upgraded tofaster internet speeds, which has been beneficial to theREITs within this industry.
A social trend that has been rising over the past decade hasbeen people’s overall use of the internet. People arebecoming more virtually connected and the demand foraccess to this virtual communication along with the switchto 5G is a testimony of this.
M&A Activity
In January 2021, American Tower Corp. acquiredTelefónica’s tower business, Telxius Towers in a deal forover $9 billion. This purchase included 30,000 towers inEurope and South America, expanding their internationalmarket6.
SBA Communications acquired New Continuum DataCenters in 2019, which diversifies their portfolio furtherand began their focus on a new line, edge computing7. Thecompany later purchased JaxNAP Data Center, starting SBAEdge, the company’s edge computing line focused onproviding low latency connectivity to wireless networks.
American Tower Corp. later followed suit bypurchasing ColoATL, beginning American Tower Edge,their own edge computing service8. As of now CrownCastle nor Uniti Corp. have not acquired any datacenters which leaves a critical opportunity for the twoREITs in the upcoming years.
Economic Changes
Once there are no more stimulus packages beingdistributed by the federal government, the unemploymentrate and household income will be major determinants ofpeople’s ability to pay their phone bills. If many customersfall behind on their payments, it will become harder forinternet providers to pay the companies that own theinfrastructure, such as CCI. Fortunately, the unemploymentrate has begun to decrease since mid-pandemic, so as long
Important disclosures appear on the last page of this report.
2
as this trend continues, infrastructure REITs should nothave to worry too much about this factor in the future.
Competitive Analysis
The two primary competitors of Crown CastleInternational are American Tower and SBACommunications. Each firm owns, operates, and leasescommunication infrastructure. The three firms all utilizecell towers, but diverge from one another by offering aunique service, as well. All operate sites both in andoutside the U.S.
Crown Castle has distinguished itself from its competitorsthrough innovative technology that requires lessmaintenance after construction and requires lessinfrastructure. As 5G becomes the standard for broadbandnetworks and data usage per individual increases overtime3, competitors must follow Crown Castle’s lead inimplementing towers that can support the demand. CrownCastle currently houses the most tenants per tower at 2.1,while American Tower and SBA have 1.9 and 1.8 tenantsper tower, respectively.
American Tower (AMT) primary sources of revenue aremacro towers, rooftop solutions, and tower construction.The firm has broken into the fiber and small cell market,however, only about 1% of their small cell sites are locatedin dense metropolitan areas, which poses the question towhether or not the company will be able to support thisoperation financially. Additionally, American Tower usestheir existing small cells as complementary services, aidingin their tower-based networks 9. American Tower has amore global focus than Crown Castle, with over 43% of itsrevenue from foreign properties. American Tower’s majortenants are AT&T, Verizon, and T-Mobile and 65% of theirleases extend to 20259.
SBA Communications offers their tenants in-building androoftop communication services similar to AmericanTower. The firm has also broken into the small cell market,however, their small cells have a limited range from ten toseveral hundred meters 10. As of now, the firm hasrecognized that small cells may serve as substitutes orreplacements of their traditional macro sites in the future,but has not implemented the technology as an integral partof their business operation11.
Crown Castle will be able to take advantage of theirposition as the industry leader in small cell deployment.While the Company’s rivals have taken steps towards smallcell technology, they have both deemed the project notquite profitable enough to invest heavily into yet 12.
Company Analysis
Company Description
Crown Castle is a real estate investment trust and thenation’s largest provider of shared communicationinfrastructure with over 40,000 cell towers and nearly80,000 route miles supporting small cell and fibersolutions13. Headquartered in Houston, Texas, the companyhas over 25 years of experience owning and operatingnetwork assets. Crown Castle’s products are used by someof the world’s largest telecommunication companies, suchas T-Mobile, Verizon, and AT&T. As new technologydevelops within the industry, Crown Castle providesreliable infrastructure to their tenants that houses theseadvancements including 5G, edge computing, and CitizensBroadband Radio Service (CBRS). Producing a nearly450% return in the past decade and entering the Fortune500 in 2020, the company has positioned itself for apromising future as its innovative small cell nodetechnology is unrivaled14.
Revenue Analysis
Crown Castle’s total revenue is a function of primarily SiteRental revenue and Services & Other revenue. Site Rentalrevenue is generated from providing tenants with space orcapacity to its shared communication infrastructurethrough leases, licenses, subleases, and serviceagreements. Service & Other revenue is generated fromproviding site development services and installationservices. Contracts with tenants are typically five to 15years for wireless tenants and three to 20 years for fibersolution tenants. Since a major portion of their revenuestream is generated from site rental revenue, they wereable to achieve the 1.34% growth in total revenues due totheir site rental revenue increase of 4.46%.
Breaking down Crown Castle’s revenue by segment, we cansee how much revenue is contributed from their towersand fibers. The recent growth in tower site rental revenuewas contributed to contract extensions and renewals anddriven by tenants’ aim to improve network
Important disclosures appear on the last page of this report.
3
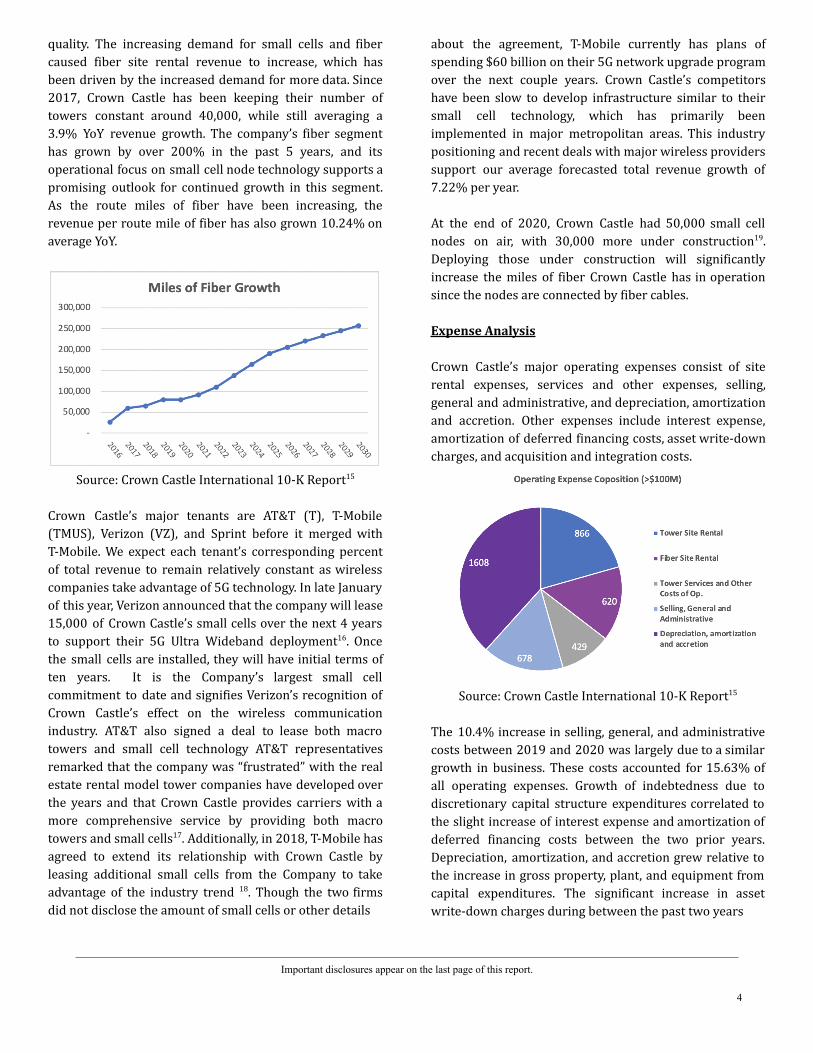
quality. The increasing demand for small cells and fibercaused fiber site rental revenue to increase, which hasbeen driven by the increased demand for more data. Since2017, Crown Castle has been keeping their number oftowers constant around 40,000, while still averaging a3.9% YoY revenue growth. The company’s fiber segmenthas grown by over 200% in the past 5 years, and itsoperational focus on small cell node technology supports apromising outlook for continued growth in this segment.As the route miles of fiber have been increasing, therevenue per route mile of fiber has also grown 10.24% onaverage YoY.
Source: Crown Castle International 10-K Report15
Crown Castle’s major tenants are AT&T (T), T-Mobile(TMUS), Verizon (VZ), and Sprint before it merged withT-Mobile. We expect each tenant’s corresponding percentof total revenue to remain relatively constant as wirelesscompanies take advantage of 5G technology. In late Januaryof this year, Verizon announced that the company will lease15,000 of Crown Castle’s small cells over the next 4 yearsto support their 5G Ultra Wideband deployment16. Oncethe small cells are installed, they will have initial terms often years. It is the Company’s largest small cellcommitment to date and signifies Verizon’s recognition ofCrown Castle’s effect on the wireless communicationindustry. AT&T also signed a deal to lease both macrotowers and small cell technology AT&T representativesremarked that the company was “frustrated” with the realestate rental model tower companies have developed overthe years and that Crown Castle provides carriers with amore comprehensive service by providing both macrotowers and small cells17. Additionally, in 2018, T-Mobile hasagreed to extend its relationship with Crown Castle byleasing additional small cells from the Company to takeadvantage of the industry trend 18. Though the two firmsdid not disclose the amount of small cells or other details
about the agreement, T-Mobile currently has plans ofspending $60 billion on their 5G network upgrade programover the next couple years. Crown Castle’s competitorshave been slow to develop infrastructure similar to theirsmall cell technology, which has primarily beenimplemented in major metropolitan areas. This industrypositioning and recent deals with major wireless providerssupport our average forecasted total revenue growth of7.22% per year.
At the end of 2020, Crown Castle had 50,000 small cellnodes on air, with 30,000 more under construction19.Deploying those under construction will significantlyincrease the miles of fiber Crown Castle has in operationsince the nodes are connected by fiber cables.
Expense Analysis
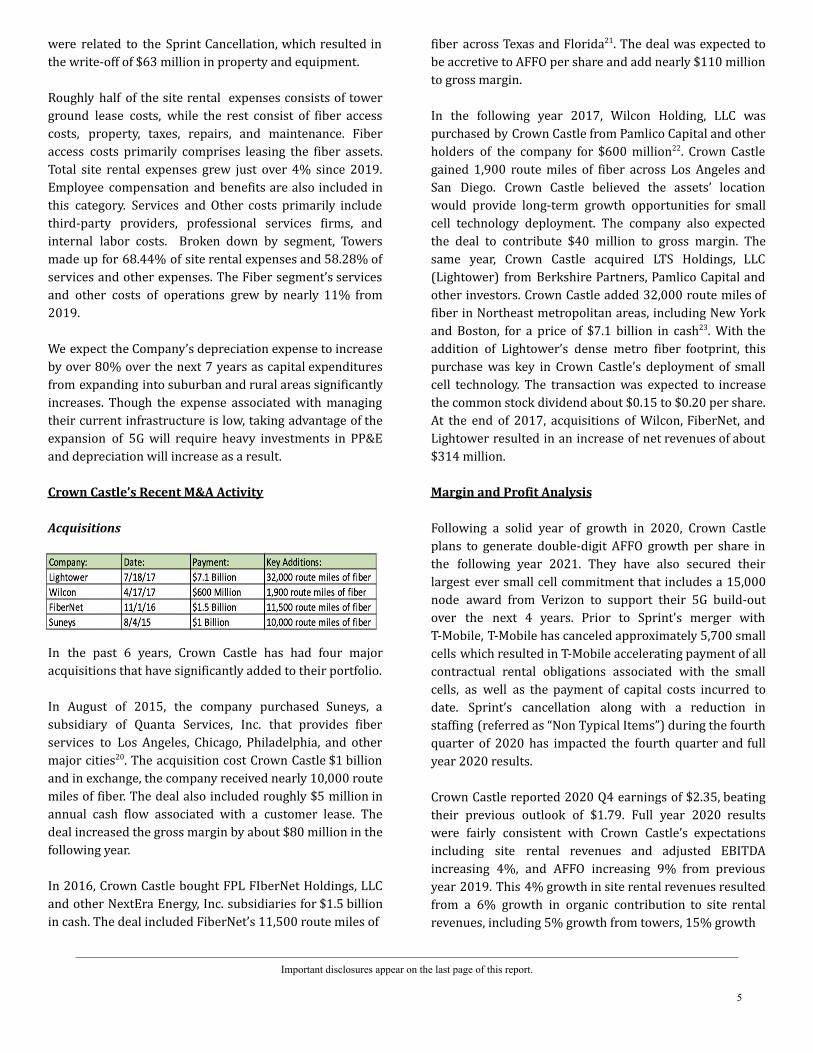
Crown Castle’s major operating expenses consist of siterental expenses, services and other expenses, selling,general and administrative, and depreciation, amortizationand accretion. Other expenses include interest expense,amortization of deferred financing costs, asset write-downcharges, and acquisition and integration costs.
Source: Crown Castle International 10-K Report15
The 10.4% increase in selling, general, and administrativecosts between 2019 and 2020 was largely due to a similargrowth in business. These costs accounted for 15.63% ofall operating expenses. Growth of indebtedness due todiscretionary capital structure expenditures correlated tothe slight increase of interest expense and amortization ofdeferred financing costs between the two prior years.Depreciation, amortization, and accretion grew relative tothe increase in gross property, plant, and equipment fromcapital expenditures. The significant increase in assetwrite-down charges during between the past two years
Important disclosures appear on the last page of this report.
4
were related to the Sprint Cancellation, which resulted inthe write-off of $63 million in property and equipment.
Roughly half of the site rental expenses consists of towerground lease costs, while the rest consist of fiber accesscosts, property, taxes, repairs, and maintenance. Fiberaccess costs primarily comprises leasing the fiber assets.Total site rental expenses grew just over 4% since 2019.Employee compensation and benefits are also included inthis category. Services and Other costs primarily includethird-party providers, professional services firms, andinternal labor costs. Broken down by segment, Towersmade up for 68.44% of site rental expenses and 58.28% ofservices and other expenses. The Fiber segment’s servicesand other costs of operations grew by nearly 11% from2019.
We expect the Company’s depreciation expense to increaseby over 80% over the next 7 years as capital expendituresfrom expanding into suburban and rural areas significantlyincreases. Though the expense associated with managingtheir current infrastructure is low, taking advantage of theexpansion of 5G will require heavy investments in PP&Eand depreciation will increase as a result.
Crown Castle’s Recent M&A Activity
Acquisitions
In the past 6 years, Crown Castle has had four majoracquisitions that have significantly added to their portfolio.
In August of 2015, the company purchased Suneys, asubsidiary of Quanta Services, Inc. that provides fiberservices to Los Angeles, Chicago, Philadelphia, and othermajor cities20. The acquisition cost Crown Castle $1 billionand in exchange, the company received nearly 10,000 routemiles of fiber. The deal also included roughly $5 million inannual cash flow associated with a customer lease. Thedeal increased the gross margin by about $80 million in thefollowing year.
In 2016, Crown Castle bought FPL FIberNet Holdings, LLCand other NextEra Energy, Inc. subsidiaries for $1.5 billionin cash. The deal included FiberNet’s 11,500 route miles of
fiber across Texas and Florida21. The deal was expected tobe accretive to AFFO per share and add nearly $110 millionto gross margin.
In the following year 2017, Wilcon Holding, LLC waspurchased by Crown Castle from Pamlico Capital and otherholders of the company for $600 million22. Crown Castlegained 1,900 route miles of fiber across Los Angeles andSan Diego. Crown Castle believed the assets’ locationwould provide long-term growth opportunities for smallcell technology deployment. The company also expectedthe deal to contribute $40 million to gross margin. Thesame year, Crown Castle acquired LTS Holdings, LLC(Lightower) from Berkshire Partners, Pamlico Capital andother investors. Crown Castle added 32,000 route miles offiber in Northeast metropolitan areas, including New Yorkand Boston, for a price of $7.1 billion in cash23. With theaddition of Lightower’s dense metro fiber footprint, thispurchase was key in Crown Castle’s deployment of smallcell technology. The transaction was expected to increasethe common stock dividend about $0.15 to $0.20 per share.At the end of 2017, acquisitions of Wilcon, FiberNet, andLightower resulted in an increase of net revenues of about$314 million.
Margin and Profit Analysis
Following a solid year of growth in 2020, Crown Castleplans to generate double-digit AFFO growth per share inthe following year 2021. They have also secured theirlargest ever small cell commitment that includes a 15,000node award from Verizon to support their 5G build-outover the next 4 years. Prior to Sprint's merger withT-Mobile, T-Mobile has canceled approximately 5,700 smallcells which resulted in T-Mobile accelerating payment of allcontractual rental obligations associated with the smallcells, as well as the payment of capital costs incurred todate. Sprint’s cancellation along with a reduction instaffing (referred as “Non Typical Items”) during the fourthquarter of 2020 has impacted the fourth quarter and fullyear 2020 results.
Crown Castle reported 2020 Q4 earnings of $2.35, beatingtheir previous outlook of $1.79. Full year 2020 resultswere fairly consistent with Crown Castle’s expectationsincluding site rental revenues and adjusted EBITDAincreasing 4%, and AFFO increasing 9% from previousyear 2019. This 4% growth in site rental revenues resultedfrom a 6% growth in organic contribution to site rentalrevenues, including 5% growth from towers, 15% growth
Important disclosures appear on the last page of this report.
5

from small cells and 3% growth from theri fiber solutions.Crown Castle’s net income also grew about 23% from 2019and was impacted by the retirement of $2.4 billion ofsenior unsecured notes that took place during July of 2020,which resulted in a decrease of $95 million of long-termobligations. However, nontypical items had a positiveimpact on Crown Castle’s net income of around $223million.
CCI expects their full year 2021 outlook to mirror theirprevious outlook for 2020, consisting of a 4% growth inSite Rental Revenues, 5% growth in Adjusted EBITDA and a12% growth in AFFO24. The 4% growth in Site RentalRevenues includes a 6% expected growth in the OrganicContribution to Site Rental Revenues, including 6% growthfrom towers, 15% growth from small cells and 3% growthfrom their fiber solutions.
Capital Structure
As of 12/31/20, CCI had a significant amount of long termdebt outstanding ($19.74B). With that being said, CCI hashistorically collected plenty of cash to cover their debtobligations and still pay out dividends to theirshareholders. Despite the discrepancy between contractedrevenue and contracted debt payments, with the growth of5G and CCI’s prominence as a leader in the small celltechnology wave of the future, we have no reason tobelieve that CCI will be unable to repay their long termdebt during our forecast horizon.
In their FYE 2020 10-K, CCI did not disclose a target capitalstructure.
In May of 2020, CCI was upgraded from a BBB credit ratingto BBB+ by Fitch. Their historical rating has ranged fromBB in November 2010 to a BBB- upgrade in July 2015 to a
BBB upgrade in October 2018, to a BBB+ this last May,strongly positioned relative to CCI’s peers.
The current Fitch ratings for Crown Castles competitorsare as follows: BBB+ for AMT and BB for SBAC
Corporate Governance
0.41% of Crown Castle’s equity is controlled by insiders,totalling roughly $293 million CEO Jay Brown owns around$42.5 million of equity25. The COO and Executive VP ofCorporate Strategy own roughly $31million and $19million, respectively.
Recently, there has been noteworthy publicity surroundingan active investor hedge fund, Elliot Management,regarding their summer 2020 criticism of Crown Castle’sinvestments into fiber as well as their dividend yield26.Elliot believed that CCI was investing too much money intotheir fiber division, and believed this capital would bebetter allocated for a higher dividend for shareholders, ormore robust tower infrastructure. There has been nonewsworthy activity from activist investors since thissituation, but this quarrel with Elliot caused CCI tonominate new board members and refine its policyregarding a mandatory board member retirement age27.Three new board members are expected to begin inmid-2021.
Key Investment Positives
Mobile data demand is expected to grow dramatically inthe long term with increased innovation in Internet ofThings. In general, Cell REITs could practically chargeanything in many areas as smaller markets typically havelimited options when it comes to tower selection. Due tothis, Crown Castle can currently be seen as a price makeras they ultimately control the infrastructure andconnectivity for whatever area they operate in, and mobilecarriers are unable to function without their towerinfrastructure - particularly for their dominance in smallcell and fiber technology.
The C-Band spectrum is expected to unlock 5G networkinfrastructure spending in the near future28. Technicallyknown as Auction 107, is a process by which the USgovernment is providing the ability for companies tolicense and use highly favorable radio frequencies knownas the C-Band. The C-Band offers a great combination ofcoverage and enough open frequency space to enable
Important disclosures appear on the last page of this report.
6
high-speed connections. Considering Crown Castle’sheavily concentrated U.S. tower portfolio, they areexpected to benefit the most compared to theircompetitors as their financials are more correlated withU.S network spending.
Crown Castle is widely considered to be a market leader inthe construction of small cells in the U.S. Given CrownCastle’s prominence in the small cell network, we expectthem to outperform with 5G technology becoming morenormal for phone manufacturers, cell carriers, andconsumers. Crown Castle also has around 30,000 small cellnodes on backlog, and we expect them to fully deploy theirinventory within the next 2-3 years.
Key Investment Negatives
Crown Castle is currently one of the major leaders in smallcell technology, but as 5G increases in prevalence, othersmay emerge and potentially drive lease rates down.
Elliott Management Corp., one of the world’s largestactivist funds, advised communication infrastructure REITsto cut their investment in fiber, which could ultimatelyaffect the public’s view on investing in the firmsthemselves.
Crown Castle's significance in leasing their land undertowers versus owning them (40%/60%) makes long termcosts associated difficult to predict.
Possibility of low-orbit satellites making towers obsolete inthe long-term (~5-10+years). Although there is no threatof complete takeover in the foreseeable future, companieslike Spacex and Amazon have talked about implementingthis technology with Starlink and others. However, the riskof these new innovations in the short term could drivedown Crown Castle’s value.
Economic Outlook
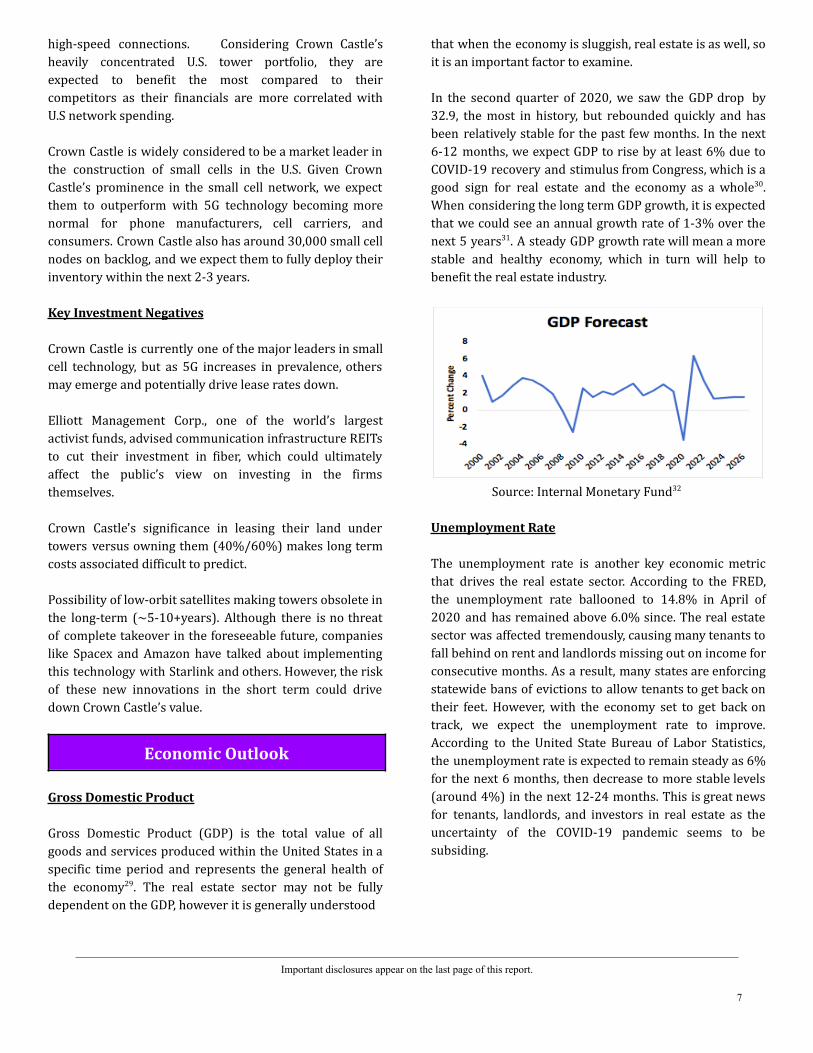
Gross Domestic Product
Gross Domestic Product (GDP) is the total value of allgoods and services produced within the United States in aspecific time period and represents the general health ofthe economy29. The real estate sector may not be fullydependent on the GDP, however it is generally understood
that when the economy is sluggish, real estate is as well, soit is an important factor to examine.
In the second quarter of 2020, we saw the GDP drop by32.9, the most in history, but rebounded quickly and hasbeen relatively stable for the past few months. In the next6-12 months, we expect GDP to rise by at least 6% due toCOVID-19 recovery and stimulus from Congress, which is agood sign for real estate and the economy as a whole30.When considering the long term GDP growth, it is expectedthat we could see an annual growth rate of 1-3% over thenext 5 years31. A steady GDP growth rate will mean a morestable and healthy economy, which in turn will help tobenefit the real estate industry.
Source: Internal Monetary Fund32
Unemployment Rate
The unemployment rate is another key economic metricthat drives the real estate sector. According to the FRED,the unemployment rate ballooned to 14.8% in April of2020 and has remained above 6.0% since. The real estatesector was affected tremendously, causing many tenants tofall behind on rent and landlords missing out on income forconsecutive months. As a result, many states are enforcingstatewide bans of evictions to allow tenants to get back ontheir feet. However, with the economy set to get back ontrack, we expect the unemployment rate to improve.According to the United State Bureau of Labor Statistics,the unemployment rate is expected to remain steady as 6%for the next 6 months, then decrease to more stable levels(around 4%) in the next 12-24 months. This is great newsfor tenants, landlords, and investors in real estate as theuncertainty of the COVID-19 pandemic seems to besubsiding.
Important disclosures appear on the last page of this report.
7

Source: St. Louis Fed33
Interest Rates and Inflation
The FED has remained loyal to their commitment to keepinterest rates low until 2023. Fed Chairman JermonePowell says he expects inflation to rise, however, notenough to hinder the attempt to archive full and inclusiveemployment34. Economic growth results in an increase invalue for their underlying assets as well as allows them tofinance capital expenditures or acquisitions at a lower cost.
Consumer Confidence Index (CCI)
As of March 30th, 2021, the CCI increased to 109.7compared to 90.4 in February. This is the highest the CCIhas been since March of 2020, showing improved outlookamong consumers. Consumers are also increasing bullishon business conditions and the labor market. The CCIoutlined that 18.5% of consumers voted that currentbusinesses are in ‘“good condition”, improving from 16.1%in February. In 6 months, 40.8% of consumers expectconditions to improve, up from 30.7% in February. Interms of the labor market, consumer optimism increased4.7% for finding jobs right now and increased 8.7%regarding the labor market in the coming months.
Source: The Conference Board35
Disposable Personal Income
Personal income after taxes, or disposable income, affectsconsumer spending and is one of the main determinants ofdemand. Disposable personal income (DPI) is used to payfor necessary expenses such as mortgage payments, food,electricity, health care, etc36. DPI is used to measure theoverall state of an economy by measuring households’spending and saving. An increase in spending is typicallyassociated with an increase in stocks’ value, though thisdoes not always hold true. It is an important variable toconsider for many firms in the infrastructure REITs, astheir tenants depend on their customers’ ability to paytheir phone and internet bill each month. If disposablepersonal income were to decrease and people were notable to pay their phone and internet bills on time,companies such as Verizon may not be able to make leasepayments to the REITs that own the infrastructure thecompany uses. Many telecommunications companies, suchas Verizon, generate most of their revenue from theircustomer’s data plans37, but if customers are not buyingnew phones that use 5G, the telecommunicationcompanies’ leased infrastructure is essentially useless.With an increasing DPI, individuals can afford to replacetheir old phones with new ones that support 5G.Disposable personal income has steadily increased overthe past decade due to a relative growth in wages. Asinterest rates remain low, DPI is projected to continue toincrease.
Source: U.S. Bureau of Economic Analysis38
Fiscal Policy
President Biden’s proposed Infrastructure Bill, part ofthe Build Back Better plan, includes spending $100billion over the next eight years on projects that
Important disclosures appear on the last page of this report.
8

include bringing broadband to rural America. Theproposed bill is focused on supporting infrastructure thatis “future proof” and will utilize 5G technology, such asfiber-optic networks39. Most companies in theinfrastructure REIT industry that employ fiber are focusedon urban areas, therefore expanding to rural areas could bea major opportunity to capitalize on for industrycompetitors. The downside for companies within thisindustry is that the proposed plan will favor government,nonprofit, and cooperatives with the goal of makingbroadband access more affordable for low-incomeindividuals. Jerome Powell has pushed back against thebill, stating that private investments in broadband havesuccessfully allowed access to networks for millions ofpeople, and that keeping these companies out of publicfunding could be detrimental to the current expansion ofbroadband access.
The FCC’s proposed Rural Digital Opportunity Fund(RDOF) would provide over $9 billion over the next tenyears in funding to rural areas in American that areunderserved or unserved in 5G broadband40. Similar toBiden’s bill, this proposal can provide a large opportunityof growth for companies in this sector, allowing them toexpand operations in areas they have not yet reached. Thefunding will come from an auction in which the providerthat requires the least amount of funding to serve aparticular area will win. Since Verizon, one of CrownCastle’s major tenants is among the companies in thebidding, the Company may not have to create newcontracts with other companies participating in theauction to take advantage of this opportunity41.
Valuation Analysis
Overview
We forecasted a 7-year growth horizon for CCI. AlthoughCCI’s Fiber segment accounted for roughly 32% of CCI’stotal revenue in 2020, we anticipate the Fiber segment toaccount for 54% of total revenue by 2027. CCI’s fibersegment consists of infrastructure that supports small-celltechnology that makes ultra-wideband 5G connectivitypossible, and we anticipate this technology to becomemuch more prevalent and expand into non-urban areas inthe next 5-7 years.
We forecasted CCI’s Towers division revenues to growsteadily at the historical average CAGR in the next 7 yearsas CCI will likely continue to invest most significantly intosmall-cell technology that supports ultra-wideband 5Gconnectivity.
After making revenue assumptions, we forecasted futurefinancial statements and conducted valuations usingDiscounted Cash Flow / Economic Profit, DividendDiscount, and Relative models.
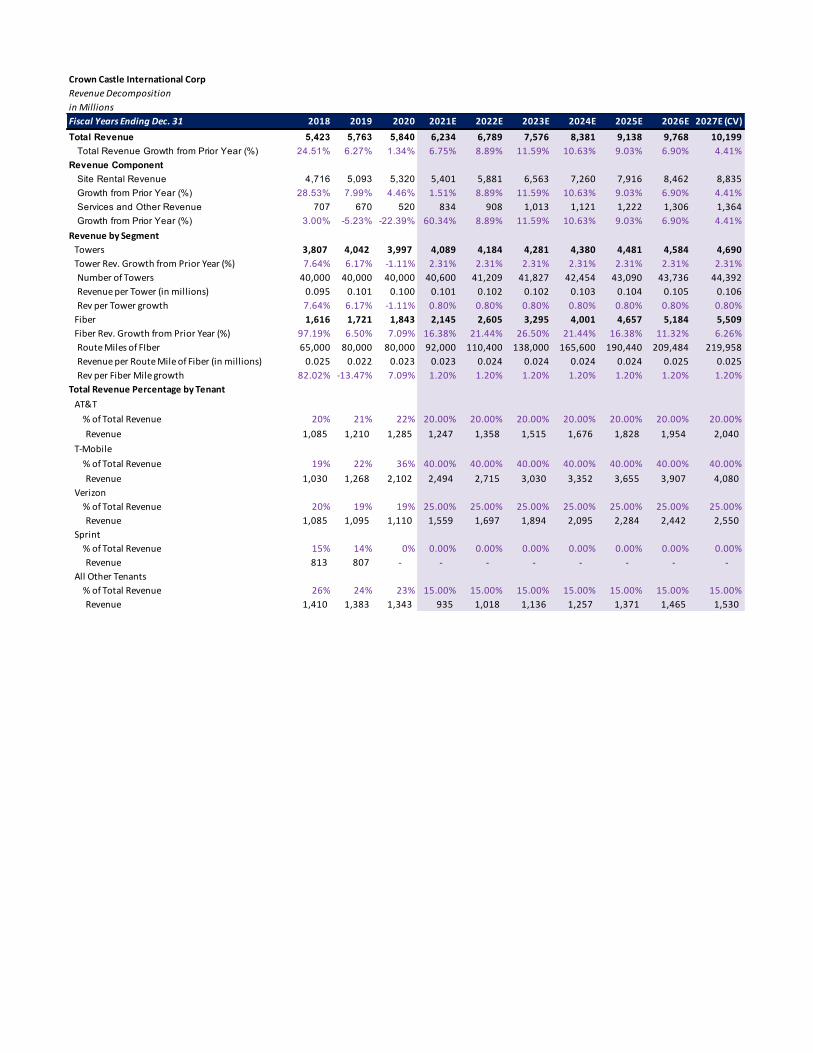
Revenue Decomposition
Crown Castle’s revenue can be decomposed into site rentalrevenue, and services & other revenue, which aresegmented by Towers and Fiber. Based on the company’shistorical performance and plans for the future, we predictthat the fiber segment will emerge as CCI’s leading sourceof revenue through the contracts the company hasdeclared with its current major tenants. The growingdemand for infrastructure that supports 5G will alsopropel future revenue growth. Furthermore, the companyprimarily owns infrastructure in densely populated areas,where 5G is most commonly used. Given the inevitableinflux of competitors following suit in small celltechnology, we built our revenue forecasting model withthe largest gains taking place within the next couple yearsbefore slowly evening out through the end of the forecast.As AT&T, T-Mobile, and Verizon take advantage of the newstandard of broadband, their contracts with Crown Castlesupport our prediction.
We expect little growth in the tower segment over the nextdecade as only one of their major tenants, AT&T, hasrecently signed a new agreement that included towerleases. We assumed, however, that because many of theircurrent tower contracts remain active through the nextcouple years, we will not see a decline in revenue growthfrom towers. Tower Service and Other Revenue willcontinue to decrease over time, as we saw between 2019and 2020, as fewer contracts are being initiated since theCompany and its tenants shift their focus on fiber.
An area of uncertainty that remains is how Sprint’s mergewith T-Mobile will continue to affect revenue. 5,700 towerswere planned to be built and leased to Sprint by CrownCastle, with 1,000 of those being installed in 2021. CrownCastle CEO, Jay Brown, believes the nodes from thisabandoned project will be utilized in another one of itscontracts set for the next couple years. Verizon’s deal with
Important disclosures appear on the last page of this report.
9

the company calls for 15,000 small cells to be constructedover the four years, with the lease contract extending overthe next ten years. The Company received $308 millionfrom T-Mobile for the cancellation and recognized thepayment as “other operating income” in 2020.
Continuing Value
The continuing value assumption is a very importantmetric in our valuation models. To make this assumption,we used the information from our economic analysis. Wefelt that GDP growth would be a good indicator for thesteady-state annual growth of CCI as GDP growthrepresents economic growth as a whole. We used acontinuing value growth rate of about 3.03%, thegeometric average annual GDP growth rate between 1960and 2019. With the overall rapid recovery from thepandemic and the long-term expectations of GDP growth,we feel that this growth rate is realistic.
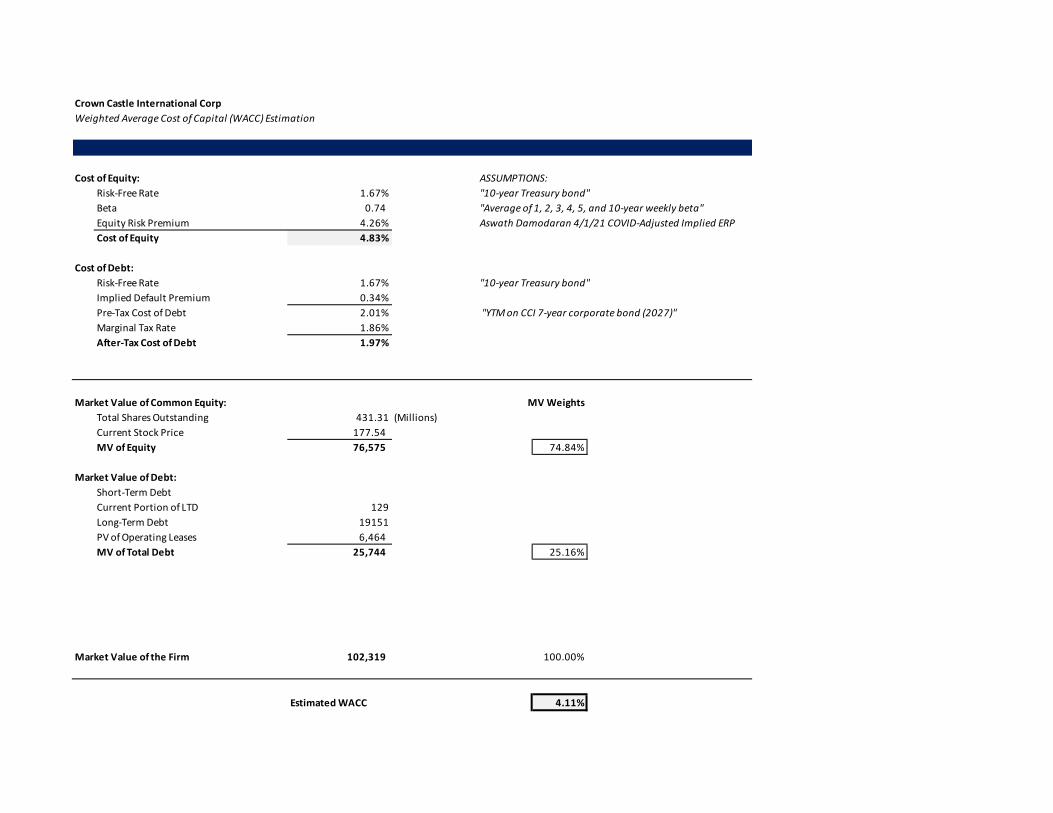
WACC
Building the WACC for CCI, we had to consider all of thesources of capital for the entire enterprise. This value hasa major impact on our DCF and EP models, as our free cashflow and economic profit values will be discounted withthis rate. Using a cost of equity of 4.83%, along with anafter-tax cost of debt of 1.97%, we estimated a WACC of4.11%. We also computed the market value weight ofequity and debt being 74.84% and 25.16% respectively.
Cost of Equity
We derived our 4.83% cost of equity using the CapitalAsset Pricing Model (CAPM). Our CAPM includesassumptions for the 10-year treasury bond of 1.67%, anaverage of CCI’s 1, 2, 3, 4, 5, and 10-year weekly beta of0.74 from bloomberg, and Aswath Damodaran’s April 1,2021 COVID-adjusted implied equity risk premium of4.26%.
Cost of Debt
Our after-tax cost of debt was derived from using a yield tomaturity on a corporate bond maturing in 2027. Wedecided to use this specific maturity so it aligns with our7-year forecast horizon. This, along with a marginal taxrate of 1.86%, gave us an after-tax cost of debt of 1.97%.
DCF and EP Model
We used a forecast period of 7 years for our DCF/EPvaluations due to the expected surge of 5G infrastructurein the next 5-7 years. For our DCF model, we found thevalue of operating assets by discounting CCI’s free cashflows by the WACC, then adjusted for non-operating itemsto find our value of equity.
For the EP model, we used the WACC to discount ourforecasted economic profit: forecasted invested capitalmultiplied by the difference between ROIC and WACC. TheEP model then requires us to add back the 2020 investedcapital to find the value of operating assets.
Both of these models gave us an implied price of $283.01as of April 12th, 2021. Based on the implied price, werecommend a BUY rating for CCI given that the price targetgives about a 59% upside compared to today’s price. Thesemodel’s take into account our growth forecasts andcombination of debt and equity, which leads us to favor theDCF and EP models for our implied price.
Dividend Discount Model
In building our dividend discount model, we forecastedexpected dividends per share and discounted them totoday’s value using the cost of equity. We used the productof our expected CV year P/E multiple and CV year FFO pershare to forecast our CV future stock price to discount totoday’s value using the cost of equity. The sum of thepresent value of dividends added to the present value ofthe expected future stock price yielded a current targetprice of $244.47, an upside of 37.7%.
Relative Valuation Model
In our relative valuation model, we compared CCI to 2major competitors, American Tower Corporation (AMT),and SBA Communications Corporation (SBAC). We alsodecided to include Verizon Communications Inc (VZ),AT&T Inc (T), and T-Mobile US Inc (TMUS) in our P/Emodel to see how the major 3 wireless carriers compareamongst each other. Considering these 3 companies arenot REITs, we excluded them from our P/FFO model. Wealso decided to exclude SBAC in our P/E model due to theirvery large P/E estimations affecting the consistency withinthe peer group.
Important disclosures appear on the last page of this report.
10

To better analyze competitors within this industry, wedecided to compare using the P/FFO metric. Utilizing aP/FFO model gives us a more accurate measurement forthe performance of REITs. We came to an implied relativeP/FFO value of $180.70 and $180.27 for 2021 and 2022.Although this model was great for visualizing performanceamongst competition, it did not have much of an impact onour target price due to the limited number of peers withinthe model.
Sensitivity Analysis
Cost of Debt vs. Cost of Equity
Comparing the relationship between cost of debt and costof equity is a critical determinant in our implied stockprice as they both play a significant role in our WACCcalculation. Fluctuations in CCI’s beta, as well as interestrate changes, will impact the cost of equity for our model.However, we can see from the table that assuming a .10%change in the cost of equity will have minimal effectstoward our implied price. On the other hand, potentialchanges in the marginal tax rate could alter CCI’s cost ofdebt. Assuming a .05% change in cost of debt would have asignificant impact towards our implied stock price.
Equity Risk Premium vs. Beta
This sensitivity analysis shows how fluctuations in equityrisk premium and beta could impact our implied stockprice. Considering CCI’s WACC is heavily weighted towardstheir large market value of equity relative to their debt, it’scrucial to analyze these two metrics as they drive the costof equity. Assuming both a .15% change in equity riskpremium and a .04 change in beta significantly impacts ourimplied stock price. Although fluctuations in bothmeasures results in very large price movements, thepotential change in beta will have a greater impact.
Risk Free Rate vs. CV Growth of NOPLAT
In this sensitivity analysis, we decided to compare therelationship with the continuing value growth ofNOPLAT and the risk free rate as both of these are keyfactors in determining the value of CCI’s implied stockprice. The continuing value is drastically impacted bythe change in the risk free rate as it is discounted as aperpetuity. As you can see from the table, a .03%change in the CV growth of NOPLAT has a small impacton our implied stock price. However, assuming a .07%change in the risk free rate displays a greater impacttowards our valuation.
Effective Tax Rate vs. Marginal Tax Rate
Due to CCI’s nature as a REIT, they qualify for the US REITtax benefit and essentially do not have to pay the statutorycorporate income tax rate of 21% provided they distributeat least 90% of their taxable income to shareholders asdividends. While they receive this tax benefit, CCI stillneeds to pay taxes subject to certain federal, state, local andforeign taxes on income or assets including: taxes on anyundistributed income, taxes related to taxable REITsubsidiaries, franchise taxes, property taxes and transfertaxes. The forecasted effective tax rate of 2.4% was derivedby averaging 2018-2020’s actual effective tax rate, and theforecasted marginal tax rate was derived by calculating2020’s marginal tax rate of 1.86%. As seen in thesensitivity table below, major fluctuations in tax rates thislow - particularly the marginal tax rate - had very littleeffect on our valuation results.
Important disclosures appear on the last page of this report.
11
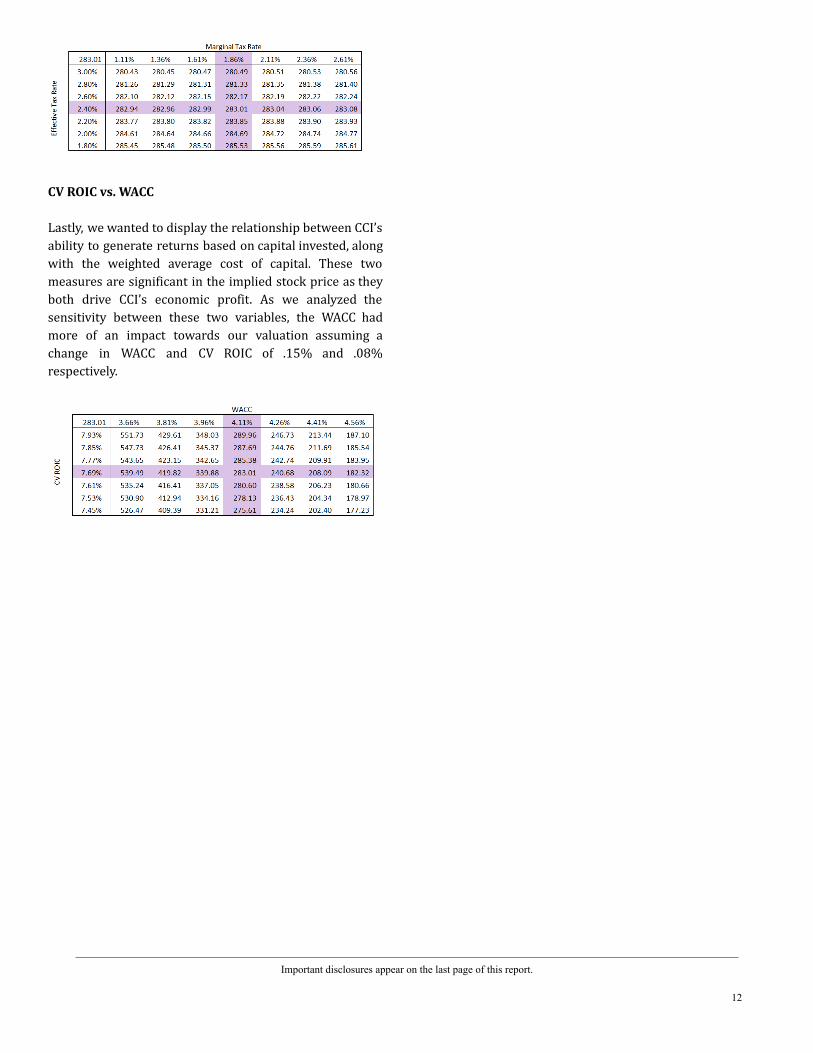
CV ROIC vs. WACC
Lastly, we wanted to display the relationship between CCI’sability to generate returns based on capital invested, alongwith the weighted average cost of capital. These twomeasures are significant in the implied stock price as theyboth drive CCI’s economic profit. As we analyzed thesensitivity between these two variables, the WACC hadmore of an impact towards our valuation assuming achange in WACC and CV ROIC of .15% and .08%respectively.
Important disclosures appear on the last page of this report.
12
References
1. “Cell Tower Reits: 5G DOMINANCE.” 30 Mar.2021,seekingalpha.com/article/4416731-cell-tower-reits-5g-dominance.
2. Menear, Harry. “5G Will Account for 54% ofMobile Data Traffic by 2026: 5G & IoT: MobileMagazine.” Mobile Magazine, 1 Dec. 2020,www.mobile-magazine.com/5g-and-iot/5g-will-account-54-mobile-data-traffic-2026.
3. “Mobile Data Traffic Outlook.” Ericcson,www.ericsson.com/en/mobility-report/dataforecasts/mobile-traffic-forecast#:~:text=The%20monthly%20usage%20per%20smartphone,at%20the%20end%20of%202019.&text=The%20data%20traffic%20per%20smartphone,41GB%20per%20month%20in%202026.
4. “Small Cell 101: Crown Castle.” Crown Castle,www.crowncastle.com/communities/small-cell-information.
5. Emergency Broadband Connections Act of2020.www.wyden.senate.gov/imo/media/doc/Emergency%20Broadband%20Connections%20Act%20of%202020%20One%20Pager.pdf .
6. Hardesty, Linda. “American Tower BuysTelefónica's Tower Business for $9.4B.”FierceWireless, 13 Jan. 2021,www.fiercewireless.com/financial/american-tower-buys-telefonica-s-tower-business-for-9-4b.
7. Wireless Estimator. “SBA Is Doubling down onData Centers after Successful Chicago EdgeExperiment.” Wireless Estimator, 6 Aug. 2020,wirelessestimator.com/articles/2020/sba-is-doubling-down-on-data-centers-after-successful-chicago-edge-experiment/.
8. Dano, Mike. “SBA, American Tower Doubledown on Edge Computing Opportunity.” LightReading, 4 Aug. 2020,www.lightreading.com/the-edge/sba-american-tower-double-down-on-edge-computing-opportunity/d/d-id/762941.
9. “American Tower 10-K Report.” SEC Filings, 25Feb. 2021,americantower.gcs-web.com/node/23536/html.
10. “DAS & Small Cells.” SBA Communications -Solutions - In-Building - DAS & Small Cells,www.sbasite.com/English/solutions/in-building/das-and-small-cells/default.aspx.
11. “SBA Communications 10-K Report.” SECFilings, 25 Feb. 2021,sec.report/Document/0001034054-21-000003/.
12. Dano, Mike. “Did the US Small Cell MarketFinally Break Open?” Light Reading, 29 Jan.2021,www.lightreading.com/opticalip/did-us-small-cell-market-finally-break-open/a/d-id/767007.
13. “About Us: Crown Castle.” Crown Castle,www.crowncastle.com/about-us.
14. DiLallo, Matthew. “Where Will Crown CastleInternational Be in 10 Years?” Millionacres, 23July 2020,www.fool.com/millionacres/real-estate-investing/articles/where-will-crown-castle-international-be-in-10-years/.
15. “Crown Castle 10-K Report.” SEC Filing, 22Feb. 2021,investor.crowncastle.com/node/24276/html.
16. Fletcher, Bevin. “Crown Castle Inks 15K SmallCell Deal with Verizon.” FierceWireless, 28 Jan.2021,www.fiercewireless.com/5g/crown-castle-inks-15k-small-cell-deal-verizon.
17. Dano, Mike. “AT&T Inks 'Streamlined' Tower,Small Cell Deal with Crown Castle.”FierceWireless, 11 Apr. 2018,www.fiercewireless.com/wireless/at-t-inks-streamlined-tower-small-cell-deal-crown-castle.
18. “T‑Mobile and Crown Castle Expand StrategicRelationship.” T-Mobile, 12 Sept. 2018,www.t-mobile.com/news/press/crown-castle-strategic-relationship.
19. “Crown Castle Reports Fourth Quarter andFull Year 2020 Results, Maintains Outlook forFull Year 2021.” Crown Castle, 27 Jan. 2021,investor.crowncastle.com/news-releases/news-release-details/crown-castle-reports-fourth-quarter-and-full-year-2020-results.
20. “Crown Castle Announces Agreement toAcquire Sunesys.” Crown Castle, 30 Apr. 2015,investor.crowncastle.com/news-releases/news-release-details/crown-castle-announces-agreement-acquire-sunesys.
Important disclosures appear on the last page of this report.
13

21. “Crown Castle Announces Agreement toAcquire FiberNet.” Crown Castle, 1 Nov. 2016,investor.crowncastle.com/news-releases/news-release-details/crown-castle-announces-agreement-acquire-fibernet.
22. “Crown Castle Announces Agreement toAcquire Wilcon.” Crown Castle, 17 Apr. 2017,investor.crowncastle.com/news-releases/news-release-details/crown-castle-announces-agreement-acquire-wilcon.
23. “Crown Castle Announces Agreement toAcquire Lightower.” Crown Castle, 18 July2017,investor.crowncastle.com/news-releases/news-release-details/crown-castle-announces-agreement-acquire-lightower.
24. “CROWN CASTLE REPORTS FOURTHQUARTER AND FULL YEAR 2020 RESULTS,MAINTAINS OUTLOOK FOR FULL YEAR 2021.”SEC Filings, 27 Jan. 2021,www.sec.gov/Archives/edgar/data/1051470/000105147021000012/q42020earningsrelease.htm.
25. “Crown Castle International Corp (CCI) StockMajor Holders.” Yahoo! Finance, Yahoo!, 20Apr. 2021,finance.yahoo.com/quote/CCI/holders?p=CCI.
26. Clifford, Tyler. “Crown Castle's 'Good StoryCan Get Even Better' on Activist Fight, JimCramer Says.” CNBC, 13 July 2020,www.cnbc.com/2020/07/13/cramer-crown-castles-good-story-can-get-even-better-in-activist-fight.html.
27. Orol, Ronald. “Crown Castle Adds Directors asElliott Watches.” BoardEx, 3 Nov. 2020,www.boardex.com/crown-castle-adds-directors-as-elliott-watches/.
28. LD Investments. “Crown Castle's 5G StrategyPoised For Takeoff (NYSE:CCI).” SeekingAlpha,18 Feb. 2021,seekingalpha.com/article/4407145-crown-castle-5g-poised-for-takeoff.
29. Fernando, Jason. “Gross Domestic Product(GDP).” Investopedia, Investopedia, 7 Apr.2021,www.investopedia.com/terms/g/gdp.asp.
30. Payne, David. “GDP: Growth Estimates KeepRising.” Kiplinger, Kiplinger, 25 Feb. 2021,www.kiplinger.com/economic-forecasts/gdp.
31. “Real GDP Growth.” International MonetaryFund - Homepage,www.imf.org/external/datamapper/NGDP_RPCH@WEO/USA.
32. “GDP Forecast.” International Monetary Fund -Homepage,www.imf.org/external/datamapper/NGDP_RPCH@WEO/USA.
33. “Unemployment Rate.” FRED, 2 Apr. 2021,fred.stlouisfed.org/series/UNRATE.
34. Jeff Cox, CNBCcom. “Fed Sees StrongerEconomy and Higher Inflation, but No RateHikes.” CNBC, CNBC, 17 Mar. 2021,www.cnbc.com/2021/03/17/fed-decision-march-2021-fed-sees-stronger-economy-higher-inflation-but-no-rate-hikes.html.
35. “Consumer Confidence Index®: TheConference Board.” Consumer ConfidenceIndex® | The Conference Board,conference-board.org/data/consumerconfidence.cfm#:~:text=The%20Index%20now%20stands%20at,climbed%20from%2089.6%20to%20110.0.
36. Cautero, Rachel Morgan. “What Is DisposableIncome?” The Balance, 27 Feb. 2021,www.thebalance.com/what-is-disposable-income-4156858.
37. “Verizon 10-K Report.” SEC Filings, 25 Feb.2021,verizon.api.edgar-online.com/EFX_dll/EdgarPro.dll?FetchFilingConvPDF1?SessionID=b4epU8CEV4wl2nd&ID=14744806.
38. “Disposable Personal Income (DSPI).” FederalReserve Economic Data,fred.stlouisfed.org/series/DSPI.
39. Reardon, Marguerite. “Biden's $100 BillionBroadband Plan Is Already Getting Pushback.”CNET, 31 Mar. 2021,www.cnet.com/news/bidens-100-billion-broadband-plan-is-already-getting-pushback/.
40. Guyan, Joshua, and Chris Lauglin. “FCC CreatesFramework to Fund 5G Deployments in RuralAreas.” JD Supra, 1 Dec. 2020,www.jdsupra.com/legalnews/fcc-creates-framework-to-fund-5g-24725/.
41. Dona, Mike. “Verizon, SpaceX, CenturyLink,Charter among FCC's RDOF Bidders.” LightReading, 1 Sept. 2020,https://tinyurl.com/yst552f8
Important disclosures appear on the last page of this report.
14
Crown Castle International CorpRevenue Decompositionin MillionsFiscal Years Ending Dec. 31 2018 2019 2020 2021E 2022E 2023E 2024E 2025E 2026E 2027E (CV)
Total Revenue 5,423 5,763 5,840 6,234 6,789 7,576 8,381 9,138 9,768 10,199 Total Revenue Growth from Prior Year (%) 24.51% 6.27% 1.34% 6.75% 8.89% 11.59% 10.63% 9.03% 6.90% 4.41%Revenue Component Site Rental Revenue 4,716 5,093 5,320 5,401 5,881 6,563 7,260 7,916 8,462 8,835 Growth from Prior Year (%) 28.53% 7.99% 4.46% 1.51% 8.89% 11.59% 10.63% 9.03% 6.90% 4.41% Services and Other Revenue 707 670 520 834 908 1,013 1,121 1,222 1,306 1,364 Growth from Prior Year (%) 3.00% -5.23% -22.39% 60.34% 8.89% 11.59% 10.63% 9.03% 6.90% 4.41%Revenue by Segment Towers 3,807 4,042 3,997 4,089 4,184 4,281 4,380 4,481 4,584 4,690 Tower Rev. Growth from Prior Year (%) 7.64% 6.17% -1.11% 2.31% 2.31% 2.31% 2.31% 2.31% 2.31% 2.31%
Number of Towers 40,000 40,000 40,000 40,600 41,209 41,827 42,454 43,090 43,736 44,392 Revenue per Tower (in millions) 0.095 0.101 0.100 0.101 0.102 0.102 0.103 0.104 0.105 0.106 Rev per Tower growth 7.64% 6.17% -1.11% 0.80% 0.80% 0.80% 0.80% 0.80% 0.80% 0.80%
Fiber 1,616 1,721 1,843 2,145 2,605 3,295 4,001 4,657 5,184 5,509 Fiber Rev. Growth from Prior Year (%) 97.19% 6.50% 7.09% 16.38% 21.44% 26.50% 21.44% 16.38% 11.32% 6.26%
Route Miles of FIber 65,000 80,000 80,000 92,000 110,400 138,000 165,600 190,440 209,484 219,958 Revenue per Route Mile of Fiber (in millions) 0.025 0.022 0.023 0.023 0.024 0.024 0.024 0.024 0.025 0.025 Rev per Fiber Mile growth 82.02% -13.47% 7.09% 1.20% 1.20% 1.20% 1.20% 1.20% 1.20% 1.20%
Total Revenue Percentage by Tenant
AT&T % of Total Revenue 20% 21% 22% 20.00% 20.00% 20.00% 20.00% 20.00% 20.00% 20.00%
Revenue 1,085 1,210 1,285 1,247 1,358 1,515 1,676 1,828 1,954 2,040 T-Mobile
% of Total Revenue 19% 22% 36% 40.00% 40.00% 40.00% 40.00% 40.00% 40.00% 40.00%Revenue 1,030 1,268 2,102 2,494 2,715 3,030 3,352 3,655 3,907 4,080
Verizon % of Total Revenue 20% 19% 19% 25.00% 25.00% 25.00% 25.00% 25.00% 25.00% 25.00%
Revenue 1,085 1,095 1,110 1,559 1,697 1,894 2,095 2,284 2,442 2,550 Sprint
% of Total Revenue 15% 14% 0% 0.00% 0.00% 0.00% 0.00% 0.00% 0.00% 0.00%Revenue 813 807 - - - - - - - -
All Other Tenants % of Total Revenue 26% 24% 23% 15.00% 15.00% 15.00% 15.00% 15.00% 15.00% 15.00%
Revenue 1,410 1,383 1,343 935 1,018 1,136 1,257 1,371 1,465 1,530

Crown Castle International CorpIncome StatementIn millionsFiscal Years Ending Dec. 31 2018 2019 2020 2021E 2022E 2023E 2024E 2025E 2026E 2027E (CV)
Net revenues:Site rental 4,716 5,093 5,320 5,401 5,881 6,563 7,260 7,916 8,462 8,835 Network services and other 707 670 520 834 908 1,013 1,121 1,222 1,306 1,364
Net revenues 5,423 5,763 5,840 6,234 6,789 7,576 8,381 9,138 9,768 10,199 Operating expenses:
Costs of Operations:Site rental (1,410) (1,462) (1,521) (1,609) (1,752) (1,956) (2,164) (2,359) (2,522) (2,633) Services and other (437) (524) (448) (541) (589) (658) (727) (793) (848) (885)
Selling, general and administrative (563) (614) (678) (312) (339) (379) (419) (457) (488) (510) Asset write-down charges (26) (19) (74) Acquisition and integration costs (27) (13) (10) Depreciation, amortization and accretion (1,528) (1,572) (1,608) (1,774) (1,893) (2,062) (2,301) (2,545) (2,775) (2,967)
Total Operating Expenses (3,991) (4,204) (4,339) (4,236) (4,575) (5,054) (5,611) (6,154) (6,633) (6,995) Other operating income (expense) - - 362
Operating income / loss 1,432 1,559 1,863 1,998 2,214 2,522 2,770 2,983 3,135 3,204 Interest expense and amortization of deferred financing costs (642) (683) (689) (387) (409) (445) (497) (550) (599) (641) Gains (losses) on retirement of long-term obligations (106) (2) (95) Interest income 5 6 2 4 (89) (119) (153) (191) (232) (275) Other income (expense) 1 1 (5) Income / loss from continuing operations before income taxes 690 881 1,076 1,615 1,716 1,957 2,120 2,243 2,304 2,288 Benefit / provision for income taxes (19) (21) (20) (39) (41) (47) (51) (54) (55) (55) Income / loss attributable to CCIC stockholders 671 860 1,056 1,576 1,674 1,911 2,069 2,189 2,249 2,233 Dividends on preferred stock (113) (113) (57)
Net income (loss) attributable to CCIC common stockholders 558 747 999 1,576 1,674 1,911 2,069 2,189 2,249 2,233
Net income (loss) attributable to CCIC common stockholders, per common share: 1.35 1.80 2.36 3.69 3.86 4.32 4.60 4.79 4.83 4.72 Dividend per Share 4.28 4.58 4.93 6.68 7.17 7.89 8.57 9.17 9.62 9.85 Total Shares Outstanding 413 416 423 430 438 446 453 461 469 478 Average Common Shares Outstanding 417 415 420 427 434 442 449 457 465 473 EPS 1.35 1.80 2.36 3.66 3.82 4.29 4.56 4.75 4.79 4.68
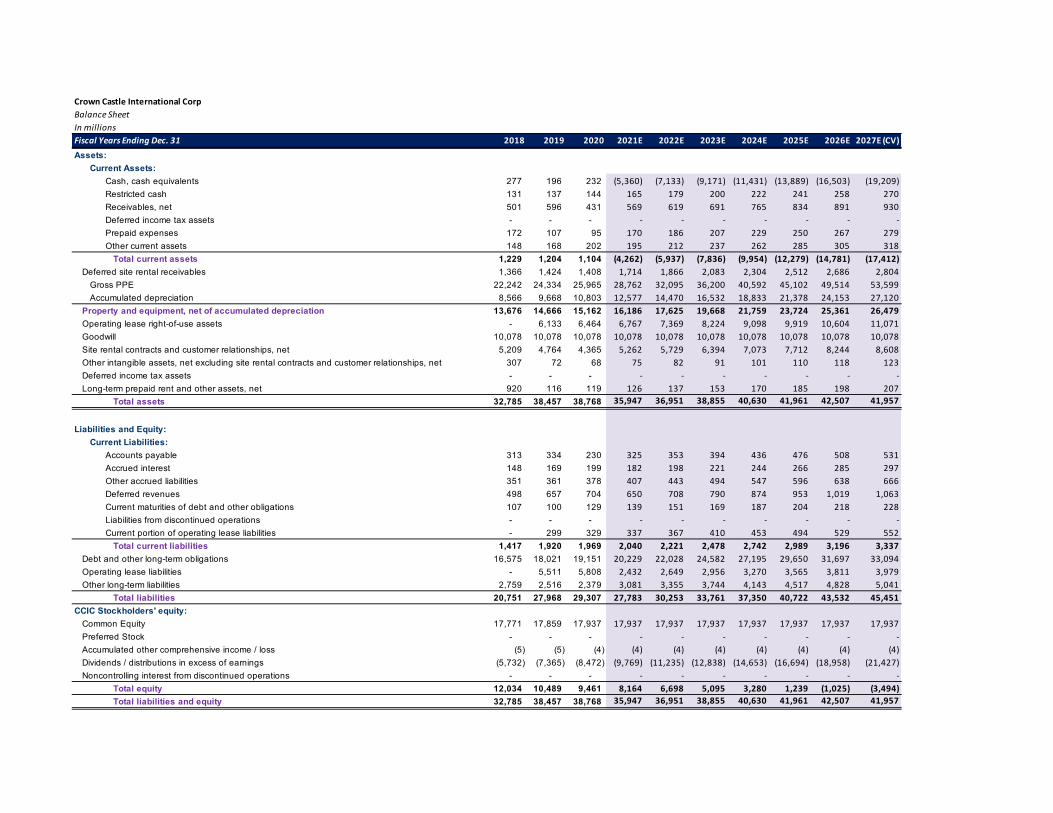
Crown Castle International CorpBalance SheetIn millionsFiscal Years Ending Dec. 31 2018 2019 2020 2021E 2022E 2023E 2024E 2025E 2026E 2027E (CV)
Assets:Current Assets:
Cash, cash equivalents 277 196 232 (5,360) (7,133) (9,171) (11,431) (13,889) (16,503) (19,209)Restricted cash 131 137 144 165 179 200 222 241 258 270 Receivables, net 501 596 431 569 619 691 765 834 891 930 Deferred income tax assets - - - - - - - - - - Prepaid expenses 172 107 95 170 186 207 229 250 267 279 Other current assets 148 168 202 195 212 237 262 285 305 318
Total current assets 1,229 1,204 1,104 (4,262) (5,937) (7,836) (9,954) (12,279) (14,781) (17,412)Deferred site rental receivables 1,366 1,424 1,408 1,714 1,866 2,083 2,304 2,512 2,686 2,804
Gross PPE 22,242 24,334 25,965 28,762 32,095 36,200 40,592 45,102 49,514 53,599 Accumulated depreciation 8,566 9,668 10,803 12,577 14,470 16,532 18,833 21,378 24,153 27,120
Property and equipment, net of accumulated depreciation 13,676 14,666 15,162 16,186 17,625 19,668 21,759 23,724 25,361 26,479 Operating lease right-of-use assets - 6,133 6,464 6,767 7,369 8,224 9,098 9,919 10,604 11,071 Goodwill 10,078 10,078 10,078 10,078 10,078 10,078 10,078 10,078 10,078 10,078 Site rental contracts and customer relationships, net 5,209 4,764 4,365 5,262 5,729 6,394 7,073 7,712 8,244 8,608 Other intangible assets, net excluding site rental contracts and customer relationships, net 307 72 68 75 82 91 101 110 118 123 Deferred income tax assets - - - - - - - - - - Long-term prepaid rent and other assets, net 920 116 119 126 137 153 170 185 198 207
Total assets 32,785 38,457 38,768 35,947 36,951 38,855 40,630 41,961 42,507 41,957
Liabilities and Equity:Current Liabilities:
Accounts payable 313 334 230 325 353 394 436 476 508 531 Accrued interest 148 169 199 182 198 221 244 266 285 297 Other accrued liabilities 351 361 378 407 443 494 547 596 638 666 Deferred revenues 498 657 704 650 708 790 874 953 1,019 1,063 Current maturities of debt and other obligations 107 100 129 139 151 169 187 204 218 228 Liabilities from discontinued operations - - - - - - - - - - Current portion of operating lease liabilities - 299 329 337 367 410 453 494 529 552
Total current liabilities 1,417 1,920 1,969 2,040 2,221 2,478 2,742 2,989 3,196 3,337 Debt and other long-term obligations 16,575 18,021 19,151 20,229 22,028 24,582 27,195 29,650 31,697 33,094 Operating lease liabilities - 5,511 5,808 2,432 2,649 2,956 3,270 3,565 3,811 3,979 Other long-term liabilities 2,759 2,516 2,379 3,081 3,355 3,744 4,143 4,517 4,828 5,041
Total liabilities 20,751 27,968 29,307 27,783 30,253 33,761 37,350 40,722 43,532 45,451 CCIC Stockholders' equity:
Common Equity 17,771 17,859 17,937 17,937 17,937 17,937 17,937 17,937 17,937 17,937 Preferred Stock - - - - - - - - - - Accumulated other comprehensive income / loss (5) (5) (4) (4) (4) (4) (4) (4) (4) (4)Dividends / distributions in excess of earnings (5,732) (7,365) (8,472) (9,769) (11,235) (12,838) (14,653) (16,694) (18,958) (21,427)Noncontrolling interest from discontinued operations - - - - - - - - - -
Total equity 12,034 10,489 9,461 8,164 6,698 5,095 3,280 1,239 (1,025) (3,494)Total liabilities and equity 32,785 38,457 38,768 35,947 36,951 38,855 40,630 41,961 42,507 41,957
Crown Castle International CorpHistorical Cash Flow Statement
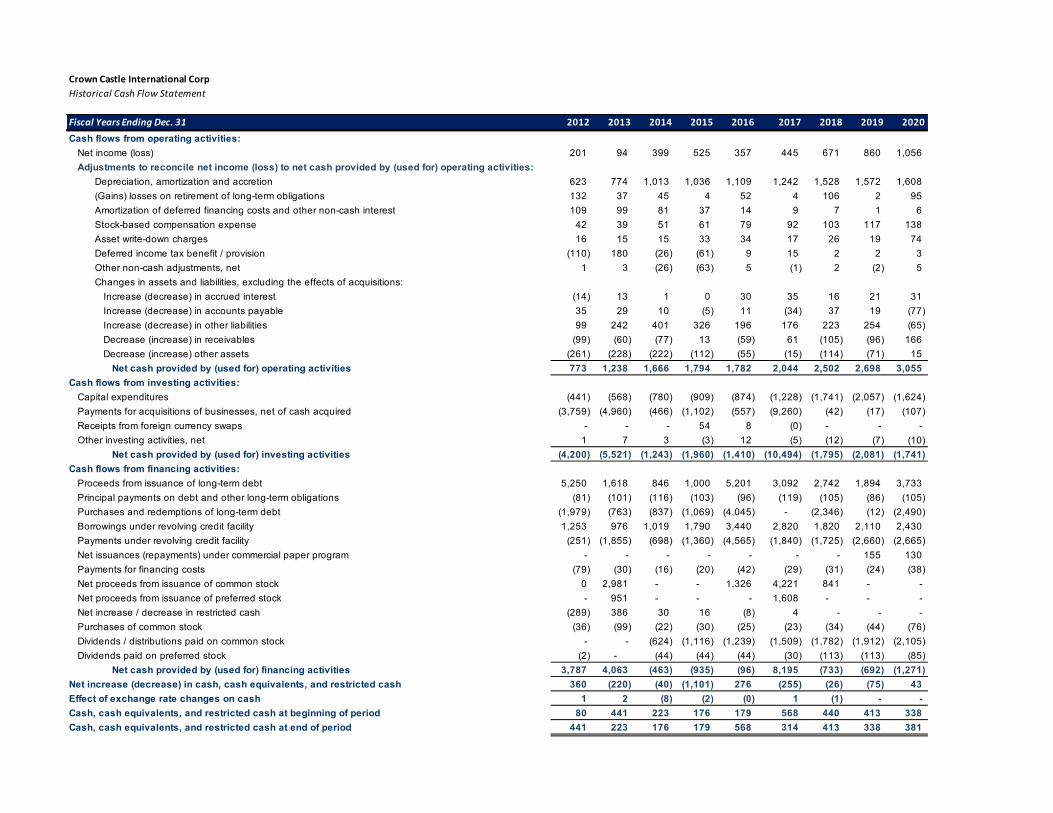
Fiscal Years Ending Dec. 31 2012 2013 2014 2015 2016 2017 2018 2019 2020
Cash flows from operating activities:Net income (loss) 201 94 399 525 357 445 671 860 1,056 Adjustments to reconcile net income (loss) to net cash provided by (used for) operating activities:
Depreciation, amortization and accretion 623 774 1,013 1,036 1,109 1,242 1,528 1,572 1,608 (Gains) losses on retirement of long-term obligations 132 37 45 4 52 4 106 2 95 Amortization of deferred financing costs and other non-cash interest 109 99 81 37 14 9 7 1 6 Stock-based compensation expense 42 39 51 61 79 92 103 117 138 Asset write-down charges 16 15 15 33 34 17 26 19 74 Deferred income tax benefit / provision (110) 180 (26) (61) 9 15 2 2 3 Other non-cash adjustments, net 1 3 (26) (63) 5 (1) 2 (2) 5 Changes in assets and liabilities, excluding the effects of acquisitions:
Increase (decrease) in accrued interest (14) 13 1 0 30 35 16 21 31 Increase (decrease) in accounts payable 35 29 10 (5) 11 (34) 37 19 (77) Increase (decrease) in other liabilities 99 242 401 326 196 176 223 254 (65) Decrease (increase) in receivables (99) (60) (77) 13 (59) 61 (105) (96) 166 Decrease (increase) other assets (261) (228) (222) (112) (55) (15) (114) (71) 15
Net cash provided by (used for) operating activities 773 1,238 1,666 1,794 1,782 2,044 2,502 2,698 3,055 Cash flows from investing activities:
Capital expenditures (441) (568) (780) (909) (874) (1,228) (1,741) (2,057) (1,624) Payments for acquisitions of businesses, net of cash acquired (3,759) (4,960) (466) (1,102) (557) (9,260) (42) (17) (107) Receipts from foreign currency swaps - - - 54 8 (0) - - -Other investing activities, net 1 7 3 (3) 12 (5) (12) (7) (10)
Net cash provided by (used for) investing activities (4,200) (5,521) (1,243) (1,960) (1,410) (10,494) (1,795) (2,081) (1,741) Cash flows from financing activities:
Proceeds from issuance of long-term debt 5,250 1,618 846 1,000 5,201 3,092 2,742 1,894 3,733 Principal payments on debt and other long-term obligations (81) (101) (116) (103) (96) (119) (105) (86) (105) Purchases and redemptions of long-term debt (1,979) (763) (837) (1,069) (4,045) - (2,346) (12) (2,490) Borrowings under revolving credit facility 1,253 976 1,019 1,790 3,440 2,820 1,820 2,110 2,430 Payments under revolving credit facility (251) (1,855) (698) (1,360) (4,565) (1,840) (1,725) (2,660) (2,665) Net issuances (repayments) under commercial paper program - - - - - - - 155 130 Payments for financing costs (79) (30) (16) (20) (42) (29) (31) (24) (38) Net proceeds from issuance of common stock 0 2,981 - - 1,326 4,221 841 - -Net proceeds from issuance of preferred stock - 951 - - - 1,608 - - -Net increase / decrease in restricted cash (289) 386 30 16 (8) 4 - - -Purchases of common stock (36) (99) (22) (30) (25) (23) (34) (44) (76) Dividends / distributions paid on common stock - - (624) (1,116) (1,239) (1,509) (1,782) (1,912) (2,105) Dividends paid on preferred stock (2) - (44) (44) (44) (30) (113) (113) (85)
Net cash provided by (used for) financing activities 3,787 4,063 (463) (935) (96) 8,195 (733) (692) (1,271) Net increase (decrease) in cash, cash equivalents, and restricted cash 360 (220) (40) (1,101) 276 (255) (26) (75) 43 Effect of exchange rate changes on cash 1 2 (8) (2) (0) 1 (1) - -Cash, cash equivalents, and restricted cash at beginning of period 80 441 223 176 179 568 440 413 338 Cash, cash equivalents, and restricted cash at end of period 441 223 176 179 568 314 413 338 381

Crown Castle International CorpForecasted Cash Flow Statement
Fiscal Years Ending Dec. 31 2021E 2022E 2023E 2024E 2025E 2026E 2027E (CV)
Cash Flows from Operating ActivitiesNet Income 1,576 1,674 1,911 2,069 2,189 2,249 2,233 Depreciation 1,774 1,893 2,062 2,301 2,545 2,775 2,967 Change in Operating Balance Sheet Accounts
Restricted cash (21) (15) (21) (21) (20) (17) (11) Receivables, net (138) (51) (72) (73) (69) (58) (39) Deferred income tax assets - - - - - - - Prepaid expenses (75) (15) (22) (22) (21) (17) (12) Deferred site rental receivables (306) (152) (216) (221) (208) (173) (118) Site rental contracts and customer relationships, net (897) (468) (664) (680) (639) (532) (363) Deferred income tax assets - - - - - - - Long-term prepaid rent and other assets, net (7) (11) (16) (16) (15) (13) (9) Accounts payable 95 29 41 42 39 33 22 Accrued interest (17) 16 23 23 22 18 13 Other accrued liabilities 29 36 51 53 49 41 28 Deferred revenues (54) 58 82 84 79 66 45 Other long-term liabilities 702 274 389 398 374 312 213
Cash Provided (Used) by Operating Activities 2,661 3,269 3,548 3,936 4,326 4,684 4,968 Cash Flows from Investing Activities
Change in Investing Balance Sheet AccountsOther current assets 7 (17) (25) (25) (24) (20) (13) Gross PPE (2,797) (3,333) (4,105) (4,392) (4,510) (4,413) (4,084) Operating lease right-of-use assets (303) (602) (854) (874) (821) (685) (467) Goodwill - - - - - - - Other intangible assets, net excluding site rental contracts and customer relationships, net (7) (7) (9) (10) (9) (8) (5) Current portion of operating lease liabilities 8 30 43 44 41 34 23 Operating lease liabilities (3,376) 216 307 314 295 246 168
Cash Provided (Used) by Investing Activities (6,468) (3,712) (4,644) (4,943) (5,028) (4,844) (4,379) Cash Flows from Financing Activities
Change in Financing Balance Sheet AccountsCurrent maturities of debt and other obligations 10 12 18 18 17 14 10 Debt and other long-term obligations 1,078 1,799 2,554 2,613 2,455 2,047 1,397 Common Equity - - - - - - - Preferred Stock - - - - - - -
Dividends Paid (2,873) (3,141) (3,513) (3,884) (4,229) (4,513) (4,702) Cash Provided (Used) by Financing Activities (1,785) (1,329) (942) (1,253) (1,757) (2,453) (3,295)
Change in Cash over Period (5,592) (1,773) (2,038) (2,260) (2,459) (2,613) (2,707) Cash and Cash Equivalents at Beginning of Year 232 (5,360) (7,133) (9,171) (11,431) (13,889) (16,503) Cash and Cash Equivalents at End of Year (5,360) (7,133) (9,171) (11,431) (13,889) (16,503) (19,209)

Crown Castle International CorpCommon Size Income Statement
Fiscal Years Ending Dec. 31 2018 2019 2020 2021E 2022E 2023E 2024E 2025E 2026E 2027E (CV)
Net revenues:Site rental 86.96% 88.37% 91.10% 86.63% 86.63% 86.63% 86.63% 86.63% 86.63% 86.63%Network services and other 13.04% 11.63% 8.90% 13.37% 13.37% 13.37% 13.37% 13.37% 13.37% 13.37%
Net revenues 100.00% 100.00% 100.00% 100.00% 100.00% 100.00% 100.00% 100.00% 100.00% 100.00%Operating expenses:
Costs of Operations:Site rental -26.00% -25.37% -26.04% -25.81% -25.81% -25.81% -25.81% -25.81% -25.81% -25.81%Services and other -8.06% -9.09% -7.67% -8.68% -8.68% -8.68% -8.68% -8.68% -8.68% -8.68%
Selling, general and administrative -10.38% -10.65% -11.61% -5.00% -5.00% -5.00% -5.00% -5.00% -5.00% -5.00%Asset write-down charges -0.48% -0.33% -1.27% 0.00% 0.00% 0.00% 0.00% 0.00% 0.00% 0.00%Acquisition and integration costs -0.50% -0.23% -0.17% 0.00% 0.00% 0.00% 0.00% 0.00% 0.00% 0.00%Depreciation, amortization and accretion -28.18% -27.28% -27.53% -28.45% -27.89% -27.22% -27.45% -27.86% -28.41% -29.09%
Total Operating Expenses -73.59% -72.95% -74.30% -67.94% -67.39% -66.71% -66.95% -67.35% -67.90% -68.58%
Other operating income / expense - - 6.20%Operating income / loss 26.41% 27.05% 31.90% 32.06% 32.61% 33.29% 33.05% 32.65% 32.10% 31.42%
Interest expense and amortization of deferred financing costs -11.84% -11.85% -11.80% -6.21% -6.02% -5.88% -5.93% -6.02% -6.14% -6.28%Gains / losses on retirement of long-term obligations -1.95% -0.03% -1.63% 0.00% 0.00% 0.00% 0.00% 0.00% 0.00% 0.00%Interest income 0.09% 0.10% 0.03% 0.06% -1.32% -1.57% -1.83% -2.09% -2.37% -2.70%Other income / expense 0.02% 0.02% -0.09% 0.00% 0.00% 0.00% 0.00% 0.00% 0.00% 0.00%Income / loss from continuing operations before income taxes 12.72% 15.29% 18.42% 25.91% 25.27% 25.84% 25.30% 24.54% 23.59% 22.43%Benefit / provision for income taxes -0.35% -0.36% -0.34% -0.62% -0.61% -0.62% -0.61% -0.59% -0.57% -0.54%Income / loss attributable to CCIC stockholders 12.37% 14.92% 18.08% 25.29% 24.67% 25.22% 24.69% 23.96% 23.02% 21.89%Dividends on preferred stock -2.08% -1.96% -0.98% 0.00% 0.00% 0.00% 0.00% 0.00% 0.00% 0.00%
Net income (loss) attributable to CCIC common stockholders 10.29% 12.96% 17.11% 25.29% 24.67% 25.22% 24.69% 23.96% 23.02% 21.89%

Crown Castle International CorpCommon Size Balance Sheet
Fiscal Years Ending Dec. 31 2018 2019 2020 2021E 2022E 2023E 2024E 2025E 2026E 2027E (CV)
Assets:Current Assets:
Cash, cash equivalents 5.11% 3.40% 3.97% -91.78% -114.41% -135.09% -150.89% -165.72% -180.60% -196.65%Restricted cash 2.42% 2.38% 2.47% 2.82% 2.88% 2.95% 2.92% 2.88% 2.83% 2.76%Receivables, net 9.24% 10.34% 7.38% 9.74% 9.93% 10.18% 10.09% 9.95% 9.75% 9.52%Deferred income tax assets 0.00% 0.00% 0.00% 0.00% 0.00% 0.00% 0.00% 0.00% 0.00% 0.00%Prepaid expenses 3.17% 1.86% 1.63% 2.92% 2.98% 3.05% 3.02% 2.98% 2.92% 2.85%Other current assets 2.73% 2.92% 3.46% 3.33% 3.40% 3.48% 3.45% 3.40% 3.34% 3.26%
Total current assets 22.66% 20.89% 18.90% -72.97% -95.22% -115.42% -131.39% -146.51% -161.76% -178.25%Deferred site rental receivables 25.19% 24.71% 24.11% 29.35% 29.94% 30.68% 30.42% 29.98% 29.39% 28.70%Property and equipment, net of accumulated depreciation 252.19% 254.49% 259.62% 277.15% 282.71% 289.72% 287.22% 283.06% 277.54% 271.07%Operating lease right-of-use assets 0.00% 106.42% 110.68% 115.88% 118.21% 121.14% 120.09% 118.35% 116.05% 113.34%Goodwill 185.84% 174.87% 172.57% 172.57% 161.65% 148.45% 133.03% 120.25% 110.29% 103.17%Site rental contracts and customer relationships, net 96.05% 82.67% 74.74% 90.10% 91.90% 94.18% 93.37% 92.02% 90.22% 88.12%Other intangible assets, net excluding site rental contracts and customer relationships, net 5.66% 1.25% 1.16% 1.29% 1.31% 1.35% 1.34% 1.32% 1.29% 1.26%Deferred income tax assets 0.00% 0.00% 0.00% 0.00% 0.00% 0.00% 0.00% 0.00% 0.00% 0.00%Long-term prepaid rent and other assets, net 16.96% 2.01% 2.04% 2.16% 2.21% 2.26% 2.24% 2.21% 2.17% 2.11%
Total assets 604.55% 667.31% 663.84% 615.53% 592.71% 572.35% 536.32% 500.66% 465.19% 429.52%
Liabilities and Equity:Current Liabilities:
Accounts payable 5.77% 5.80% 3.94% 5.56% 5.67% 5.81% 5.76% 5.68% 5.56% 5.43%Accrued interest 2.73% 2.93% 3.41% 3.11% 3.17% 3.25% 3.22% 3.18% 3.11% 3.04%Other accrued liabilities 6.47% 6.26% 6.47% 6.97% 7.11% 7.28% 7.22% 7.12% 6.98% 6.81%Deferred revenues 9.18% 11.40% 12.05% 11.13% 11.35% 11.64% 11.54% 11.37% 11.15% 10.89%Current maturities of debt and other obligations 1.97% 1.74% 2.21% 2.38% 2.43% 2.49% 2.47% 2.43% 2.39% 2.33%Liabilities from discontinued operations 0.00% 0.00% 0.00% 0.00% 0.00% 0.00% 0.00% 0.00% 0.00% 0.00%Current portion of operating lease liabilities 0.00% 5.19% 5.63% 5.78% 5.89% 6.04% 5.99% 5.90% 5.78% 5.65%
Total current liabilities 26.13% 33.32% 33.72% 34.92% 35.62% 36.51% 36.19% 35.67% 34.97% 34.16%Debt and other long-term obligations 305.64% 312.70% 327.93% 346.39% 353.34% 362.10% 358.98% 353.78% 346.88% 338.79%Operating lease liabilities 0.00% 95.63% 99.45% 41.65% 42.49% 43.54% 43.16% 42.54% 41.71% 40.74%Other long-term liabilities 50.88% 43.66% 40.74% 52.76% 53.82% 55.16% 54.68% 53.89% 52.84% 51.61%
Total liabilities 382.65% 485.30% 501.83% 475.73% 485.28% 497.31% 493.02% 485.88% 476.40% 465.28%CCIC Stockholders' equity: 0.00% 0.00% 0.00% 0.00% 0.00% 0.00% 0.00%
Common Equity 327.70% 309.89% 307.14% 307.14% 287.72% 264.22% 236.77% 214.02% 196.30% 183.62%Preferred Stock 0.00% 0.00% 0.00% 0.00% 0.00% 0.00% 0.00% 0.00% 0.00% 0.00%Accumulated other comprehensive income / loss 0.09% 0.09% 0.07% -0.07% -0.06% -0.06% -0.05% -0.05% -0.04% -0.04%Dividends / distributions in excess of earnings 105.70% 127.80% 145.07% -167.28% -180.22% -189.11% -193.42% -199.18% -207.47% -219.35%Noncontrolling interest from discontinued operations 0.00% 0.00% 0.00% 0.00% 0.00% 0.00% 0.00% 0.00% 0.00% 0.00%
Total equity 221.91% 182.01% 162.00% 139.79% 107.43% 75.05% 43.30% 14.79% -11.22% -35.77%Total liabilities and equity 604.55% 667.31% 663.84% 615.53% 592.71% 572.35% 536.32% 500.66% 465.19% 429.52%
Crown Castle International CorpValue Driver Estimation
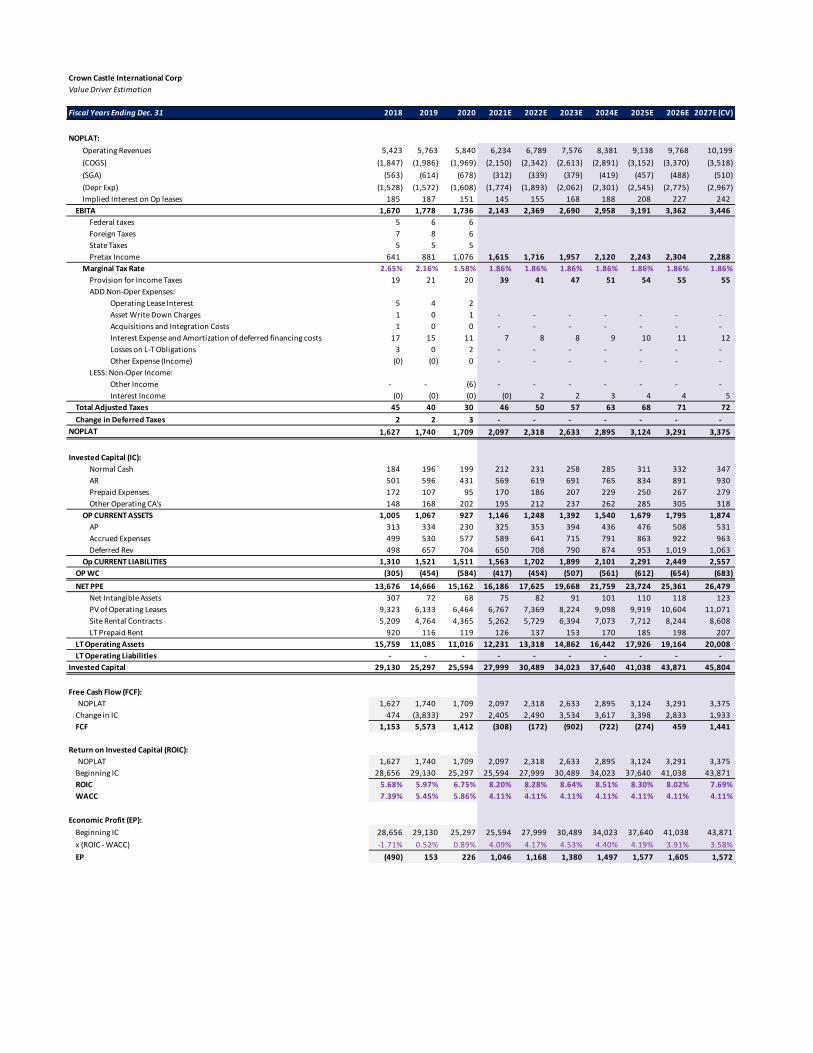
Fiscal Years Ending Dec. 31 2018 2019 2020 2021E 2022E 2023E 2024E 2025E 2026E 2027E (CV)
NOPLAT:
Operating Revenues 5,423 5,763 5,840 6,234 6,789 7,576 8,381 9,138 9,768 10,199 (COGS) (1,847) (1,986) (1,969) (2,150) (2,342) (2,613) (2,891) (3,152) (3,370) (3,518)(SGA) (563) (614) (678) (312) (339) (379) (419) (457) (488) (510)(Depr Exp) (1,528) (1,572) (1,608) (1,774) (1,893) (2,062) (2,301) (2,545) (2,775) (2,967)Implied Interest on Op leases 185 187 151 145 155 168 188 208 227 242
EBITA 1,670 1,778 1,736 2,143 2,369 2,690 2,958 3,191 3,362 3,446 Federal taxes 5 6 6 Foreign Taxes 7 8 6 State Taxes 5 5 5 Pretax Income 641 881 1,076 1,615 1,716 1,957 2,120 2,243 2,304 2,288
Marginal Tax Rate 2.65% 2.16% 1.58% 1.86% 1.86% 1.86% 1.86% 1.86% 1.86% 1.86%Provision for Income Taxes 19 21 20 39 41 47 51 54 55 55 ADD Non-Oper Expenses:
Operating Lease Interest 5 4 2 Asset Write Down Charges 1 0 1 - - - - - - - Acquisitions and Integration Costs 1 0 0 - - - - - - - Interest Expense and Amortization of deferred financing costs 17 15 11 7 8 8 9 10 11 12 Losses on L-T Obligations 3 0 2 - - - - - - - Other Expense (Income) (0) (0) 0 - - - - - - -
LESS: Non-Oper Income:Other Income - - (6) - - - - - - - Interest Income (0) (0) (0) (0) 2 2 3 4 4 5
Total Adjusted Taxes 45 40 30 46 50 57 63 68 71 72
Change in Deferred Taxes 2 2 3 - - - - - - - NOPLAT 1,627 1,740 1,709 2,097 2,318 2,633 2,895 3,124 3,291 3,375
Invested Capital (IC):Normal Cash 184 196 199 212 231 258 285 311 332 347 AR 501 596 431 569 619 691 765 834 891 930 Prepaid Expenses 172 107 95 170 186 207 229 250 267 279 Other Operating CA's 148 168 202 195 212 237 262 285 305 318
OP CURRENT ASSETS 1,005 1,067 927 1,146 1,248 1,392 1,540 1,679 1,795 1,874 AP 313 334 230 325 353 394 436 476 508 531 Accrued Expenses 499 530 577 589 641 715 791 863 922 963 Deferred Rev 498 657 704 650 708 790 874 953 1,019 1,063
Op CURRENT LIABILITIES 1,310 1,521 1,511 1,563 1,702 1,899 2,101 2,291 2,449 2,557 OP WC (305) (454) (584) (417) (454) (507) (561) (612) (654) (683)
NET PPE 13,676 14,666 15,162 16,186 17,625 19,668 21,759 23,724 25,361 26,479 Net Intangible Assets 307 72 68 75 82 91 101 110 118 123 PV of Operating Leases 9,323 6,133 6,464 6,767 7,369 8,224 9,098 9,919 10,604 11,071 Site Rental Contracts 5,209 4,764 4,365 5,262 5,729 6,394 7,073 7,712 8,244 8,608 LT Prepaid Rent 920 116 119 126 137 153 170 185 198 207
LT Operating Assets 15,759 11,085 11,016 12,231 13,318 14,862 16,442 17,926 19,164 20,008 LT Operating Liabilities - - - - - - - - - -
Invested Capital 29,130 25,297 25,594 27,999 30,489 34,023 37,640 41,038 43,871 45,804
Free Cash Flow (FCF):NOPLAT 1,627 1,740 1,709 2,097 2,318 2,633 2,895 3,124 3,291 3,375
Change in IC 474 (3,833) 297 2,405 2,490 3,534 3,617 3,398 2,833 1,933 FCF 1,153 5,573 1,412 (308) (172) (902) (722) (274) 459 1,441
Return on Invested Capital (ROIC):NOPLAT 1,627 1,740 1,709 2,097 2,318 2,633 2,895 3,124 3,291 3,375
Beginning IC 28,656 29,130 25,297 25,594 27,999 30,489 34,023 37,640 41,038 43,871 ROIC 5.68% 5.97% 6.75% 8.20% 8.28% 8.64% 8.51% 8.30% 8.02% 7.69%WACC 7.39% 5.45% 5.86% 4.11% 4.11% 4.11% 4.11% 4.11% 4.11% 4.11%
Economic Profit (EP):
Beginning IC 28,656 29,130 25,297 25,594 27,999 30,489 34,023 37,640 41,038 43,871 x (ROIC - WACC) -1.71% 0.52% 0.89% 4.09% 4.17% 4.53% 4.40% 4.19% 3.91% 3.58%EP (490) 153 226 1,046 1,168 1,380 1,497 1,577 1,605 1,572
Crown Castle International CorpWeighted Average Cost of Capital (WACC) Estimation
Cost of Equity: ASSUMPTIONS:Risk-Free Rate 1.67% "10-year Treasury bond"Beta 0.74 "Average of 1, 2, 3, 4, 5, and 10-year weekly beta"Equity Risk Premium 4.26% Aswath Damodaran 4/1/21 COVID-Adjusted Implied ERPCost of Equity 4.83%
Cost of Debt:Risk-Free Rate 1.67% "10-year Treasury bond"Implied Default Premium 0.34%Pre-Tax Cost of Debt 2.01% "YTM on CCI 7-year corporate bond (2027)"Marginal Tax Rate 1.86%After-Tax Cost of Debt 1.97%
Market Value of Common Equity: MV WeightsTotal Shares Outstanding 431.31 (Millions)Current Stock Price 177.54 MV of Equity 76,575 74.84%
Market Value of Debt:Short-Term DebtCurrent Portion of LTD 129Long-Term Debt 19151PV of Operating Leases 6,464 MV of Total Debt 25,744 25.16%
Market Value of Preferred Stock:Total Shares OutstandingPrice of Pfd. SharesMV of Preferred
Market Value of the Firm 102,319 100.00%
Estimated WACC 4.11%
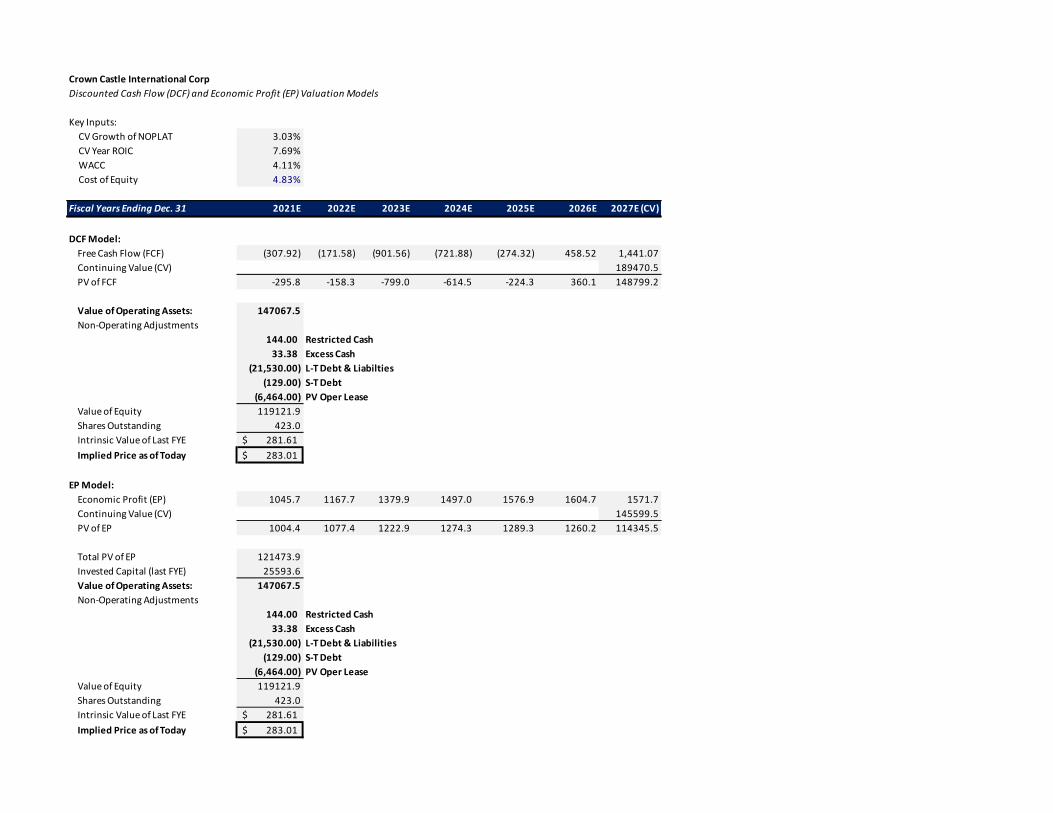
Crown Castle International CorpDiscounted Cash Flow (DCF) and Economic Profit (EP) Valuation Models
Key Inputs: CV Growth of NOPLAT 3.03% CV Year ROIC 7.69% WACC 4.11% Cost of Equity 4.83%
Fiscal Years Ending Dec. 31 2021E 2022E 2023E 2024E 2025E 2026E 2027E (CV)
DCF Model:Free Cash Flow (FCF) (307.92) (171.58) (901.56) (721.88) (274.32) 458.52 1,441.07 Continuing Value (CV) 189470.5PV of FCF -295.8 -158.3 -799.0 -614.5 -224.3 360.1 148799.2
Value of Operating Assets: 147067.5Non-Operating Adjustments
144.00 Restricted Cash33.38 Excess Cash
(21,530.00) L-T Debt & Liabilties(129.00) S-T Debt
(6,464.00) PV Oper LeaseValue of Equity 119121.9Shares Outstanding 423.0Intrinsic Value of Last FYE 281.61$ Implied Price as of Today 283.01$
EP Model:Economic Profit (EP) 1045.7 1167.7 1379.9 1497.0 1576.9 1604.7 1571.7Continuing Value (CV) 145599.5PV of EP 1004.4 1077.4 1222.9 1274.3 1289.3 1260.2 114345.5
Total PV of EP 121473.9Invested Capital (last FYE) 25593.6Value of Operating Assets: 147067.5Non-Operating Adjustments
144.00 Restricted Cash33.38 Excess Cash
(21,530.00) L-T Debt & Liabilities(129.00) S-T Debt
(6,464.00) PV Oper LeaseValue of Equity 119121.9Shares Outstanding 423.0Intrinsic Value of Last FYE 281.61$ Implied Price as of Today 283.01$

Crown Castle International CorpDividend Discount Model (DDM) or Fundamental P/E Valuation Model
Fiscal Years Ending Dec. 31 2021E 2022E 2023E 2024E 2025E 2026E 2027E (CV)
FFO Per Share 3.66$ 3.82$ 4.29$ 4.56$ 4.75$ 4.79$ 4.68$
Key Assumptions CV growth of EPS 3.03% CV Year ROE -99% Cost of Equity 4.83%
Future Cash Flows P/E Multiple (CV Year) 57.31 EPS (CV Year) 4.68$ Future Stock Price 267.97$ Dividends Per Share 6.68 7.17 7.89 8.57 9.17 9.62 9.85
1.05 1.10 1.15 1.21 1.27 1.33 1.33 Discounted Cash Flows 6.37 6.53 6.85 7.09 7.24 7.25 201.93
Intrinsic Value as of Last FYE 243.26$ Implied Price as of Today 244.47$
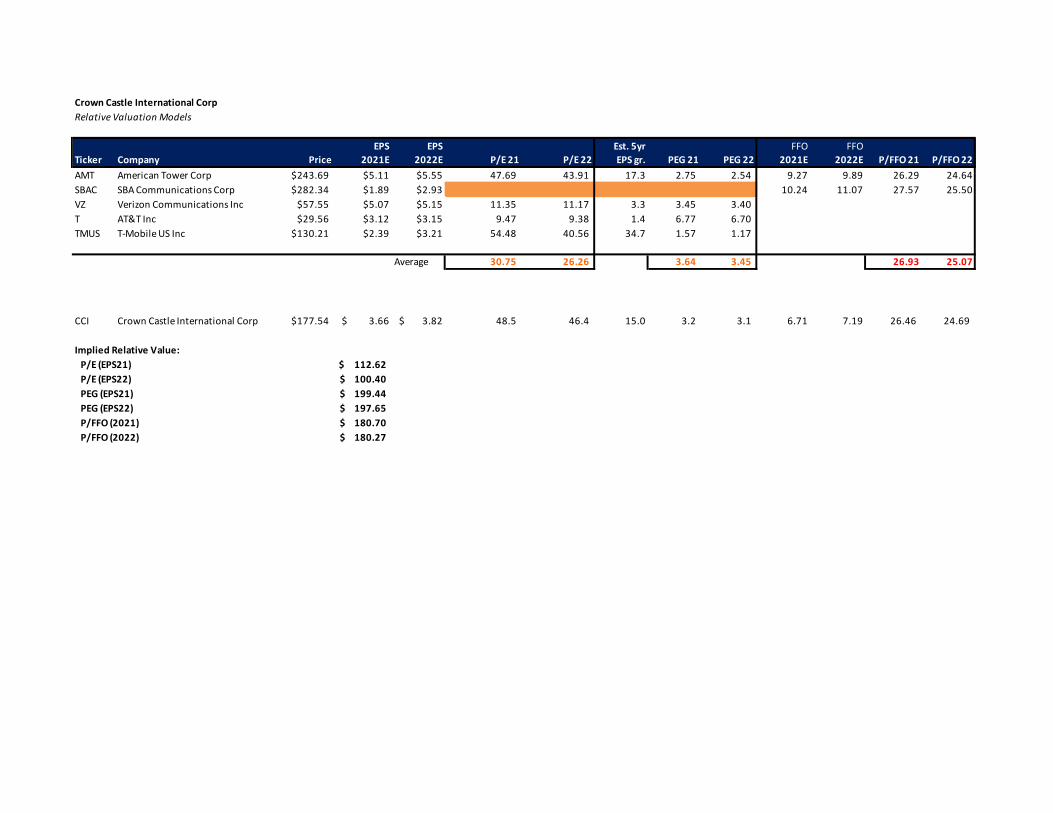
Crown Castle International CorpRelative Valuation Models
EPS EPS Est. 5yr FFO FFOTicker Company Price 2021E 2022E P/E 21 P/E 22 EPS gr. PEG 21 PEG 22 2021E 2022E P/FFO 21 P/FFO 22
AMT American Tower Corp $243.69 $5.11 $5.55 47.69 43.91 17.3 2.75 2.54 9.27 9.89 26.29 24.64SBAC SBA Communications Corp $282.34 $1.89 $2.93 10.24 11.07 27.57 25.50VZ Verizon Communications Inc $57.55 $5.07 $5.15 11.35 11.17 3.3 3.45 3.40 T AT&T Inc $29.56 $3.12 $3.15 9.47 9.38 1.4 6.77 6.70 TMUS T-Mobile US Inc $130.21 $2.39 $3.21 54.48 40.56 34.7 1.57 1.17
Average 30.75 26.26 3.64 3.45 26.93 25.07
CCI Crown Castle International Corp $177.54 $ 3.66 $ 3.82 48.5 46.4 15.0 3.2 3.1 6.71 7.19 26.46 24.69
Implied Relative Value: P/E (EPS21) $ 112.62 P/E (EPS22) 100.40$ PEG (EPS21) 199.44$ PEG (EPS22) 197.65$ P/FFO (2021) 180.70$ P/FFO (2022) 180.27$

Crown Castle International CorpKey Management Ratios
Fiscal Years Ending Dec. 31 2018 2019 2020 2021E 2022E 2023E 2024E 2025E 2026E 2027E (CV)
Liquidity Ratios:Current Ratio (Current Assets / Current Liabilities) 0.87 0.63 0.56 (2.09) (2.67) (3.16) (3.63) (4.11) (4.63) (5.22) Quick Ratio (Current Assets-(Inventories + Prepayments)/Current Liabilities) 0.75 0.57 0.51 (2.17) (2.76) (3.25) (3.71) (4.19) (4.71) (5.30) Cash Ratio ((Cash +Marketable Securities) / Current Liabilities) 0.20 0.10 0.12 (2.63) (3.21) (3.70) (4.17) (4.65) (5.16) (5.76)
Asset-Management Ratios:Asset Turnover (Net Sales / Average Total Assets) 0.17 0.16 0.15 0.17 0.19 0.20 0.21 0.22 0.23 0.24 Accounts Receivable Turnover (Net Sales / Average Accounts Recievable) 12.07 10.51 11.37 12.47 11.43 11.56 11.51 11.43 11.33 11.20 Day Sales Outstanding (Accounts Recievable/(Net Sales / 365)) 33.72 37.75 26.94 33.30 33.30 33.30 33.30 33.30 33.30 33.30
Financial Leverage Ratios:Debt to Assets Ratio (Total Liabilities / Total Assets) 0.63 0.73 0.76 0.77 0.82 0.87 0.92 0.97 1.02 1.08 Debt to Equity Ratio (Total Liabilities / Total Shareholder's Equity) 1.72 2.67 3.10 3.40 4.52 6.63 11.39 32.85 (42.47) (13.01) Equity Ratio (Total Shareholder's Equity / Total Assets) 0.37 0.27 0.24 0.23 0.18 0.13 0.08 0.03 (0.02) (0.08) Interest Coverage Ratio (EBIT / Annual Interest Expense) (2.23) (2.28) (2.70) (5.16) (5.41) (5.66) (5.57) (5.43) (5.23) (5.00)
Profitability Ratios:Return on Equity (Net Income / Average Shareholder's Equity) 4.58% 6.63% 10.02% 17.89% 22.53% 32.40% 49.42% 96.87% 2097.57% -98.83%Return on Assets (Net Income / Average Total Assets) 1.72% 2.10% 2.59% 4.22% 4.59% 5.04% 5.21% 5.30% 5.32% 5.29%Gross Margin (Gross Profit / Net Sales) 65.94% 65.54% 66.28% 65.51% 65.51% 65.51% 65.51% 65.51% 65.51% 65.51%Operating Margin (Operating Income / Net Sales) 26.41% 27.05% 31.90% 32.06% 32.61% 33.29% 33.05% 32.65% 32.10% 31.42%Pretax Margin (Income before taxes / Revenue) 12.72% 15.29% 18.42% 25.91% 25.27% 25.84% 25.30% 24.54% 23.59% 22.43%
Payout Policy Ratios:Dividend Payout Ratio (Dividend/EPS) 3.17 2.54 2.09 1.81 1.86 1.82 1.86 1.92 1.99 2.09 Total Payout Ratio ((Divs. + Repurchases)/NI) 3.25 2.62 2.18 1.81 1.86 1.82 1.86 1.92 1.99 2.09 EPS Ratio (Net Earnings / Number of Shares) 13.13 13.85 13.81 14.49 15.50 17.00 18.49 19.81 20.81 21.36
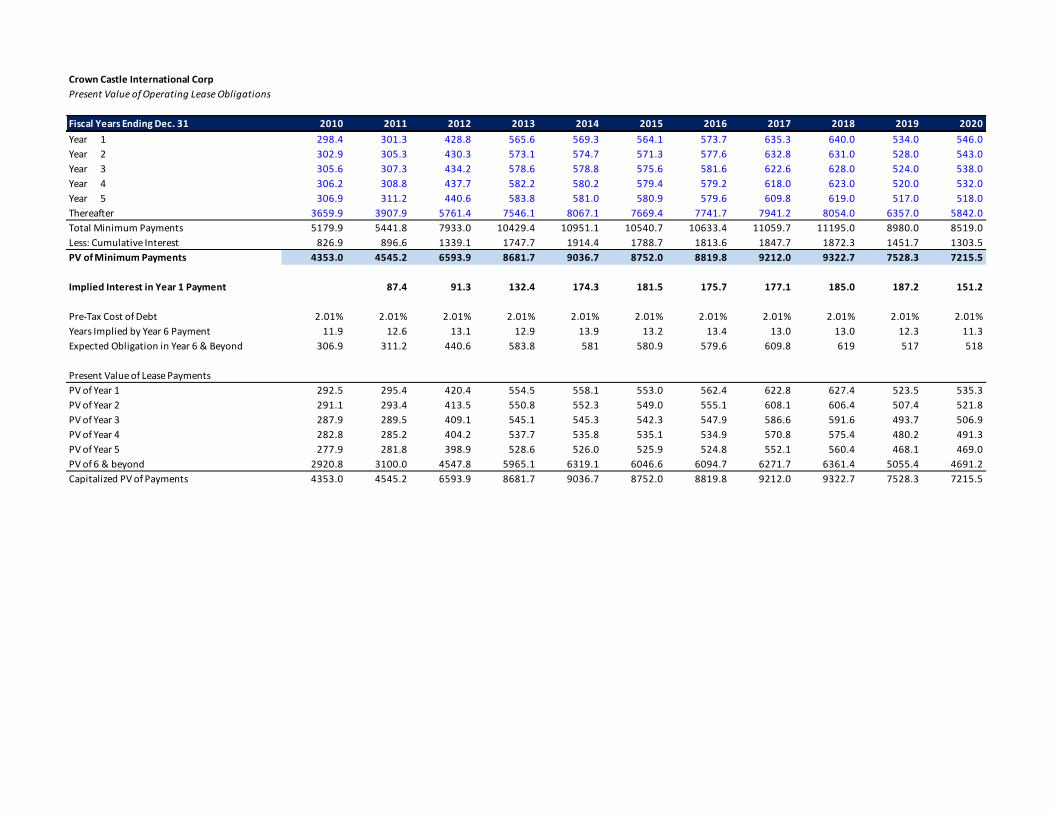
Crown Castle International CorpPresent Value of Operating Lease Obligations
Fiscal Years Ending Dec. 31 2010 2011 2012 2013 2014 2015 2016 2017 2018 2019 2020
Year 1 298.4 301.3 428.8 565.6 569.3 564.1 573.7 635.3 640.0 534.0 546.0Year 2 302.9 305.3 430.3 573.1 574.7 571.3 577.6 632.8 631.0 528.0 543.0Year 3 305.6 307.3 434.2 578.6 578.8 575.6 581.6 622.6 628.0 524.0 538.0Year 4 306.2 308.8 437.7 582.2 580.2 579.4 579.2 618.0 623.0 520.0 532.0Year 5 306.9 311.2 440.6 583.8 581.0 580.9 579.6 609.8 619.0 517.0 518.0Thereafter 3659.9 3907.9 5761.4 7546.1 8067.1 7669.4 7741.7 7941.2 8054.0 6357.0 5842.0Total Minimum Payments 5179.9 5441.8 7933.0 10429.4 10951.1 10540.7 10633.4 11059.7 11195.0 8980.0 8519.0Less: Cumulative Interest 826.9 896.6 1339.1 1747.7 1914.4 1788.7 1813.6 1847.7 1872.3 1451.7 1303.5PV of Minimum Payments 4353.0 4545.2 6593.9 8681.7 9036.7 8752.0 8819.8 9212.0 9322.7 7528.3 7215.5
Implied Interest in Year 1 Payment 87.4 91.3 132.4 174.3 181.5 175.7 177.1 185.0 187.2 151.2
Pre-Tax Cost of Debt 2.01% 2.01% 2.01% 2.01% 2.01% 2.01% 2.01% 2.01% 2.01% 2.01% 2.01%Years Implied by Year 6 Payment 11.9 12.6 13.1 12.9 13.9 13.2 13.4 13.0 13.0 12.3 11.3Expected Obligation in Year 6 & Beyond 306.9 311.2 440.6 583.8 581 580.9 579.6 609.8 619 517 518
Present Value of Lease PaymentsPV of Year 1 292.5 295.4 420.4 554.5 558.1 553.0 562.4 622.8 627.4 523.5 535.3PV of Year 2 291.1 293.4 413.5 550.8 552.3 549.0 555.1 608.1 606.4 507.4 521.8PV of Year 3 287.9 289.5 409.1 545.1 545.3 542.3 547.9 586.6 591.6 493.7 506.9PV of Year 4 282.8 285.2 404.2 537.7 535.8 535.1 534.9 570.8 575.4 480.2 491.3PV of Year 5 277.9 281.8 398.9 528.6 526.0 525.9 524.8 552.1 560.4 468.1 469.0PV of 6 & beyond 2920.8 3100.0 4547.8 5965.1 6319.1 6046.6 6094.7 6271.7 6361.4 5055.4 4691.2Capitalized PV of Payments 4353.0 4545.2 6593.9 8681.7 9036.7 8752.0 8819.8 9212.0 9322.7 7528.3 7215.5

Crown Castle International CorpSensitivity Tables
283.01 4.53% 4.63% 4.73% 4.83% 4.93% 5.03% 5.13% 283.01 1.11% 1.36% 1.61% 1.86% 2.11% 2.36% 2.61%
1.82% 296.37 296.45 296.53 296.61 296.70 296.78 296.86 3.00% 280.43 280.45 280.47 280.49 280.51 280.53 280.56
1.87% 291.73 291.81 291.89 291.97 292.05 292.13 292.21 2.80% 281.26 281.29 281.31 281.33 281.35 281.38 281.40
1.92% 287.20 287.28 287.36 287.44 287.52 287.60 287.68 2.60% 282.10 282.12 282.15 282.17 282.19 282.22 282.24
1.97% 282.78 282.86 282.93 283.01 283.09 283.17 283.24 2.40% 282.94 282.96 282.99 283.01 283.04 283.06 283.08
2.02% 278.46 278.53 278.61 278.69 278.76 278.84 278.92 2.20% 283.77 283.80 283.82 283.85 283.88 283.90 283.93
2.07% 274.24 274.31 274.39 274.46 274.54 274.61 274.69 2.00% 284.61 284.64 284.66 284.69 284.72 284.74 284.77
2.12% 270.11 270.18 270.26 270.33 270.41 270.48 270.55 1.80% 285.45 285.48 285.50 285.53 285.56 285.59 285.61
283.01 0.62 0.66 0.70 0.74 0.78 0.82 0.86 283.01 3.66% 3.81% 3.96% 4.11% 4.26% 4.41% 4.56%
3.81% 746.00 585.89 477.17 395.73 339.01 292.40 254.91 7.93% 551.73 429.61 348.03 289.96 246.73 213.44 187.10
3.96% 640.43 511.06 420.56 351.29 302.30 261.56 228.47 7.85% 547.73 426.41 345.37 287.69 244.76 211.69 185.54
4.11% 558.49 451.12 374.20 314.30 271.37 235.31 205.79 7.77% 543.65 423.15 342.65 285.38 242.74 209.91 183.95
4.26% 493.05 402.03 335.54 283.01 244.95 212.71 186.13 7.69% 539.49 419.82 339.88 283.01 240.68 208.09 182.32
4.41% 439.59 361.09 302.82 256.21 222.13 193.04 168.91 7.61% 535.24 416.41 337.05 280.60 238.58 206.23 180.66
4.56% 395.09 326.43 274.76 233.00 202.21 175.77 153.71 7.53% 530.90 412.94 334.16 278.13 236.43 204.34 178.97
4.71% 357.48 296.70 250.44 212.70 184.68 160.48 140.20 7.45% 526.47 409.39 331.21 275.61 234.24 202.40 177.23
283.01 2.94% 2.97% 3.00% 3.03% 3.06% 3.09% 3.12%
1.46% 316.70 326.00 335.88 346.41 357.64 369.65 382.53
1.53% 296.63 304.88 313.62 322.91 332.78 343.30 354.53
1.60% 278.44 285.80 293.57 301.80 310.53 319.80 329.66
1.67% 262.10 268.71 275.66 283.01 290.78 299.00 307.72
1.74% 246.74 252.67 258.90 265.46 272.38 279.69 287.42
1.81% 232.85 238.20 243.81 249.71 255.91 262.44 269.34
1.88% 220.05 224.90 229.97 235.29 240.87 246.73 252.91
Marginal Tax Rate
Effe
ctiv
e Ta
x R
ate
WACC
CV R
OIC
Ris
k Fr
ee R
ate
Cost of Equity
Cost
of D
ebt
Beta
ERP
CV Growth of NOPLAT

Important Disclaimer
This report was created by students enrolled in theSecurity Analysis (6F:112) class at the University ofIowa. The report was originally created to offer aninternal investment recommendation for theUniversity of Iowa Krause Fund and its advisory board.The report also provides potential employers andother interested parties an example of the students’skills, knowledge and abilities. Members of the KrauseFund are not registered investment advisors, brokersor officially licensed financial professionals. Theinvestment advice contained in this report does notrepresent an offer or solicitation to buy or sell any ofthe securities mentioned. Unless otherwise noted,facts and figures included in this report are frompublicly available sources. This report is not acomplete compilation of data, and its accuracy is notguaranteed. From time to time, the University of Iowa,its faculty, staff, students, or the Krause Fund may holda financial interest in the companies mentioned in thisreport.
Important disclosures appear on the last page of this report.
15