re: consumer and governmental affairs bureau seeks comment ... 2020... · 1 the rehabilitation...
TRANSCRIPT

VIA ECFS
August 4, 2020
Marlene H. Dortch, Secretary
Office of the Secretary
Federal Communications Commission
445 12th Street, S.W.
TW-A325
Washington D.C. 20554
Re: Consumer and Governmental Affairs Bureau Seeks Comment On Tentative Findings
for the 2020 Twenty-First Century Communications and Video Accessibility Act Biennial
Report [CG Docket No. 10-213]
Dear Ms. Dortch:
Enclosed for filing in the above referenced Public Notice are comments of the
Rehabilitation Engineering Research Center for Wireless Inclusive Technologies (Wireless
RERC).
Should you have any questions concerning this filing, please do not hesitate to contact me
via email at [email protected].
Respectfully submitted,
Helena Mitchell
Principal Investigator, Wireless RERC
Center for Advanced Communications Policy
Georgia Institute of Technology
Enclosure
2
COMMENTS OF GEORGIA INSTITUTE OF TECHNOLOGY (GEORGIA TECH), CENTER FOR
ADVANCED COMMUNICATIONS POLICY (CACP) AND THE REHABILITATION ENGINEERING RESEARCH CENTER FOR
WIRELESS INCLUSIVE TECHNOLOGIES (WIRELESS RERC)
INTRODUCTION
The Georgia Institute of Technology's Center for Advanced Communications Policy
(CACP), in collaboration with the Rehabilitation Engineering Research Center for Wireless
Inclusive Technologies1 (Wireless RERC), hereby submits comments to the Public Notice
seeking comment on the 2020 CVAA Preliminary Findings Report [CG Docket No. 10-213],
released on July 21, 2020. CACP is the home the Wireless RERC, funded since 2001, the
Wireless RERC's mission is to integrate established wireless technologies with emerging
wirelessly connected devices and services for a transformative future where individuals with
disabilities achieve independence, improved quality of life, and enhanced community
participation.
One of the aims of the Wireless RERC is to provide substantive input to regulatory
agencies and other interested stakeholders to reduce access barriers and increase the development
and deployment of accessible wireless products and services. We accomplish this by
understanding user expectations and experiences concerning current and emerging wireless
technologies and services and promoting adoption and meaningful use by end-users. We have
been cited more than 200 times in written comments and testimony. We continue to monitor
regulatory activities, generate research papers, and collaborate with experts from the wireless
industry and disability community stakeholders.
In anticipation of this Public Notice, the Wireless RERC conducted a 2019/202 Mobile
Phone Accessibility Review (Accessibility Review/Review). The Review included mobile phone
models available in 2019 and up to February 2020 from the top four wireless carriers, one
1 The Rehabilitation Engineering Research Center for Wireless Inclusive Technologies (Wireless RERC) is
sponsored by the National Institute on Disability, Independent Living, and Rehabilitation Research
(NIDILRR grant number 90RE5025-01). NIDILRR is within the Administration for Community Living
(ACL), Department of Health and Human Services (HHS). The contents of this filing do not necessarily
represent the policy of NIDILRR, ACL, HHS, and you should not assume endorsement by the Federal
Government. 2 Phone models were identified in October 2019, and again in February 2020, at which time, additional phone
models were available.

3
prepaid carrier, and five Lifeline Carriers.3 Our initial comments submitted in April were based
on the analysis of a subsample of Lifeline-provided mobile phones. For this filing, however,
we are providing input based on the complete sample, which includes phone models from
all provider types. Researchers, using the providers' web pages as a reference, identified 141
mobile phones for evaluation. Data were collected on the presence of 35 features that impact
accessibility and/or were designed to provide access to people with vision, hearing, cognitive and
mobility disabilities. Sources of accessibility feature data included the Mobile Manufacturers
Forum Global Accessibility Reporting Initiative (GARI) database,4 user manuals from several
different sites,5 and phonescoop.com. With the exception of the FM Radio feature and the
wireless emergency alert (WEA) message feature, the features identified for the study include
those that are used to access a given phone, the content displayed on the phone, to connect to
external assistive technology (AT), or other smart devices that can be controlled via the phone.
Study Limitations
A limitation of the results of this Accessibility Review is that the 35 features included in
the Review are not an exhaustive list of the way consumers adapt features of the phone for their
own use. Consumers use device features in novel ways to improve access. For example, the
cameras on smartphones can be used as QR code readers to access print materials in an
electronic format, which can improve information access by people with vision and print
disabilities. However, that feature was not assessed in the study.
Another limitation of the results that has persisted across all data collection periods
(2015, 2017, and 2019/20), is that for many of the features, information about whether it was
present on a given phone could not be found using three consumer-facing sources. Thus, we
cannot conclusively state that the features are or are not present. This difficulty in locating
information about certain features is in itself important to note, as consumers with disabilities
may experience a similar problem when comparing and purchasing phone models. While people
without disabilities can compare phone models based on preferences, people with disabilities
may have functional limitations that necessitate certain accessibility features for the phone to be
3 A random number generator was used to select five Lifeline carriers for inclusion in the review. 4 The GARI is a project of the Mobile & Wireless Forum (MWF). Some of the data referred to in this paper was
sourced from the information available from the GARI website www.gari.info and used with permission of
the MWF, although all views and conclusions are the authors alone. 5 These sites include the carrier’s webpage and the phone’s manufacturer.
4
usable by them (e.g., video calling, screen reader, AT connection). If a user with a disability is
not easily able to find the features he or she needs, then the consumer might purchase a phone
that is not fully accessible to them, or not purchase a phone model that would have been
accessible to them. Notwithstanding the limitations of this study, the results provide a snapshot
of the accessibility of a sample of mobile phone models commercially available in 2019 through
April 2020.
The Wireless RERC's cornerstone survey on wireless technology use by people with
disabilities, the Survey of User Needs (SUN), has been completed by over 8,000 consumers with
disabilities since it was first launched in 2001. Subsequent iterations of the survey have been
updated in response to changes in technology. In addition to questions about cell phone and
tablet use, the current version of the SUN collects information about wearables, smart home
technologies, and other next-generation wirelessly connected devices. The SUN's data collection
period aligns with the FCC's interest in assessing current mobile device accessibility. Unless
otherwise noted, the comments made herein share the results of the SUN and related focus group
work, and the results of the Accessibility Review.
RESPONSE TO SECTION I - COMPLIANCE WITH SECTIONS 255, 716, AND 718, ¶ 2
Over the 19 years that the Wireless RERC has been researching the accessibility of
wireless devices, mobile phone and wirelessly connected device adoption by people with
disabilities has steadily increased, as has the accessibility and usability of the devices. As we
have observed and celebrated accessibility gains, we continue to find that some gaps remain. The
Accessibility Review results indicated disparities in the number of accessibility features based on
disability type. For people with vision disabilities, the study analyzed 17 features. In contrast, the
study identified twelve applicable accessibility features for people with cognitive disabilities,
nine for people with hearing disabilities, and seven for people with mobility/dexterity features.
The variance in accessibility features in mobile devices highlights that between disabilities, there
are differential access challenges. These differences are also reflected in other mobile phone
accessibility databases, except with cognition-related features having the lowest number and
vision having the greatest. Awareness that these variations exist may provide developers,
manufacturers, and other industry participants with opportunities to enhance their design of these
devices.

5
We also note that having more than one disability (i.e., comorbidity) makes
identifying an appropriate mobile device more complex, particularly if they are the
disabilities that have a fewer number of associated accessibility features. For example, an
individual with comorbidities, possibly caused by a condition like diabetes, may have mobility
and vision limitations and be confronted with making a choice between a mobile phone that is
better apt to assist with one functional limitation but not the other. Then, considering how many
phones are cost-prohibitive,6 the study acknowledges that despite the growth in accessibility
features, other factors can contribute to the exclusion of some people with disabilities. Again,
this holds for designers as well as end-users.
Following are the aggregated and disaggregated results. These data support the FCC's
preliminary findings that yes, progress has been made, and also yes, some gaps persist. The left
axis reflects the percent of phones/devices that a given feature is present on.
Figure 1: All Accessibility Features (2019/20)
6 In response to growing digital divide, the Lifeline program ensures “low-income consumers in every state,
territory, commonwealth, and Tribal lands” have access to both broadband and mobile phones services.
Online at: https://www.fcc.gov/general/lifeline-program-low-income-consumers. Despite the presence of
this program, there is relatively low participation in the Lifeline program (Appendix A), likely due to
limited awareness which the COVID-19 pandemic has highlighted. Online at: https://themarkup.org/ask-
the-markup/2020/05/14/is-the-u-s-governments-lifeline-phone-service-really-a-lifeline
Thompson, S. (2018). Mobile technology and inclusion of persons with disabilities. Online at:
https://opendocs.ids.ac.uk/opendocs/handle/20.500.12413/13834

6
Longitudinal Comparison
For the 2020 report, ten more accessibility features were assessed than were in 2017. The
accessibility features included in both data collection periods showed growth in the percentage of
phones that carried these features.
Table 1: Comparison of Accessibility Features - Top 10 Steepest Percentage Point Differentials
Feature 2017 2019 Difference
Biometric Login 27% 80% 53 points
Vibration Adjustment 31% 74% 43 points
Near Field Communications (NFC) 27% 61% 34 points
Built-In TTS 47% 76% 29 points
Headphone Jack 64% 92% 28 points
Full Access Screen Reader 30% 57% 27 points
Touch Input 66% 91% 25 points
Voice Input 66% 87% 21 points
Captions 36% 56% 20 points
2-Way Video 42% 61% 19 points
The growth of accessibility features between 2017 and 2019 shows a shift towards the
integration of novel and more advanced technology. As society moves towards contactless
interactions and better device security, technologies such as NFC and biometric logins, people
with disabilities will continue to see the secondary effects of improved accessibility of mobile
phones. This underscores the importance of continuing to incorporate users with disabilities
into all stages of the design process so that accessibility is intentional within digital designs
instead of a fortuitous byproduct of innovative technology.
Figure 2: Comparison of Accessibility Features between 2017 and 2019/207
7 This chart only shows features assessed both in 2017 and 2019.

7
Assistive Technology (AT) Connections
Having multiple ways to connect a device to external AT is critical for some people with
disabilities' use of a smartphone. As shown in Figure 3, of all mobile phones in the sample, 99%
had USB capabilities, 97% had Bluetooth, while 92% had a headphone jack, 61% had NFC, 25%
had Mirror Link, and 1% had Infrared (IR). AT connections are particularly pertinent to those
who are blind who use refreshable Braille displays, those with quadriplegia, who use switch
access, or individuals who utilize neck-loops to amplify sounds. Connectivity options such as
Mirror Link, NFC, and Infrared allow users to connect to their vehicles, perform cashless
transactions, and utilize a smartphone as a universal remote. Furthermore, Bluetooth technology
is increasingly used to connect smartphones to smart prosthetic devices and hearing aids.8,9,10
The continued incorporation of features that enable device-to-device connectivity will not
only support people with disabilities' use of external assistive technologies but is supportive
of their use of Internet of Things (IoT) devices and services that advance independent living
and social inclusion.
Figure 3: Assistive Technology Connection (2019/20)
Accessibility by Disability Type
The Accessibility Review examined accessibility features for four disability types: vision,
hearing, cognitive, and mobility/dexterity.
8 See http://www.wirelessrerc.gatech.edu/over-counter-hearing-aids-promise-reduce-accessibility-costs 9 See http://www.wirelessrerc.gatech.edu/google-developing-native-hearing-aid-support-android
10 See https://about.att.com/story/2018/connected_prosthetic.html

8
Accessibility Features for Vision Disabilities
In evaluating the accessibility features for vision disabilities, the study focused on the
percentage of phones that had individual features that improve access for people with vision
disabilities. As shown in Figure 4, 89% of phones had adjust font; 87% voice input; 84% screen
magnifier; 80% biometric log-in; 79% accessibility menu; 76% built-in TTS; 74% digital
assistant; 64% contrast adjustment; 61% color contrast; 57% full access screen reader; 50% color
inversion; 35% dark theme; 32% grayscale; 30% braille access; 23% FM radio; 17% physical #
keypad; 15% procure TTS; 9% physical QWERTY keyboard.
Figure 4: Accessibility Features for Vision Disabilities (2019/20)
Figure 5 shows the change in the presence of vision-related accessibility features between
the 2017 and 2019/20 data sets.
9
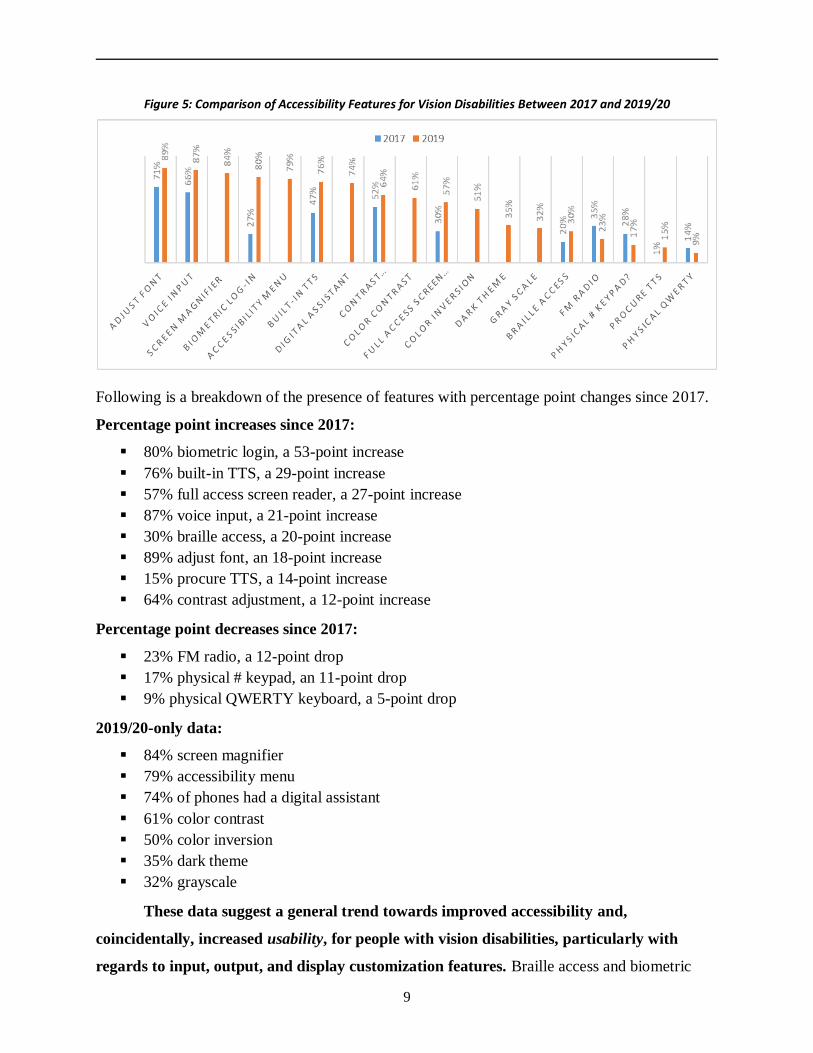
Figure 5: Comparison of Accessibility Features for Vision Disabilities Between 2017 and 2019/20
Following is a breakdown of the presence of features with percentage point changes since 2017.
Percentage point increases since 2017:
80% biometric login, a 53-point increase
76% built-in TTS, a 29-point increase
57% full access screen reader, a 27-point increase
87% voice input, a 21-point increase
30% braille access, a 20-point increase
89% adjust font, an 18-point increase
15% procure TTS, a 14-point increase
64% contrast adjustment, a 12-point increase
Percentage point decreases since 2017:
23% FM radio, a 12-point drop
17% physical # keypad, an 11-point drop
9% physical QWERTY keyboard, a 5-point drop
2019/20-only data:
84% screen magnifier
79% accessibility menu
74% of phones had a digital assistant
61% color contrast
50% color inversion
35% dark theme
32% grayscale
These data suggest a general trend towards improved accessibility and,
coincidentally, increased usability, for people with vision disabilities, particularly with
regards to input, output, and display customization features. Braille access and biometric

10
login had the most significant percentage point increase. Five of the features are assistive to
people with color perception difficulties.
Accessibility Features for Hearing Disabilities
Figure 6 illustrates the accessibility features and phone characteristics that are important
for people with hearing disabilities. Touch input was included as an input alternative to voice
input, and Bluetooth was included because of the availability of Bluetooth connected hearing
aids. Hearing Aid Compatibility is discussed separately, and results shown in Figure 8. Ninety-
nine percent (99%) of phones had customizable volume, 97% of phones had Bluetooth, 91% had
touch input, 79% had an accessibility menu, 61% of phones had 2-way video capabilities, 56%
had the caption feature, and 23% had real-time text.
Figure 6: Accessibility Features for Hearing Disabilities (2019/20)
Figure 7 shows the change in the presence of vision-related accessibility features between
the 2017 and 2019/20 data sets.

11
Figure 7: Comparison of Accessibility Features for Hearing Disabilities Between 2017 and 2019/20
Following is a breakdown of the presence of features with percentage point changes since 2017
Percentage point increases:
80% biometric login, a 53-point increase
74% vibration adjustment, a 43-point increase
90% touch input, a 24-point increase
56% captions, a 20-point increase
60% 2-way video, an 18-point increase
97% Bluetooth, a 6-point increase
2019/20-only data:
99% customizable volume
78% accessibility menu
22% real-time text
These data suggest a general trend towards improved accessibility for people with
hearing disabilities. In 2019, phone manufacturers introduced real-time text (RTT). As it is a
relatively new accessibility feature, we expected a low presence, and the study's findings support
this as only 23% of sampled phones included RTT. There was an increase in the availability of
two-way video capability. This feature is essential for people who are Deaf and whose primary
language is American Sign Language (ASL). If communicating in ASL is not a preference but a
requirement for effective communications, then for people who are Deaf, 60% of the phones in
the sample would be appropriate for their communication needs.
Hearing Aid Compatibility (HAC) Ratings
Another phone characteristic that is important for people who use hearing aids or
cochlear implants is the HAC rating. Without a HAC compliant device, a user with a hearing aid

12
or cochlear implant would experience interference. HAC ratings were found for 98% of the
sample, which is an increase of 18% from the 2017 sample. Out of the 138 mobile phones11, all
had at least a HAC rating of M3 or T3, on a scale of 1 to 4, with four being considered
excellent.12 As shown in Figure 10, M4/T3 ratings account for 39% of the sample, M3/T4 (24%),
M4 (20%), M4/T4 (14%), N/A (2%), M3 (1%), M3/T3 (0%).
Figure 8: HAC Ratings (2019/20)
Compared to the HAC ratings found in 2017, the percentage of phones that were HAC
compliant noticeably improved. The ratings shifted from a majority of devices falling into the
M3/T3 category in 2017, to a majority of the mobile phones landing into the M4/T3 rating
in 2019/20. Figure 9 highlights the growth in HAC-compliance from "good" to "excellent." Also
noteworthy is the increased transparency by mobile phone manufacturers to clearly
indicate the HAC ratings of phones. The graph illustrates this as the percentage of mobile
devices labeled "N/A" in 2017 (21%) decreased by 19 points in 2019/20 (2%).
11 Researchers were able to identify HAC ratings for 138 of the 141 phones in the sample. 12 The M and T in the HAC ratings stand for microphone and telecoil. M3 or T3 is considered good and M4 or T4 is
considered excellent.

13
Figure 9: Comparison of HAC Ratings (2017 v 2019)
If one wanted a phone with an excellent microphone HAC rating, they could select from
53% of the phones in the sample (up from 29% in 2017). For an excellent telecoil HAC rating,
they could select from 34% of the phones in the sample (up from 30% in 2017). Some hearing
aids, however, have both microphones and telecoils, and users can switch between the M and T
settings depending on the listening situation. These users would need a device with a dual M/T
HAC rating. While the majority of the phones had dual ratings, only 16% of the phones in the
sample had excellent M and T ratings (M4/T4).
Accessibility Features for Cognitive Disabilities
Figure 10 illustrates accessibility features and phone characteristics that may improve the
usability of the device for people with cognitive disabilities, as well as older adults. Of the
sampled mobile phones, 89% had adjust font, 87% had voice input, 80% had biometric login,
79% had an accessibility menu, 76% had built-in TTS, 75% had a digital assistant, 64% of
phones had contrast adjustment, 61% color contrast, 57% full-access screen reader, 50% color
inversion, 34% simple display, 15% procure TTS. Features for customizing the display, the
appearance of on-screen text, and alternative logins can be assistive to people with cognitive
disabilities, as they allow for:
Shorter word counts per line (adjust font),
Auditory information processing (TTS and screen reader),
Removal of distracting stimuli (simple display),
Readability (color contrast and color inversion),
Limiting dependence on typing (voice input and digital assistants), and
Limiting dependency on memory (biometric login).

14
Figure 10: Accessibility Features for Cognitive Disabilities (2019/20)
Figure 11 shows the change in the presence of cognitive-related accessibility features
between the 2017 and 2019/20 data sets.
Figure 11: Comparison of Accessibility Features for Cognitive Disabilities Between 2017 and 2019/20
Following is a breakdown of the presence of features and percentage point changes since 2017.
Percentage point increases:
80% biometric login a 53-point increase
76% built-in TTS a 28-point increase
57% full access screen reader a 27-point increase
87% voice input, a 20-point increase
89% adjust font, a 17-point increase

15
64% contrast adjustment a 12-point increase
15% procure TTS a 13-point increase
34% simple display, a .4-point increase13
2019/20-only data:
79% accessibility menu
74% had digital assistants
61% color contrast
50% color inversion
These data indicate an increase in the percentage of phones with features available for
people with cognitive disabilities. Specifically, for people who use the voice output features
and the alternative login, there was a significant increase in the presence of TTS, full access
screen readers, and biometric login.
Accessibility Features for Mobility/Dexterity Disabilities
Figure 12 illustrates accessibility features and phone characteristics that may improve the
accessibility of the device for people with mobility and dexterity disabilities. In the Review,
seven features were intended to aid people living with mobility/dexterity disability in unlocking,
navigating the device, and interacting with external systems. Eighty-seven (87%) of phones had
voice input, 80% had biometric login, 79% accessibility menu, 74% digital assistants, 61% had
NFC, and 50% of phones had switch control, a feature designed to allow for hands-free
navigation of a device. Only 34% had a simple display option, which is useful for people with
dexterity disabilities who want to improve the ease of selecting icons. The percentage of phones
with a simple display option remained flat across the two data collection periods.
Figure 12: Accessibility Features for Mobility/Dexterity Disabilities (2019/20)
13 This study rounds to the nearest whole number for data values. In 2017, Simple Display was present in 33.64% of
phones which was rounded to 34%. There was a minute increase between the two years of study (2017 v 2019/20).

16
Figure 13 shows the change in the presence of mobility/dexterity-related accessibility
features between the 2017 and 2019/20 data sets.
Figure 13: Comparison of Accessibility Features for Mobility/Dexterity Disabilities (2017 v 2019/20)
Following is a breakdown of the presence of features and percentage point changes since 2017.
Percentage point increases:
80% biometric login a 53-point increase
87% voice input, a 21-point increase
2019/20-only data:
79% accessibility menu
75% digital assistant
61% near-field communications
50% switch control
To close this section, we reiterate that while accessibility is trending up, but when the
presence of accessibility features is compared across disability types, their rates of inclusion
across devices is variable. This finding is significant in that many people with disabilities report
living with more than one type of disability. Our Survey of User Needs respondents indicated a
diverse range of functional abilities, with 30% reporting three or more difficulties; and 18%
reporting four or more. Given the rate of people with disabilities reporting more than one
disability, it is exceedingly important to increase the percentage of more universally accessible
devices.
17
RESPONSE TO SECTION A1, ACCESSIBILITY, TELECOMMUNICATIONS AND
ADVANCED COMMUNICATION SERVICES AND EQUIPMENT
Response to ¶4
(1) smartphones continue to innovate and deploy technologies and features that enable improved access to telecommunications and advanced communications services of not only smartphones but other devices
used by people with disabilities; (2) speech-to-text and text-to-speech technology, voice assistants, and
screen readers continue to improve; … We also tentatively find that accessibility gaps remain.14
The above-detailed data from the Accessibility Review and focus group research of the
Wireless RERC supports the above preliminary finding. Professionals and individuals with
intellectual and developmental disabilities (IDD) agreed that the speech-to-text function on
phones is a useful support for connecting online.15 An individual with IDD shared the following
example: "I would say the voice technology. It's very beneficial… because, for example,
[colleague] has a challenge in his reading and writing. But he doesn't have any issue to text or
even to post on Facebook or to do anything, send emails, because he's using the voice
technology."
Response to ¶ 5 Smartphones and ¶ 7 Non-Smartphones (or Feature Phones)
Prior studies demonstrated how integral smartphones are to people with disabilities in
executing daily life activities.16,17,18 As such, their increased levels of accessibility stand to
deepen these devices' significance to task performance, productivity, social connections, and of
course, information and communications access. However, it is important to note that some users
with disabilities may prefer non-smartphones, so accessibility for these types of phones should
be given equal consideration. SUN data showed that 13% of respondents with disabilities were
14 FCC. (2020). Tentative findings for the 2020 biennial report to congress as required by the CVAA. Available at
https://www.fcc.gov/document/fcc-seeks-comment-tentative-findings-2020-cvaa-biennial-report 15 Donehower P. C., Jimenez, E., & Vinoksi, T. E. (2020). Technology use for social connectedness: Exploring the
experiences of people with intellectual and developmental disabilities, family members, and professionals
[Research Brief]. Wireless RERC, 20(1). Available at
http://www.wirelessrerc.gatech.edu/sites/default/files/technology_use_for_social_connectedness_research_brief_ervt_5.19.2020_00000004.pdf
16 DePompei, R., Gillette, Y., Goetz, E., Xenopoulos-Oddsson, A., Bryen, D., & Dowds, M. (2008). Practical applications for use of PDAs and smartphones with children and adolescents who have traumatic brain injury. NeuroRehabilitation, 23(6), 487-499.
17 Lancioni, G. E., Singh, N. N., O’Reilly, M. F., Sigafoos, J., Alberti, G., Zimbaro, C., & Chiariello, V. (2017).
Using smartphones to help people with intellectual and sensory disabilities perform daily activities.
Frontiers in public health, 5, 282. 18 Morris, J. T., PhD, Sweatman, M., PhD, & Jones, M. L., PhD. (2017). Smartphone Use and Activities by People
with Disabilities: User Survey 2016. Retrieved from
http://scholarworks.csun.edu/bitstream/handle/10211.3/190202/JTPD-2017-p50-66.pdf?sequence=1

18
users of non-smartphones.19 While non-smartphones have fewer accessibility options, for some,
the physical input options present (e.g., number keypad) offer the accessibility they are seeking
as they may have no interest in using their mobile phone for anything other than a
communication device.
Mobile phone accessibility features were evaluated by phone type: smartphone or non-
smartphone (Figure 14). Eighty-eight percent (88%) of the phones in the 2019/20 Accessibility
Review sample were smartphones, and 12% were non-smartphones. The results indicate that
both phone types contained features that can be assistive to people who are blind, have low
vision, cognitive disabilities, and/or physical disabilities. In the smartphone subsample, the most
frequently incorporated (top five) features were Bluetooth (100%), Touch Input (100%), USB
(99%), Customizable Volume (99%), and Voice Input (95%). For the non-smartphones
subsample, the top five features included Physical Keypad (100%), Headphone Jack (100%),
Customizable Volume (100%), USB (100%), Bluetooth (76%).
Figure 14: Comparison of Smartphone and Non-Smartphone Features (2019/20)
Smartphones outperformed non-smartphones in the percentage of accessibility features
present, pulling higher percentages for 26 of the 35 features examined, showing that smartphones
19 Moon, N. W., Griffiths, P. C., LaForce, S., Linden, M., “Wireless device use by individuals with disabilities:
Findings from a national survey,” Journal on Technology & Persons with Disabilities, vol 8, pp 196-209, June
2020.

19
not only have a greater variety of accessibility features, but they outperform non-smartphones in
many categories of accessibility. Six features, including infrared, mirror link, braille access, dark
theme, NFC, and biometric login, were only available in smartphone models. Figure 14
demonstrates a noteworthy phenomenon: non-smartphones can have advanced features. Twelve
percent (12%) of non-smartphones had digital assistants, and 18% of non-smartphones had real-
time text (RTT). To better compete with smartphones, it appears that non-smartphone
manufacturers are integrating popular smartphone features into their core models.
Of the features that were present in both phone types, the ones with the steepest
differentials are shown in Table 2. These data indicate that consumers with disabilities
seeking to purchase smartphones have more device options with a greater variety of
accessibility features. Of concern, however, is that some users prefer non-smartphones for
their perceived durability20 and cost-differential. This preference could inhibit access to
WEA messages since only 41% of non-smartphones were WEA-capable compared to 77%
of smartphones.
Table 2: Comparison of Non-smartphones to Smartphones - Top 10 Steepest Percentage Point Differentials
Feature Non % Smart % Difference
Physical Number Keypad 100% 5% 95 points
Biometric Log-In 0% 90% 90 points
Touch Input 24% 100% 76 points
Digital Assistant 12% 83% 71 points
Near Field Communications 0% 69% 69 points
Voice Input 29% 91% 65 points
2 Way Video 6% 69% 63 points
Full Access Screen Reader 29% 91% 61 points
Switch Control 6% 56% 50 points
Accessibility Menu 35% 84% 49 points
Looking at HAC separately, the non-smartphones sampled had the greatest percentage of
phones with dual M4/T4 ratings (41% compared to 10%) and M3/T4 ratings (35% compared to
18%). Whereas the smartphones sampled had greater percentages of phone models with M3/T3
20 Mitchell, H., LaForce, S., Moon, N., Baker, P.M.A., Garcia, A., & Jacobs, B. (2018, May 3). Comments
submitted in response to the Public Notice in the Matter of The Accessibility of Communications
Technologies for the 2018 Biennial Report Required by the Twenty-First Century Communications
and Video Accessibility Act [CG Docket No. 10-213, Consumer and Governmental Affairs Bureau].
Federal Communications Commission: Washington, D.C.

20
HAC ratings (28% compared to 6%) and M4/T3 HAC ratings (43% compared to 6%).
Figure 15: Comparison of Smartphone and Non-Smartphone HAC Ratings
The Preliminary Findings Report states that "ACB, CTIA, and the Wireless RERC
disagree about whether feature phones provide sufficient accessibility features."21 To clarify,
research conducted by the Wireless RERC supports the observation that accessibility is a moving
and morphing target. What is considered accessible to one user may be a barrier to another. For
example, recent focus groups exploring the use of wireless technologies to promote social
connectedness among individuals with IDD revealed that some respondents indicated that digital
assistants (e.g., Siri, Alexa, Google Assistant) were beneficial in accessing technology for social
connectedness.22 Conversely, others noted that digital assistants could present barriers: "[my
child] who has cerebral palsy has kind of a speech [issue]. So, things like Siri or OK, Google
can't fully understand him. So I wish that there was something that could remedy that.23"
Response to ¶ 8
The Preliminary Findings Report noted that "According to the Wireless RERC, which
reviewed 92 Lifeline-provided phones for its comments, the discrepancy in accessibility between
smartphones and feature phones mostly impacts Lifeline consumers, but the Wireless RERC also
21 FCC. (2020). Tentative findings for the 2020 biennial report to congress as required by the CVAA. Available at
https://www.fcc.gov/document/fcc-seeks-comment-tentative-findings-2020-cvaa-biennial-report 22 Donehower P. C., Jimenez, E., & Vinoksi, T. E. (2020). Technology use for social connectedness: Exploring the
experiences of people with intellectual and developmental disabilities, family members, and professionals
[Research Brief]. Wireless RERC, 20(1). Available at
http://www.wirelessrerc.gatech.edu/sites/default/files/technology_use_for_social_connectedness_research_
brief_ervt_5.19.2020_00000004.pdf 23 Ibid.

21
notes that the accessibility of these phones has improved compared to 2017 data."24 While we
maintain that the accessibility of Lifeline provided phones has improved since 2017, the FCC's
interpretation above, that the accessibility gaps between smartphones and non-smartphones
"mostly impacts Lifeline consumers," is a misunderstanding of the data presented. Our earlier
comments indicated that "These data indicate that consumers with disabilities seeking to
purchase smartphones via the Lifeline program have more device options with a greater variety
of accessibility features. Of concern, however, is that some users prefer non-smartphones for
their perceived durability. This preference would (a) limit their device options, as only 11% of
the devices in the sample were non-smartphones and (b) inhibit access to WEAs since only 44%
of non-smartphones in the sample were WEA-capable compared to 87% of smartphones.25" Our
initial comments provided input based on the analysis of the subsample of Lifeline-provided
mobile phones. In this filing, we were able to use our complete sample, which includes Tier 1
provided devices, Lifeline devices, and pre-paid carrier-provided devices. The detailed results
of which are reported in response to paragraphs four and five above, and reiterated here to clarify
that the accessibility gap between smartphones and non-smartphones is not relegated to just
Lifeline subscribers.
Smartphones outperformed non-smartphones in the percentage of accessibility features
present, pulling higher percentages for 26 of the 35 features examined. These data indicate that
consumers with disabilities seeking to purchase smartphones have more device options
with a greater variety of accessibility features. Of concern, however, is that some users
prefer non-smartphones for their perceived durability,26 and this preference could inhibit
access to WEA messages since only 41% of non-smartphones were WEA-capable
compared to 77% of smartphones.
24 FCC. (2020). Tentative findings for the 2020 biennial report to congress as required by the CVAA. Available at
https://www.fcc.gov/document/fcc-seeks-comment-tentative-findings-2020-cvaa-biennial-report 25 LaForce, S., Bright, D., Moon, N., Helena, M., Baker, P.M.A. (2020, April 14). Comments submitted in response
to the Public Notice in the Matter of The Accessibility of Communications Technologies for the 2020
Biennial Report Required by the Twenty-First Century Communications and Video Accessibility Act [CG
Docket No. 10-213, Consumer and Governmental Affairs Bureau]. Federal Communications Commission:
Washington, D.C. 26 Mitchell, H., LaForce, S., Moon, N., Baker, P.M.A., Garcia, A., & Jacobs, B. (2018, May 3). Comments
submitted in response to the Public Notice in the Matter of The Accessibility of Communications
Technologies for the 2018 Biennial Report Required by the Twenty-First Century Communications
and Video Accessibility Act [CG Docket No. 10-213, Consumer and Governmental Affairs Bureau].
Federal Communications Commission: Washington, D.C.
22
Response to ¶9 Apps and Software Upgrades
The Wireless RERC agrees with the tentative findings regarding system updates
negatively impacting the users' configuration of accessibility features on smartphones and apps.
During focus groups that explored accessibility, usability, social appropriateness, and cultural
acceptability issues of wireless technology-related use among individuals with disabilities, a
consistent issue raised was the problem of updates to the device operating systems (OS) and apps
that had subsequent effects on device accessibility. Users frequently noted that a previously
accessible app or feature could be "broken" following a routine operating system update. While
users developed a variety of strategies for dealing with this issue, ranging from reading and
memorizing all of the documentation to relying on online communities, ultimately, simple trial
and error was the main way of determining changes to accessibility following updates.27
At the same time, others' apprehension regarding system updates resulted in delaying (or
never) updating the phones and/or apps. The latter behavior could negatively impact the security
of the device as many OS and app updates incorporate greater levels of device security and bug
fixes. As such, efforts to ensure that systems updates are able to maintain user changes and not
reset the device to the default status would not only impact accessibility and usability, but also
(1) the security of the device for people with disabilities, and (2) the optimal operation of the
device or app, as it won't have the latest fixes and features.
RESPONSE TO SECTION II ACCESSIBILITY BARRIERS TO NEW COMMUNICATIONS
TECHNOLOGIES ¶15
The emergence and continued refinement of voice control, coupled with intelligent
agents, may represent the single greatest facilitator for accessibility and usability among many,
but not necessarily all, users with disabilities. Voice-based control, also known as voice
assistants, for both Apple iOS and Google Android-based smartphones, as well as "smart
speakers" such as Amazon Echo with Alexa, Apple HomePod with Siri, and Google Home with
Google Assistant, was the most commonly cited feature used by individuals with both vision-
related disabilities and dexterity-related disabilities. Users reported the use of smartphone
27 Moon, N., Baker, P. M. A., & Goughnour, K. (2018). Accessibility, Usability, and Social and Cultural
Acceptance of Next-Generation Wireless Devices [Research Brief]. Wireless RERC, 18(1). Available at
http://www.wirelessrerc.gatech.edu/sites/default/files/publications/wireless-rerc-research-brief-18-01-1.pdf

23
intelligent agents, including their ability to provide calendar and scheduling information, weather
updates, and location and navigation-based information for wayfinding, as essential features.28
However, the degree of control or customizability was a factor in voice control. For
devices such as the Philips Hue, Nest, and Ecobee, the smartphone app provided more options
for user settings. By contrast, voice control, which was deemed important for this group, did not
provide as many options. Another user noted that she appreciated being able to turn her Philips
Hue lights on and off through her Alexa-enabled control. However, she also reported that
features such as the ability to specify which, from among several, lightbulbs to turn on or off, or
dimming control, were not available to her through voice, and she could not utilize the app in the
smartphone. This case suggests a broader issue of user perception of the features and capabilities
of technologies. According to documentation from Philips, this capability exists for Amazon
Echo devices.29 Thus, voice input devices may be capable of more than users believe is the
case, suggesting the need for improved or more expanded help/guidance functions. Another
possibility might be the need for a list of capacities installed or available, or a built-in expanded
capacity of tips or "did you know" guidance. For example, "We noted that you are using Alexa to
control your lighting. Did you know that …"
SECTION III COMPLAINTS PURSUANT TO SECTIONS 717
Response to ¶A22, Number and Nature of Complaints Received
In our evaluations of technology access, baseline accessibility, and subsequent usability,
is consistently impacted by access to customer service and print and electronic materials
furnished by industry and policymakers alike. To improve access to programs and services, we
recommend that fundamental issues of disability culture awareness, familiarity with instructional
materials regarding device accessibility and usability, and accessible formats be addressed. For
example, the FCC's American Sign Language (ASL) Consumer Support Line was launched to
provide programmatic access to consumers who are Deaf and hard of hearing and whose primary
language is ASL. Before this, the Deaf and hard of hearing communities were only able to
communicate with the FCC via relay services or through an online complaint form. Now, these
consumers can use the video capabilities of their smartphones or in-home videophones, and a
28
Ibid. 29 See https://www.philips-hue.com/en-us/works-with/amazon-alexa

24
ten-digit number to connect to ASL Consumer Specialists to file formal complaints, as well as to
inquire about telecommunications relay service (TRS), closed captioning, access to emergency
information on television, and general telecommunication matters that could impact any
consumer. Additionally, to reach the population of people whose primary language is ASL, the
FCC's outreach and education are beginning to include ASL versions of materials otherwise
presented in text and/or audio. We applaud the FCC's efforts and encourage the proliferation of
ASL translated informational materials, and note that Wireless RERC research as well as
anecdotal evidence from Wireless RERC partners, supports the value of ASL translated material.
We would strongly encourage that other organizations follow the FCC's lead in this
respect, particularly at point of sale. Following the FCC's lead would help increase the
accessibility of the point of sale experience, as the retail side of service providers and
manufacturers (e.g., Apple Store) holds great power in setting the tone for the user's experience
with their devices. Still, Wireless RERC research suggests they are failing to take advantage of
these opportunities. While incredible progress has been made by industry with regard to having
customer call centers with people specifically trained in accessibility matters, the in-person
purchasing experience in some retail stores could be bolstered by better training of floor staff.
Understandably, there is a high turnover rate of sales associates in retail establishments, but
having (1) disability awareness/etiquette and accessibility features as a standard part of sales
associate training and (2) a stable method for customers with disabilities to obtain in-person
support during point of sale could help to improve the end-user experience dramatically. For
example, making video remote interpreting services available to retailers would address
individuals whose first language is ASL in communicating their device needs and wants at POS.
We anticipate that some of the changes in work modes, such as remote work and video
conferences, as a consequence of the COVID-19 pandemic, will diffuse to these retail settings.
CONCLUSION AND RECOMMENDATIONS
We commend the FCC's efforts to measure the impact of provisions of the Twenty-First
Century Communications and Video Accessibility Act of 2010 (CVAA) on gaps and gains in
accessibility and to ensure that future technologies have innovations in accessibility and
usability. The Wireless RERC is encouraged by the industry's growth in the accessibility of
advanced communications technologies, as evidenced by the increasing presence and richness of
new accessibility features on mobile devices, which can also result in greater usability of these

25
devices. The data indicate that consumers with disabilities seeking to purchase smartphones have
more device options with a greater variety of accessibility features. Particularly, accessibility for
people who use the voice output features and the alternative login as there was a significant
increase in the presence of TTS, full access screen readers, and biometric login. In addition, a
number of accessibility characteristics of inclusively designed phones and devices might actually
increase the usability of these devices, which can amplify the outcome of technical accessibility.
While a given device might meet accessibility requirements, the particular implementation of a
feature might, contrarily, reduce the usability of a given device increasing the likelihood of
abandonment. Based on the data presented in these comments, the Wireless RERC offers the
following recommendations:
As new features are developed, mobile phone manufacturers are encouraged to continue
to incorporate users with disabilities into all stages of the design process so that
accessibility, and consequential usability, is intentional within digital designs instead of a
fortuitous byproduct of innovative technology.
Increasing the percentage of phones with excellent M and T ratings (M4/T4) would better
ensure a quality experience with voice calls for people who use hearing aids and cochlear
implants.
Given the rate of people with disabilities reporting more than one disability, and the
disparity between the availability of accessibility features based on disability type,
increasing the percentage of more universally accessible devices would be good for
manufacturers and end-users alike.
Increasing the percentage of non-smartphones that are WEA-capable would better ensure
access to emergency alerts for users with disabilities that prefer non-smartphones.
For continuity of the accessibility experience through app and OS updates, more
development efforts would allow a way to ensure that systems updates are more
transparent for the end-user by not resetting to the default status. If this could be
overcome, it would not only impact accessibility, but also (1) the security of the device
for people with disabilities, and (b) the optimal operation of the device or app, as it would
have the latest fixes and features.
Voice input devices such as digital assistants and smart speakers, may be more capable
than users believe is the case, suggesting the need for more informed or more expanded
help/guidance functions. This speaks to the need for the design process to expand beyond
26
minimal accessibility features to incorporate outcome-based design, such as increased
usability.
To address barriers experienced by customers with disabilities during point of sale
transactions, we recommend (1) disability awareness/etiquette and information about
accessibility features should be a standard part of sales associate training, and (2)
providing a stable method for customers with disabilities to obtain in-store support (e.g.,
video remote interpreting service.
In closing, we are confident that the continued commitment of the FCC and all the
stakeholders will allow the promise of the CVAA to truly make technology evolution and
innovation inclusive of all Americans.
Respectfully submitted,
Salimah LaForce, M.S.
Dara Bright, M.S.
Helena Mitchell, Ph.D.,
Nathan Moon, Ph.D.,
Paul M.A. Baker, Ph.D.,
Eli Jimenez, Ph.D. and
Claire Donehower, Ph.D.
Wireless RERC / Center for Advanced Communications Policy
Georgia Institute of Technology
500 10th Street, 3rd Fl. NW
Atlanta, GA 30332-0620
Phone: (404) 385-4640
Dated this 4th day of August 2020