re engineering u.s. health care with healthcare … · re‐engineering u.s. health care with...
TRANSCRIPT

ReRe‐‐engineering U.S. Health engineering U.S. Health Care with Healthcare Care with Healthcare
Information Technology Information Technology ––Promises and PerilPromises and Peril
Blackford Middleton, MD, MPH, MScCorporate Director, Clinical Informatics Research & Development
Chairman, Center for Information Technology LeadershipPartners Healthcare SystemHarvard Medical School
‘09

Systems In HealthcareSystems In Healthcare
A Simple Clinical Encounter in the US Healthcare Delivery SystemThree Dilemmas: Patient, Provider, PurchaserInformation Technology SystemsThe Promise and the PerilDiscussion, Q&A

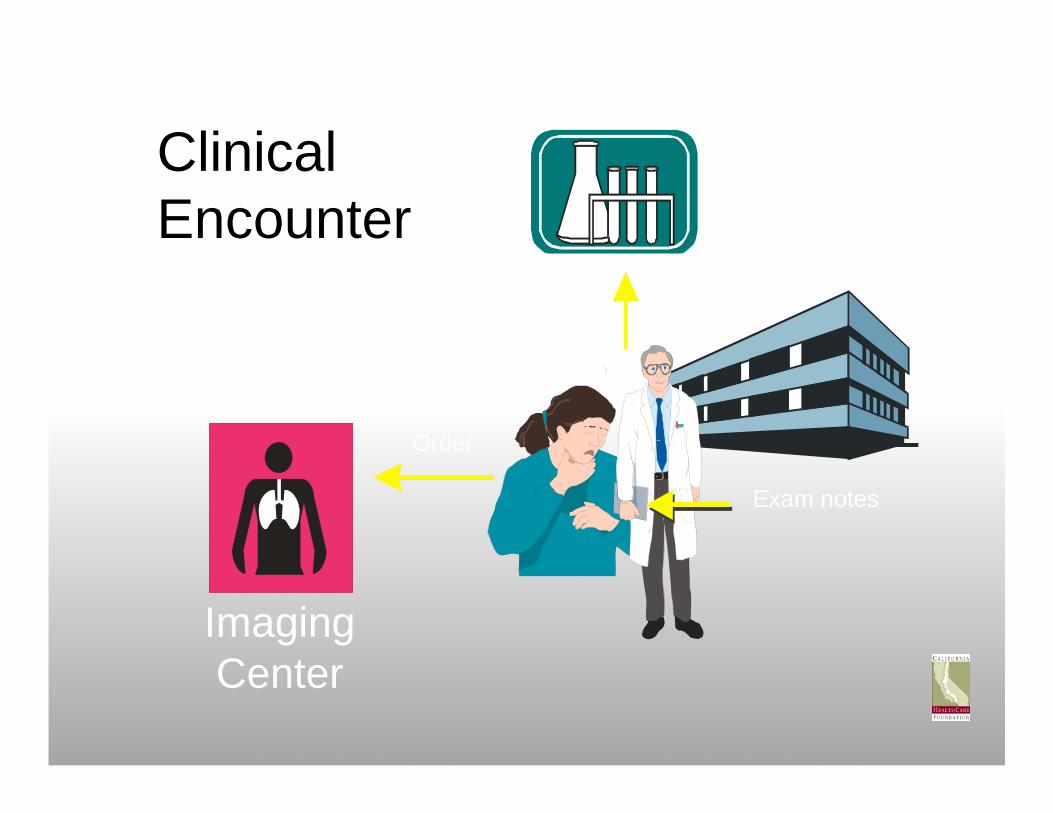
ClinicalEncounter
Lab
ImagingCenter
Order
Order
Exam notes
MedicalGroup
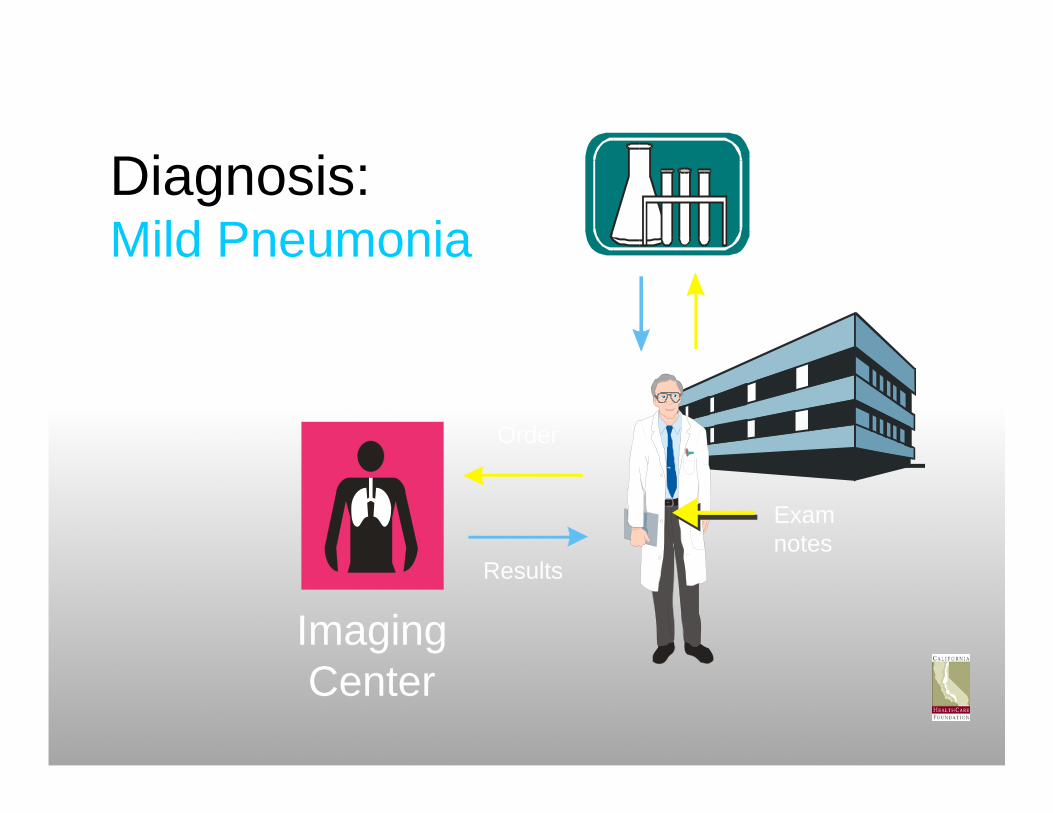
Diagnosis:Mild Pneumonia
Lab
ImagingCenter
Order
Order
Exam notes
Results
Results
MedicalGroup

ImagingCenter
Lab
PharmacyOrder
Order
Order
Results
Results
Treatment:Amoxycillin,fluids & rest
“Pick-upscript”
Exam Notes

ClaimsandBillings
Lab
ImagingCenter
Order
ResultsEncounterReport
Aggregatedbilling
Aggregatedbilling
Results
Pick-upscript
Order
Order
Claim
Pharmacy
Primary CareGroup Administrator
Third PartyAdministrator
or PBM
Aggregated claims
Lab
ImagingCenter
Order
ResultsEncounter
ReportA
ggre
gat e
d bi
ll ing
Aggregatedbilling
Results
Pick-upscript
Order
Order
Claim
Pharmacy
Primary CareGroup Administrator
Third PartyAdministrator
or PBM
Aggregated claims
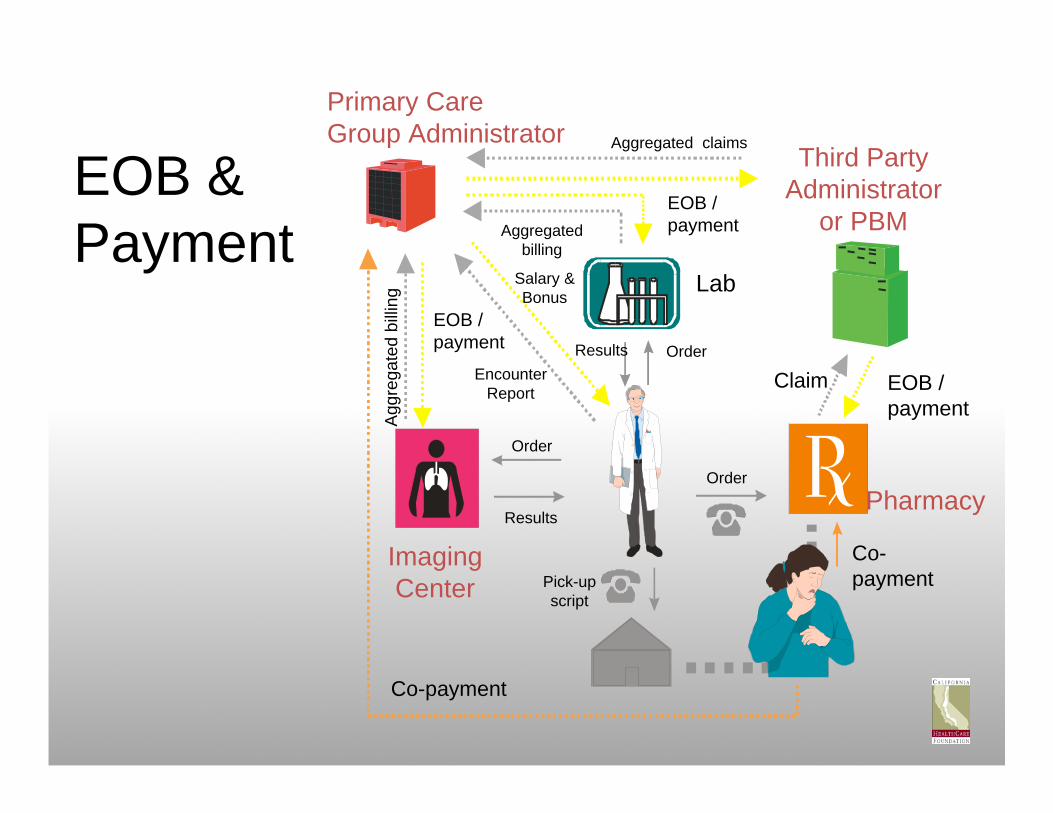
EOB & Payment
EOB /payment
Co-payment
Salary &Bonus
EOB /payment
EOB /payment
Co-payment
Lab
ImagingCenter
Order
ResultsA
ggre
gat e
d bi
ll ing
Aggregatedbilling
Results
Pick-upscript
Order
Order
Claim
Pharmacy
Primary CareGroup Administrator Third Party
Administratoror PBM
EOB /payment
Co-payment
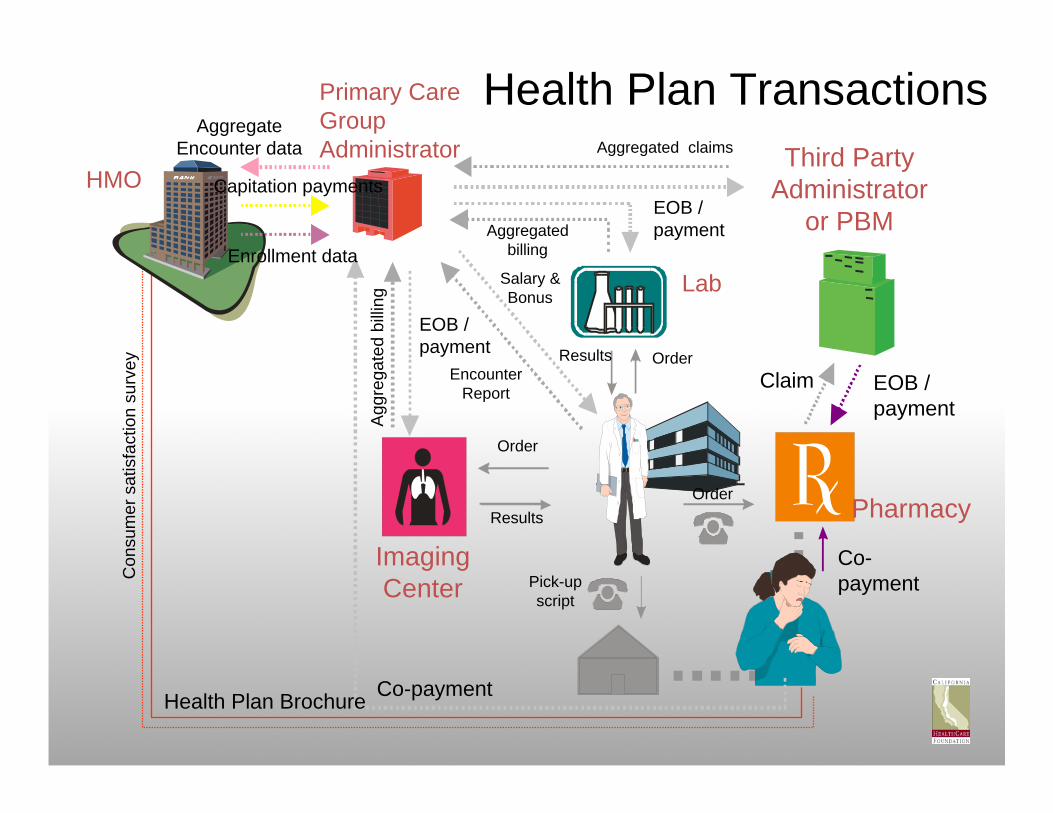
Health Plan Transactions
HMO
Con
sum
e r s
atis
fact
ion
surv
ey
Health Plan Brochure
Enrollment data
Capitation payments
AggregateEncounter data
Salary &Bonus
EncounterReport
Aggregated claims
EOB /payment
EOB /payment
Co-payment

Lab
ImagingCenter
Order
Results
Agg
rega
t ed
bill in
g
Aggregatedbilling
Results
Pick-upscript
OrderClaim
Pharmacy
Third PartyAdministrator
or PBM
EOB /payment
Co-payment
Oversight & Quality
HMO
Con
sum
e r s
atis
fact
ion
surv
ey
Health Plan Brochure
Enrollment data
Capitation payments
AggregateEncounter data
JCAHO
EncounterReport
Salary &Bonus
DOC
State InsuranceBoard
NCQA
Primary CareGroup Administrator Aggregated claims
EOB /payment
EOB /payment
Co-payment

Lab
ImagingCenter
Order
ResultsA
ggre
gat e
d bi
ll ing
Aggregatedbilling
Results
Pick-upscript
OrderClaim
Pharmacy
Third PartyAdministrator
or PBM
EOB /payment
Co-payment
Administrative Databases
HMO
Con
sum
e r s
atis
fact
ion
surv
ey
Enrollment data
Capitation payments
AggregateEncounter data
PharmacyWholesaler
Salary &Bonus
EncounterReport
Health Plan Brochure
JCAHO
DOC
State InsuranceBoard
NCQA
Primary CareGroup Administrator
Aggregated claims
EOB /payment
EOB /payment
Co-payment
ImagingCenter
Order
Aggr
egat
ed b
illin
g
Aggregatedbilling
Results
Pick-upscript
Claim
Pharmacy
Third PartyAdministrator
or PBM
EOB /payment
Co-payment
HMOC
onsu
me r
sat
isf a
ctio
n su
rvey
Enrollment data
Capitation payments
Employer
PharmacyWholesaler
EncounterReport
Salary &Bonus Lab
Health Plan Brochure
JCAHO
DOC
State InsuranceBoard
NCQA
Primary Care Group Administrator Aggregated claims
EOB /payment
AggregateEncounter data
Public Insurance & Health Care
Prig.
Other PublicAgencies.e.g. INS,
Soc. Svcs
DrugCo.s
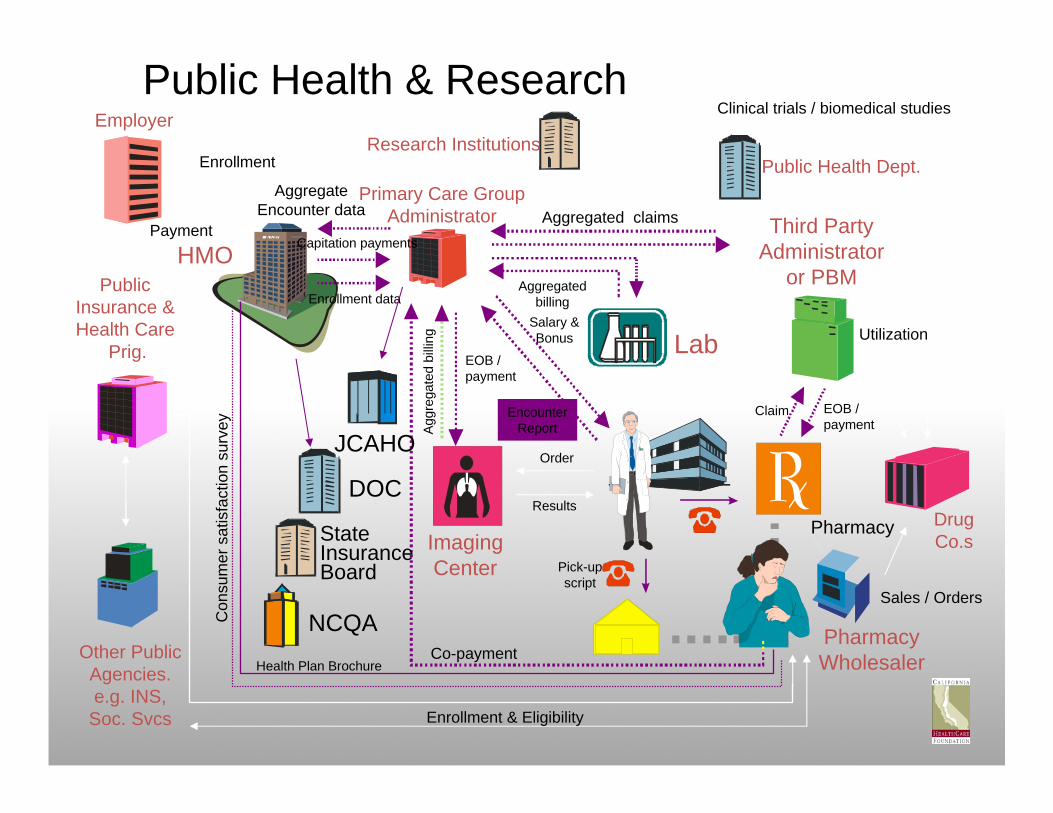
Public Health Dept.Research Institutions
Clinical trials / biomedical studies
Enrollment
Payment
Enrollment & Eligibility
Sales / Orders
Utilization
Public Health & Research
ImagingCenter
OrderAg
greg
ated
bill
ing
Aggregatedbilling
Results
Pick-upscript
Claim
Pharmacy
Third PartyAdministrator
or PBM
EOB /payment
Co-payment
HMOC
onsu
me r
sat
isf a
ctio
n su
rvey
Enrollment data
Capitation payments
Employer
PharmacyWholesaler
EncounterReport
Salary &Bonus Lab
Health Plan Brochure
JCAHO
DOC
State InsuranceBoard
NCQA
Primary Care Group Administrator Aggregated claims
EOB /payment
AggregateEncounter data
Public Insurance & Health Care
Prog.
Other PublicAgencies.e.g. INS,
Soc. Svcs
DrugCo.s
Public Health Dept.Research Institutions
Clinical trials / biomedical studies
Enrollment
Payment
Enrollment & Eligibility
Sales / Orders
Utilization
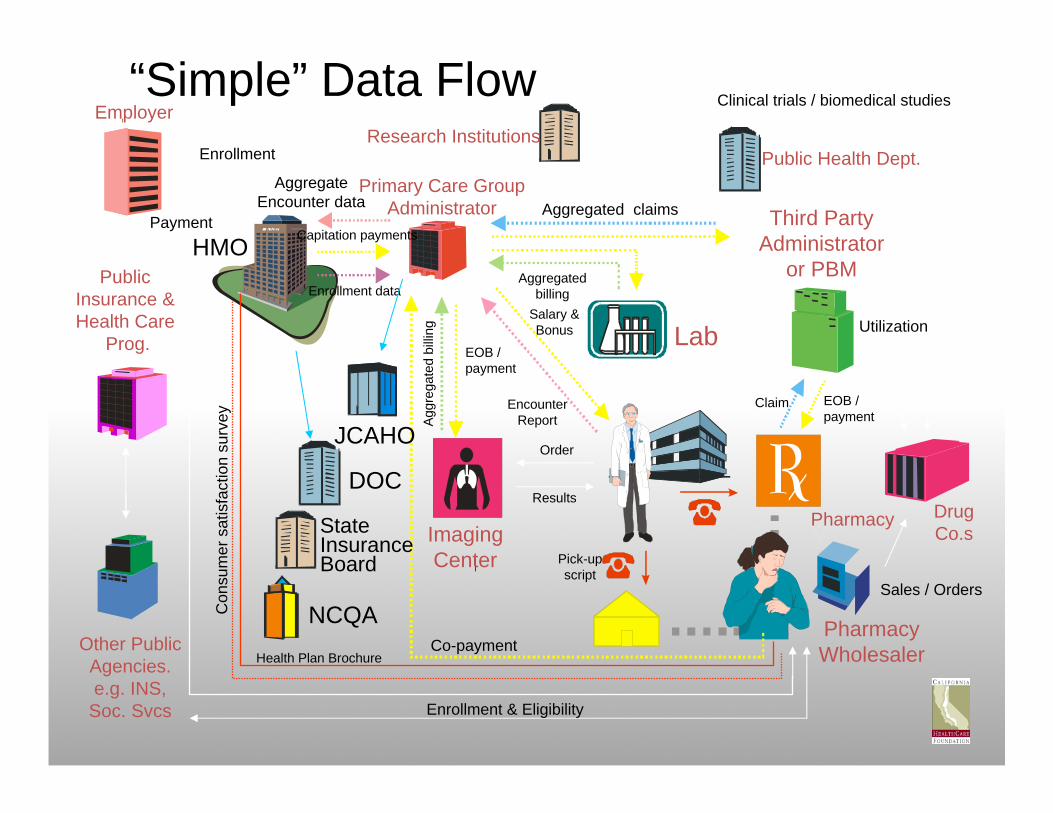
“Simple” Data Flow
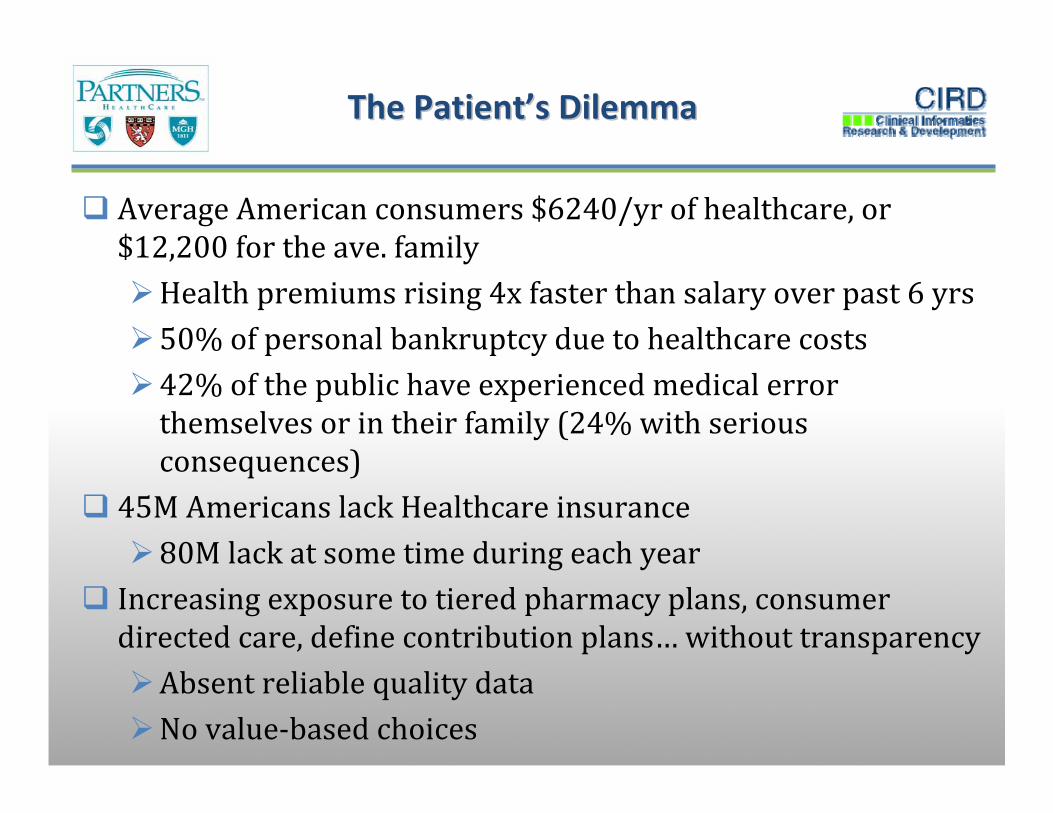
The PatientThe Patient’’s Dilemmas Dilemma
Average American consumers $6240/yr of healthcare, or $12,200 for the ave. family
Health premiums rising 4x faster than salary over past 6 yrs50% of personal bankruptcy due to healthcare costs42% of the public have experienced medical error themselves or in their family (24% with serious consequences)
45M Americans lack Healthcare insurance80M lack at some time during each year
Increasing exposure to tiered pharmacy plans, consumer directed care, define contribution plans… without transparency
Absent reliable quality dataNo value‐based choices

Americans Spend More OutAmericans Spend More Out‐‐ofof‐‐Pocket Pocket on Health Care Expenses, 2004on Health Care Expenses, 2004
$0
$1,000
$2,000
$3,000
$4,000
$5,000
$6,000
$7,000
$0 $100 $200 $300 $400 $500 $600 $700 $800 $900
a2003b2003 Total Health Care Spending, 2002 OOP Spending
ba
United States
OECD Median
New Zealand
Netherlands
Japan
GermanyFrance Canada Australia
a
Source: The Commonwealth Fund, calculated from OECD Health Data 2006.
Total health care spending per capita
Out-of-pocket spending per capita
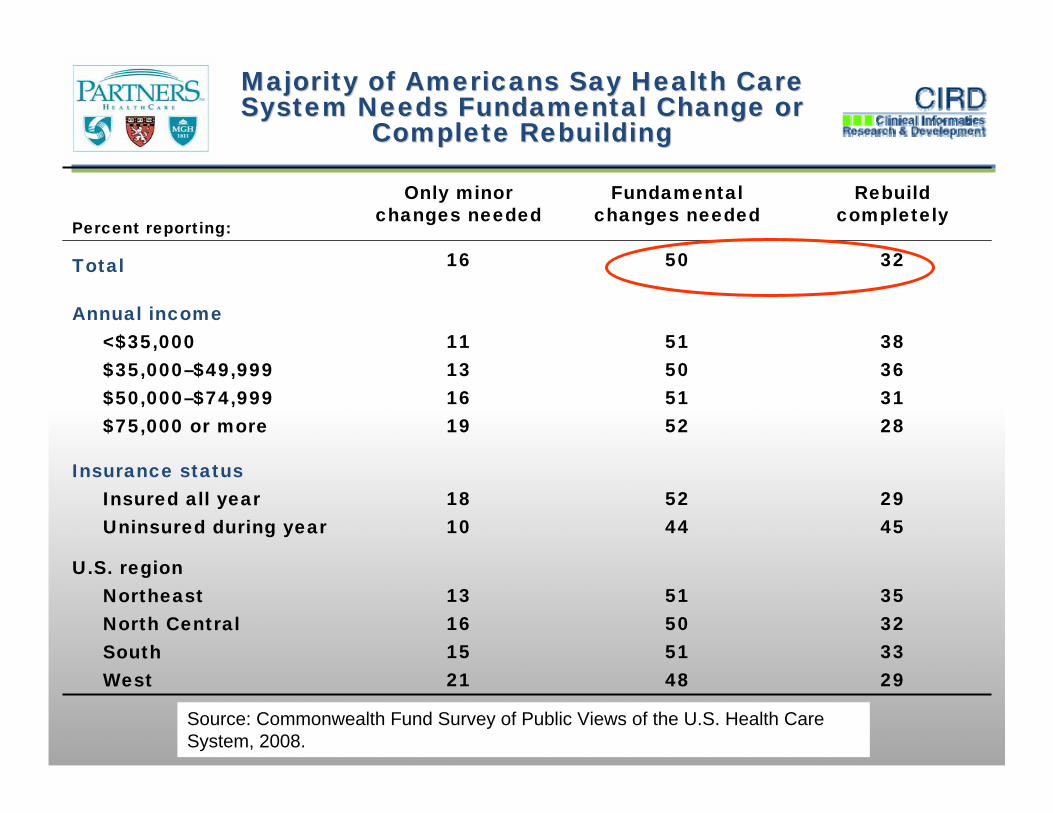
Percent reporting:
Only minorchanges needed
Fundamentalchanges needed
Rebuild completely
Total 16 50 32
Annual income<$35,000 11 51 38$35,000–$49,999 13 50 36$50,000–$74,999 16 51 31$75,000 or more 19 52 28
Insurance statusInsured all year 18 52 29Uninsured during year 10 44 45
U.S. regionNortheast 13 51 35North Central 16 50 32South 15 51 33West 21 48 29
Source: Commonwealth Fund Survey of Public Views of the U.S. Health Care System, 2008.
Majority of Americans Say Health Care Majority of Americans Say Health Care System Needs Fundamental Change or System Needs Fundamental Change or
Complete RebuildingComplete Rebuilding
The ProviderThe Provider’’s Dilemmas Dilemma
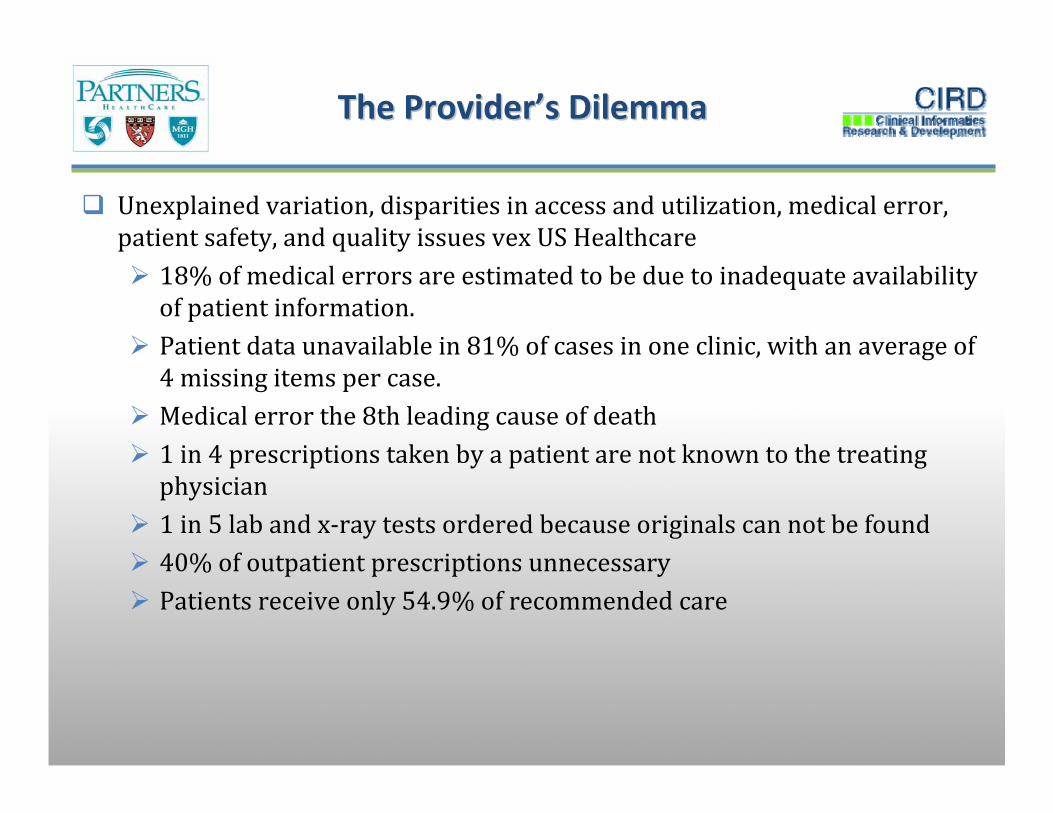
Unexplained variation, disparities in access and utilization, medical error, patient safety, and quality issues vex US Healthcare
18% of medical errors are estimated to be due to inadequate availability of patient information.Patient data unavailable in 81% of cases in one clinic, with an average of 4 missing items per case. Medical error the 8th leading cause of death1 in 4 prescriptions taken by a patient are not known to the treating physician1 in 5 lab and x‐ray tests ordered because originals can not be found40% of outpatient prescriptions unnecessary Patients receive only 54.9% of recommended care
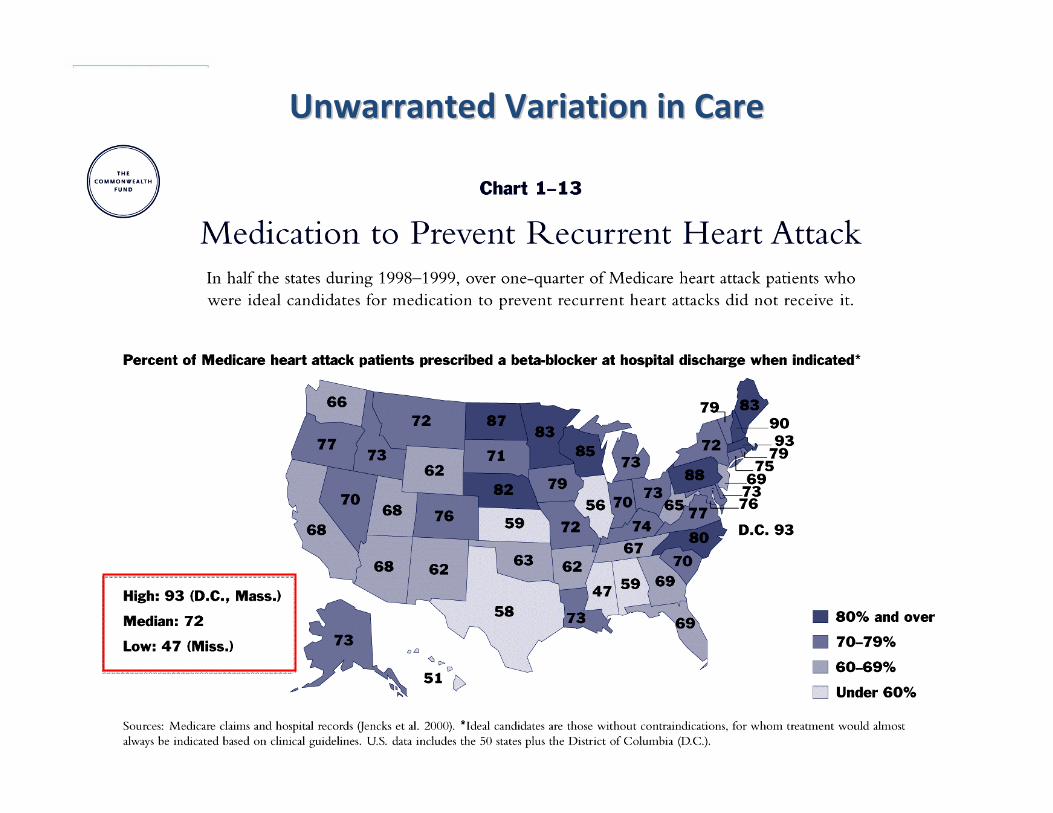
Unwarranted Variation in CareUnwarranted Variation in Care
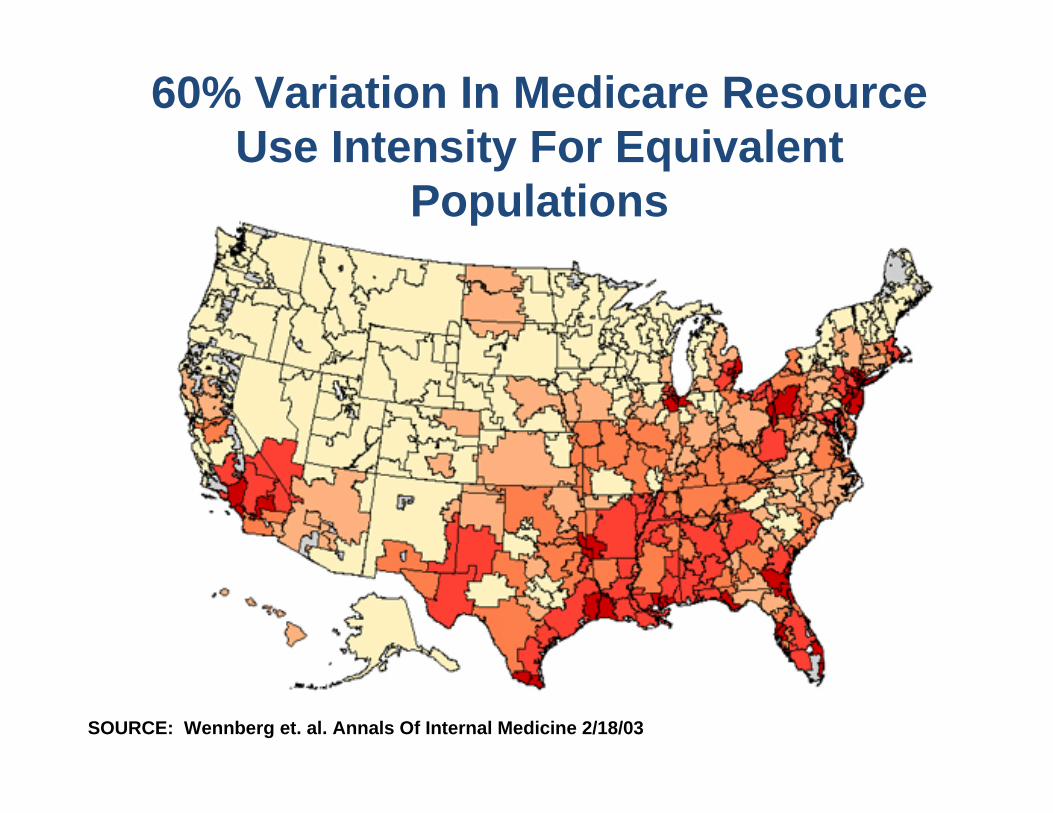
60% Variation In Medicare Resource Use Intensity For Equivalent
Populations
SOURCE: Wennberg et. al. Annals Of Internal Medicine 2/18/03

Little Impact Of Spending On QualityLittle Impact Of Spending On Quality
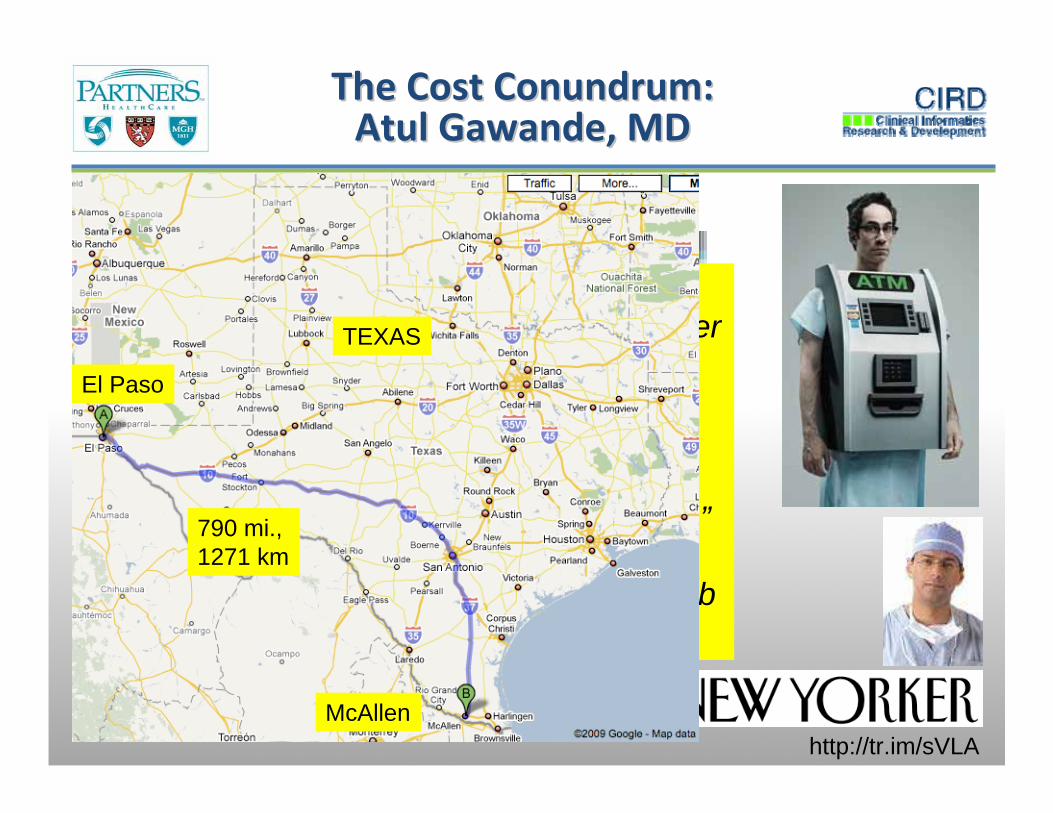
The Cost Conundrum: The Cost Conundrum: Atul Gawande, MDAtul Gawande, MD
http://tr.im/sVLA
“…driven primarily by local norms that tend towards heavier use of discretionary services –such as diagnostic testing and surgical versus less invasive interventions – for which there are no clear clinical guidelines.”Peter Orszag, OMB Bloghttp://www.whitehouse.gov/omb/blog/
El Paso
McAllen
TEXAS
790 mi., 1271 km

Physician Information NeedsPhysician Information Needs
Medical literature doubling every 19 yearsDoubles every 22 months for AIDS care
2 Million facts needed to practiceCovell study of LA Internists:2 unanswered clinical questions for every 3 pts• 40% were described as questions of fact, • 44% were questions of medical opinion, • 16% were questions of non‐medical information.
Covell DG, Uman GC, Manning PR. Ann Intern Med. 1985 Oct;103(4):596-9
Measuring Information Needs Measuring Information Needs
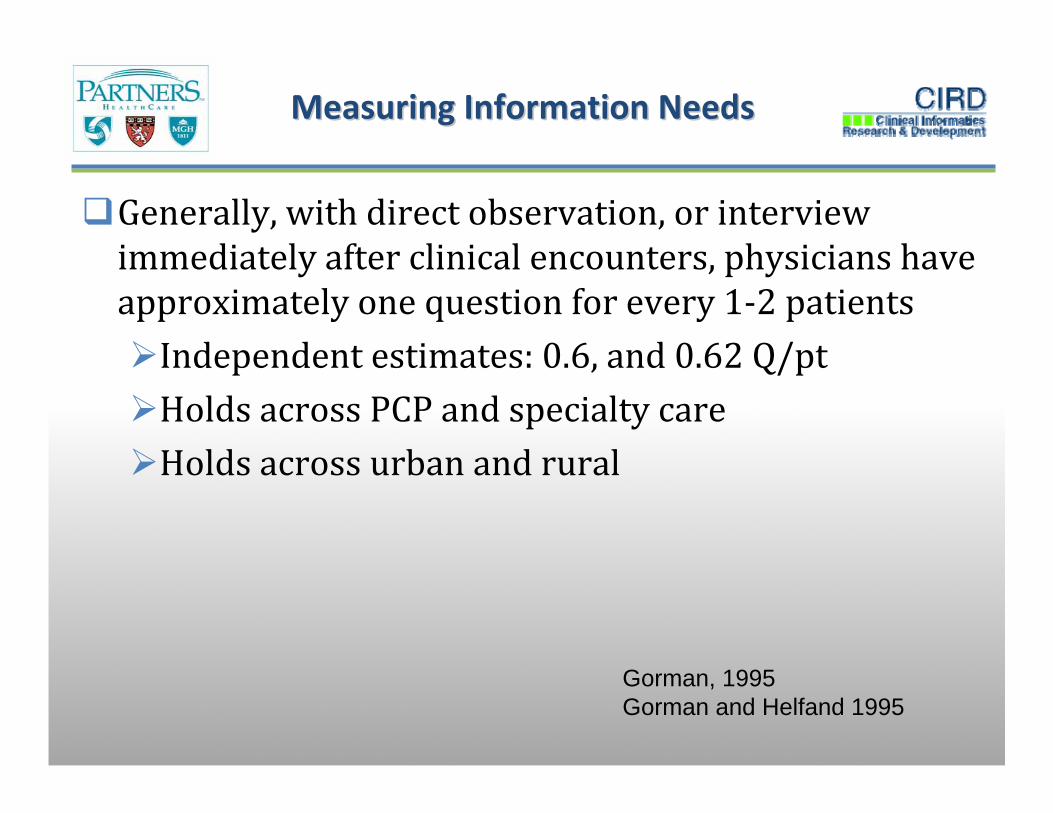
Generally, with direct observation, or interview immediately after clinical encounters, physicians have approximately one question for every 1‐2 patients Independent estimates: 0.6, and 0.62 Q/ptHolds across PCP and specialty careHolds across urban and rural
Gorman, 1995Gorman and Helfand 1995

Publication
Bibliographic databases
Submission
Reviews, guidelines, textbook
Negative results
variable
0.3 year
6. 0 13.0 years50%
46%
18%
35%
0.6 year
0.5 year
9.3 years
Dickersin, 1987
Koren, 1989
Balas, 1995
Poynard, 1985
Kumar, 1992
Kumar, 1992
Poyer, 1982
Antman, 1992
Negative results
Lack of numbers
ExpertExpertopinionopinion
Inconsistentindexing
17:14
Original research
Acceptance
Patient Care
Converting evidence to careConverting evidence to care
17 years to apply 14% of research knowledge
to patient care!
17 years to apply 14% of research knowledge
to patient care!
Balas Yearbook Medical Informatics 2000gtre4, courtesy M Overhage
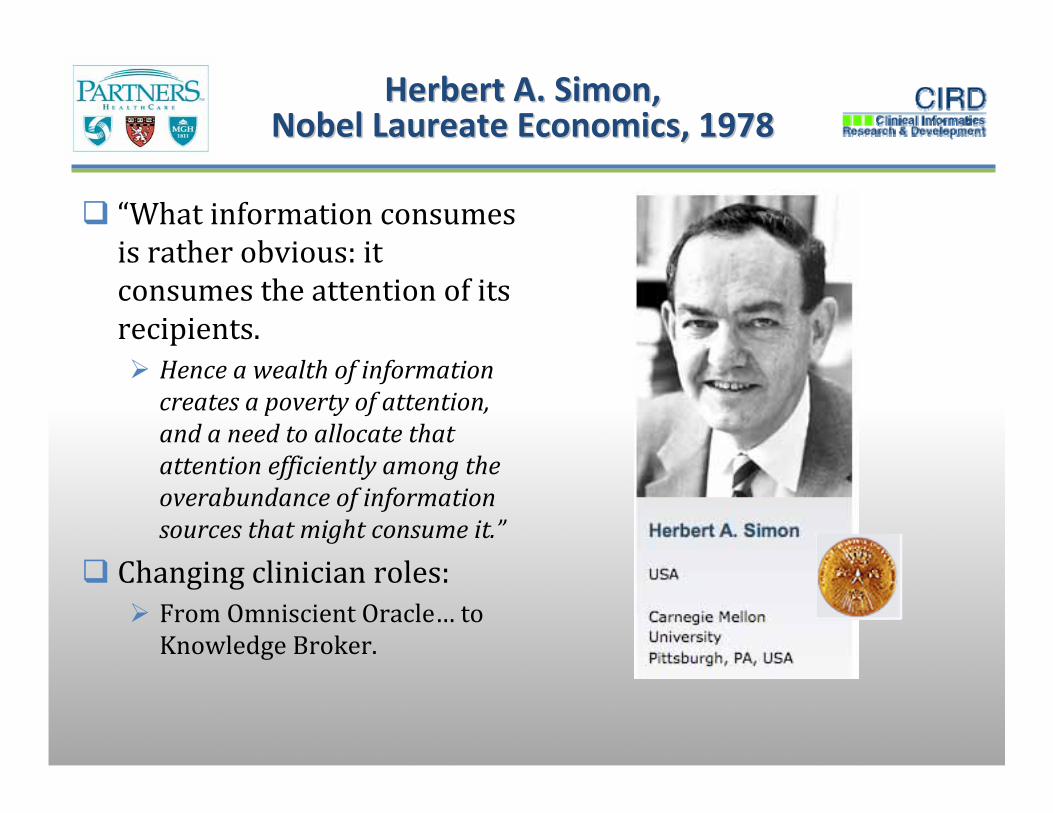
Herbert A. Simon, Herbert A. Simon, Nobel Laureate Economics, 1978Nobel Laureate Economics, 1978
“What information consumes is rather obvious: it consumes the attention of its recipients.
Hence a wealth of information creates a poverty of attention, and a need to allocate that attention efficiently among the overabundance of information sources that might consume it.”
Changing clinician roles:From Omniscient Oracle… to Knowledge Broker.

Flexner ReportFlexner Report
Abraham Flexner, Medical Education in the United States and Canada.
Boston: Merrymount Press, 1910
"...The curse of medical education is the excessive number of schools. The situation can improve only as weaker and superfluous schools are extinguished."“Society reaps at this moment but a small fraction of the advantage which current knowledge has the power to confer.”
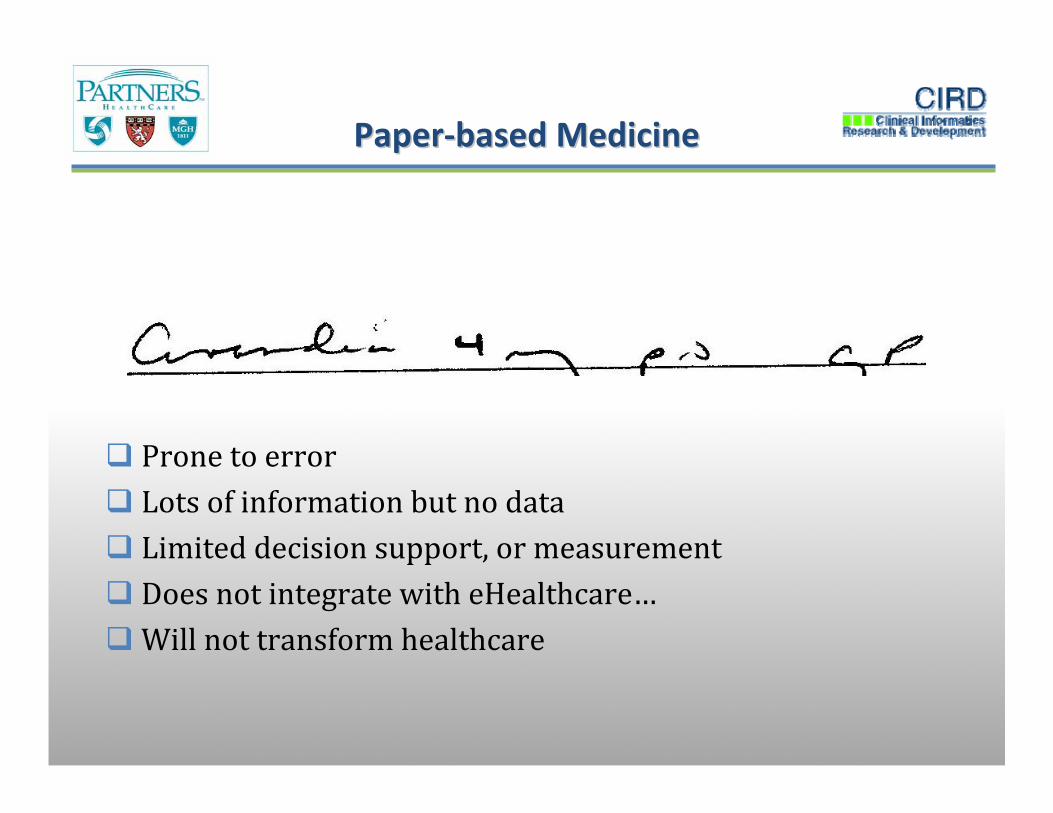
PaperPaper‐‐based Medicinebased Medicine
Prone to errorLots of information but no dataLimited decision support, or measurementDoes not integrate with eHealthcare…Will not transform healthcare

The PurchaserThe Purchaser’’s Dilemmas Dilemma
US healthcare is $1.7T, 16% GDP • 5% in 1963; Industrialized societies average less than 10%
• Costs rising 7‐9%/yr, expected to double in 10yr• 25% of premium is for administrative overhead (limited value)
Public expenditure on healthcare now 43% of total (up 10% in past decade)GM healthcare costs now $1500/automobile, most expensive componentWhere will additional value be found in, or costs taken out of, the system?

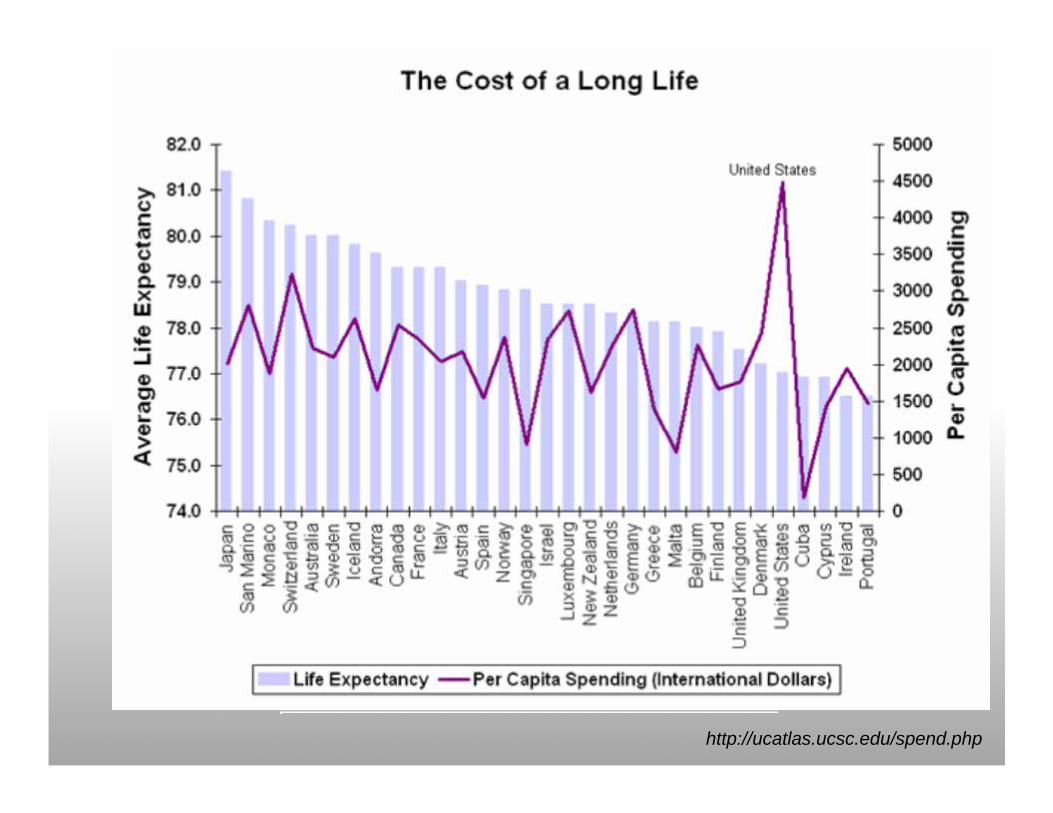
http://ucatlas.ucsc.edu/spend.php

Schroeder S. N Engl J Med 2007;357:1221-1228
Determinants of Health and Their Determinants of Health and Their Contribution to Premature DeathContribution to Premature Death
• Purchasers are paying into a disease system rather than a wellness system
• 4% of health care dollar is spent on prevention and public health

Health Care Costs Concentrated Health Care Costs Concentrated in Sick Fewin Sick Few
Source: A.C. Monheit, “Persistence in Health Expenditures in the Short Run: Prevalence and Consequences,” Medical Care 41, supplement 7 (2003): III53–III64.
Distribution of Health Expenditures for the U.S. Population, By Magnitude of Expenditure, 1997
1%5%
10%
55%
69%
27%
50%
97%
$27,914
$7,995
$4,115
$351
Expenditure Threshold (1997
Dollars)
www.cmwf.org

"By computerizing health "By computerizing health records, we can avoid records, we can avoid dangerous medical mistakes, dangerous medical mistakes, reduce costs, and improve reduce costs, and improve care."care."
President George W. BushState of the Union Address
January 20, 2004
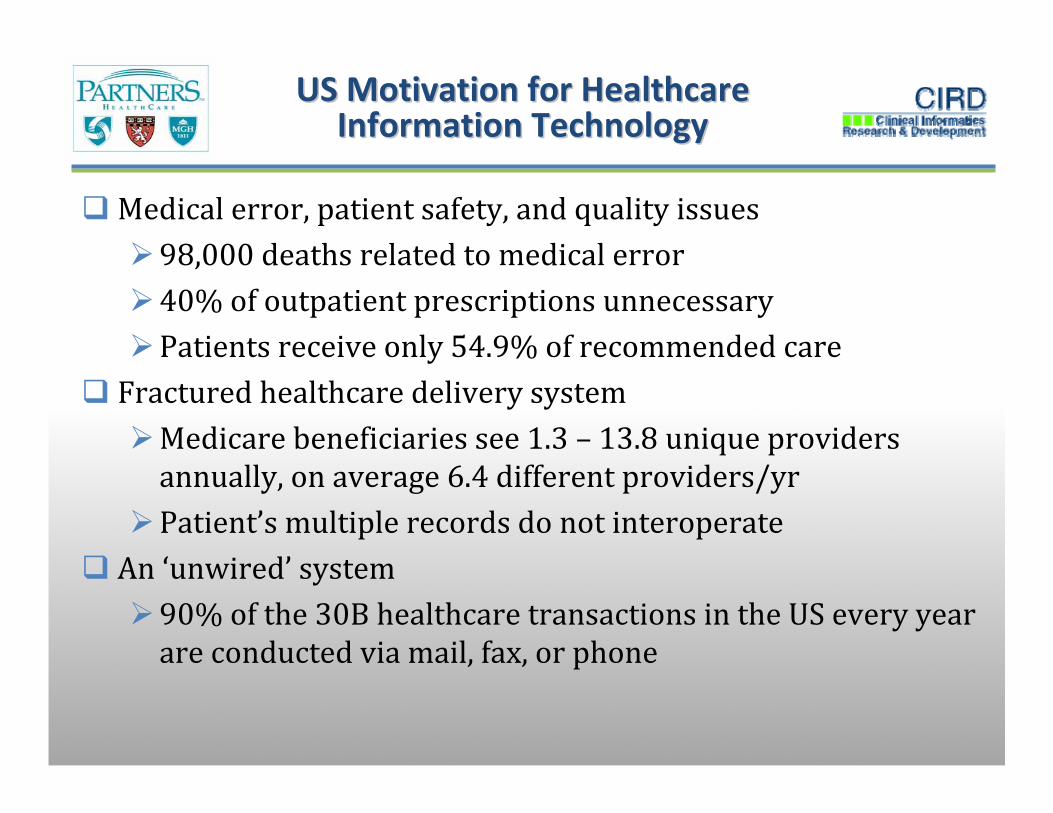
US Motivation for Healthcare US Motivation for Healthcare Information TechnologyInformation Technology
Medical error, patient safety, and quality issues98,000 deaths related to medical error40% of outpatient prescriptions unnecessary Patients receive only 54.9% of recommended care
Fractured healthcare delivery systemMedicare beneficiaries see 1.3 – 13.8 unique providers annually, on average 6.4 different providers/yrPatient’s multiple records do not interoperate
An ‘unwired’ system90% of the 30B healthcare transactions in the US every year are conducted via mail, fax, or phone

VAVA’’s Success with Healthcare s Success with Healthcare Information TechnologyInformation Technology
Data Source: Thomson TG, Brailer DJ. The Decade of Health Information Technology: Delivering Consumer-centric and Information-rich Health Care. Washington, DC: US Department of Health and Human Services; 2004.

The evidence for and against HITThe evidence for and against HIT
55‐83% decrease in hospital non‐intercepted serious ADEs using CPOE73% of outpatient drug interaction alerts led to change in prescriptions22‐78% increased adherence to preventive health remindersFewer medical errors through computerized physician order entry and clinical decision support systemsSavings of approximately $5000 using CPOE in hospitalReduced length of stay in critical care, and overall LOS with CPOE15% overall reduced hospital fatality with HITCDS in hospitals resulted in 16% fewer complications, and $538 less expense
Bates, JAMA 1998Gandhi, JGIM 2001
Kaushal R, et al. Arch Intern Med. 2003 Amarasingham R Arch Int Med 2009

CPOE: Unintended ConsequencesCPOE: Unintended Consequences
5 mature CPOE sites surveyed, 2004‐5Frequency (%)
work for clinicians 19.8unfavorable workflow issues 17.6never ending system demands 14.8problems related to paper persistence 10.8untoward changes in communication patterns 10.1and practices
negative emotions 7.7generation of new kinds of errors 7.1unexpected changes in the power structure 6.8overdependence on the technology 5.2
Campbell EM, Sittig DS et al., JAMIA 2006
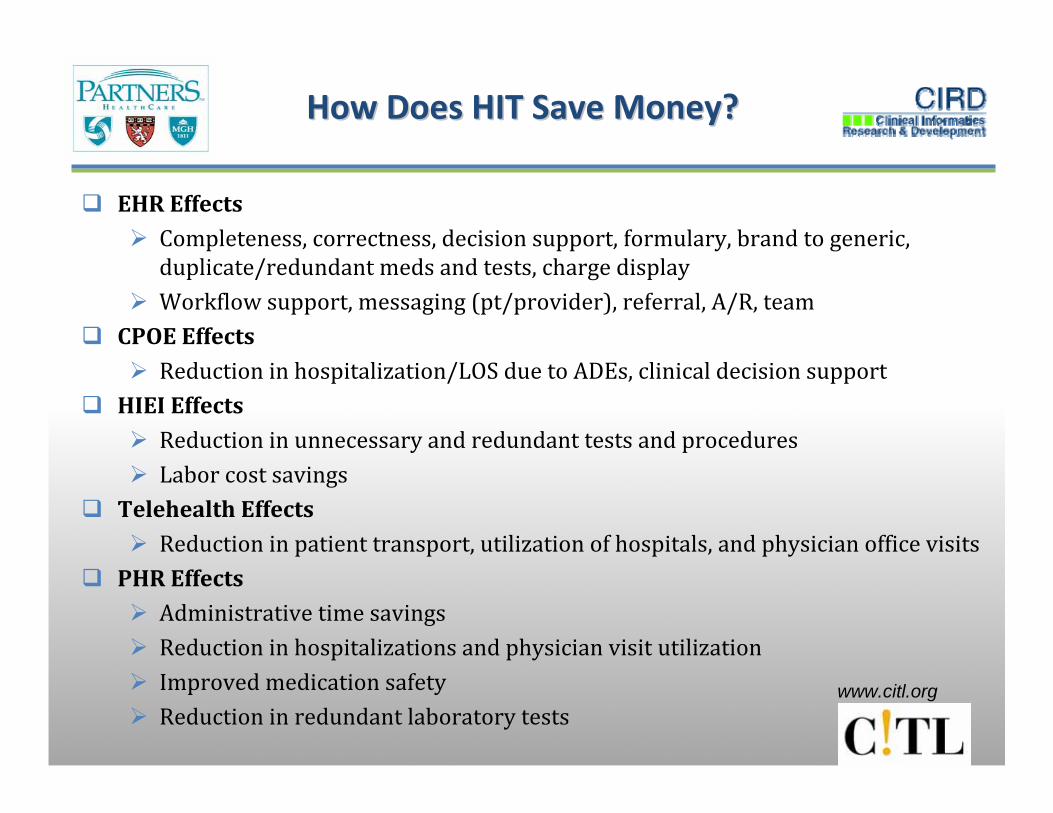
How Does HIT Save Money? How Does HIT Save Money?
EHR EffectsCompleteness, correctness, decision support, formulary, brand to generic, duplicate/redundant meds and tests, charge displayWorkflow support, messaging (pt/provider), referral, A/R, team
CPOE EffectsReduction in hospitalization/LOS due to ADEs, clinical decision support
HIEI EffectsReduction in unnecessary and redundant tests and proceduresLabor cost savings
Telehealth EffectsReduction in patient transport, utilization of hospitals, and physician office visits
PHR EffectsAdministrative time savingsReduction in hospitalizations and physician visit utilizationImproved medication safetyReduction in redundant laboratory tests
www.citl.org

CITL HIT Value AssessmentsCITL HIT Value Assessments
Net US could save $150B with HIT adoption, or approximately 7.5% or US Healthcare Expenditure
The Value of Ambulatory Computerized Order Entry (ACPOE)• $44B US nationally; $29K per provider, per year
The Value of HealthCare Information Exchange and Interoperability (HIEI)• $78B/yr
The Value of IT‐enabled Chronic Diabetes Management (ITDM)• $8.3B Disease Registries; Advanced EHR $17B
The Value of Physician‐Physician Tele‐healthcare• >$20B*
The Value of Personal Health Records– Approx. $20B
www.citl.org
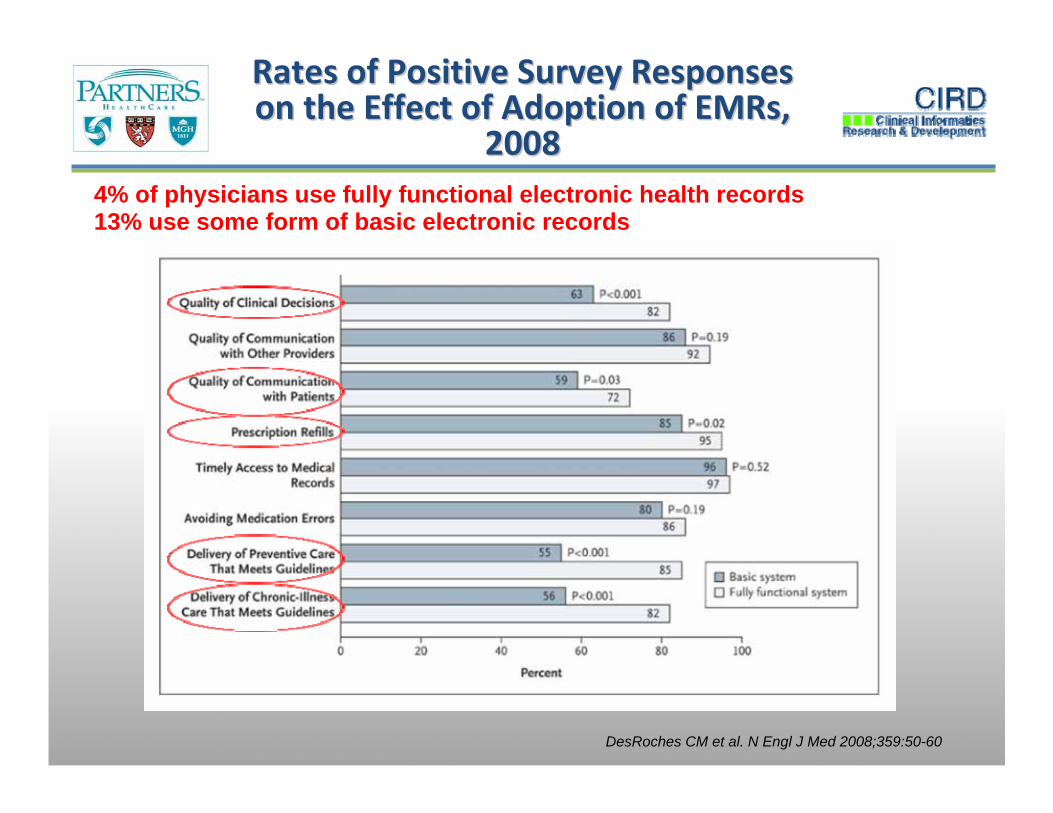
DesRoches CM et al. N Engl J Med 2008;359:50-60
Rates of Positive Survey Responses Rates of Positive Survey Responses on the Effect of Adoption of EMRs, on the Effect of Adoption of EMRs,
200820084% of physicians use fully functional electronic health records13% use some form of basic electronic records

CAD/DM Smart FormCAD/DM Smart Form
Smart View: Data DisplaySmart View: Data Display
Smart Assessment, Orders, and Plan
Smart Assessment, Orders, and Plan
Assessment and recommendations generated from rules engine
Assessment and recommendations generated from rules engine
Smart DocumentationSmart Documentation
• Lipids• Anti‐platelet therapy• Blood pressure• Glucose control• Microalbuminuria• Immunizations• Smoking • Weight• Eye and foot examinations
• Lipids• Anti‐platelet therapy• Blood pressure• Glucose control• Microalbuminuria• Immunizations• Smoking • Weight• Eye and foot examinations

CAD/DM Smart FormCAD/DM Smart Form
Medication OrdersMedication Orders
Lab OrdersLab Orders
ReferralsReferrals
Handouts/EducationHandouts/Education

CAD Quality DashboardCAD Quality Dashboard
Targets are 90th percentile for HEDIS or for Partners providersTargets are 90th percentile for HEDIS or for Partners providers
Zero defect care: • Aspirin• Beta‐blockers• Blood pressure• Lipids
Zero defect care: • Aspirin• Beta‐blockers• Blood pressure• Lipids
Red, yellow, and green indicators show adherence with targetsRed, yellow, and green indicators show adherence with targets


Discrepancy
Details
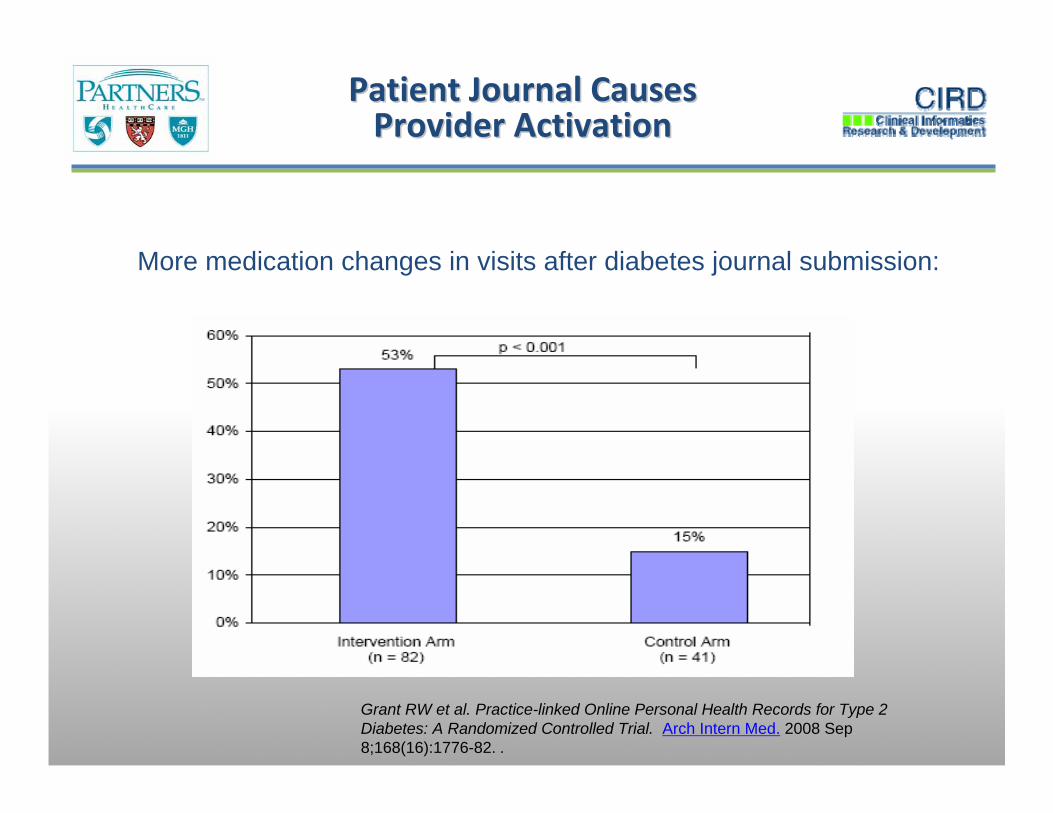
Patient Journal CausesPatient Journal CausesProvider Activation Provider Activation
Grant RW et al. Practice-linked Online Personal Health Records for Type 2 Diabetes: A Randomized Controlled Trial. Arch Intern Med. 2008 Sep 8;168(16):1776-82. .
More medication changes in visits after diabetes journal submission:
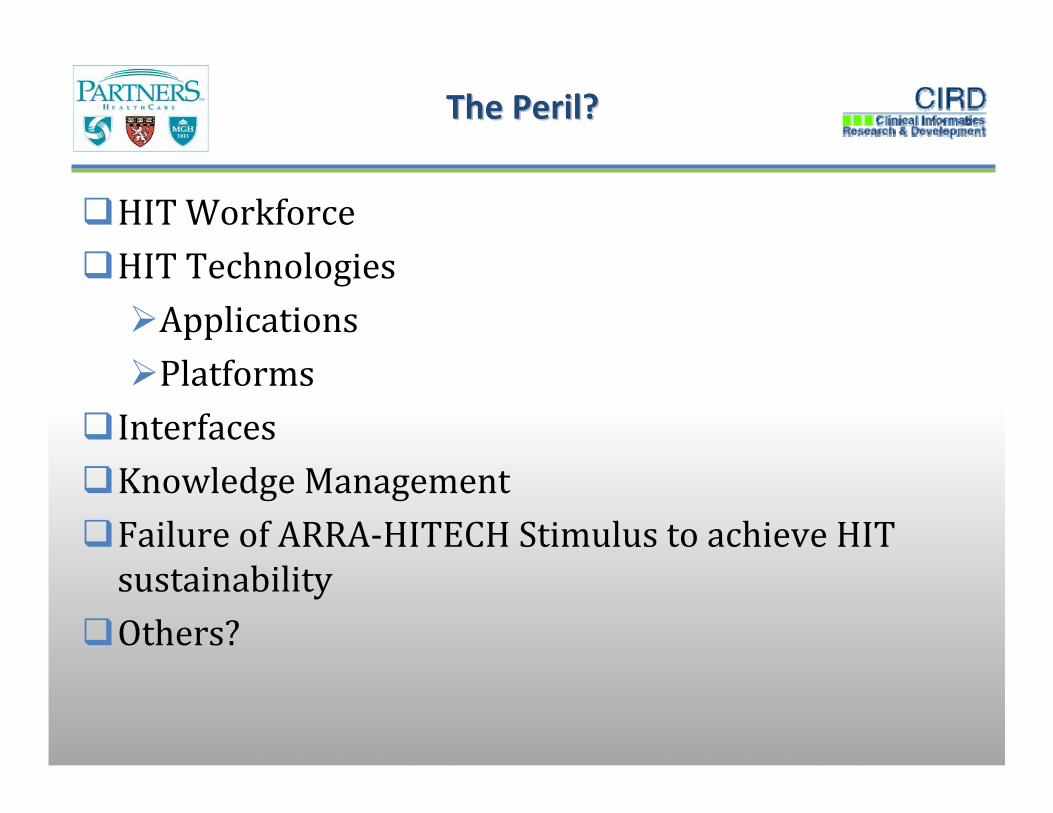
The Peril?The Peril?
HIT WorkforceHIT TechnologiesApplicationsPlatforms
InterfacesKnowledge ManagementFailure of ARRA‐HITECH Stimulus to achieve HIT sustainabilityOthers?

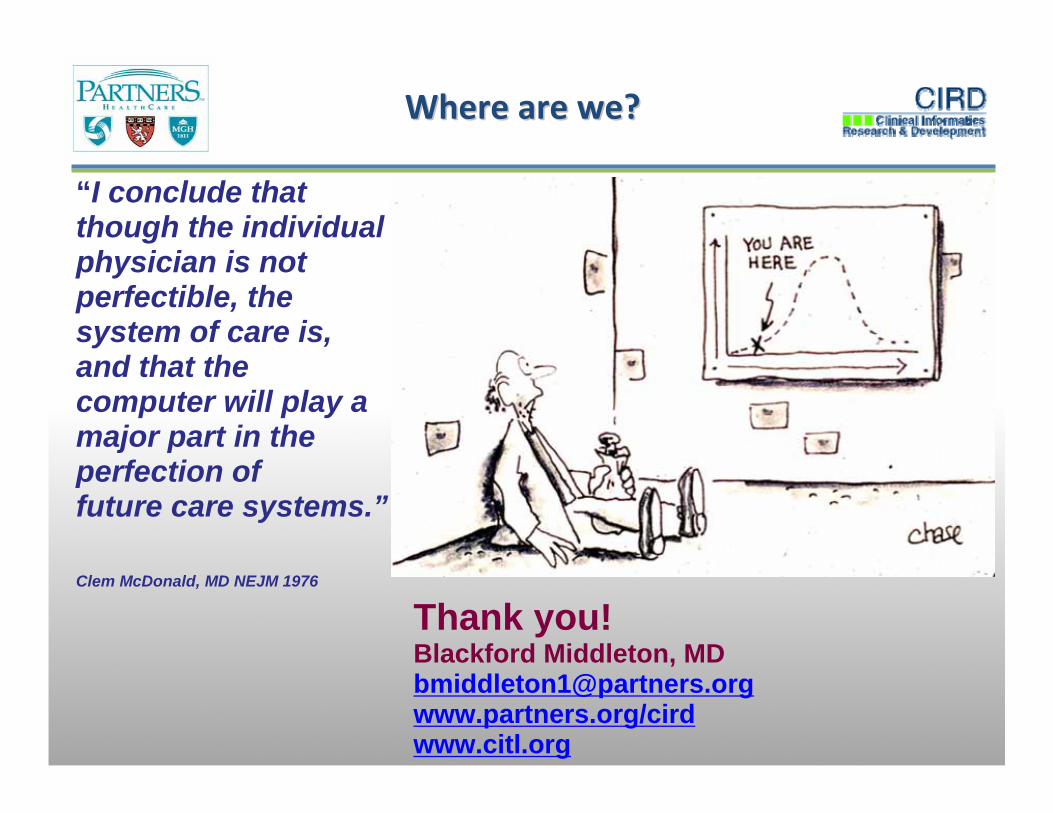
“I conclude that though the individual physician is not perfectible, the system of care is, and that the computer will play a major part in the perfection of future care systems.”
Clem McDonald, MD NEJM 1976
Thank you!Blackford Middleton, [email protected]/cirdwww.citl.org
Where are we?Where are we?