re: hydro 2000 inc. (hydro 2000) application for 2020
TRANSCRIPT
2
BY E-MAIL
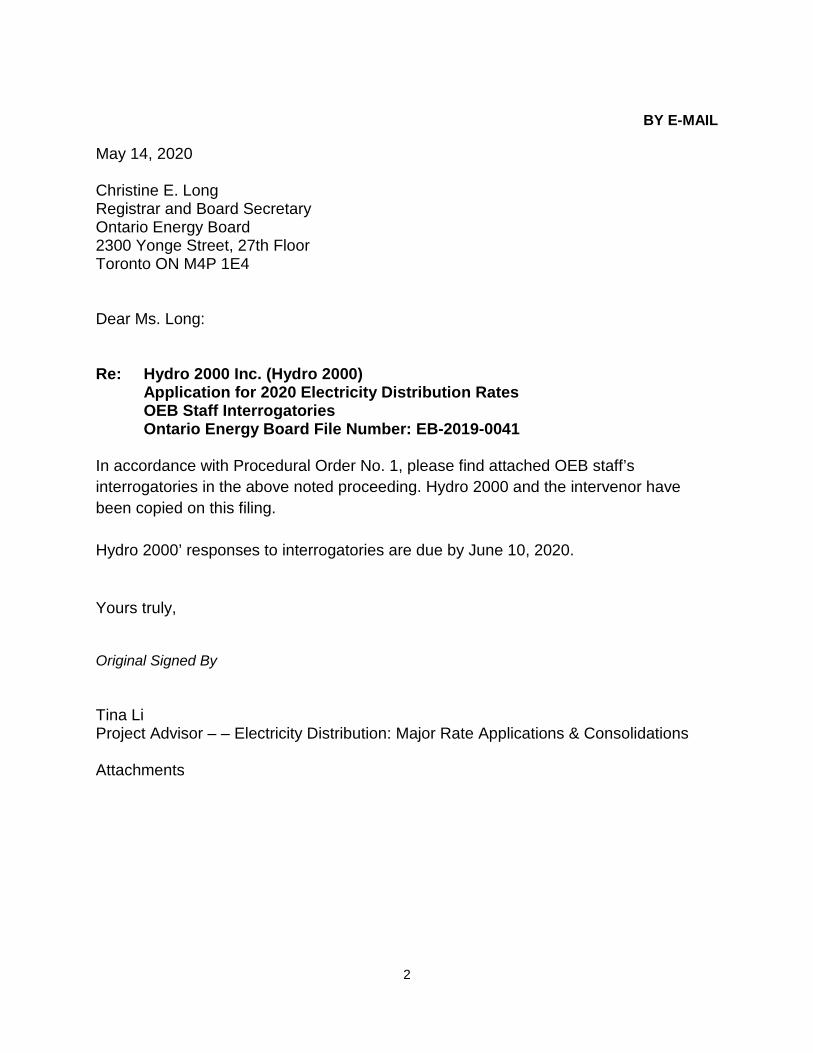
May 14, 2020 Christine E. Long Registrar and Board Secretary Ontario Energy Board 2300 Yonge Street, 27th Floor Toronto ON M4P 1E4 Dear Ms. Long: Re: Hydro 2000 Inc. (Hydro 2000)
Application for 2020 Electricity Distribution Rates OEB Staff Interrogatories Ontario Energy Board File Number: EB-2019-0041
In accordance with Procedural Order No. 1, please find attached OEB staff’s interrogatories in the above noted proceeding. Hydro 2000 and the intervenor have been copied on this filing. Hydro 2000’ responses to interrogatories are due by June 10, 2020. Yours truly, Original Signed By Tina Li Project Advisor – – Electricity Distribution: Major Rate Applications & Consolidations Attachments

2
OEB Staff Interrogatories 2020 Electricity Distribution Rates Application
Hydro 2000 Inc. (Hydro 2000) EB-2019-0041 May 14, 2020
Exhibit 1 – Administration 1-Staff-1 Updated Revenue Requirement Work Form (RRWF) and Models Upon completing all interrogatories from Ontario Energy Board (OEB) staff and intervenors, please provide an updated RRWF in working Microsoft Excel format with any corrections or adjustments that the Applicant wishes to make to the amounts in the populated version of the RRWF filed in the initial applications. Entries for changes and adjustments should be included in the middle column on sheet 3 Data_Input_Sheet. Sheets 10 (Load Forecast), 11 (Cost Allocation), 12 (Residential Rate Design) and 13 (Rate Design) should be updated, as necessary. Please include documentation of the corrections and adjustments, such as a reference to an interrogatory response or an explanatory note. Such notes should be documented on Sheet 14 Tracking Sheet, and may also be included on other sheets in the RRWF to assist understanding of changes. In addition, please file an updated set of models that reflects the interrogatory responses.
1-Staff-2
Ref: Exhibit 1, page 9; DVA Continuity Schedule
In the summary of the application, Hydro 2000 states that:
The total amount to be refunded to residential class is a credit of $243,611 and the total amount to be collected from the small business is $69,030. The proposed disposition period is 48 months.
As per the review of the DVA continuity schedule, staff notes that the proposed disposition period for all DVAs is 24 months and the credit of $243,611 to be refunded to the residential class and $69,030 to be collected from the small business cannot be traced to the DVA continuity schedule.
a) Please provide the references in Exhibit 9 or the DVA continuity schedule for a credit of $243,611 to be refunded to residential class and a debit of $69,030 to be collected from the small business by Hydro 2000. Please provide the updated figures if necessary.

3
b) Please confirm that the proposed disposition period in the summary of the application should be 24 months.
1-Staff-3
Ref: Exhibit 1, page 91
Hydro 2000 states that:
Due to the timing of the filing of the herein Cost of Service application, Hydro 2000 has used its unaudited actual 2019 balances as opposed to budgeted numbers where available.
a) Please provide the Audited Financial Statements (AFSs) for 2019, if available. b) Please update the rate base, capital expenditures, other revenues, OM&A
expenses, depreciation expenses, PILs, Account 1576 2019 transactions, and revenue requirement work form using the 2019 audited numbers in the 2019 AFSs.
1-Staff-4
Ref: Exhibit 1, pages 30-33
Hydro 2000 provides the historical performance metrics for the years of 2015 to 2018 in section 6 of Exhibit 1.
a) Please provide the 2019 actual performance for all metrics in section 6, if available.
1-Staff-5
Ref: Exhibit 1, pages 42-43; 2018 Yearbook for Electricity Distributors
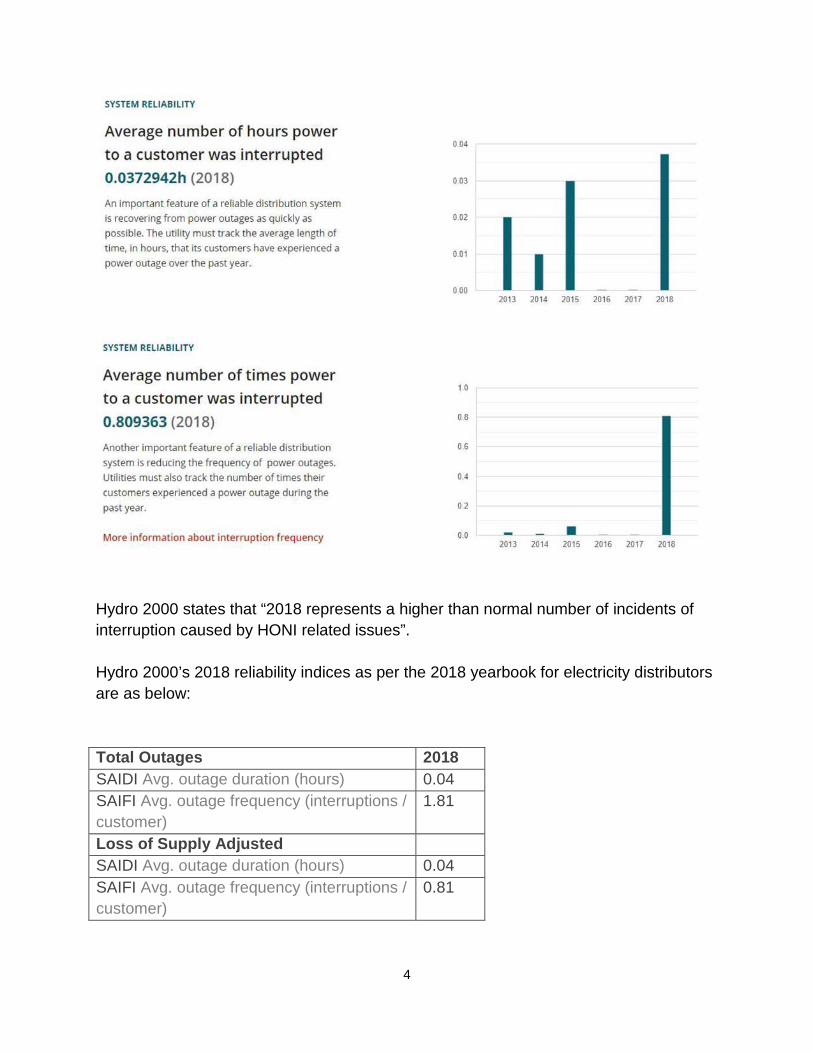
Hydro 2000 provides the system reliability indices for the years of 2013 to 2018 in two figures as below:
4
Hydro 2000 states that “2018 represents a higher than normal number of incidents of interruption caused by HONI related issues”. Hydro 2000’s 2018 reliability indices as per the 2018 yearbook for electricity distributors are as below: Total Outages 2018 SAIDI Avg. outage duration (hours) 0.04 SAIFI Avg. outage frequency (interruptions / customer)
1.81
Loss of Supply Adjusted SAIDI Avg. outage duration (hours) 0.04 SAIFI Avg. outage frequency (interruptions / customer)
0.81

5
Loss of Supply and Major Events Adjusted
SAIDI Avg. outage duration (hours) 0.04 SAIFI Avg. outage frequency (interruptions / customer)
0.81
a) Please provide the reasons why 2018 performance gets worse as compared to
the prior years. 1-Staff-6
Ref: Exhibit 1, page 76
Hydro 2000 states that:
In mid-year 2015, OEB introduced a new policy for all-fixed distribution rates for residential customers. Until now, distribution rates for the residential class have been a blend of fixed and variable rates as shown below Hydro 2000 has not filed an application with the OEB since 2015 therefore has yet to comply with the requirement. Hydro 2000’s current revenue to cost ratio is 6 60% fixed to 40%. The residential charge is also subject to the “Distribution Rate Protection” policy that sets the charge at a maximum $4.00/month. For these reasons, Hydro 2000 proposes a 100% implementation over a 2-year period. [Emphasis added by staff] Staff notes that Hydro 2000 did file applications in 2016, 2017, 2019. In addition, the OEB has approved a five-year transition in its 2016 IRM decision and order EB-2015-0076.
a) Please confirm that 2020 test year is the fourth year of the five-year transition for the residential rates moving from the variable to fixed rates.
1-Staff-7
Ref: Exhibit 1, page 78; Bill Impact Model dated March 18, 2020
Hydro 2000 states in the application that:
Neither a rate plan nor a mitigation plan are required as all of Hydro 2000’s bill impacts fall below the Board’s 10% threshold.

6
Per the updated bill impact model filed on March 18, 2020, staff notes that the bill impacts for Hydro 2000’s low volume customers for RPP and Non-RPP price plans are greater than 10%.
a) Please provide a bill mitigation plan for the low volume customers.
1-Staff-8
Ref: Exhibit 1, page 102
In explaining the economic overview, Hydro 2000 states that “The future of the local college building is unknown”.
a) Please explain what is the local college? What rate class would the college be in?
b) Please clarify why the future of the local college is unknown.
1-Staff-9
Ref: Exhibit 1, page 116
As per the 2018 scorecard, staff notes that Hydro 2000 was not in compliance with the Ontario regulation 22/04 for 2017 and 2018.
a) Please provide the reasons of the non-compliance. b) Please provide the 2019 performance for this metric, if available. c) Please provide the measures that Hydro 2000 plans to implement to ensure that
it complies with the Ontario regulation 22/04 going forward.
Exhibit 2 Rate Base
2-Staff-10
Ref: Exhibit 2, Section 2.1.1; Exhibit 1, Appendix B; Appendix 2-BA Fixed Assets Continuity Schedules
In Section 2.1.1 rate base overview, Hydro 2000 states that:
The first IFRS financial statement were issued for the year ended December 31, 2015. Those financial statement had comparative figures for the year ended December 31, 2014 and an opening balance sheet as at January 1, 2014. In the process of conversion to IFRS, an inventory of poles, transformers and meters was made. Those categories were adjusted to reflect the assets still owned by Hydro 2000.

7
Note 24 b) i) of the 2015 AFSs in Exhibit 1 Appendix B states that:
Through its asset management plan process, the Corporation took an inventory of the majority of its capital assets. The costs were established and the depreciation for every items were recalculated. It resulted in an increase of $ 156,691 of property, plant and equipment and retained earnings as at January 1, 2014 and December 31, 2014. In 2014, there was also $ 2,954 more in depreciation and amortization.
Staff compares the Fixed Assets continuity schedules in Appendix 2-BA for the 2014 opening net book values of the fixed asset under CGAAP with the changed policies and the 2014 opening net values under MIFRS and noted that the difference in 2014 opening net book values of $156,691 is comprised of the following assets:
2014 CGAAP with changes to policies 2014 MIFRS
OEB Description
Opening Balance -
Cost
Opening Balance -
AD
Opening Balance
NBV (Calculated)
Opening Balance -
Cost
Diff (MIFRS
VS. NEW CGAAP)
Calculated by Staff
1830 Poles, Towers & Fixtures $300,240 $168,003 $132,237 $258,109 $125,872
1850 Line Transformers $126,426 $58,604 $67,822 $87,715 $19,893
1860 Meters $60,593 $44,325 $16,268 $12,302 -$3,966
1860 Meters (Smart Meters) $193,297 $70,672 $122,625 $137,517 $14,892
Total $1,193,328 $679,539 $513,789 $670,480 $156,691
Staff notes that Hydro 2000 nets the accumulated depreciation against the fixed asset costs on the 2014 MIFRS based continuity schedule.
a) Please confirm the table above which shows that the break-down of the fixed assets for the opening net book value difference of $156,691 as at January 1, 2014.
b) Please provide the 2014 opening balances under MIFRS without netting the accumulated depreciation against the costs, i.e. three columns data are needed

8
for the fixed assets opening balances under MIFRS in 2014: the gross cost, accumulated depreciation and net book value.
c) Please clarify the statement of “In the process of conversion to IFRS, an inventory of poles, transformers and meters was made”. Does it mean that the fixed assets in the above table of $156,691 were added in 2014 fixed assets opening balances in 2015 AFSs under MFRS?
d) Please clarify whether the fixed assets in the above table of $156,961 were included in the rate base of 2012. If not, why not.
e) Please explain how these fixed assets were found during the IFRS conversion process and what were the status of these fixed assets (i.e. new, being used, idle for back up etc.).
f) Please confirm that Account 1576 does not include the net book value of these fixed assets for $156,591 in the requested balance.
2-Staff-11
Ref: Exhibit 2, Section 2.1.3
In explaining the rate base variance analysis between 2012 approved and 2012 actual, Hydro 2000 states that:
The major contributor to the change in Rate Base was the working capital allowance which was -$83,976 lower than BA. The main reason for this was the 2012 Actual cost of power was -$583,702 lower than the 2012 BA. The Cost of Power was lower than Board Approved. Staff notes that the 2012 actual cost of power expense was $1,840,830, which was $583,702 or 24.07% lower than the 2012 OEB-approved cost of power expense of $2,424,532.
a) Please explain why the 2012 actual cost of power expense was 24% lower than the 2014 OEB-approved expense.
2-Staff-12
Ref: Exhibit 2, Section 2.1.3
Staff has compiled the power supply expenses (i.e. cost of power expense for the calculation of the working capital allowance) from 2012 to 2020 and calculated the year-over-year variances:
2012 2013 2014 2015 2016 2017 2018 2019 2020

9
335- Power Supply Expenses
1,840,831
1,481,131
2,130,330
2,064,481
2,894,613
2,509,801
1,431,875
3,101,041
3,090,754
Year Over Year Variance
(359,700)
649,199
(65,849)
830,132
(384,812)
(1,077,926)
1,669,166
(10,287)
Variance % -20% 44% -3% 40% -13% -43% 117% 0%
a) Please explain why the power supply expanses have been fluctuating significantly over the years?
b) Please explain the significant decrease of $1 million power supply expense in 2018 and the significant increase of $1.67 million power supply expense in 2019.
2-Staff-13
Ref: Exhibit 2, Section 2.2.1
Hydro 2000, in explaining its policy for the construction work-in-progress, states that:
All of Hydro 2000’s capital work is planned to be completed within the same fiscal year. In the event that a project does span over multiple years, Hydro 2000 will follow the OEB’s accounting processes and use account 2055-Work In Progress.
a) Please confirm that Hydro 2000 did not have any capital work that did not get completed in one year from 2012 to 2019.
b) Please provide the status of the 2019 planned capital work and confirm that if all planned capital work has been completed in 2019. If not, please provide the reasons and how Hydro 2000 can ensure that the planned capital work in 2020 test year can be completed 100% within the year.
2-Staff-14
Ref: Exhibit 2, Section 2.2.1; Exhibit 2, Table 18 Depreciation Rates
In explaining the meter budgeting for 2019 ($28,097) and 2020 $17,098), Hydro 2000 states that:

10
Since smart meters have a life expectancy of 10 years, most of Hydro 2000 meters needed to be resealed in 2019.
In Table 18 Depreciation Rates, Hydro 2000 lists the useful life for smart meters of 15 years.
a) Please explain the inconsistencies noted in the application above and confirm that the useful life for the smart meters is 15 years.
b) If a) is confirmed, please update the relevant evidence including the metering budget for 2020.
2-Staff-15
Ref: Exhibit 2, Section 2.3.3 In Table 20 Summary of Cost of Power, the commodity cost is $2,604,263. In Table 21 Calculation of Commodity, the commodity cost is calculated as $2,602,040.
a) Please confirm which figure is the correct commodity cost and update the applicable evidence, if necessary.
2-Staff-16 Ref: Chapter 2 Appendices, Appendix 2-G
The service reliability table from Appendix 2-G is reproduced below:
a) SAIDI is calculated by dividing the sum of all customer interruption durations by
the total number of customers; therefore, staff expects that, when certain outages are excluded, SAIDI performance would improve (i.e. decrease). Please explain why the SAIDI worsens (i.e. increases) when outages caused by loss of supply are excluded (for example, SAIDI increases from 0.010 to 0.030 in 2015 when loss of supply outages are excluded).
b) Please provide a summary of all major events that have occurred since Hydro 2000’s last cost of service (CoS) filing.

11
c) Please provide a report of each cause of interruption with the number of interruptions, number of customer interruptions and the number of customer-hours of interruption.
d) Please explain the large increase in SAIFI in 2018 excluding outages caused by the loss of supply.
2-Staff-17 Ref: Distribution System Plan, page 27
Hydro 2000 indicates that it has implemented a program to replace 20 porcelain fusing protections per year with polymer.
a) Please explain the benefits of polymer over porcelain fusing protections. b) Please explain the rationale for pacing the replacement at 20 per year. c) Please explain how many total fusing protections will be replaced, and when this
program is expected to finish.
2-Staff-18 Ref: Distribution System Plan, page 8
By switching to proactive maintenance from reactive maintenance, Hydro 2000 indicates that it expects to reduce reactive maintenance costs and reduce the number and duration of outages.
a) Compared to the spending in historical years, please quantify the amount of annual savings in reduced reactive maintenance costs Hydro 2000 expects to achieve.
b) Please quantify the impact proactive maintenance will have on reliability. In particular, please elaborate on the improvements Hydro 2000 expects to achieve in its SAIDI/SAIFI reliability metrics from each of its new proactive replacement programs.
2-Staff-19 Ref: Distribution System Plan, pages 6 and 8
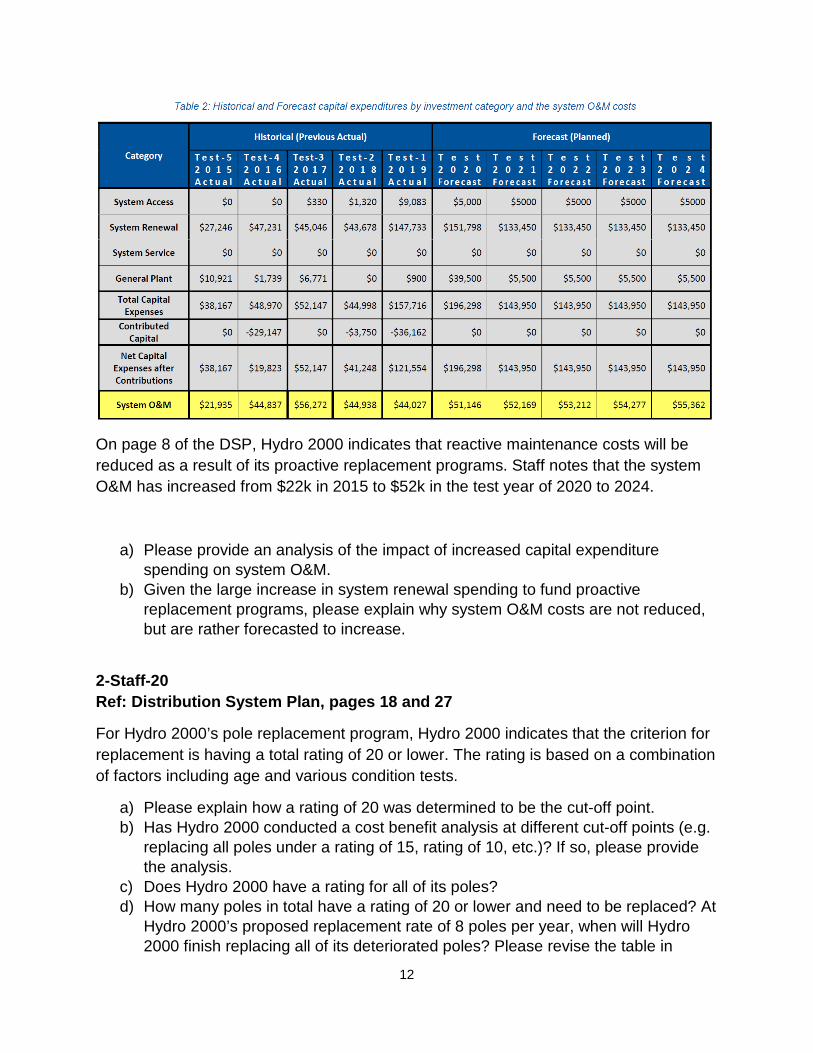
Hydro 2000’s table of historical and forecast capital expenditures and system O&M costs is reproduced below:
12
On page 8 of the DSP, Hydro 2000 indicates that reactive maintenance costs will be reduced as a result of its proactive replacement programs. Staff notes that the system O&M has increased from $22k in 2015 to $52k in the test year of 2020 to 2024.
a) Please provide an analysis of the impact of increased capital expenditure spending on system O&M.
b) Given the large increase in system renewal spending to fund proactive replacement programs, please explain why system O&M costs are not reduced, but are rather forecasted to increase.
2-Staff-20 Ref: Distribution System Plan, pages 18 and 27
For Hydro 2000’s pole replacement program, Hydro 2000 indicates that the criterion for replacement is having a total rating of 20 or lower. The rating is based on a combination of factors including age and various condition tests.
a) Please explain how a rating of 20 was determined to be the cut-off point. b) Has Hydro 2000 conducted a cost benefit analysis at different cut-off points (e.g.
replacing all poles under a rating of 15, rating of 10, etc.)? If so, please provide the analysis.
c) Does Hydro 2000 have a rating for all of its poles? d) How many poles in total have a rating of 20 or lower and need to be replaced? At
Hydro 2000’s proposed replacement rate of 8 poles per year, when will Hydro 2000 finish replacing all of its deteriorated poles? Please revise the table in
13
Appendix C of the DSP to additionally show the rating of the pole, the condition of the pole and the year the pole is planned to be replaced.
e) On page 27, Hydro 2000 indicates that its poles have an average depreciation life of 40 years and that the pole replacement program will help address deteriorated poles. Given that age is only one factor in Hydro 2000’s rating system, if a pole’s age exceeds the useful life expectancy but otherwise scores well in other condition factors, would this pole still be a candidate for replacement?
2-Staff-21 Ref: Distribution System Plan, page 8 to 12
Hydro 2000 provides the results to its 2019 customer survey. Staff notes that none of the survey questions pertains to customer preferences in relation to Hydro 2000’s proposed capital plans for 2020-2024.
a) Has Hydro 2000 conducted any customer engagement on the capital plans contemplated in the Distribution System Plan? In particular, does Hydro 2000 have any customer feedback for the change from reactive to proactive maintenance? If so, please provide this information.
2-Staff-22 Ref: Distribution System Plan, pages 20, 23 and 27
On page 20, Hydro 2000 indicates that it has performed a transformer condition assessment and recorded information on all of its transformers, one of which is the condition of the transformer.
On page 27, Hydro 2000 indicates that its transformer replacement program will replace 15 transformers per year to replace all transformers older than 1970 within three years. At the same time, this program will test transformers for PCB in accordance with federal regulations.
On page 23, Hydro 2000 indicates that it still has 110 transformers that need to be tested for PCB.
a) Given that, on page 27, Hydro 2000 intends to replace all transformers older than 1970, does that mean the condition of the transformer is not a criterion for replacement and that age is the sole determinant for whether a transformer will be replaced? i) If condition is a factor for replacement, please revise the table in Appendix D
of the DSP to include the condition of the transformer. b) Does the budget to replace 15 transformers per year include transformers that
must be replaced as a result of PCB testing?
14
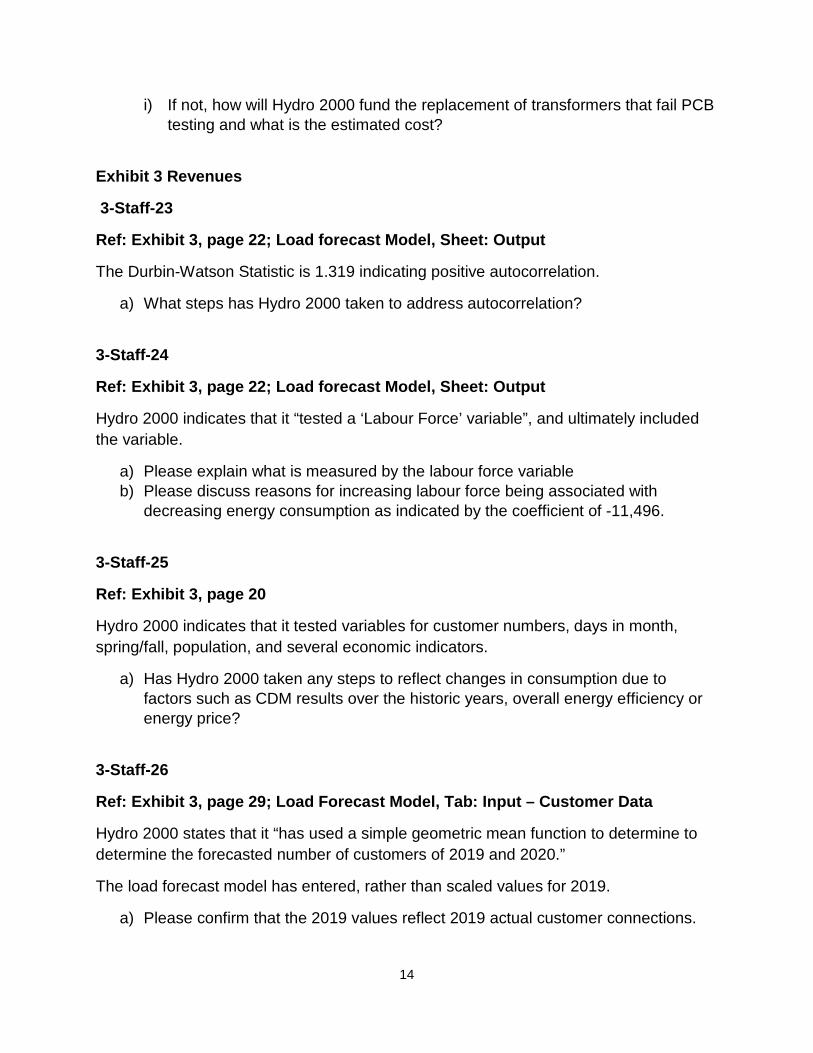
i) If not, how will Hydro 2000 fund the replacement of transformers that fail PCB testing and what is the estimated cost?
Exhibit 3 Revenues
3-Staff-23
Ref: Exhibit 3, page 22; Load forecast Model, Sheet: Output
The Durbin-Watson Statistic is 1.319 indicating positive autocorrelation.
a) What steps has Hydro 2000 taken to address autocorrelation?
3-Staff-24
Ref: Exhibit 3, page 22; Load forecast Model, Sheet: Output
Hydro 2000 indicates that it “tested a ‘Labour Force’ variable”, and ultimately included the variable.
a) Please explain what is measured by the labour force variable b) Please discuss reasons for increasing labour force being associated with
decreasing energy consumption as indicated by the coefficient of -11,496.
3-Staff-25
Ref: Exhibit 3, page 20
Hydro 2000 indicates that it tested variables for customer numbers, days in month, spring/fall, population, and several economic indicators.
a) Has Hydro 2000 taken any steps to reflect changes in consumption due to factors such as CDM results over the historic years, overall energy efficiency or energy price?
3-Staff-26
Ref: Exhibit 3, page 29; Load Forecast Model, Tab: Input – Customer Data
Hydro 2000 states that it “has used a simple geometric mean function to determine to determine the forecasted number of customers of 2019 and 2020.”
The load forecast model has entered, rather than scaled values for 2019.
a) Please confirm that the 2019 values reflect 2019 actual customer connections.

15
b) Please explain the methodology for determining at the annual customer counts – e.g. an average of 12 months, the count at year end, or other.
3-Staff-27
Ref: Exhibit 3, page 29; Load Forecast Model, Tab: Input – Adjustments & Variables
In the context of the customer forecast at the first reference, Hydro 2000 stated that “The geometric mean results were analyzed by Hydro 2000 and then further adjusted for known particulars – in Hydro 2000’s case the MicroFIT related consumption was removed from the Wholesale Purchases”.
In the load forecast model, Hydro 2000 has made an adjustment to increase wholesale purchases.
a) Please clarify what is meant by the above quotation as it would appear that Wholesale Purchases would relate to a measure of energy, while the geometric mean methodology would apply to customer counts.
b) Does the adjustment to the wholesale purchases reflect MicroFIT generated energy coming onto Hydro 2000’s system? If not please explain the purpose of this adjustment.
c) Does the Unadjusted Wholesale Purchases reflect energy taken from Hydro One uplifted for losses? If not, please explain what this column reflects.
3-Staff-28
Ref: Exhibit 3, page 49
The street light rate class consumed 327,162 kWh in 2013. Consumption decreased 45% to 179,624 kWh in 2014, and a further 15% to 152,105 kWh in 2015. Similar declines were seen in demand.
a) Please confirm that the reductions were due to an LED conversion program. If that cannot be confirmed, please explain the cause.
3-Staff-29
Ref: Load Forecast Model, Tab Bridge & Test Year Class Forecast
Hydro 2000 has calculated a 2009-2018 average ratio of kW to kWh. It then applied this ratio to 2019 and 2020 kWh to arrive at 2019 and 2020 kW.
a) Please provide 2019 actual demand and indicate whether or not its inclusion in the average would affect the ratio for 2020.
16
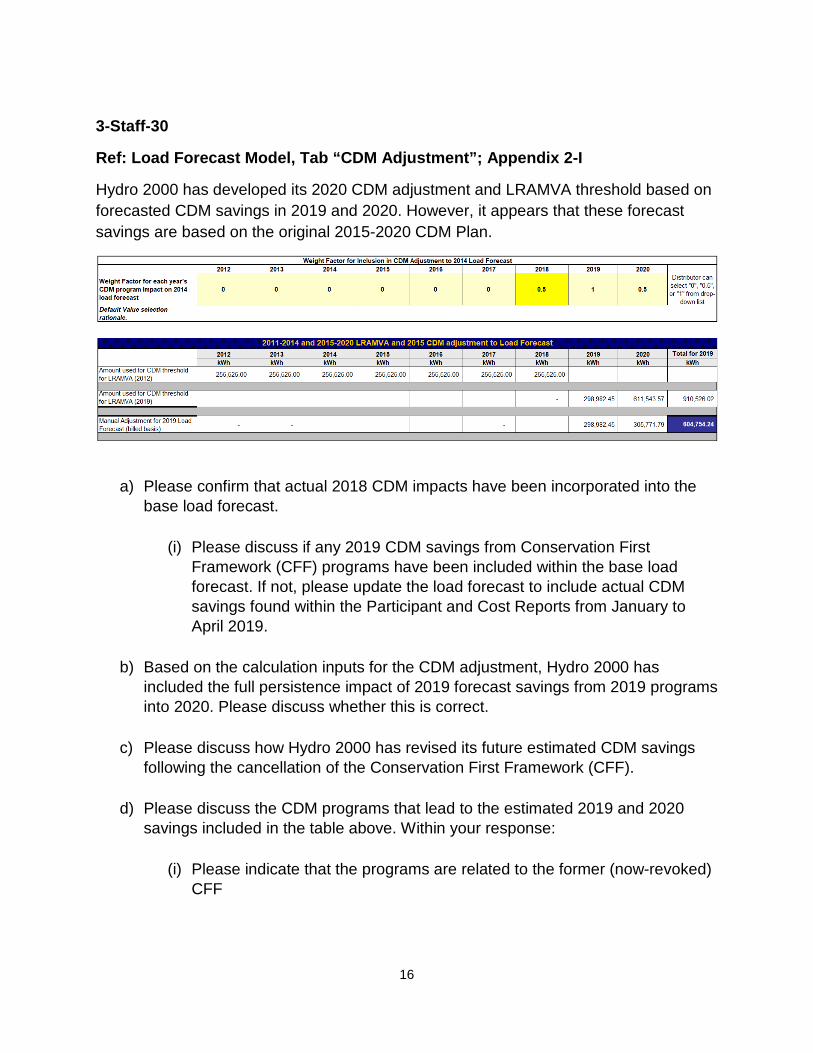
3-Staff-30
Ref: Load Forecast Model, Tab “CDM Adjustment”; Appendix 2-I
Hydro 2000 has developed its 2020 CDM adjustment and LRAMVA threshold based on forecasted CDM savings in 2019 and 2020. However, it appears that these forecast savings are based on the original 2015-2020 CDM Plan.
a) Please confirm that actual 2018 CDM impacts have been incorporated into the
base load forecast.
(i) Please discuss if any 2019 CDM savings from Conservation First Framework (CFF) programs have been included within the base load forecast. If not, please update the load forecast to include actual CDM savings found within the Participant and Cost Reports from January to April 2019.
b) Based on the calculation inputs for the CDM adjustment, Hydro 2000 has
included the full persistence impact of 2019 forecast savings from 2019 programs into 2020. Please discuss whether this is correct.
c) Please discuss how Hydro 2000 has revised its future estimated CDM savings
following the cancellation of the Conservation First Framework (CFF).
d) Please discuss the CDM programs that lead to the estimated 2019 and 2020 savings included in the table above. Within your response:
(i) Please indicate that the programs are related to the former (now-revoked)
CFF
17
(ii) Please reconcile the 2019 and 2020 estimated savings included in the CDM adjustment with the project lists included in the CDM-IS savings report.
Please file the project lists from the CDM-IS savings report in excel format, and ensure the following information is provided by project:
What CFF program the project(s) are being completed under The timing of approval for each project Confirmation that Hydro 2000 and its customer(s) have entered into
a contractual agreement for the energy efficiency project(s) to be completed
The total estimated savings and project timeframe for each CFF-project(s) that Hydro 2000 is contractually obligated to complete
(iii) Please discuss if there are any non-CFF programs that contribute to the
estimated savings in 2019 and 2020. If yes, please explain why non-CFF programs have been included.
e) Please confirm that the 2020 CDM adjustment and 2020 LRAMVA threshold
noted in the Load Forecast Model are the final values requested for approval. There are discrepancies in the labelling and amounts of the LRAMVA threshold (i.e. Appendix 2-I, cells A93/H93 or A95/H95) and ‘CDM adjustments’ for LRAMVA purposes (i.e. Load Forecast Model, Tab “CDM adjustment”, cells B36/L36 and B38/L38). If there are revisions to the pre-filed evidence based on the response(s) to the above questions, please explain what has changed and why.
Exhibit 4 Operating Expenses
4-Staff-31
Ref: Exhibit 4, Section 4.1.1
Staff notes that the total figure (highlighted in yellow by staff) in Table 1 in Section 4.1.1 Overview does not add up:

18
a) Please provide an updated table with a correct total. 4-Staff-32
Ref: Exhibit 2, Section 4.2.1
In explaining the OM&A cost drivers, Hydro 2000 explains the accounting corrections as follows:
In preparing the Cost Driver explanations, Hydro 2000 came across historical accounting errors which created artificial variances from year to year. Most if not all of the errors were costs that were entered in incorrect accounts. Hydro 2000 opted to correct these accounting errors so to present a more accurate depiction of its spending trends and cost drivers. Hydro 2000 notes that these accounting errors affect the RRR and as a result also affect its historical financial statements. For the purpose of this rate application and for the Board to be able to determine an appropriate level of spending, Hydro 2000 made the following adjustments. All evidence and table presented in this exhibit reflect the corrected OM&A. Hydro 2000 then provide a detailed OM&A USoA balances as filed in RRR and the adjusted balances from 2012 to 2018.
a) Please sum up the total OM&A USoA balances provided in the table for as-filed in RRR and ad adjusted for the years of 2012 to 2018.
b) If the total OM&A expense as summed up above has changed for any year, please explain if and how the corrections would impact the historical AFSs materially. If so, has Hydro 2000 communicated the accounting error to its external auditor?
4-Staff-33

19
Ref: Exhibit 4, Section 4.2.1
In explaining the cost drivers for the outside service employed expense from 2016 to 2017, Hydro 2000 states that:
2016-2017; Increase of $22,122 External accounting fees related to yearend and the variance account audit was in the amount of $49,111.30. The increase was partially offset by cost reductions. In explaining the cost drivers for Regulatory Expenses from 2016 to 2017, Hydro 2000 states that:
2016-2017; Increase of $16,089 Accounting fees increased as a result of the Audit of Variance account.
a) Please explain who performed the variance account audit and the driver for the variance account audit?
b) Please explain why the audit of variance account was a cost driver for both outside service employed and regulatory expenses in 2017?
4-Staff-34
Ref: Exhibit 4, Section 4.2.1 and Section 4.2.2
In explaining the year over year variance for the OM&A expense in 2015 over 2014 (Table 9), Hydro 2000 states that:
The total OM&A expenses in 2015 were $49,899 higher than the 2014 Actual amount. The main contributor to the variance is attributable to the hiring of Consultant Tandem Energy. In Section 4.2.1, Hydro 2000 explained the cost drivers. In explaining the regulatory costs increase, Hydro 2000 states that: Hydro 2000 entered into a 4-year contract with Tandem Energy Services.
a) Please explain the nature of the 4-year contract. b) Please explain the nature of the $49,899 expense incurred in 2015 that was paid
to Tandem Energy. 4-Staff-35

20
Ref: Exhibit 4, Section 4.2.2
In explaining the year over year variance for the OM&A expense in 2019 over 2018 (Table 13), Hydro 2000 states that:
The total increase from 2018 to 2019 in the amount of $56,029 is for the most part attributable to the increase in Administrative and General costs of $69,707. The increase is for the most part due to changes in staffing that were made in order to bring the business up to the standards required by the OEB and Hydro 2000’s customers.
a) Given the number of FTEs has not been changed, please explain what changes in staffing were made in 2019?
4-Staff-36
Ref: Exhibit 4, Section 4.2.3
Hydro 2000 provides the actual year-over-year increase of the OM&A expense in Table 16 and provides the OM&A expenses for all years based on the hypothetical inflationary increase of 1.5% in Table 17. Hydro 2000 explains that:
When budgeting, Hydro 2000 has historically used a rate of inflation of 2% per USoA account, however as of 2020, the utility plans on using the adjusted price cap index as an inflation factor.
a) Please update Table 17 using 2% as an inflation factor, given the historical years Hydro 2000 has used a rate of inflation of 2% for budgeting.
b) Please compare the resulted OM&A expense for 2020 test year using 2% inflation rate to the proposed OM&A expense.
4-Staff-37
Ref: Exhibit 4, Section 4.3.1
Hydro 2000 provides the OM&A by the programs in Table 18 (Appendix 2-JC). Staff copied a part of it for the distribution system effectiveness expense:
Hydro 2000 also states that:

21
Hydro 2000 does not have linesmen or operations staff. Instead the utility outsources it all its Operations and Maintenance to Sproule Powerline Construction Ltd (“SPL”).
a) Please provide the actual expenses paid to SPL for the years of 2012 to 2019. b) Please explain if there is a contract signed with SPL? If so, please provide a copy
of the contract with reaction to any of the confidential information as deemed by Hydro 2000.
4-Staff-38
Ref: Exhibit 4, Section 4.4
Hydro 2000 provides the employee compensation in Table 19 below:
Hydro 2000 states that:
Total benefits have decreased 5.62% between the 2012 Actual and 2020 Test Years as a result of statutory rate increases and wage increases. The increase in benefits in line with the increase in wages and the fact that the utility now operates with two management position.
a) Please reconcile the above statements with the numbers in Table 19 which show that the total benefits in 2020 has decreased from 2012 total benefits.
b) Please clarify the statement of “the utility now operates with two management positions”.
4-Staff-39

22
Ref: Exhibit 4, Section 4.6.1
Hydro 2000 states that: Hydro 2000's Procurement Policy is presented in Appendix D of this Exhibit. The document identifies singing authority, tendering process, non-affiliated service purchase compliance, emergency purchases and purchases without a competitive tender. Staff cannot find the procurement policy in the evidence filed.
a) Please provide the procurement policy. b) If the policy is not available, please provide a write up describing singing
authority, tendering process, non-affiliated service purchase compliance, emergency purchases and purchases without a competitive tender.
4-Staff-40
Ref: Exhibit 4, Section 4.8.5; Appendix 2-BB
Hydro 2000 states that “Hydro 2000’s use of depreciation rates fell within the range of the Kinectrics Report”.
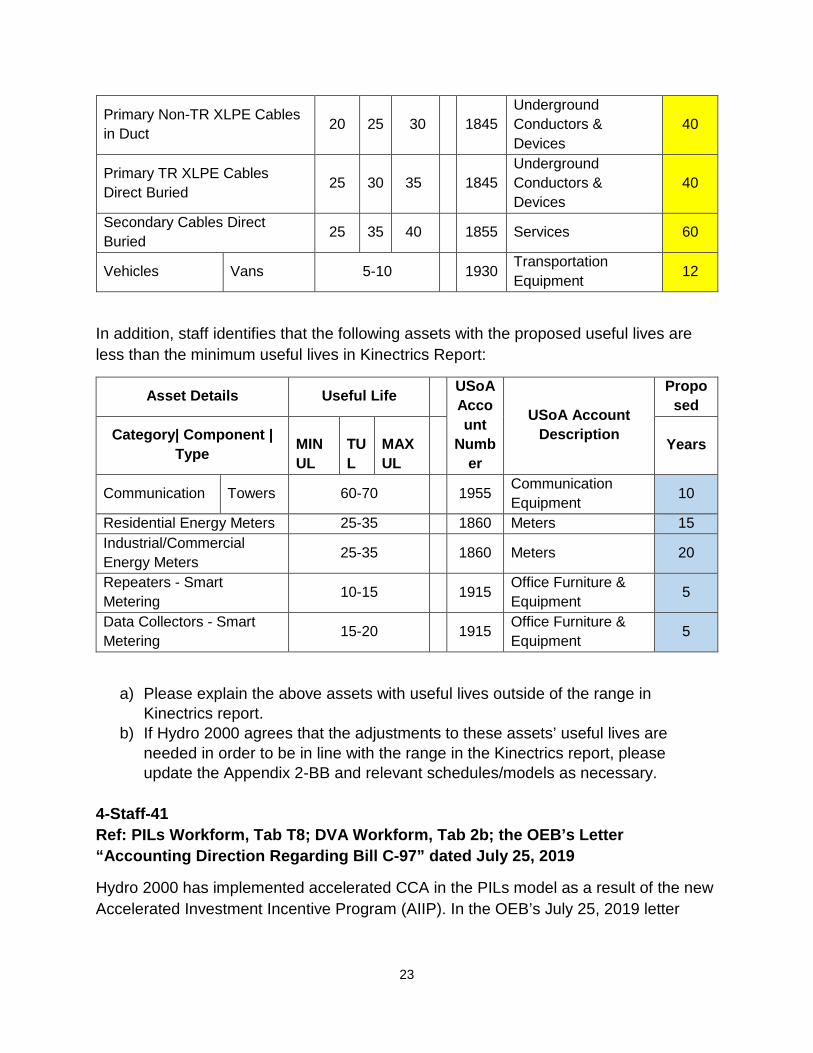
However, as per the review of Appendix 2-BB Service Life Comparison, Staff identifies the following assets with the proposed useful lives exceeding the maximum useful lives in Kinectrics Report:
Asset Details Useful Life USo
A Account Number
USoA Account Description
Proposed
Category| Component | Type MIN UL
TUL
MAX UL
Years
Station DC System
Battery Bank 10 15 15 1820 Distribution Station
Equipment 20
Primary Ethylene-Propylene Rubber (EPR) Cables 20 25 25
1845 Underground Conductors & Devices
40
Primary Non-Tree Retardant (TR) Cross Linked Polyethylene (XLPE) Cables Direct Buried
20 25 30
1845 Underground Conductors & Devices
40
23
Primary Non-TR XLPE Cables in Duct 20 25 30
1845
Underground Conductors & Devices
40
Primary TR XLPE Cables Direct Buried 25 30 35
1845
Underground Conductors & Devices
40
Secondary Cables Direct Buried 25 35 40
1855 Services 60
Vehicles Vans 5-10 1930 Transportation Equipment 12
In addition, staff identifies that the following assets with the proposed useful lives are less than the minimum useful lives in Kinectrics Report:
Asset Details Useful Life USoA Account
Number
USoA Account Description
Proposed
Category| Component | Type MIN
UL TUL
MAX UL
Years
Communication Towers 60-70 1955 Communication Equipment 10
Residential Energy Meters 25-35 1860 Meters 15 Industrial/Commercial Energy Meters 25-35 1860 Meters 20
Repeaters - Smart Metering 10-15 1915 Office Furniture &
Equipment 5
Data Collectors - Smart Metering 15-20 1915 Office Furniture &
Equipment 5
a) Please explain the above assets with useful lives outside of the range in Kinectrics report.
b) If Hydro 2000 agrees that the adjustments to these assets’ useful lives are needed in order to be in line with the range in the Kinectrics report, please update the Appendix 2-BB and relevant schedules/models as necessary.
4-Staff-41 Ref: PILs Workform, Tab T8; DVA Workform, Tab 2b; the OEB’s Letter “Accounting Direction Regarding Bill C-97” dated July 25, 2019
Hydro 2000 has implemented accelerated CCA in the PILs model as a result of the new Accelerated Investment Incentive Program (AIIP). In the OEB’s July 25, 2019 letter

24
Accounting Direction Regarding Bill C-97 and Other Changes in Regulatory or Legislated Tax Rules for Capital Cost Allowance, it states that:
The OEB recognizes that there may be timing differences that could lead to volatility in tax deductions over the rate-setting term. The OEB may consider a smoothing mechanism to address this.
The letter also states that:
The OEB expects Utilities to record the impacts of CCA rule changes in the appropriate account (Account 1592 - PILs and Tax Variances and similar accounts for natural gas utilities and OPG) for the period November 21, 2018 until the effective date of the Utility’s next cost-based rate order. For the purposes of increased transparency, the OEB is establishing a separate sub- account of Account 1592 - PILs and Tax Variances – CCA Changes specifically for the purposes of tracking the impact of changes in CCA rules.
a) Please confirm that all of Hydro 2000’s new capital additions in the 2020 test year are eligible for the AIIP.
b) Please discuss whether Hydro 2000 has considered smoothing of accelerated CCA for all its capital additions and what its conclusion is.
c) Please provide a calculation showing how Hydro 2000 would smooth CCA over the IRM period, and what the impact to PILs would be under a smoothed and unsmoothed scenario.
d) Please explain if Hydro 2000 plans to use Account 1592 to track impacts of changes in CCA rules over the IRM period.
e) Hydro 2000 has requested disposition of the balance in Account 1592 as of December 31, 2018. Please confirm that for any new capital additions from November 21, 2018 to December 31, 2018, Hydro 2000 has included any impacts of the CCA rule changes in the Account 1592 balance requested for disposition.
4-Staff-42
Ref: Exhibit 4, Section 4.12.2; LRAMVA workform (Tabs 3, 4 and 6)
There were several areas of the LRAMVA workform were not completed properly.
Please update the LRAMVA workform accordingly:
a) In Tab 3, the 2011 to 2017 distribution rates used in the lost revenue calculations are not reflective of May 1 rates for each rate year. Please update the value entered in the “first period” (cells D16 to K16) to “4” instead of “0”.

25
b) In Tab 4, the energy and demand savings for 2014 Direct Install Lighting program appear to be in reverse order. Please review accuracy of the savings input for 2014 Direct Install Lighting energy and demand savings (Table 4-d, row 439) and update accordingly.
c) In Tab 6, projected carrying charges are calculated up to October 2018. Please
update the prescribed interest rates in Table 6 to calculate the projected carrying charges up to April 30, 2020.
d) Please confirm any changes to the LRAMVA workform in response to these
LRAMVA interrogatories in “Table A-2. Updates to LRAMVA Disposition (Tab 1-a)”.
e) Please file an updated LRAMVA workform, and confirm the LRAMVA balance
requested for disposition, disposition period and revised rate riders.
Exhibit 5 Cost of Capital
5-Staff-43
Ref: Exhibit 5, page 13; Exhibit 1, page 58; Appendix 2-AB; Exhibit 1, Appendix D
In Exhibit 5, Hydro 2000 states that:
Hydro 2000 is not forecasting any debt in 2020. However, should circumstances change in the near future, the utility would make every effort to obtain a loan from its shareholder, financial institution or Infrastructure Ontario at a rate that is in line with the current cost of capital parameters.
In Exhibit 1, Hydro 2000 states that it may seek out debt in the near future:
The utility does not currently carry any debt; however, with the distribution system nearing the end of its useful life, Hydro 2000 may seek out debt to finance distribution system renewal in the near future.
Hydro 2000 proposes the capital expenditures of $196,298 in 2020 test year, which is more than three time of the average capital expenditures in historical years of 2012 to 2018.

26
Staff notes from the 2018 AFSs in Exhibit 1 Appendix D that Hydro 2000 has cash of $76,970 as at December 31, 2018 and a line of credit from bank of $100,000 which remained unused as at December 31, 2018.
a) Without the outside financing, please provide a detailed plan how Hydro 2000 will finance the proposed capital expenditures of $196,298 in 2020.
5-Staff-44
Ref: Exhibit 5, page 14
In Section 5.5.6 Notional Debt of Exhibit 5, Hydro 2000 provides a table showing the notional debt for Hydro 2000 is nil.
However, staff notes that the notional debt is the portion of deemed debt exceeding a utility’s actual debt.
a) Please recalculate the notional debt and update the table in Section 5.5.6.
Exhibit 7 Cost Allocation
7-Staff-45
Ref: Cost Allocation Model, Sheet I4 BO Assets; Revenue Requirement Work Form, Sheet 11. Cost Allocation
Hydro 2000 has not assigned any proportions of Account 1830 – Poles, Towers and Fixtures, Account 1835 – Overhead Conductors and Devices, Account 1840 – Underground Conduit, or Account 1845 – Underground Conductors and Devices as operating at Primary or Bulk voltages. As a result, the cost allocation model is allocating all of these costs as operating at Secondary voltage.
a) Please make a proposal to determine which proportion of these assets are operating at Primary (or higher) voltage.
b) Please use the 2021 Cost Allocation model to provide an updated cost allocation model based on the proposal.
7-Staff-46
Ref: Exhibit 7, pages 6-8; Cost Allocation Model, Sheet I5.2 Weighting Factors
Hydro 2000 has used a weighting factor of 0 for Account 1855 – Services for all rate classes except residential and unmetered scattered load. It has determined a cost of

27
$273.33 per residential connection based on a cost of $820 for three residential connections, and a cost of $500 for one USL connection.
The billing and collecting weighting factors are 1.0 for residential, 0.2 for GS > 50 regular, and 0.9 for all other rate classes.
a) Please explain why the services weighting factors were based on only three residential connections and one USL connection.
b) Please confirm that customers in all rate classes other than Residential and USL are responsible for providing their own service connections.
c) How many customers in each rate class have service connections provided by Hydro 2000? If more than four total, please revise the weighting factor calculation to reflect an estimate of replacement costs for all customers with Hydro 2000 provided connections.
d) Please explain why the “Interval-Meter Reading – Spec Rds” is recorded as a negative value (-1,163.76).
e) Please explain what the costs “Chambo Communications & Design Admin”, “Stewart Electric” and “Sproule Powerline” relate to, and whether these reflect services used for some customers in place of other services such as “Ottawa River Power”, “Util-Assist”, “Harris”, or internal customer billing that are used for other customers?
7-Staff-47
Ref: Cost Allocation Model, Sheet I6.2 Customer Data; Sheet I7.1 Customer Data; Sheet I7.2 Meter Reading; Exhibit 3, page 30
As per the load forecast in Exhibit 3, Hydro 2000 forecasts 1,113 residential customers in 2020.
Hydro 2000 has identified customers, meters, and meter read totals as follows:
Customers / Connections per
I6.2 Customer Data
Meters per I7.1 Meter Capital
Meter Reads per I7.2 Meter
Reading
Residential 1,113 1,110 1,113 General Service < 50 kW 141 141 141 General Service 50 to 4,999 kW 13 13 13 Street Lighting 370 - 370 Unmetered Scattered Load 4 - 4
a) Please confirm whether the customer count of 1,110 in sheet I7.1 of the cost allocation model is a typo. If so, please update the sheet.

28
b) Please revise the meter reading counts for the Street Lighting and USL rate classes to reflect the amount of meter reading, if any.
c) Please provide the updated cost allocation model for the above changes.
7-Staff-48
Ref: Exhibit 7, pages 8-10; Chapter 2 filing requirements, July 12, 2018, page 44.
Hydro 2000 states that:
It is Hydro 2000’s understanding that in normal circumstances, a utility should update its demand data (and sheet I8) to reflect the findings of the 2004 hour by hour load data being scaled to be consistent with the 2020 load forecast and the inspection of the scaled data to identify the system peaks and class specific peaks.
However, the OEB’s 2019 filing requirements, which are used for the 2020 filings, state that:
Distributors should make best efforts to update all classes’ load profiles using the most recent available data, particularly from smart, MIST and interval meters.
If a distributor is not able to update its load profiles at this time, an explanation should be provided and the distributor should confirm that it intends to put plans in place to update its load profiles the next time a cost allocation model is filed. In such cases, the load profiles provided by Hydro One for use in the original Informational Filing may be used, scaled to match the load forecast as it relates to the respective rate classes.
a) Please confirm that Hydro 2000 will gather data and put a plan in place to update its load profiles based on smart meter and interval meter data in time for its next CoS application.
b) Please explain the methodology used to derive the 2020 demand allocators.
Exhibit 8 Rate Design
8-Staff-49
Ref: Exhibit 3, page 10; Exhibit 8, page 27-28; Chapter 2, Appendix 2-R; Load Forecast Model, sheet Input – Adjustments & Variables; Hydro 2000’s 2012 CoS Decision and Order EB-2011-0326, page 19
Hydro 2000 is proposing a loss factor of 1.0818, an increase from the current loss factor of 1.0772.

29
In Hydro 2000’s last CoS proceeding, the OEB encouraged Hydro 2000 to “monitor the condition of its assets, and address any persistent increases”. 1
Hydro 2000 states that it hired a consultant to conduct a Utility Load Flow and Evaluation Study. This study recommended two actions (one recommendation of the estimated cost of $15,000 and the other recommendation of the estimated cost of $2,000) to reduce losses, including updates on distribution lines, and rebalancing of loads. Hydro 2000 states that “Hydro 2000’s executives opted to invest in pole replacement and needed investments in the distribution system for the next 5 years”.
a) Please explain how the two recommendations of the total estimated cost of $17,000 would impair the proposed investments in the distribution system in 2020?
b) Does Hydro 2000 have any estimates regarding the amount of energy that could be saved following each of the consultant recommendations? If so, please provide.
c) Has Hydro 2000 attempted to identify and/or quantify any additional benefits that would be realized from each of the consultant recommendations? If so, please provide.
d) Has Hydro 2000 evaluated the impact of not implementing the two recommendations by the consultant? If so, please provide. If not, why not.
8-Staff-50
Ref: Chapter 2, Appendix 2-R
Appendix 2-R Loss Factors Row A(2) reconciles to the Load forecast model, Input-Adjustments & Variables, column B for the historical years of 2014 to 2018 except 2016. For 2016, Appendix 2-R reflects 21,329,782 kWh, while the Load Forecast totals 21,821,769 kWh.
a) Please explain the variance in 2016 wholesale kWh between Appendix 2-R and the load forecast.
b) Please explain how Hydro 2000 achieved a distribution system loss factor of 1.0277 in 2016, yet the next lowest loss factor was 1.0476, recorded in 2018.
8-Staff-51
Ref: Exhibit 8, page 17, 27; Tariff Schedule and Bill Impact Model, sheet 3. Regulatory Charges, sheet 5. Final Tariff Schedule, sheet 6. Bill Impacts.
1 Hydro 2000’s 2012 CoS Decision and Order EB-2011-0326, page 19.

30
Hydro 2000 has provided the 2019 retail service charges and indicates that they are both current and sought for approval. In the tariff and bill impact model, it has used a 1.2% inflation factor for retailer charges as well as pole attachment charges.
Hydro 2000 is proposing to update its loss factor to 1.0818, however the loss factor on the tariff and bill impacts indicates 1.0772.
a) Please confirm that Hydro 2000 will apply the standard 2% inflationary increase for both retail service charges and pole attachment charges.
b) Please work with staff to update tariff and bill impacts to reflect the increase sought.
8-Staff-52
Ref: Exhibit 8, page 26; Hydro 2000’s 2012 CoS decision and order EB-2011-0326, page 19
The OEB stated in Hydro 2000’s 2012 CoS decision and order for the low voltage cost: The Board approves the LV costs of $128,226 and recognizes Hydro 2000’s argument that these costs are largely beyond its control. Nevertheless, Hydro 2000 is encouraged to explore any alternatives to reduce LV costs given their proportional magnitude.
Hydro 2000 proposes the test year’s low voltage charges of $164,385, which is based on the average of the historical low voltage charges of 2012 to 2018 in the table below:
Staff noted that the proposed low voltage charge is higher than the approved low voltage charge in 2012 CoS decision and order.
a) Please explain whether Hydro 2000 has considered the recommendation in its 2012 CoS decision and order for “explore any alternatives to reduce LV costs given their proportional magnitude”. If not, why not.

31
8-Staff-53
Ref: Exhibit 3, page 74; Tariff Schedule and Bill Impact, sheet 5. Final Tariff Schedule; OEB letter regarding review of fixed monthly charge for microFIT generator service classification, February 24, 2020.
Hydro 2000’s currently approved MicroFIT charge is the default $5.40 charge. It states that it is not proposing any changes to the MicroFIT service charge. In a letter to all electricity distributors, the OEB updated the default charge to $4.55.
a) Please confirm that Hydro 2000 will adopt the updated default charge of $4.55. b) Please update the tariff of rates and charges to reflect the updated charge.
8-Staff-54
Ref: Tariff Schedule and Bill Impact, sheet 5. Final Tariff Schedule; Notice of amendments to codes and a rule, March 14, 2019
Hydro 2000’s proposed 2020 tariff includes charges for disconnection and for collection of account. As of July 1, 2019, these charges are no longer permitted.
a) Please update the tariff of rates and charges, to reflect the updated rules.
8-Staff-55
Ref: Exhibit 8, page 10; Revenue Requirement Work Form (RRWF), sheet 13. Rate Design
The volumetric rates for General Service < 50 kW and Street Light and the monthly charge for Unmetered Scattered Load (USL) in Table 6 differ from the rates in the RRWF. The row labels for Street Light and USL in Table 6 appear to be reversed.
a) Please confirm that Hydro 2000 is proposing to apply the rates in the RRWF.
Exhibit 9 Deferral and Variance Accounts
9-Staff-56 Ref: Section 9.10.3 Global Adjustment and the IESO Settlement Process; The OEB’s Letter to All Regulated Electricity Distributors regarding “Guidance on the Disposition of Accounts 1588 and 1589” dated May 23, 2017
32
The OEB’s letter to all regulated electricity distributors regarding “Guidance on the Disposition of Accounts 1588 and 1589” issued on May 23, 2017 stated the following guidance:
• The year-end RPP settlement true-up claim for the last quarter of a year must be completed no later than the settlement claim with the IESO for the final month of the first quarter of the following fiscal year.
• The balances in distributors’ RSVA Power (1588) and Global Adjustment (1589) variance accounts that are requested for disposition by distributors must reflect RPP settlement amounts pertaining to the period that is being requested for disposition. This means that RPP settlement true-up claims made with the IESO in the period subsequent to the fiscal year for which disposition is being requested must be reflected in the balances being requested for disposition.
• RPP settlement true-up claims for a given fiscal year that have not been reflected in the audited financial statements are to be identified separately as an adjustment to the balance requested for disposition in the DVA continuity schedule submitted in rate applications. The impact of such adjustments should be reversed on the continuity schedules for the following year.
Staff notes that Hydro 2000 did not comment on whether or not it has complied with the OEB’s guidance in May 2017 letter.
a) Please explain the following regarding the guidance:
i. When did Hydro 2000 submit the 2017 year-end and 2018 year-end RPP settlement true-up claims respectively? i.e. which months were the year-end true-ups included?
ii. Please provide the 2017 and 2018 RPP year-end true-up amounts respectively.
iii. Was the 2017 year-end true-up claim included in the 2017 AFSs? If not, was it part of the principal adjustment for a credit of $139,307?
iv. If the 2017 year-end true-up claim as part of the 2017 principal adjustment, please confirm whether or not the 2017 true-up claim was reversed in 2018 and included in the 2018 transaction credit of $768,115.
v. Was the 2018 year-end true-up claim included in the 2018 AFSs? If not, why was there no principal adjustment made for 2018 on the continuity schedule?
9-Staff-57 Ref: DVA Workform, Tab 2a; Hydro 2000 2019 IRM Decision and Order (EB-2018-0039)
In Hydro 2000’s 2019 IRM Decision and Order (EB-2018-0039), the following Group 1 DVAs were approved for disposition on an interim basis:

33
Account Name Account
Number Principal
Balance ($) A
Interest Balance ($)
B
Total Claim ($)
C=A+B LV Variance Account 1550 188,492 8,602 197,093 Smart Meter Entity Variance Charge
1551 (1,463) (43) (1,506)
RSVA – Wholesale Market Service Charge
1580 10,663 311 10,974
RSVA – Retail Transmission Network Charge
1584 27,720 1,271 28,991
RSVA – Retail Transmission Connection Charge
1586 30,472 1,351 31,824
Disposition and Recovery of Regulatory Balances (2015)
1595 (2,038) 1,566 (471)
Disposition and Recovery of Regulatory Balances (2016)
1595 (59,327) 89,603 30,277
Totals for all Group 1 accounts 194,519 102,662 297,181
a) Please confirm that Hydro 2000 is seeking that these account balances that were previously approved for disposition on an interim basis, are now approved for disposition on a final basis.
9-Staff-58 Ref: DVA Workform, Tab 2a; The Inspection Report by the OEB’s Audit and Inspection Department
Hydro 2000 is requesting disposition of a Dec 31, 2018 principal balance in Account 1588 of credit $482,047as per the DVA continuity schedule, staff has summarized the transaction debits/ (credits) and the principal adjustments for Account 1588 as below:
2015 Opening Principal Balance as of Jan 1, 2015 ($60,210) Transactions Debit during 2015 $29,817 Principal Adjustments during 2015 $158,168
2016 Transactions Debit during 2016 $16,508 Principal Adjustments during 2016 $0
2017 Transactions Debit during 2017 $220,882 Principal Adjustments during 2017 ($139,307)
2018 Transactions Credit during 2018 ($768,115) Principal Adjustments during 2018 $0
Staff notes that the transaction debits in 2015 and 2016 match with Table 1 in the OEB’s audit report and the 2015 principal adjustment of $158,168 matches to Table 2 opening balance adjustment in the audit report.

34
Staff notes that the transaction debits/ (credits) in 2017 and 2018 are much higher as compared to the ones recorded in 2015 and 2016.
a) Please explain the nature of the transactions debit during 2017 of $220,882 and why the transaction debit is so high given the size of the utility.
b) Please explain the principal adjustments during 2017 of ($139,307). c) Please explain the nature of the transaction credit during 2018 of ($768,115) and
why the transaction credit is so high given the size of the utility. Please prepare the attached analytical review for Account 1588’s transactions in 2018 and explain the dollar amount besides the expected line loss variances in the account.
9-Staff-59
Ref: Exhibit 9, Section 9.10.3 Global Adjustment and the IESO Settlement Process
Staff notes that Hydro 2000 describes the monthly settlement process and states that: On or before the 4th of the month, an estimate is made of the sales to RPP and non-RPP customers. An estimate of the purchases is also made. The rates used are the rates which are known at that time. The claim made is RPP kWh sold divided by total kWh sold multiplied by GA paid. On or before the 4th of the following month, the same exercise is made with the final numbers (kWh and rates). The difference between the final calculation and the initial calculation is claimed or remitted.
a) Please describe Hydro 2000’s process for estimating RPP/non-RPP consumption used to settle the monthly IESO reports and to pro-rate GA between RPP and non-RPP, specifically: i) How does Hydro 2000 estimate the sales volumes to RPP and Non-RPP
customers on a monthly basis? ii) How does Hydro 2000 estimate the purchase volumes on a monthly
basis? iii) How does Hydro 2000 calculate the RPP and Non-RPP % of the total
volumes? iv) Please use the month of November 2018 as an example to illustrate the
above three questions. b) Given the RPP settlement process is essentially the formula of (RPP-HOEP-GA)
for the utility’s RPP customers, please clarify the statement that “ the claim made is RPP kWh sold divided by total kWh sold multiplied by the GA paid” because the statement indicates that only the RPP portion of the global adjustment is being claimed. Please confirm that Hydro 2000 is claiming the energy part (i.e. RPP-HOEP) on its RPP settlement monthly.

35
c) Please clarify the statement that “The rates used are the rates which are known at that time”. What exactly are the rates used? Is it the Global adjustment 1st estimate, 2nd estimate or actual of prior month?
9-Staff-60 Ref: The Inspection Report by the OEB’s Audit and Inspection Department, pages 7-8; DVA Workform, Tab 2a; GA Analysis Workform
The OEB’s inspection report contains a number of findings for Hydro 2000’s Accounts 1588 and 1589 in 2015 and 2016.
Finding 7.1.1 is related to the RPP settlement process. The specific findings are for 2015 and 2016 balances:
1) Hydro 2000 has been late in claiming the initial RPP settlement by a month. 2) Hydro 2000 has been using calendar month billed consumption data directly
in its RPP settlements where the billed consumption adjusted for losses should be used as a basis to prorate the purchased volumes at the wholesale level to determine the appropriate RPP volumes for the RPP settlements.
3) Hydro 2000 didn’t use GA 2nd estimate posted on the IESO website in its RPP settlement calculation.
4) Hydro 2000 incorrectly reported tiered volumes at HOEP as the settlement amount for the tiered customers.
5) Hydro 2000 didn’t perform any true-up adjustments in the following month after submitting the initial settlement.
a) Please confirm whether Hydro 2000 has applied this finding, i.e. changed its
process for the RPP settlement, in the 2017 and 2018 transactions in Account 1588? Please address each of the detailed findings above separately.
9-Staff-61 Ref: Exhibit 9, Section 9.10.3 Embedded generation; The Inspection Report by the OEB’s Audit and Inspection Department, pages 13-15
Finding 7.3.1 of the OEB inspection report identified a number of errors with Hydro 2000’s EG settlement process with Hydro One, which affects the balances in Account 1588:
1) Hydro 2000 missed reporting the EG settlements for the period of April 2016 to December 2017, but did a catch-up settlement in December 2018.
2) Hydro 2000 has been late in claiming the EG settlements by a month outside the period mentioned in (1) above.
36
3) Hydro 2000 used incorrect contract rates in calculating the EG settlements for two MicroFIT customers for a nine-month period from April 2016 to December 2016.
4) Hydro 2000 didn’t track the actual on-peak and off-peak generated kWh for all three MicroFIT customers.
5) Hydro 2000 paid one customer incorrect rates for the generated volumes in certain months in 2016.
a) Please confirm whether Hydro 2000 has applied this finding, i.e. changed its
process for EG settlement with Hydro One, in the 2017 and 2018 transactions in Account 1588. Please address each detailed finding separately.
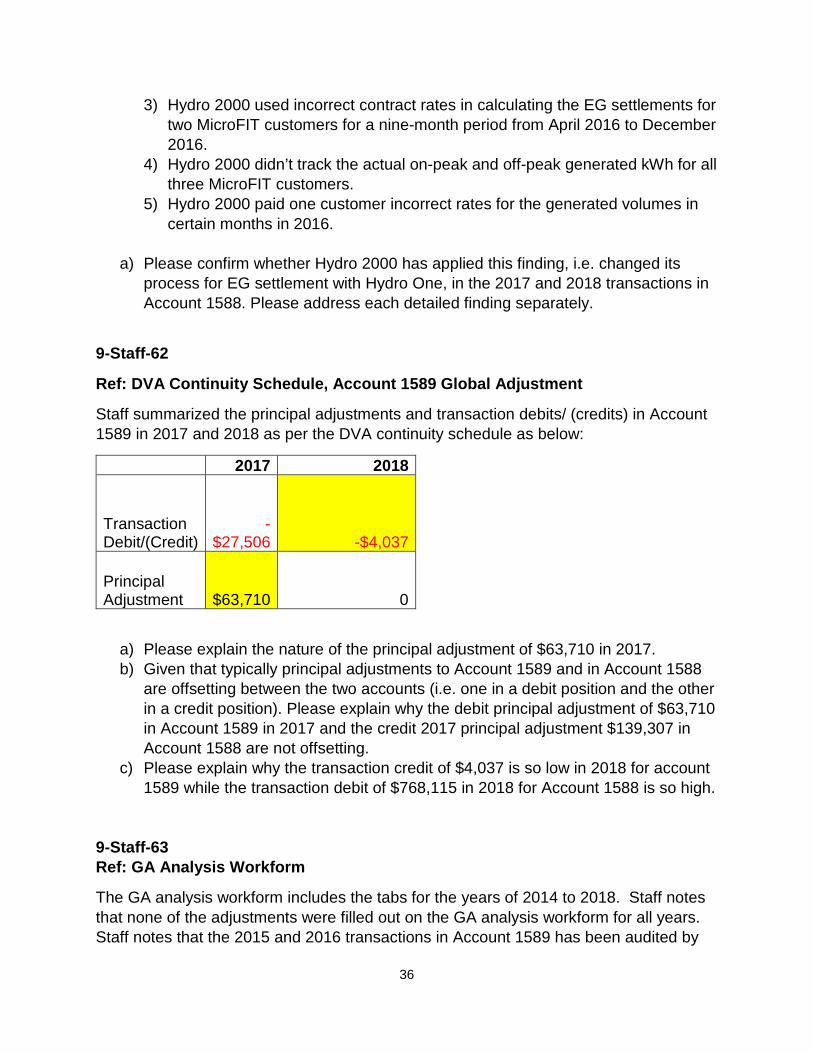
9-Staff-62
Ref: DVA Continuity Schedule, Account 1589 Global Adjustment
Staff summarized the principal adjustments and transaction debits/ (credits) in Account 1589 in 2017 and 2018 as per the DVA continuity schedule as below:
2017 2018
Transaction Debit/(Credit)
-$27,506 -$4,037
Principal Adjustment $63,710 0
a) Please explain the nature of the principal adjustment of $63,710 in 2017. b) Given that typically principal adjustments to Account 1589 and in Account 1588
are offsetting between the two accounts (i.e. one in a debit position and the other in a credit position). Please explain why the debit principal adjustment of $63,710 in Account 1589 in 2017 and the credit 2017 principal adjustment $139,307 in Account 1588 are not offsetting.
c) Please explain why the transaction credit of $4,037 is so low in 2018 for account 1589 while the transaction debit of $768,115 in 2018 for Account 1588 is so high.
9-Staff-63 Ref: GA Analysis Workform
The GA analysis workform includes the tabs for the years of 2014 to 2018. Staff notes that none of the adjustments were filled out on the GA analysis workform for all years. Staff notes that the 2015 and 2016 transactions in Account 1589 has been audited by

37
the OEB-ordered audit. OEB also notes that Hydro 2000 stated that the RPP and Non-RPP consumption data pulled from the RRR is inaccurate for 2017 and 2018.
a) Please provide the accurate numbers for the metered consumption in 2017 and 2018 that should have been submitted in the RRR:
In kWh 2017 2018 Total Metered Consumption RPP Non RPP
b) Please follow the GA Analysis Workform instructions to fill out the reconciling
items on 2017 and 2018 GA analysis workform. c) Please answer the questions in Appendix A to the GA Analysis Workform
Instructions. 9-Staff-64 Ref: DVA Workform Tab 2a, Account 1580 – Sub-account CBR Class B
Staff notes that Account 1580 sub-account CBR class B shows nil balances on the DVA continuity schedule and the RRR 2.1.7 trial balances show nil balances as well.
a) Please explain why are there no amounts shown on the DVA continuity schedule for Account 1580 Sub-account CBR Class B?
9-Staff-65 Ref: Exhibit 9, S.9.3.2, DVA Workform, Tab 2b, Account 1508
Hydro 2000 indicates a Dec 31, 2018 principal balance of $45,015 in Account 1508 on the DVA Workform.
Hydro 2000 also states in Exhibit 9, Section 9.3.2 the following:
“The one-time costs associated with the transition to IFRS were in relation to a preliminary analysis performed by Deloitte back in 2013 and the incremental cost related to IFRS of the year-end audit of 2015. OEB Appendix 2-YA is shown in Appendix A of this Exhibit.”
Staff did not find Appendix 2-YA.
a) Please provide Appendix 2-YA. 9-Staff-66

38
Ref: DVA Workform, Tab 2b, Account 1592; Exhibit 9, Section 9.3.1
Hydro 2000 requests the disposition of Account 1592 for a debit balance of $27,109, which is comprised of the following:
As per the DVA continuity schedule, Account 1592 and its sub-account balances are comprised of the following: Principal
balance as at Dec 31, 2018
Interest balance as at Dec 31, 2018
Projected Interest up to April 30, 2020
Total Claim
Account 1592 PILs and Tax variances
$19,299 $5,607 $561 $25,467
Account 1592 sub-account HST/ITC
-$5,001 $6,788 -$145 $1,642
Staff notes that the principal balance of $19,299 was entered by Hydro 2000 as the 2013 opening balance on the DVA continuity schedule.
a) Given that Hydro 2000 was rebased in 2012, please explain why there was an opening balance entered in 2013 for the PILs and tax variance.
b) Please explain the nature of the $19,299 entered as 2013 opening balance. c) Please provide the calculation for the $19,299 PILs and tax variance.
9-Staff-67 Ref: Exhibit 9, Section 9.9.2, Disposition of DVAs; Bill Impact Model, March 18, 2020
Hydro 2000 filed an updated bill impact model on March 18, 2020. As per the model, the bill impacts for all rate classes show bill increases. Hydro 2000 is proposing disposition of the DVA rate rider, the GA rate rider, the account 1576 rate rider over a 2-year period “in an effort to mitigate rates”.
Staff notes that the DVA rate rider for Group 1 DVAs excluding GA and the Account 1576 rate rider are credits to customers.
a) Given the credit balances in total DVAs excluding the Global Adjustment and Account 1576 would result in refunds to customers, please confirm that a two-

39
year disposition period for the DVA and Account 1576 rate riders is not needed to mitigate rates, and that these rate riders should instead be disposed over the default one-year period. i. if confirmed, please provide an updated DVA Workform and relevant
models/schedules with one-year disposition period. ii. if not, please explain why not.
9-Staff-68 Ref: Appendix 2-EC; Appendix 2-BA
As per the review of the Appendix 2-BA, staff notes the disposals from 2015 to 2020 under the revised CGAAP and under former CGAAP as below:
2015 2016 2017 2018 2019 2010 Under revised CGAAP Disposals – Cost
-21,079 -8,101 -2,553 -7,118 -5,000 -5,000
Disposals – Accumulated Depreciation
-1,936 -1,660 -774 -1,600 -2,000 -2,000
Under Former CGAAP Disposals – Cost
-5,000 -5,000
Disposals – Accumulated Depreciation
-2,000 -2,000
It appears that Hydro 2000 has included disposal amounts in 2019 “Net Additions” and “Net Depreciation” figures under former CGAAP and under revised CGAAP in Appendix 2-EC but did not include any other years’ disposals into the “Net Additions” and “Net Depreciations” figures.
a) Please explain why there are disposals under former CGAAP in 2019 and 2020? b) Given that Account 1576 is to record the accounting differences resulting from
the changes of the capitalization and depreciation policies, please explain why the net additions and net depreciations in 2019 of the Appendix 2-EC includes the disposals under both revised CGAAP and former CGAAP?
c) Please update the Appendix 2-EC and Appendix 2-BA as applicable based on the answers to the above questions.
9-Staff-69 Ref: Appendix 2-EC, Appendix 2-BA
40
In Appendix 2-EC, Hydro 2000 noted that the Net Depreciation under the revised CGAAP in 2015 was $51,900. However, in Appendix 2-BA, the addition to Accumulated Depreciation under MIFRS in 2015 was shown as $56,129.
a) Please clarify which number is correct and update the relevant schedule accordingly.