re-reading urbanization experience of istanbul; …
TRANSCRIPT

i
RE-READING URBANIZATION EXPERIENCE OF ISTANBUL;
THROUGH CHANGING RESIDENTIAL MOBILITY BEHAVIOUR
OF HOUSEHOLDS
A THESIS SUBMITTED TO
THE GRADUATE SCHOOL OF NATURAL AND APPLIED SCIENCES
OF
MIDDLE EAST TECHNICAL UNIVERSITY
BY
EBRU KAMACI
IN PARTIAL FULFILMENT OF THE REQUIREMENTS
FOR
THE DEGREE OF DOCTOR OF PHILOSOPHY
IN
CITY AND REGIONAL PLANNING
FEBRUARY 2012
ii
Approval of the thesis:
RE-READING URBANIZATION EXPERIENCE OF ISTANBUL;
THROUGH CHANGING RESIDENTIAL MOBILITY BEHAVIOUR OF
HOUSEHOLDS
submitted by EBRU KAMACI in partial fulfilment of the requirements for the
degree of Doctor of Philosophy in City and Regional Planning Department,
Middle East Technical University by,
Prof. Dr. Canan ÖZGEN ……………………………...
Dean, Graduate School of Natural and Applied Science
Prof. Dr. Melih ERSOY ………………………………
Head of City and Regional Planning
Prof. Dr. Oğuz IŞIK ………………………………
Supervisor, City and Regional Planning Dept., METU
Examining Committee Members:
Prof. Dr. Ali TÜREL ...……………………………
City and Regional Planning Dept., METU
Prof. Dr. Oğuz IŞIK ………………………………
City and Regional Planning Dept., METU
Assoc. Prof. Dr. Ayşe GÜNDÜZ HOŞGÖR ………………………………
Sociology Dept., METU
Prof. Dr. Tansı ŞENYAPILI ………………………………
City and Regional Planning Dept., METU
Assoc. Prof. Dr. Çiğdem VAROL ………………………………
City and Regional Planning Dept., Gazi University
Date: 10 February 2012

iii
I hereby declare that all information in this document has been obtained and
presented in accordance with academic rules and ethical conduct. I also declare
that, as required by these rules and conduct, I have fully cited and referenced
all material and results that are not original to this work.
Name, Last name: Ebru KAMACI
Signature :
iv
ABSTRACT
RE-READING URBANIZATION EXPERIENCE OF ISTANBUL;
THROUGH CHANGING RESIDENTIAL MOBILITY BEHAVIOUR OF
HOUSEHOLDS
KAMACI, Ebru
Ph.D., Department of City and Regional Planning
Supervisor: Prof. Dr. Oğuz IŞIK
February 2012, 212 pages
In 2000 more than one fifth of Istanbul’s population lived in a different place than
their place of residence five years ago. If we consider that the 2000 population of
Istanbul was around some 9.2 million, this figure means that nearly 2 million people
were not living in 2000 where they used to live in 1995. Of these two million
mobiles, more than half (11.5% of total) were intra-urban movers who moved from
one district to another in Istanbul in the same period. Changing the place of residence
can be seen as one of the major sources of changing in the socio-spatial composition
of a city. In the case of Istanbul, intra-urban mobility or Residential Mobility is the
major process that redistributes people in the city since the 1990s. In simplistic
words, Residential Mobility is one of the fundamental decision making process
which in turn is influenced by macro processes of economic, social and demographic
changes in urban setting of a city which are also the determinants of urbanization,
and the urban setting of a city is an outcome of mobility decisions of households at

v
the aggregate level. In this regard, this study on residential mobility behaviours of
households in Istanbul presents an avenue to further our understanding of the
urbanization experience of Istanbul. In the broader context, this study focusses on the
period between 1980 and 2000. It is well-known that the post-1980 period shows
quite different urbanization setting from the former ones in terms of demographic,
economic, political and socio-spatial settings in the world, as well as in Turkey.
Within this backdrop, changing characteristics of population as that of economic
structure provides unique backdrop to explore how residential mobility changes in
metropolitan areas. Moreover, this study is an attempt to reach clear understanding of
residential mobility which is one of the poorly understood and studied dynamics of
Turkish urbanization.
Key words: Residential Mobility, Neighbourhood Change, Urban Social Geography,
Housing, Urbanization

vi
ÖZ
HANEHALKLARININ DEĞİŞEN KONUT HAREKETLİLİĞİ ÜZERİNDEN
İSTANBUL KENTLEŞMESİNİN YENİDEN OKUNMASI
KAMACI, Ebru
Doktora, Şehir ve Bölge Planlama Bölümü
Tez Yöneticisi: Prof. Dr. Oğuz IŞIK
Şubat 2012, 212 sayfa
2000 yılı İstanbul nüfusunun beşte birinden fazlası beş yıl önce yaşadığı yerden
başka bir yerde yaşamaktadır. İstanbul’un 2000 yılı nüfusunun yaklaşık olarak 9,2
milyon olduğu kabul edildiğinde, bu yaklaşık 2 milyon kişinin 1995 ve 2000 yılları
arasında oturdukları yeri değiştirmiş olduğu anlamına gelmektedir. Bu iki milyon
kişinin yarısından fazlasını (toplamın %11,5’i) İstanbul’un ilçelerinden birinde
bulunan konut alanından yine İstanbul içinde fakat başka bir ilçede bulunan konut
alanına göç edenler -kent içi hareketliler- oluşturmaktadır. İnsanların bir konut
alanından başka bir konut alanına doğru hareket etmesi, başka bir değişle kent içi
hareketlilik, kentlerin sosyo-mekânsal kompozisyonunu şekillendiren en önemli
süreçlerden biri olarak görülmektedir. Bu anlamda, kentleşme dinamikleri ile kent içi
yer değiştirme arasında sıkı ve birbirini besleyen bir ilişki olduğu çok açıktır. Ne var
ki Türkiye kentleşmesi üzerine yapılan çok az sayıda çalışmada nüfusun kent-içi
hareketlilik süreçlerine değinilmiştir. Bu anlamda, 1980-2000 dönemini kapsayan ve
İstanbul kenti özelinde yapılan bu çalışma önemli bir açığı kapatır niteliktedir.
Bilindiği gibi, 1980 sonrası dönem demografik, ekonomik, politik ve mekânsal

vii
anlamda önceki dönemlerden dikkate değer bir şekilde ayrılmaktadır. Türkiye’de
yaşanan bu hızlı yeniden yapılanma süreçlerinin tüm boyutlarının incelenmesinde
İstanbul kenti benzersiz bir laboratuvardır. Kentin sosyo-mekânsal yapısında yaşanan
bu dönüşümler, hane halklarının kent içi yer değiştirme dinamikleri üzerine çalışmak
için ise benzersiz bir olanak sağlamaktadır. Fakat burada belirtmem gerekir ki, bu tez
sadece İstanbul’da 1985-1990 ve 1995-2000 dönemlerinde hane halklarının kent içi
hareketlerini incelemeyi değil, bu noktadan hareketle Türkiye kentleşmesine dair de
söz söyleme hakkına sahip olmayı hedeflemektedir.
Anahtar Kelimeler: Kent-içi hareketlilik, Sosyal Coğrafya, Kentsel
Değişim/Dönüşüm, Kentleşme

viii
ACKNOWLEDGMENT
First and foremost, I would like to express my sincere gratitude to my advisor, Prof.
Dr. Oğuz Işık who introduced me to the field of residential mobility, for his
supervision, advice, and guidance and patient from the very early stage of this
research as well as giving me extraordinary experiences throughout the study. I have
been extremely lucky to have a supervisor who cared so much about my work, and
who responded to my queries so promptly. His truly scientist intuition has made him
as a constant oasis of ideas and passions in science, which exceptionally inspire and
enrich my growth as a student, a researcher and a scientist want to be. I am indebted
to him more than he knows. I could not have imagined having a better advisor and
mentor for my PhD study. Thank you.
I also gratefully thank to Prof. Dr. Ali Türel and Assoc. Prof. Dr Ayşe Gündüz
Hoşgör, for their advice and constructive comments on this thesis. I also thank to the
other members of my dissertation committee, Prof. Dr. Tansı Şenyapılı and Assoc.
Prof. Dr. Çiğdem Varol for their guidance and suggestions. I am thankful that in the
middle of all their activity, they accepted to be members of my thesis committee.
My warm thanks to Prof. Dr. Tansı Şenyapılı from whom I have learned a lot during
my assistantship in METU. I appreciate all her contributions of time and ideas on my
dissertation. I am also thankful for the excellent example she has provided me as a
successful woman and professor. It is an honour for me to be her student.
Particularly, I would like to express my gratitude to and deep appreciation to Assoc.
Prof. Dr. Nil Uzun, for giving me an opportunity to be a lecturer, her endless support
and guidance on my academic and personal careers. I also thank to Assoc. Prof. Dr.
Özcan Altaban, Part-time instructor Önder Şenyapılı and Assoc. Prof. Dr. Ela

ix
Babalık Sutcliffe for sharing their experience, memories and knowledge.
I would like to thank to the staff of the Department of City and Regional Planning
especially Halime Çapan and Hayriye Seherli, for their help throughout the study.
Last but not the least; I owe much to my family Nazire, Altan and my sweet brother
Hasan Emrah Kamacı, for their endless love, understanding and support. I need to
express my gratitude and deep appreciation to my dear friends Laçin, Bilge, Ayşegül,
Süphan, Anıl, Nermin, Gözde, Gül and Çiğdem for all the emotional and academic
supports during my research and writing efforts over the years.
Finally, I would like to thank everybody who was important to the successful
realization of thesis, as well as expressing my apology that I could not mention
personally one by one.

x
TABLE OF CONTENTS
ABSTRACT ................................................................................................................ iv
ÖZ ............................................................................................................................... vi
ACKNOWLEDGMENT ........................................................................................... viii
TABLE OF CONTENTS ............................................................................................. x
LIST OF TABLES ..................................................................................................... xv
LIST OF FIGURES ................................................................................................ xviii
LIST OF ABBREVIATIONS ................................................................................... xxi
CHAPTER
1. INTRODUCTION ................................................................................................... 1
2.THE BIG PICTURE: SOCIAL, ECONOMIC AND SPATIAL CHANGE IN
ISTANBUL IN THE POST-1980 PERIOD .............................................................. 15
2.1 Introduction ...................................................................................................... 15
2.2 The Non-spatial Changes on the city of Istanbul ............................................. 16
2.2.1 Demographical Profile .............................................................................. 16
2.2.1.1 Istanbul’ Population still keeps growing with a slight decrease in
growth rate ..................................................................................................... 17
2.2.1.2 Population is ageing ........................................................................... 18
5.2.1.3 Significant changes in traditional household typology: small
household and nuclear family ........................................................................ 23
2.2.1.4 Population becomes more educated ................................................... 25
2.2.2 Changes in the Economy ........................................................................... 25
2.2.2.1 Service Sector is on the Increase ........................................................ 26
2.2.2.2 Changes in Labour Force: Decrease in Youth Labour Force
Participation Rate and Slight Increase in Female Labour Force Participation

xi
Rate ................................................................................................................ 28
2.3 The Spatial Changes on the city of Istanbul..................................................... 32
2.3.1 Decentralization of Industry ...................................................................... 32
2.3.2 Decentralization of Central Business District ........................................... 33
2.3.3 Decentralization of Residential Areas ....................................................... 34
2.3.4 Changes in Housing Industry .................................................................... 36
2.3.4.1 The period between 1985 and 2003: the housing industry is provoked
........................................................................................................................ 36
5.3.2.2 The post-2003 period: Does the housing industry deal with quantity
anymore? ........................................................................................................ 39
2.4 Conclusion........................................................................................................ 49
3. RESIDENTIAL MOBILITY AS A FUNCTION OF LIFE CYCLE .................... 51
3.1 Introduction ...................................................................................................... 51
3.2 Defining Residential Mobility .......................................................................... 52
3.3 Theoretical Perspectives on Residential Mobility............................................ 55
3.3.1 Economically-Oriented RM Studies: Economists’ Utility Maximization
Approach to RM ................................................................................................. 56
3.3.2 Behaviourally-Oriented RM Studies: Domination of Sociologists’ Life-
Cycle Approach to RM ...................................................................................... 57
3.4 Changes on Households ................................................................................... 68
3.4.1 Socio-Demographic Characteristics of Households ................................. 68
3.4.1.1 Age ..................................................................................................... 69
3.4.1.2 Household Size .................................................................................. 70
3.4.1.3 Household Typology or Family Type ................................................ 70
3.4.1.4 Education............................................................................................ 71
3.4.2 Economic Characteristics of Households ................................................. 71
3.4.2.1 Employment ....................................................................................... 71
3.4.2.2 Tenure Profile..................................................................................... 72
3.5 Conclusion........................................................................................................ 72
xii
4. MOVERS: WHO ARE THEY? ............................................................................. 75
4.1 Introduction ...................................................................................................... 75
4.1.1 Methods and Variables of the Analysis .................................................... 76
4.1.1.1 The Methods of the Analysis: Percentage Distribution and LQ ........ 76
4.1.1.2 Variables of the Analysis ................................................................... 78
4.2 The Findings..................................................................................................... 82
4.2.1 Demographic Profile ................................................................................. 82
4.2.1.1 Age: The younger the more mobile ................................................... 83
4.2.1.2 Household size: The smaller household the more mobile ................. 87
4.2.2 Household Typology ................................................................................. 91
4.2.2.1 Single Persons become more mobile between 1990 and 2000 .......... 93
4.2.2.2. Couples are more mobile than Single Parents................................... 94
4.2.2.2 The more child the less mobility ........................................................ 94
4.2.2.3 Female-headed Single Parents are more mobile than Female Single
Person ............................................................................................................. 95
4.2.3 Social Profile ............................................................................................. 96
4.2.3.1 Education levels: The level of education increases the rate of mobility
increase. .......................................................................................................... 96
4.2.4 Economic Profile ..................................................................................... 104
4.2.3.1 Labour force status: Employers are more mobile than wage-earners
...................................................................................................................... 104
4.2.3.2 Occupation and Employment sectors: Employing in FIRE has an
increase effect on RM of households ........................................................... 109
4.3 Conclusion...................................................................................................... 114
5. RESIDENTIAL MOBILITY AS A RESTRUCTURING PROCESS OF URBAN
GEOGRAPHY ......................................................................................................... 117
5.1 Introduction .................................................................................................... 117
5.2 Macro Approaches to Residential Mobility ................................................... 119
5.3 Relating Residential Mobility to the Urban Structure.................................... 121

xiii
5.3.1 Residential Mobility and Neighborhood Change .................................... 121
5.3.2 Neighbourhoods Effects and Residential Mobility ................................. 125
5.3.3 Residential Mobility and Ethnicity and Race ......................................... 129
5.3.4 Residential Mobility and Residential Segregation .................................. 130
5.5 Conclusion...................................................................................................... 131
6. RESIDENTIAL MOBILITY AND URBAN GEOGRAPHY OF ISTANBUL:
DOES RM MATTER? ............................................................................................. 133
6.1.1 Graph Analysis: Flow Priority Graph and From/To Matrix ................... 135
6.1.1.1 Flow Priority Graph ......................................................................... 136
6.1.1.2. From/To or Flow Matrix ................................................................. 137
6.1.2 The Socio-economic Development Index ............................................... 138
6.2 Findings: The Effects of RM on Urban Setting ............................................. 141
6.2.1 RM and Urban Form ............................................................................... 142
6.2.1.1 There is a tendency to move towards periphery............................... 142
6.2.1.2 People tend to leave from historical core of the city ........................ 147
6.2.1.3 High-educated people diffused from inner-city ............................... 148
6.2.1.4 D-100 is not a boundary any longer for high-educated households. 150
6.2.1.5 People tend to move short distance in the city: Proximity matters .. 152
6.2.1.6 High-educated Households Move Further than Low-educated
Households ................................................................................................... 154
6.2.1.7 Low-educated households stuck in one-side of the city................... 155
6.2.2 Built Environment ................................................................................... 160
6.2.2.1 There is a tendency towards new residential areas in the city ......... 160
6.2.3 Social Environment ................................................................................. 162
6.2.3.1 People Tend To Move Mostly among Relatively Similar Development
Status Districts ............................................................................................. 163
6.2.3.2 Mobility changes the population composition of districts ............... 165
6.2.3.3 High-educated households tend to live households with similar profile
...................................................................................................................... 171
xiv
6.3 Conclusion...................................................................................................... 174
7. CONCLUDING REMARKS ............................................................................... 176
REFERENCES ......................................................................................................... 188
APPENDICES
A. The selected RM researches and the methods, variables and the findings of
selected researches ................................................................................................... 206
B. Distance Matrix ................................................................................................... 208
C. The Method used for highlighting the effects of Movers on socio-economic
Development Index .................................................................................................. 209
D. The hierarchical clustering of districts in terms of their distance to each other .. 210
CURRICULUM VITAE ......................................................................................... 211
xv
LIST OF TABLES
TABLES
Table 2.1: Selected housing projects in Istanbul ........................................................ 43
Table 4.1: LQ Formula ............................................................................................... 77
Table 4.2: Revised LQ Formula ................................................................................. 77
Table 4.3: The variables of the first-level analysis of the thesis ................................ 80
Table 4.4 : Age profile of the movers, non-movers, migrants and Istanbul in data set-
1990 ........................................................................................................... 83
Table 4.5: Age profile of the movers, non-movers, migrants and Istanbul in data set-
2000 ........................................................................................................... 84
Table 4.6: Household size profile of the movers, non-movers, migrants and Istanbul
in 1990 ....................................................................................................... 87
Table 4.7: Household size profile of the movers, non-movers, migrants and Istanbul
in 2000 ....................................................................................................... 88
Table 4.8: Household typology of the movers, non-movers, migrants and Istanbul in
2000 ........................................................................................................... 92
Table 4.9: Distribution of selected family type profiles of Movers by sex in 2000 .. 95
Table 4.10: Education attainment level of the movers, non-movers, migrants and
Istanbul in data set-1990 ............................................................................ 96
Table 4.11: Education attainment level of the movers, non-movers, migrants and
Istanbul in data set-2000 ............................................................................ 97
Table 4.12: Labour force status of the movers, non-movers, migrants and Istanbul in
data set-1990 ............................................................................................ 105
Table 4.13: Labour force status of the movers, non-movers, migrants and Istanbul in
data set-2000 ............................................................................................ 106
Table 4.14: The distribution of the movers, non-movers, migrants and Istanbul by
selected employment sector in 1990 ........................................................ 109

xvi
Table 4.15: The distribution of the movers, non-movers, migrants and Istanbul by
selected employment sector in 2000 ........................................................ 110
Table 4.16: The distribution of the movers, non-movers, migrants and Istanbul by
occupations in 2000 ................................................................................. 112
Table 4.17: The LQ analysis of movers: cross tabulation of employment sector and
education in 2000 .................................................................................... 114
Table 5.1: A typology of neighbourhood change ................................................... 125
Table 6.1: The Formula of Flow-Priority Index-a ................................................... 139
Table 6.2: The Formula of Flow-Priority Index-b ................................................... 139
Table 6.3: The Formula of In-comers Index ............................................................ 139
Table 6.4: The Formula of Out-goers Index ............................................................ 139
Table 6.5: Input variables for the Development Index ............................................ 139
Table 6.6: The formula of Normalization ................................................................ 140
Table 6.7: The Formula of Socio-economic Development Index ............................ 141
Table 6.8: Sub-groups of districts by construction period of housing stock in Istanbul
................................................................................................................. 143
Table 6.9: Priority Index From/To matrix, the In-comers and Out-goers Indices of
Istanbul for sub-groups in 2000 ............................................................... 143
Table 6.10: In-comers and Out-goers Indices of Districts both in 1990 and in 2000
................................................................................................................. 145
Table 6.11: In-comers and Out-goers Indices of inner-zone districts both in 1990 and
in 2000 ..................................................................................................... 147
Table 6.12: High-educated households’ In-comers and Out-goers indices both in
1990 and in 2000 ..................................................................................... 149
Table 6.13: Flow Priority Index by district in 2000 ................................................. 153
Table 6.14: Low-educated households’ In-comers and Out-goers indices both in 1990
and in 2000 .............................................................................................. 157
Table 6.15: Sub-groups of districts regarding the socio-economic development index
value in 2000 ........................................................................................... 163

xvii
Table 6.16: From/To Matrix (Priority Index) in 2000 ............................................. 164
Table 6.17: Contributions of Movers and Migrants on the change in Development
Index, by Districts in 2000 ...................................................................... 167
Table 6.18: Share of high-educated households for existing, and immobiles; and the
contribution of movers and migrants on the rate of change in high-
educated households, by Districts in 2000 .............................................. 173

xviii
LIST OF FIGURES
FIGURES
Figure 1.1: The Diagram of the Thesis ..................................................................... 14
Figure 2.1: The urbanization ratio and annual growth rate of Istanbul and Turkey .. 17
Figure 2.2 Population pyramid of Turkey in 1980 ..................................................... 20
Figure 2.3: Population pyramid of Istanbul in 1980 .................................................. 20
Figure 2.4: Population pyramid of Turkey in 2008.................................................... 21
Figure 2.5: Population pyramid of Istanbul in 2008 .................................................. 21
Figure 2.6: Youth Dependency Ratio and Fertility Rate for Istanbul and Turkey. .... 22
Figure 2.7: The share of manufacturing, construction and FIRE sub-sectors for
Turkey and Istanbul and the share of service employment of Turkey and
Istanbul, between the years 1970 and 2008............................................. 27
Figure 2.8: Youth, Elderly and Secondary School Graduates Labour Force
Participation Rate for Turkey, 1988-2008............................................... 30
Figure 2.9: For Turkey, the Share of housing investment in GDP, the share of Public
and Private Sector housing investments in GFI between 1970 and 2007 37
Figure 2.10: The total number of starts and the share of cooperatives in total starts for
Turkey and Istanbul in the period 1970-2007 ......................................... 38
Figure 2.11: The diversification of 50-74 sq m dwellings with reference to number of
room in Turkey ........................................................................................ 45
Figure 2.12: The share of dwellings in total occupancy permits with reference to sq
m between 2000 and 2009 in Istanbul ..................................................... 46
Figure 2.13: The diversification of 50-74 sq m dwellings with reference to number of
room in Istanbul ...................................................................................... 48
Figure 2.14: The Transformation of Istanbul ............................................................. 50
Figure 3.1: RM and its embeddedness in three geographical scales .......................... 54
Figure 3.2: Brown and Moore’s RM model (1970) ................................................... 60

xix
Figure 3.3: Modified RM model of Brown and Moore ............................................. 61
Figure 3.4: Speare’s RM model (Speare, 1974) ......................................................... 62
Figure 3.5: Modified model of relationship between housing demand and RM ....... 63
Figure 3.6: Chronology of the main themes of RM literature ................................... 74
Figure 4.1: The formulation steps of study data-sets ................................................. 79
Figure 4.2: RM rate of movers in terms of age in 1990 and 2000 ............................. 85
Figure 4.3: RM rate of movers in terms of household size both in 1990 and 2000 ... 90
Figure 4.4: RM rate of movers in terms of family type in 1990 and 2000 ................ 93
Figure 4.5: RM rate of movers in terms of education attainment levels in 1990 and
2000 ......................................................................................................... 98
Figure 4.6: The LQ analysis of movers: cross tabulation of age and education levels
for 1990 and 2000 ................................................................................. 101
Figure 4.7: The LQ analysis of movers: cross tabulation of household size and
education levels for 1990 and 2000....................................................... 102
Figure 4.8: The LQ analysis of movers: cross tabulation of family type and education
levels in 2000 ........................................................................................ 103
Figure 4.9: RM rate of movers in terms of labour force status in 1990 and 2000 ... 107
Figure 4.10: LQ analysis of movers: cross tabulation of labour force status and
education levels for 1990 and 2000....................................................... 108
Figure 4.11: The LQ analysis of movers: cross tabulation of Employment sector and
education levels both in 1990 and in 2000 ............................................ 111
Figure 4.12: The findings of analysis (Who are movers)......................................... 116
Figure 5.1: The system formed by mobility flows and the structuration of space ... 118
Figure 5.2: The principal components of neighbourhood change............................ 122
Figure 5.3 : Relationship between RM, neighbourhood composition and housing
stock. ..................................................................................................... 124
Figure 6.1: The FROM/TO Matrix .......................................................................... 138
Figure 6.2: Priority Flows of Istanbul in 1990 ......................................................... 146
Figure 6.3: Priority Flows of Istanbul in 2000 ......................................................... 146

xx
Figure 6.4: Priority Flows of High-educated households in 1990 ........................... 151
Figure 6.5: Priority Flows of High-educated households in 2000 ........................... 151
Figure 6.6: Priority Flows of low-educated households in 1990 ............................. 158
Figure 6.7: Priority Flows of low-educated households in 2000 ............................. 158
Figure 6.8: Housing stock by age and the in-comers index of districts in 2000 ...... 161
Figure 6.9: Socio-economic development Index, the contribution (%) by movers and
migrants to development Index, by districts in 2000 ............................ 166

xxi
LIST OF ABBREVIATIONS
RM Residential Mobility
HDA Housing Development Agency

1
CHAPTER 1
INTRODUCTION
In 2000 more than one fifth of Istanbul’s population lived in a different place than
their place of residence five years ago. If we consider that the 2000 population of
Istanbul was around some 9.2 million, this figure means that nearly 2 million people
were not living in 2000 where they used to live in 1995. Of these 2 million “mobiles”
nearly half (9.5% of the total) were migrants coming from a different city. The
remaining 1 million inhabitants of Istanbul moved in the 5-year period between 1995
and 2000 from one district to another.1 In other words, the percentage of intra-urban
mobile people (hereafter “movers”) in total population of Istanbul was approximately
11.5% in 2000. Although we do not have data for those who changed their house
within the same district, the figures available refer to a massive mobility of people at
any measure.
Changing the place of residence can be seen as a major source of the changes in the
socio-spatial composition of a city. Residential changes are usually categorized into
two: migration and intra-urban or residential mobility. In the case of Istanbul the
picture above shows that residential mobility is one of the major processes that
redistribute people in the city since the 1990s. However, research on residential
mobility in Turkey is relatively poor compared to the well-developed literature on
1 While the data of this study do not provide information on intra-districts moves (the moves within
the same districts), in this study intra-urban mobility or residential mobility refers only to the moves
from one district to another. In a same manner, the intra-urban mobile people or “the movers” refer to
people who moved from one district to another in this thesis.

2
migration. Although our knowledge on the causes and effects of migration is almost
complete, research on residential mobility is very limited in terms of theories
describing residential mobility and modelling residential mobility flows.
Residential mobility (hereafter termed as “RM”) is the fundamental process that
reallocates people within a city. Numerous definitions of RM can be found in the
literature ranging from “decision-making process” to “spatial adjustment process” or
“a function of the household’s dissatisfaction” or “a result of changes in housing
needs”. Nevertheless mobility commonly refers to the local moves of population
within a neighbourhood, city, or metropolitan area and also involves adjustment
mechanism (Cadwallader, 1992; Clark and Onaka, 1983; Clark, et al., 2003,
Dieleman, 2001). However, the most cited definition of RM is driven by a mismatch
between a household’s residential needs and preferences as well as the household’s
desire to come to a better matching between the household’s space requirements
(Brummel, 1979; Clark, et al., 1984; Doorn and Van Rietbergen, 1990).
RM studies can conveniently be divided into micro- and macro approaches
(Cadwallader, 1992; Moore, 1972; Dieleman, 2001; Quigley and Weinberg, 1977;
Golledge and Stimson, 1997). What is referred to as micro or disaggregate approach
is usually characterized by an interest in the characteristics of movers and concerned
with the construction of models that represent the individual decision-making
process involved in RM (Quigley and Weinberg, 1977; Cadwallader, 1982, 1992;
Clark and Huang, 2003; Clark, 2009). This involves mainly a consideration of why
people do or do not move in line with the classical life-cycle approach developed by
Rossi as early as 1955. On the contrary, the macro or aggregate approach is used in
two main contexts: first, to analyse the spatial pattern of mobility flows, and second,
to establish the interrelationships between mobility flows and other features of the
urban geography, such as socio-economic, demographic, and housing characteristics
(Moore, 1972; Cadwallader, 1992; Quigley and Weinberg, 1977).
3
While there are numerous studies of micro approach the macro-approach RM studies
is very limited in number. One of the aims of this study is to examine the relationship
between RM and urban change so I prefer to use macro approach in order to
highlight the characteristics of movers, the spatial patterns of RM flows and the
interrelationships between mobility rates/levels and urban setting at the aggregate
level. The findings of such patterns would indicate that the moves of households
could be influenced by something else, something affects the movers to choose move
to the specific residential areas, a stimulu also termed as the “neighbourhood effect”.
The urban setting (the built environment, structure, form and processes of change in
the city: economic, demographic and social) evolves over time through processes
that include decision-making actions at the public, corporate, group and individual
levels within a broad political, social and economic domain. In this respect, RM is
one of the influential decision making processes which in turn is influenced by macro
processes of economic, social and demographic changes in urban setting of a city
which are also the determinants of urbanization, and the urban setting of a city is an
outcome of RM decisions of individuals or people at the aggregate level. In this
thesis, space is taken as urban space and to be specific, it is taken as the metropolitan
urban space of the city of Istanbul, Turkey. In this regard, the study on RM of
households in Istanbul presents an avenue to further our understanding of the
urbanization experience of Istanbul. And, I believe that a closer look at the changes
in RM processes of households can be useful in understanding the transformation of
the urban settings of Istanbul, since this study does not only focus on the RM
process of households, but also aims to carry it to the macro-scale debates on the
city.
This study examines RM in Istanbul in two-periods: 1985-1990 and 1995-2000. In
the broader context, this study focuses on the 1980-2000 period. The urbanization
experience of Turkey in this period has extensively been studied by several scholars

4
(Danielson and Keleş, 1985; Tekeli, 1994; Işık, 1996; Güvenç and Işık, 1996; Kıray,
1998, Erkip, 2000; Işık and Pınarcıoğlu, 2003; Erder, 1997, 2006; Keyder, 2006;
Alkay, 2011). Briefly, in the post-1980 period, significant changes took place in
Turkey’s socio-spatial structure, especially in Istanbul. Rapid urbanization, economic
growth, ageing of population, changing family typology, the concentration of
financial institutions and service industry, the development of new economic sectors,
growing occupational differentiation and specialization are among the new dynamics
that one can refer to, transforming the city’s social and economic structure, and
creating new life-styles. In simplistic words, these represent fundamental
demographic, economic and social changes affecting mobility decisions and the
nature of mobility behaviour in the city.
Since the 1980s, Istanbul has undergone a radical restructuring towards becoming
what is referred to as ‘globally connected city’ (Öncü and Keyder, 1993; Keyder,
1999a, 2005, 2006). This restructuring has its impact on urban systems, physical set-
up, social structure and finally on the growth of Istanbul. For some, Istanbul has also
experienced the “dark side” of globalisation process with rising income inequalities,
growing social exclusion and cultural fragmentation, new modalities of social
cleavage and conflict previously unknown in the city (Keyder, 2005, 2009; Türkün
and Kurtuluş, 2005). Within this background, in this period, the contradiction among
urban social groups has significantly heightened and an unequal spatial distribution
has become more visible. Here, it should be noted that this restructuring includes
deep transformations of spatial organization and built environment.
Istanbul’ urban geography has changed by these restructurings. Mainly the increase
and diversification in service industry have a leading role in these transformations.
Compatible with this transformation; the office headquarters and giant shopping
malls, as well as new middle and upper-middle classes’ residential enclaves have
appeared on the geography of Istanbul. As a well-known fact, these new
5
development activities took place on the urban periphery of the city. While urban
periphery was home of low-income groups and available to the development of
irregular settlements in the previous periods, under the effects of these restructuring
process urban periphery has commoditised and has not home of urban masses (Geniş,
2007). The rising inequalities in the society and its influences in the social and
economic processes are also exposed in the residential location choice of population
of Istanbul. Within the city, these are the marked patterns of differentiations in the
economic and social fortunes of groups marked by segregation.
In Turkey, the state’s attitude towards urbanization and housing markets were
remarkable transformed both in the beginning of the 1980s and the mid-2000s (Öncü,
1988; Tekeli, 1994, Keyder, 1999b; Bozdoğan, 2002; Türel, 2002; Türel and Koç,
2007; Geniş, 2007; Özdemir, 2010). Since the second half of the 1980s, the role of
state on housing industry has increase and its mode of intervention has changed.
Accordance with this change, for financing housing a series of laws is enacted. With
the assistance of these regulations, not only large housing projects are directly
financed by HDA but also municipalities and cooperatives are indirectly financed by
Mass Housing Fund (Geniş, 2007). Former chair of HDA Bayraktar (2006, 2007)
stated that regarding the changed scope and powers of HDA in the mid-2000s, it is
oriented to construct not only housing units for middle and low-income people, but
also luxury housing and associated up-market consumer services for the upper-
middle and upper classes such as Trumptower, IstHANbul, Saphire and etc. In order
to support real estate sector as well as to develop new projects, the state enacts some
regulations such as working international banks and architect firms (Geniş, 2007).
Considering the positively correlated relationship between the differentiation level of
housing opportunities and RM in a city, it can be assumed that RM in the period
1980-2000 is diversified from former periods in terms of rate/level, direction,
distance as well as movers’ typology, in Istanbul.

6
It is well-known that the post-1980 period shows quite different urbanization settings
from the former one in terms of demographic, economic, political and socio-spatial
settings in the world, as well as in Turkey. In the post-1980 period, changing
characteristics of population as that of economic structure provides a unique
backdrop to explore how RM changes in metropolitan areas. This is in compatible
with the changes in socio-economic and demographic profiles of population- such as
the increase in single-person and single parent households or in the ageing of
population, etc. - and in the evolution of spatial development of the city such as de-
centralization, de-concentration, and suburbanization. Furthermore, the period 1980-
2000 can be conceptualised as the period when the concerns have shifted from
quantity to quality and the post-2000 as the period that the aesthetic and architectural
values of cities have gotten more influential. In this respect, the research into RM
processes of household heads2 in Istanbul presents an avenue to enlarge our
understanding of the urbanization experience of Istanbul as well as Turkey.
This study is an attempt to reach a clear understanding of RM which is one of the
poorly understood and scantly studied dynamics of Turkish urbanization. The aim of
this study is thus to highlight the causal relationship between the movers and the
urban space through the mediation of RM processes. In an attempt to achieve such a
broad aim, I ask two main questions: Who are the movers? And “What part does RM
have to play on the restructuring of urban setting? By doing this, I also intend to
narrow down such a broad objective of this study. A detailed description of this
formulation is mentioned later in the the study.
What I have said so far may indicate that I approach RM in a dual way: as a function
of life-cycle and as a spatial process which governs and shapes urban socio-spatial
setting. Behind this formulation, it is that while RM is a matching process between
2 In this thesis, the basic unit of the analysis is “housing head”. Due to the fact that the number of
household heads is equal to the number of households, instead of “household heads” in the later of
this study “household” is used.

7
household’s preferences and housing feature, it is right to say that the effects of RM
on urban geography of the city only occur if the characteristics of housing stock and
the preferences of changing households are matched. Implicit in these conditions is
the important assumption that the population is sufficiently mobile to match up social
status and life-cycle needs to existing housing opportunities.
As mentioned in the previous paragraph, I approach RM in two ways. Firstly, RM is
assumed to be a selective process that is differentiated by households’ life-cycle.
This approach helps me answer the first set of question that mainly aims to clarify:
the interrelation between RM and characteristics of movers at the aggregate level:
Who are the Movers? Is there any specific profile of Movers? Is there any specific
profile of movers both in 1990 and in 2000? Do households’ mobility rates differ in
terms of age, education, family typology and labour force status? Have the mobility
levels of households changed from 1990 to 2000? What is the exact nature of RM in
terms of household characteristics and how it relates to life-cycle, life-style and
status? Are households’ characteristics significant in RM? Does RM reflect the
changes of demographic and economic profile along with family typology of
households?
And secondly, RM is regarded as a general socio-economic and spatial process
which is also an important event for the person or household making the move, for
the place of origin and destination of mobility flows, and for the society as a whole.
Accepting this point of departure, I attempt to link social and spatial dimensions of
RM with reference to the changes in urbanization in the city. To what extent does
RM have effects on socio-economic and demographic profile of the city? Are
different patterns of residential moves identifiable in different districts? What
characteristics of districts contribute to the explanation of this variety? How does a
person’s area of residence affect his or her behaviour? How do the emerging RM
patterns affect the dynamic processes of urban settings? What have been the

8
probable roles of the mobility during the formation of urban setting of Istanbul in the
2000s?
While research on RM has been one of the popular topics among the social scientists
for a long time, almost nothing was written before 2000 in Turkey about the
motivations and spatial patterns of RM and its role on transforming cities. However,
after the mid-2000s RM researches in Turkey gained some popularity in academic
sphere. I account this increase is closely related the decline on rates of migration (for
example, in Istanbul the percentage of migrants in total households decreased from
14% 1990 to 9.5% the years between 1990 and 2000) and changes on direction of
migration (since the 1990s the city to village movement has been gained
momentum). A few studies address the RM of population including Türel’s (1979),
Aydemir’s (1984) studies in Ankara, Kocatürk and Bölen’s (2005) study in Kayseri,
Alkay’s (2011) and Erginli and Baycan’s (2011) studies in Istanbul. I believe, this is
partly related with the lack of available data and the difficulty of preparing RM
questionnaire; and partly because of the dominance of migration studies in Turkish
urbanization studies. In this respect, this study provides a case for the studies on RM
in Turkey since it examine RM at the aggregate or macro level, different from the
RM studies in Turkey that largely focus on the motivations of RM at the
disaggregate or micro level.
To analyse RM numerous methods are employed such as longitudinal weights (see
Fredland, 1974; Geist and McManus, 2008); regression analysis (see Hui et al,
2002); multivalve models (see Myers, Choi and Lee, 1997); discrete choice models
(see Kan, 1999).3 At the aggregate level RM is measured in either absolute terms or
as a rate. Absolute measures mostly describe movers regarding distributions by age,
sex, occupation, education level and so on, and mostly are used to examine
3 A detailed examination of the selected studies in terms of aim, data analysed, variable used and
method of analysis is given in Appendix A.

9
characteristics of movers. Rate measures are used to analyse the rate at which
geographic areas gain and lose movers in terms of their socio-economic and
demographic characteristics.
In this thesis, the analysis consists of two phases. The first phase of the analysis
examines the characteristics of movers (Chapter 4). Apart from the well-known
tendencies of RM studies, this thesis pays particular attention to the characteristics of
movers from a cross-sectional perspective. In doing so, I figure out the RM patterns
of sub-groups in terms of education, age, labour force status and etc. The other
methodological significance of the thesis is using LQ method in the RM analyses. By
doing so, unlike most of the researchers searching for RM, I take into account the
existing demographic and socio-economic characteristics of households such as
education, family type and etc. in the scale of districts as well as city. The first phase
of the analysis basically aims to answer the “who” question of the thesis that focuses
on identification and classification of the movers.
The second phase of the analysis examines the spatial flows between origins and
destinations and the causal relationship between urban settings of the city, at the
level of districts (Chapter 6). By doing this analysis, I focus my attention to
considering the way in which the processes of socio-economic restructuring and the
patterns of RM have been affecting urban setting of the city in the period between
1980 and 2000. Apart from the well-known spatial analysis methods of RM, in this
thesis, “flow priority graph” is chosen to examine residential moves, partly because
of the characteristics of data and partly because it is the most appropriate approach to
achieve the aim of the study. The common data base for most graph analyses is a
flow or FROM/TO matrix ( ). In this study, і (rows) and ј (columns) denote the
origin and destination districts in Istanbul. In 1990, the number of districts in Istanbul
19, so in 1990 Istanbul has 19 rows and 19 columns. The number of districts of
Istanbul reached to 32 in 2000. However, in 2000 Istanbul has 29 rows and 29

10
columns, due to the fact that districts located outside the Istanbul Greater
Municipality’s Boundary (Çatalca, Şile and Gebze) are excluded from the analysis.
Furthermore, the second phase of the analysis basically aims to answer the “where
and what” questions of the thesis which focus on identification of the effect of RM
on the existing urban setting of the city: How do residential moves influence the
socio-economic settings of the city in this period? In order to answer this broad
question, the Socio-economic Development Index, which is another methodological
contribution of this thesis, is developed at the district level. In this thesis, briefly, I
use “Who” and “Where” questions in order to improve my understanding on the
interactions among RM and the urban setting (built environment, and economic,
demographic and social processes), society, groups, space. And I consider that the
analytical framework of this thesis is appropriate to examine the city and to evaluate
its potential evolution over time.
The primary data used in the thesis are drawn from the 1990 and the 2000 Population
Census4, specifically the public use ‘microdata sample file’
5, which is a 5% sample
of households in Istanbul. The microdata sample file is depersonalized and includes
both household and non-household populations’ entities and it makes available to
form cross tabulation and recoding of the original variables and computing new
variables.6
4 These Population Censuses are carried out by the Turkish Statistic Institute (at the time of the
Census; SIS) in 1990 and in 2000. The main aim of these censuses is to determine demographic
profile of Turkey. According to this aim, population size, social and economic characteristics of
population living in providence, districts, sub-districts and village within Turkey was count. The
individuals were enumerated at the addresses where they live physically present on the census day (de
facto). The questionnaire of 1990 and 2000 Census are consisting of four main parts: address, the
characteristics of locality, the characteristics of people and the characteristics of households. The
individuals were considered as a basic unit of the census and de facto method has been used; they s
being enumerated at localities where they are physically present on the census day. 5 This is a five per cent sample and selected systematically from raw data file. In order to prepare
master sample file, the sample was selected from 100% census file and every 20th household and
every 20th individual in the non-household population was copied in order to construct this dataset. 6 Questions related to the characteristics of persons (with reference to this study-household headss)

11
One of the major limitations of this research is the lack of appropriate data that can
be calculated intra-district residential moves. This means that I only analyse the
moves of households between districts. In other words, the moves within the same
districts are not included in the analysis. Another important problem stems from the
fact that the boundaries of geographical units change considerably between the
censuses. The 1990 data covers only the districts within in metropolitan boundaries,
while the 2000 data covers all the districts. Consequently, the researchers who study
Istanbul have to be so careful while comparing the periods and generalizing the
assumptions through Istanbul. Moreover, these data provide no information on the
motivations underpinning RM flows, and they provide only limited data on
tendencies and changes in RM flows over time. In other words, there are no data
available at examining the reason for move, the attributes of neighbourhood, and the
income of households. Census variables emphasize usual place of residence and
excludes information about multiple residences, information about the initial location
of and attributes of residence and circular patterns of RM are also among the
drawbacks to measure of RM in this study.
This thesis is organized into seven main chapters. Chapter 1 deals briefly with the
issues which are regarded as an overview of this thesis, e.g. scope, aims and research
questions, and structure of the thesis.
The second chapter is an attempt to provide a background for RM analyses in
Istanbul through examining the transformation of Istanbul after the 1980s. While the
transformation of Istanbul can be dated to the late 1970s, the inquiry here starts with
1980s, based on the fact that the most important changes have occurred in the last
three decades. One more task of this chapter, therefore, is to provide a synopsis of
contains these subjects: gender, age, relation to the household, providence of birth, citizenship,
permanent residence at the time of Census, permanent residence at the five years earlier than the time
of Census, literacy, educational attainment, marital status, fertility, and occupational figures such as
type of economic activity, last week’s occupation, and employment status available according to the
age group, gender, providence and district.
12
the changing structures of socio-spatial and housing industry in Istanbul after the
1980s.
Chapter 3 presents an overview of micro-level RM studies. Briefly, the main aim of
this chapter to present an overview of RM from life-course point of view and its
interrelation between the characteristics of households that will shape the standpoints
of this thesis. This chapter of study is organized into five sections. It begins by
discussion on residential concept and its background, briefly. It proceeds secondly to
evaluate the behavioural modelling of RM studies. And the next section will examine
the regularities of the process and in the final section I try to summarize, mostly, the
theoretical discussion of RM from micro or behavioural perspective.
In chapter 4, the first stage of the analysis is carried out for the cases of Istanbul,
employing different levels of investigation methods. The main aim of chapter three is
to explore the non-spatial characteristics of Istanbul’s households in 1990 and 2000.
Moreover, to figure out the interrelationships between non-spatial characteristics of
movers such as age, education level, etc. and RM profiles of movers in the historical
perspective are also main concerns.
Theoretical discussion is resumed in chapter 5. This chapter scans macro-level RM
studies. Briefly, it aims to highlight the mutual relationship between RM and urban
change at the aggregate level. In other words, on the one hand the effects of RM on
socio-spatial structure of the city and on the other hand the effects of socio-spatial
structure of city on RM (such as neighbourhood change, neighbourhood effect,
segmentation and etc.) are the main concerns of this literature chapter.
In Chapter 6, the second phase of the analysis, the interaction between RM and the
socio-spatial structure of the city is on the agenda. Mainly, the aims of this chapter
examine both the effects of RM on the urban socio-spatial structure of the city and
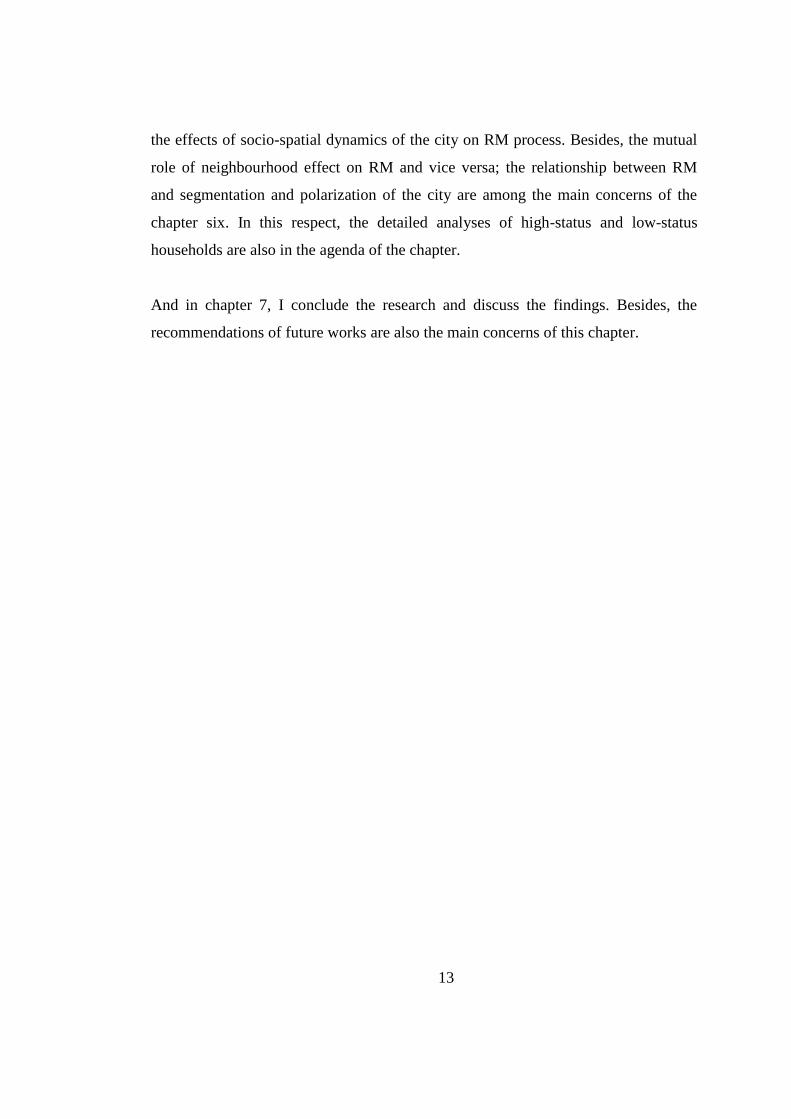
13
the effects of socio-spatial dynamics of the city on RM process. Besides, the mutual
role of neighbourhood effect on RM and vice versa; the relationship between RM
and segmentation and polarization of the city are among the main concerns of the
chapter six. In this respect, the detailed analyses of high-status and low-status
households are also in the agenda of the chapter.
And in chapter 7, I conclude the research and discuss the findings. Besides, the
recommendations of future works are also the main concerns of this chapter.
14
Figure 1.1: The Diagram of the Thesis

15
CHAPTER 2
THE BIG PICTURE:
SOCIAL, ECONOMIC AND SPATIAL CHANGE IN
ISTANBUL IN THE POST-1980 PERIOD
2.1 Introduction
In this thesis, RM is regarded as a function of the characteristics of households, the
housing industry as well as the socio-economic structure of the country and the city.
Here, it is important to restate that these two interpretations of RM process are
mutually interrelated with each other (Clark, 1992; Dieleman, 2001).In compatible
with this argument, recalling chapter 1, I establish the two-stage analysis. Basically,
the first-level analysis aims to answer the question “who are the movers?” (Chapter
4), and the second- level analysis aims to answer the question “where do they go and
what happens” (Chapter 6). Put these interpretations in mind, in order to study RM, it
is necessary to see the big picture. In other words, it is necessary in the first place to
examine the spatial and non-spatial characteristics of the city and/or the country in
which RM process takes place.
This chapter is about the big picture. In the post-1980 period, significant changes
took place in Turkey’s socio-spatial structure, especially in Istanbul. Rapid
urbanization, ageing of population, changing family typology, the differentiation and
specification in financial institutions and service industry are the new dynamics that
one can refer to the restructuring the city’s social and economic structure and

16
creation of new life-styles. In simplistic words, these changes had its impact on urban
systems, physical set-up, social structure and finally on the growth of Istanbul. Here,
I would like to repeat that I am particularly interested in exploring how such changes
influenced RM behaviour of households in Istanbul. To highlight the position of
Istanbul within this shift I evaluate the statistical data related to these transformations
under two headings: non-spatial and the spatial changes.
2.2 The Non-spatial Changes on the city of Istanbul
Since the 1980s, Istanbul has undergone a radical restructuring towards what for
some is becoming ‘globally connected city’ (Ercan, 1996; Keyder and Öncü, 1993;
Keyder, 1999a, 2005). The interventions devised and implemented under a neo-
liberal discourse change Istanbul’ urban geography. The increase and diversification
in service industry have a leading role in these transformations. Compatible with this
transformation; the office headquarters and giant shopping malls, as well as new
middle and upper-middle classes’ residential enclaves have appeared on the
geography of Istanbul (Keyder, 1999a, Geniş, 2007; Kurtuluş, 2011). Meanwhile, for
some, Istanbul has also experienced the “dark side” of globalisation process with
rising income inequalities, growing social exclusion and cultural fragmentation,
novel forms of social division and conflict previously unknown in the city (Keyder,
1992, 1999a, 2005).
2.2.1 Demographical Profile
As a matter of fact that demographic trend themselves reflect that the traditional
structure of the society is currently in a remarkable transformation in the post-1980
period. Firstly, the population is ageing. Secondly, fertility rates are declining. And
finally, the nuclear family is clearly becoming the standard in urban areas.

17
2.2.1.1 Istanbul’ Population still keeps growing with a slight decrease in growth
rate
Istanbul is and has always been the largest city in Turkey and it continues to grow.
The overall population of Istanbul grew from 4.7 million in 1980 to 10 million in
2000 and finally reached 12.7 in 2008 (SIS, 2002; TURKSTAT, 2009b). Istanbul
still keeps growing despite a slight decrease in the rate of growth. As can be seen in
Figure 2.1, the annual growth rate of overall population for Istanbul decreased from
4.2 in 1980 to 3.0 in 2008, while the same rate for Turkey was 2.1 in 1980 and 0.7 in
2008 (SIS, 2002; TURKSTAT, 2009b).
Figure 2.1: The urbanization ratio and annual growth rate of Istanbul and Turkey
(Source: SIS, 1972, 2002, 2003; TURKSTAT, 2009a, 2009b)
0,0
1,0
2,0
3,0
4,0
5,0
6,0
0
10
20
30
40
50
60
70
80
90
100
1950 1955 1960 1965 1970 1975 1980 1985 1990 2000 2008
%
urban population rate for Istanbul urban population rate for Turkey
Annual growth rate of Istanbul Annual growth rate of Turkey

18
Such shifts in population regarding overall number and growth rate have a direct
effect on housing stock and an indirect effect on the pattern of households’ RM in
Istanbul. The most important direct effects of this shift are to increase the demand for
housing and to lead diversification in the quality of housing and the price scales. As
stated in Chapter 3, the variety in housing stock enables to supply more available
housing units in terms of size, number of rooms, number of floors, and ownership to
movers and as a result the rate of mobility increases.
2.2.1.2 Population is ageing
Focusing on the age pyramids of Turkey from 1980 to 2008, it could be seen that
while the age distribution of population became less triangular (an indication of the
falling fertility rates); the top of the pyramids became more rectangular (as indication
of the falling mortality rate and rising life expectancy). In short, this is the picture of
a country in the final phase of ‘demographic transition process’ (Behar, et al., 1999;
Yüceşahin, 2009).
Behar et al., (1999) claimed that the demographic transition process has continued
for a century in Europe, nevertheless, Turkey has experienced this process only in the
last sixty or seventy years. In the most developed countries, as a reflection of this
process, the elderly population (age 65 and older) formed a significant share of the
overall population. According to the Behar et al., (1999), within the following 20-25
years, the share of age 20-24 and 65 and older population in overall population will
increase considerably. However, it is necessary to remember that this report was
prepared in the 1999, so, approximately one and half decades left to realize this
situation. By 2008, the share of elderly population in overall population for Turkey
was still quite low than European countries’7 and the ageing issues have only
7 The share of the 65 and older age population in overall population for Europe increased from 8 per

19
recently been regarded as a cause of concern in Turkey. In this respect, the share of
65 and older population in overall population for Turkey was 5% in 1980, then it
decreased to 4% in 2000 while it reached 7% in 2008 (SIS, 2003; TURKSTAT,
2009a). Within this perspective, the share of age 20-24 population in overall
population for Turkey was 7% in 1980, and then it increased to 9% in 2000, and it
remained the same value in 2008 (SIS, 2003; TURKSTAT, 2009a). To summarize
then, Turkey’s population structure has started to become similar with the developed
countries. Turkey has been seen as younger country among developed countries; in
fact, the population of Turkey has been ageing.8
All findings make it clear that while Turkey passed the final stage of demographic
transition process by the 2000s, Istanbul went through the final stage of the process
by the 1980s (Behar et al., 1999). The share of 65 and older population in overall
population for Istanbul was 3.5% in 1980, and then increased to 6% in 2008 (SIS,
2002; TURKSTAT, 2009b). In a similar vein, the share of age 20-24 population in
overall population for Istanbul was 10% in 1980, and then it increased to 11% in
2000 and it remained the same value in 2008 (SIS, 2002; TURKSTAT, 2009b). At
that stage, it is appropriate to note that either elderly people or young adults have
different requirements with reference to social security, health care and moreover
different careers in the housing industry.
In compatible with the consequences of demographic transition process, the fertility
rate for Turkey and Istanbul has shown a continuous decline since the 1950s. In
1950, the fertility rate for Istanbul was 2.7, decreased to 2.3 in 1980 and 1.4 in 2008;
while that for Turkey was 6.7 in 1950, then it decreased to 4.1 in 1990 and 2.1 in
cent in 1950 to 14 per cent in 1995. However, it is assumed that this ratio will increase to 21 per cent
in 2025. Available at: http://www.iiasa.ac.at/Research/ERD/DB/data/hum/dem/dem_2.htm 8 Population ‘Ageing’ (UK) or ‘Aging’ (US) can be defined as a rise in the number of people over 65
and in the proportion of people over 65 in the society. The impacts of Ageing are noticeable. As most
significant one, compare to young people old people’s requirement from society and governments
reflect differentiations (Available at: http://en.wikipedia.org/wiki/Ageing)

20
2008 (SIS, 1972, 2002, 2003; TURKSTAT, 2009a). Within this perspective, the
growth of Istanbul’s overall population is closely related to the mobilization of
population rather than the high values of fertility rate (SIS, 1995). To summarize
then, the fertility rate of Istanbul has always been lower than the average of the
country and this means that the common reason behind population growth of the city
is migration. Beside, migrants adjust their fertility trend to urban fertility trend in a
very short period. On the other hand, as Shorter (1989 cited in SIS, 1995) claimed
they migrate with unborn children which it is one of the important components of
RM studies.
Figure 2.2 Population pyramid of
Turkey in 1980 (SIS, 2002) Figure 2.3: Population pyramid of
Istanbul in 1980 (Source: SIS,
2002)

21
Bloom and Williamson (1998) claimed that demographic transition process consists
of two phases: the first is “demographic burden” and the second is “demographic
gift”. In the first phase, particularly youth dependency ratio9 is high and in the
followed phase working age population growth is high and the dependency ratio
falls. In the 1970s, the youth dependency ratio for Turkey peaked at around 78%
(SIS, 1972). However, as can be seen in Figure 2.6, this ratio shows continuous
decline from around 70% in 1980 to 40% in 2008 (SIS, 2003; TURKSTAT, 2009a).
9 Youth or child dependency ratio is the ratio between the number of persons aged 0-15 and the
number of persons between aged 15-64
Figure 2.4: Population pyramid of
Turkey in 2008
(Source: TURKSTAT, 2009a)
Figure 2.5: Population pyramid of
Istanbul in 2008
(Source: TURKSTAT, 2009b)
22
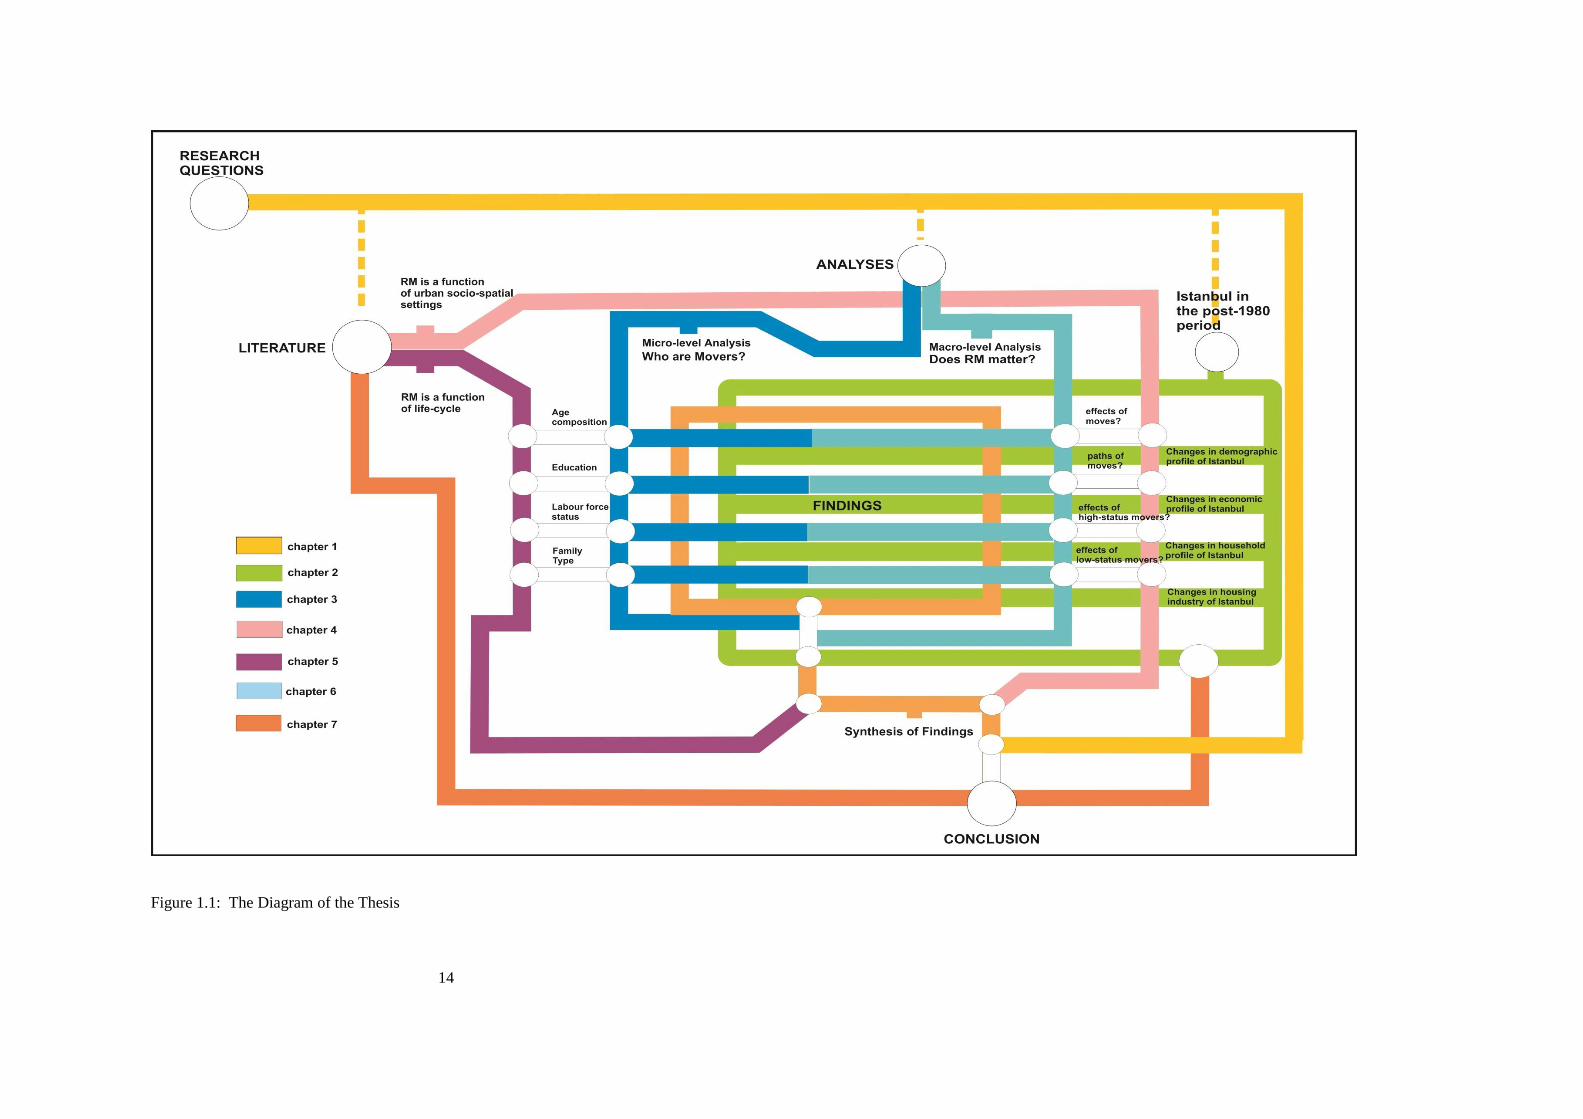
Figure 2.6: Youth Dependency Ratio and Fertility Rate for Istanbul and Turkey
(Source: SIS (2002, 2003) and TURKSTAT (2009a, 2009b).
All these findings indicate that the working age population of Turkey increased since
the late 1970s. In this context, it is correct to note that Istanbul and Turkey have
shown a similar profile; but, Istanbul experienced this process faster and earlier than
Turkey. While in 1970 the youth dependency ratio for Istanbul reached the highest
value with 54%, and then it decreased from 50% in 1980 to 35% in 2008 (SIS, 2002;
TURKSTAT, 2009b).
In short, these changes on age composition of population have a chain effect not only
on urbanization, economy, and education policy but also on the main triggers of RM.
0
1
2
3
4
5
6
0
10
20
30
40
50
60
70
80
90
1970 1975 1980 1985 1990 1995 2000 2008
Younger dependency ratio Turkey Younger dependency ratio Istanbul
Fertility Rate -Turkey Fertility Rate Istanbul

23
Hence I would like to restate that the socio-economic and demographic profiles as
well as housing preferences and demands of households of post-1980 period must be
different than pre-1980 periods’ and in short it demands basically variety in house
market regarding type, size and location and it is appropriate to claim that as a
consequence of ageing process the new type of housing need has to be occurred for
especially for elderly population. Here, it is essential to note that these claims
become one of my concerns and are analysed detail in the following parts of this
chapter.
5.2.1.3 Significant changes in traditional household typology: small household and
nuclear family
Until the 1980s, Turkey was characterized by a large household size. According to
Burch and Matthews (1987), one of the consequences of demographic transition
process is the decline in the average household size. In 1970, the average household
size of Turkey was 5.8 (SIS, 1972).10
Since then, the average household size of
Turkey has shown a secular and irreversible decline: as decreased from 5.3 in 1980
to 5 in 1990 and to 4.5 in 2000 (SIS, 2003). Not surprisingly, the household size of
Istanbul is and has always been smaller than Turkey’s. In 1970, this value for
Istanbul was 4.7 and then decreased to 4.2 in 1980, and it increased to 4.1 in 1990
and finally to 3.8 in 2000 (SIS, 2002). Here, I would like to note that whereas this
ratio is under Turkey’s average household size, it is still higher than the average
household size of many developed countries’.11
The decrease of the average
household size has closely interlinked with the increasing share of the one-person
household in overall households which in turn is closely related with the increasing
10
Data on the total household population have not been tabulated for the years before 1975. In this
respect, the average sizes of households have been calculated by total population for these years. 11
For example, in 1990 the average household size of Ireland: 3.1, of Japan: 2.8, of Italy: 2.7, etc. For
more information on the average household size of most developed countries, see:
http://www.nationmaster.com/graph/peo_ave_siz_of_hou-people-average-size-of households

24
rate of divorce and the decreasing rate of marriage.12
Since the second half of the 1970s, the ‘one-person’ segment of households has
gained more importance all over the world. In Turkey, because of mainly increase in
the schooling rate, the rise in marriage age, the decline in the marriage rate and the
increase in the divorce rate, after the 1980s, the ‘one-person household’ profile is the
fastest growing segment of the households. As mentioned above, Istanbul’s
household size profile is smaller than the average of the country: the share of one-
person household in overall household for Turkey increased from 5.7% in 1990 to
6.3% in 2008 (SIS, 2003; TURKSTAT, 2009a). Nevertheless, for Istanbul, the share
of one-person households in total was 4.5% in 1990, then it increased to 7.5% in
2008 (SIS, 2002; TURKSTAT, 2009b).
According to Wright (1990), recognizing the differentiations of household
characteristics brings along the variety in the demand for the different types of
houses as well as the reassessment of housing stock. Therefore, in order to rethink
and to develop alternatives on housing, first of all, it is necessary to examine the
lifestyles of individuals as the potential for housing to live. In simplest words, when
the household composition changes; the budget of households, their attitude to
consumption, saving and investment also changes. The reflection of these changes
has operated on the housing industry regarding demands for financing, type and size
of dwellings as well as quality of lived space. However, it is important to note that
because of the nature of housing industry, the reflections of changing demands of
households came into sight at least two or more years after.
12
Until the 2000s, the row marriage rate for Turkey remained the same values except fluctuations,
but, since the beginning of 2000s Turkey has shown the decline trend in this rate as 6.84‰ in Turkey.
According to SIS (1995), the first marriage age of the women was around 19, since then this value
increased to 22 in 1990 and in 2006 this value for women was 23 and for men was 26.

25
2.2.1.4 Population becomes more educated
Over the last few decades, educational opportunities have expanded significantly in
Turkey. In the 1990s, the compulsory schooling was extended from five to eight
years, and the system of State-provided, free primary and secondary education was
revised. Linking with the opening of new universities both public and private and
operating the distance learning programs, the higher education opportunities also
grew.
An examination of the changes in education indicators shows that there have been
substantial increases over time in the educational attainment of both men and
women. Within this perspective, the shares of illiterates and those without basic
education declined, while the share of higher education increased rapidly. According
to Population Census 200013
, in the 1975 the share of illiterate population in overall
population by literacy for Istanbul was 22% (for Turkey: 29 %), and then decreased
to 14% (for Turkey: 13 %) in 1990 and 7% (for Turkey: 11 %) in 2008 (SIS, 2002;
TURKSTAT, 2009). In short, the population of Istanbul is more likely to have
attended school for a longer period than Turkey; the share of people with higher
education completed for Istanbul increased from 5% (for Turkey: 2 %) in 1975 to
12% (for Turkey: 7 %) in 2008 (SIS, 2002; TURKSTAT, 2009b).
2.2.2 Changes in the Economy
As in most other countries after the 1980s, the direction of Turkish economy has
shifted from protectionism to open or market economy (Keyder, 1999). However, in
1985 the main sector of Turkish economy was still agriculture with 60% of total
employment whereas the industry comprised 15% and the service industry only 25%.
13
In Population Census 2000, the proportions of population by literacy and education levels of people
have been calculated through population 25 years old and older.

26
Then, in 2008 the share of agriculture in overall employment of Turkey decreased to
24% (TURKSTAT, 2009a). As expected, between 1985 and 2008, services became
the largest employer; the share of service employment in overall employment for
Turkey nearly doubled and reached 50%, while the share of industry in total
employment also increased to 27% in 2008 (TURKSTAT, 2009a).
2.2.2.1 Service Sector is on the Increase
In the late-1980s and throughout the 1990s, sectorial changes took place in the
economy of Istanbul, the city has been targeted with the aim of transforming it into a
global city; as the gateway for Turkey’s to new era (Ercan, 1996; Keyder and Öncü,
1993; Keyder, 1999). Contrary to Turkey’s economic profile, the main economic
sector of Istanbul was service industry with 53% of total employment in 1980 and
then this share increased to 60% in 2008 (SIS, 2002; TURKSTAT, 2009).14
Within
the same period, the proportion of industry in Istanbul’s overall employment
remained the same (41-40 %). Literally, it is appropriate to state that on one hand
Istanbul has become a centre of attention for service industry, on the other hand, the
city still maintains its privilege role in Turkish industry (see Figure 2.7).
However, all these findings do not provide the widespread framework for
understanding the story of Istanbul’s transformation or a kind of ‘globalization’.
Keyder (1999) and Erkip (2000) suggested that the main triggers behind the
‘globalization’ of Istanbul are the capacity of manufacturing, the being the sources of
cheap labour and shop keeping potential instead of establishing a new kind of
services or information economy. In Istanbul, whereas the service industry has been
the largest employer after the late 1980s; however, it is important to examine the
fluctuations in FIRE, manufacturing and construction sub-sectors with reference to
14
In order to compare the data before and after 2004, the total (urban plus rural) data sets have been
used in all employment analyses in this section.

27
basically employment rate. In 1985, the share of manufacturing in overall
employment in Istanbul was 35% then it started to decrease 31% in 2000 (SIS,
2002). However, Turkey has shown opposite profile, while in 1985 this share was
11% and then it increased to 17% in 2000 (SIS, 2003). This trend has also been
observed in construction and FIRE sub-sectors in Istanbul. The share of construction
employment in overall employment for Istanbul decreased from 7% in 1985 to 6% in
2000, while that for Turkey increased from 4% to 6% over the same period (SIS,
2002, 2003).
Figure 2.7: The share of manufacturing, construction and FIRE sub-sectors for
Turkey and Istanbul and the share of service employment of Turkey and Istanbul,
between the years 1970 and 2008 (Source: SIS, 1972, 2002, 2003; TURKSTAT,
2009a, 2009b).
With this backdrop, Keyder (1999) accepted that Istanbul has not retained at a
15
20
25
30
35
40
45
50
55
60
0
5
10
15
20
25
30
35
1970 1975 1980 1985 1990 2000 2008
%
%
manufacturing Istanbul manufacturing Turkey Construction IstanbulConstruction Turkey FIRE Istanbul FIRE TurkeySERVICE - TR SERVICE - IST
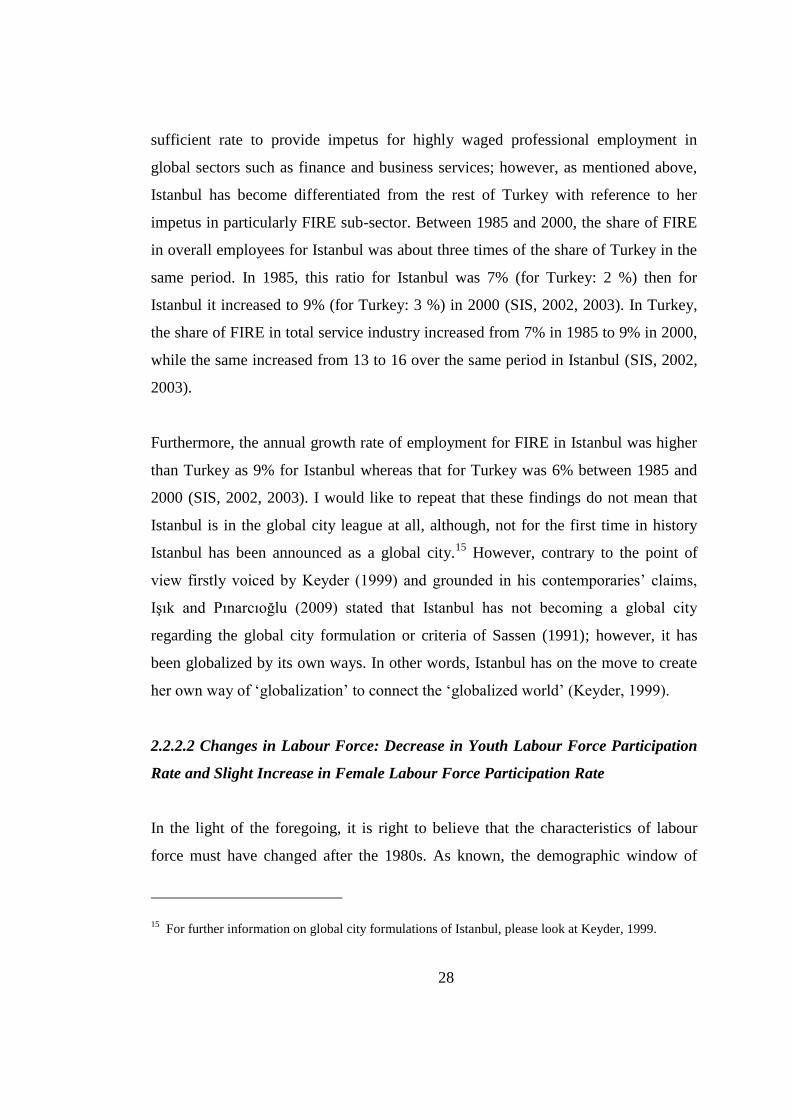
28
sufficient rate to provide impetus for highly waged professional employment in
global sectors such as finance and business services; however, as mentioned above,
Istanbul has become differentiated from the rest of Turkey with reference to her
impetus in particularly FIRE sub-sector. Between 1985 and 2000, the share of FIRE
in overall employees for Istanbul was about three times of the share of Turkey in the
same period. In 1985, this ratio for Istanbul was 7% (for Turkey: 2 %) then for
Istanbul it increased to 9% (for Turkey: 3 %) in 2000 (SIS, 2002, 2003). In Turkey,
the share of FIRE in total service industry increased from 7% in 1985 to 9% in 2000,
while the same increased from 13 to 16 over the same period in Istanbul (SIS, 2002,
2003).
Furthermore, the annual growth rate of employment for FIRE in Istanbul was higher
than Turkey as 9% for Istanbul whereas that for Turkey was 6% between 1985 and
2000 (SIS, 2002, 2003). I would like to repeat that these findings do not mean that
Istanbul is in the global city league at all, although, not for the first time in history
Istanbul has been announced as a global city.15
However, contrary to the point of
view firstly voiced by Keyder (1999) and grounded in his contemporaries’ claims,
Işık and Pınarcıoğlu (2009) stated that Istanbul has not becoming a global city
regarding the global city formulation or criteria of Sassen (1991); however, it has
been globalized by its own ways. In other words, Istanbul has on the move to create
her own way of ‘globalization’ to connect the ‘globalized world’ (Keyder, 1999).
2.2.2.2 Changes in Labour Force: Decrease in Youth Labour Force Participation
Rate and Slight Increase in Female Labour Force Participation Rate
In the light of the foregoing, it is right to believe that the characteristics of labour
force must have changed after the 1980s. As known, the demographic window of
15
For further information on global city formulations of Istanbul, please look at Keyder, 1999.

29
opportunity caused the increasing working age population since the late 1970s in
Turkey: the working age population (15-64 age groups) share increased from 56% in
1988 to 67% in 2008, while that for Istanbul increased from 67% to 71% over the
same period (SIS, 1988-2010). Within this backdrop, Turkey shows steady increase
in the employment rate16
, however, it is still under the EU2717
average (65% in
2008). This ratio for Turkey increased from 28% in 1988 to 29% in 2004 and to 32%
in 2008. Contrary to the current trend the employment rate (41.0-41.3%) is stable
between the years 2004 and 2008 in Istanbul.18
However, it is appropriate to note that
the employment pattern of Istanbul show compliance with developed cohorts’ profile
other than Turkey.
In this sense, one of the most important developments contributing to the long-run
labour participation trend has been the decline in the participation rates of youths
since the late 1980s. As a result of the remarkable development in education
infrastructures as well as the changing pattern of school enrolment is an obvious
potential source of change in the “labour force participation rate” 19
of youths (aged
between 15 and 19). As can be seen Figure 2.8, the overall labour force participation
rate for 15-19 age groups for Turkey was 5.3% in 1988 (SIS, 1988-2010). Then, both
Istanbul and Turkey have respectively decline; this ratio for Istanbul fell to 26% in
2008, while that for Turkey was 28% over the same period.
16
Employment rate is the ratio between the number of people who have jobs and the overall
workforce. 17
The employment rate for some of the EU27 members for 2009 can be listed as follows: Bulgaria
(63%), Germany (71%), Greece (61%), Spain (60%), Italy (58%), Hungary (55%), and United
Kingdom (70%). For further information, please access to the Eurostat news releases on the Internet
(Eurostat, 2009). 18
Because of the lack of available data, the employment rate for Istanbul has been calculated since the
second half of the 2000s. 19
Labour Force Participation rate is the ratio between the labour force (the number of people
employed and unemployed) and the overall size of economically active population. In order to make
analyses comparable, I have preferred to eject the agriculture activities data from the data set. The
non-agriculture activities are construction, manufacturing, electricity, communication, FIRE and trade
sub-sectors. And in order to be comparable of the findings of employment analyses such as
employment rate, Labour Force Participation Rate or unemployment rate of Istanbul with Turkey, the
overall (rural plus urban) and non-agriculture activities data has been used.
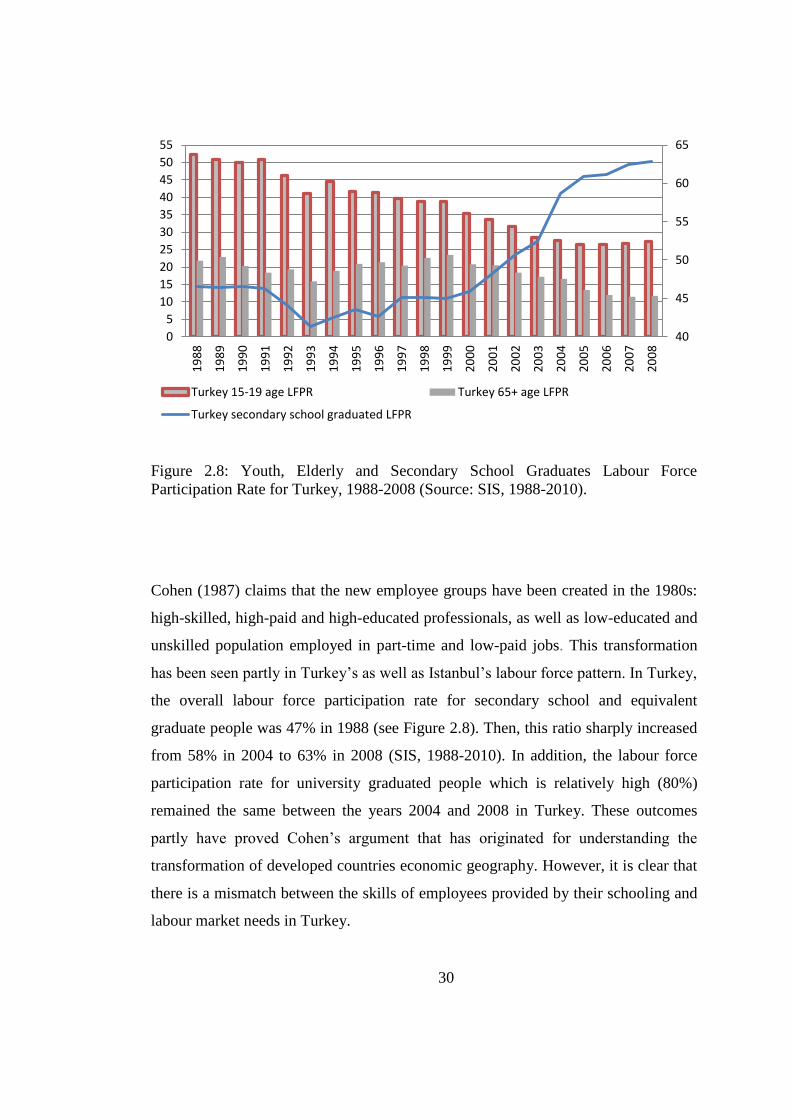
30
Figure 2.8: Youth, Elderly and Secondary School Graduates Labour Force
Participation Rate for Turkey, 1988-2008 (Source: SIS, 1988-2010).
Cohen (1987) claims that the new employee groups have been created in the 1980s:
high-skilled, high-paid and high-educated professionals, as well as low-educated and
unskilled population employed in part-time and low-paid jobs. This transformation
has been seen partly in Turkey’s as well as Istanbul’s labour force pattern. In Turkey,
the overall labour force participation rate for secondary school and equivalent
graduate people was 47% in 1988 (see Figure 2.8). Then, this ratio sharply increased
from 58% in 2004 to 63% in 2008 (SIS, 1988-2010). In addition, the labour force
participation rate for university graduated people which is relatively high (80%)
remained the same between the years 2004 and 2008 in Turkey. These outcomes
partly have proved Cohen’s argument that has originated for understanding the
transformation of developed countries economic geography. However, it is clear that
there is a mismatch between the skills of employees provided by their schooling and
labour market needs in Turkey.
40
45
50
55
60
65
0
5
10
15
20
25
30
35
40
45
50
55
19
88
19
89
19
90
19
91
19
92
19
93
19
94
19
95
19
96
19
97
19
98
19
99
20
00
20
01
20
02
20
03
20
04
20
05
20
06
20
07
20
08
Turkey 15-19 age LFPR Turkey 65+ age LFPR
Turkey secondary school graduated LFPR
31
The other parameter that affects the housing stock and housing industry is elderly
labour force participation rate. Contrary to the developed countries, in Turkey,
Labour Force Participation Rate for 65 and older decreased from 21% in 1990 to
12% in 2008 (see Figure 2.8). This indicates that the share of elderly employees in
labour market has been in decline. However, because of the reflections of
demographic transition process on labour force, it is not wrong to expect that the
labour force participation rate for older population will increase within the following
decades in Turkey.
Within this backdrop, female labour force participation rate has increased with small
pace since the late 1980s. However it is still under the average size of European
Countries.20
As known, after the 1990s agriculture has lost its privilege position in
the Turkish economy, where the female labour force mainly had been working.
Between 1988 and 2008, the female labour force participation rate in non-
agricultural activities for Turkey increased from 11% to 16%; while the female
employment rate for Turkey increased from 7% to 13 % over the same period. In the
year 2008, however, the overall male labour force participation rate was still more
than three times female labour force participation rate in Turkey (SIS, 1988-2010).
According to these findings, it is right to claim that the female labour force
participation rate increased since the late 1980s by low proportion. However, this
does not mean that female labour perfectly participates to the Turkish labour market
still dominated by male labours. Within this perspective, the city of Istanbul is not an
exception but slightly different where the low paid and part-time jobs opportunities
have been much more available especially for women.
Either employment or labour force participation, and their trends have changed
considerably with respect to gender, activities, age, education and location over time,
20
The employment rate for female in some of the EU27 members for 2009 can be listed as follows:
Bulgaria (58%), Germany (66%), Greece (49%), Spain (53%), Italy (46%), Hungary (50%), and
United Kingdom (65%). For further information, please accessed to the Eurostat news releases on the
Internet: http://ec.europa.eu/eurostat

32
and understanding the sources of these changes is important to our interpretation of
the increase in the overall participation rate in recent decades and its changing
relationship with housing and RM.
2.3 The Spatial Changes on the city of Istanbul
After the mid-1980s, as Özdemir (2002) perfectly says that in Istanbul Metropolitan
Area’s development, a large series of factors has been influenced in the different
scales such as neo-liberal policies in national level and metropolitan governments in
the local level. However, the geography of Istanbul has been regulated through the
three main policies, since the 1950s. The first one is the decentralization of industry;
the second one is the decentralization of Central Business Districts and the last one is
the decentralization of residential areas regarding type and location. The changes on
housing industry are also closely interlinked with the changes on spatial settings of
the city.
2.3.1 Decentralization of Industry
Decentralization of industry from the core of the city has always been one of the
main concerns of the plans of Istanbul since the late 1960s.21
After the 1980s, the
main trigger behind these decentralization processes was the desire to transform
21
The first plan which aimed the decentralization of the industry was ‘Istanbul Industrial Zones
Master Plan (1966)’. The second important plan of the city; 1/50.000 scaled ‘Istanbul Master Plan’
was done by Ministry of Public Works and Settlement and was approved in 1980. In 1995, 1/50.000
scaled ‘İstanbul Metropolitan Area Master Plan’ was approved by the Istanbul Greater Municipality.
Then, the “1995 İstanbul Metropolitan Area Master Plan aimed to remove production industry out of
Haliç, Kurtköy, Bakırköy, Zeytinburnu and Eminönü. It aims to find solution to the small-scale and
middle-scale industries at the stated planned areas according to their sectors such as in Topkapı,
Maltepe, Yenibosna, Kartal, Maltepe and Kurtköy districts, and prevent the areas from being
wreckages which became empty after transferring prevailing industry” (İBB, 1995). And, the last plan
of Istanbul was completed in 2007, 1/25.000 scaled “İstanbul Province Development Plan”. Through
this plan, industry was locating at the potential areas around İstanbul and the rehabilitation of the
prevailing industry zones was planned (IMP, 2007).

33
Istanbul from national primate city to a world city (Keyder and Öncü, 1993; Keyder,
1999; Kuyucu and Ünsal, 2010; Timur, 2004). However, in Istanbul, as in all
developing cities, this process was remarkably uneven, regarding either access of
citizens to globalized activities or the physical spaces under transformation (Keyder,
1999). The former production sites were rapidly transformed to the new financial and
commercial areas. Accordance with the decentralization process of industry from
core of the city, the new service sector firms locate in these new central business
districts such as Büyükdere-Maslak Axis in European side, Kozyatağı and
Altunizade in Anatolian side (Dökmeci and Berköz, 1994).
2.3.2 Decentralization of Central Business District
Till the 1970s, Eminönü and Beyoğlu were the central business districts in which
most of the offices, banking and trading activities of the city were agglomerated
(Dökmeci and Berköz, 1994). The transformation and decentralization of such
activities from traditional business centres started in the early 1970s. Both the
demand of population growth and the declining accessibility to these areas caused
the demand for more office areas (Özdemir, 2002). On the other hand, these demands
could not be met in the historical city centres because of agglomeration in these
areas.
By the construction of Bosporus Bridge (1973) and peripheral highways, the central
business functions started to be dispersed along the Taksim, Şişli, Zincirlikuyu axis
and Beşiktaş-Barbaros Boulevard. Especially, Beyoğlu and Taksim have a significant
role in the development of Istanbul as a central business district by both being a part
of the old city centre and having office spaces, after the 1980s (IMP, 2007). Then by
the 1990s, the service sector developments on this axis extended in the direction of
Maslak. Since the early 1990s, Maslak and Büyükdere Avenue were filled with
multi-storey business and shopping centres. According to the Cengiz’s (1995)

34
research covering the 1980-1993 period, mostly the headquarters and head offices of
banks, other financial institutions and producer service firms located along this axis.
According to all these findings, it is right to assume that with the growth of the
central business district tended to expand through the new development areas; in the
east-west direction and the north-south corridors. The changes in the business centres
and industrial areas and changes in the city distribution, together with the increase in
the scale of the city and arrangements of the city transportation created important
differences in residential areas that reflected by these changes (Ercan, 1996).
2.3.3 Decentralization of Residential Areas
Özdemir (2002) states that the urban land marked entered into a different period in
the post-1980 era. The construction of Bosporus (1973) and The Fatih Sultan
Mehmet Bridge (1987) triggered the development to the northern side of Istanbul,
into the forests and water basins. In other words, the variations in the endowment of
transportation network, opening of Fatih Sultan Mehmet Bridge and TEM highway,
transformed the location pattern of housing.
Until the 1980s, urban fringe had mostly rural characteristics and was occupied by
mostly by low-income groups, especially immigrants. The main mode of housing
provision for low-income groups was ‘gecekondu’ in this period.22
While the first
example of gecekondu in Istanbul was observed at Zeytinburnu in the late the 1940s,
their numbers grow significantly, and after the 1980s, gecekondu spread throughout
Istanbul, and gecekondu became commercialized (Işık and Pınarcıoğlu, 2003;
Yalçıntan and Erbaş, 2003). In this period, the growth of the urban real estate market
22
Gecekondu etymologically means ‘landed in one night’ in Turkish. In the Law 775, Gecekondu
explained as “a dwelling erected on land and lots which do not belong to the builder, without
observing the laws and regulations concerning construction and building”.
35
led to dramatically increased in land prices; and gecekondu became the subject of
these increases (Yalçıntan and Erbaş, 2003). When the industrial zones expanded to
longer-distances through urban fringe from city center, firstly, residential suburbs,
then satellite cities established on the fringe of Istanbul (İBB, 1995).Within this
backdrop, these areas quickly became the targets of the cooperatives of middle-
income groups organized according to mass housing areas. Pınarcıoğlu and Işık
(2009) pointed out that “the outskirts as well as the core of the city presented
opportunities not just for the poor but also for middle and upper income groups who
seeking to improve their quality of life and gain benefits from Istanbul’s profitable
property market after the 1990s”.
Erkip (2000) stated that high and middle income groups begun to leave their former
location in the city and, basically in order to improve their quality of life, moved to
outskirts in the post-1980 period. High-income groups who stacked within the city
tended to live in high-security prestige residential areas where constructed on big
lands on the urban periphery. Çekiç and Ferhan (2004) claimed that luxurious-
residences which developed after 1980 settle around forest areas which prevail at the
northern sides of both edges of the city. Mostly, the villa style settlements located
far from the city center and isolated from the other parts of the city were preferred by
these groups such as Göktürk-Kemerburgaz. In majority, these villa sites or ‘gated
communities’ were located in or near the forests and accessibility of these residences
to city is easy via the provision D-100 and TEM highways (Geniş, 2007; Baycan-
Levent et al, 2007; Kurtuluş, 2011) . In this sense, ‘gated communities’ in Istanbul
can be defined as “the new areas that are produced in the global restructuring process
and consisted group of users who have similar social and economic background and
consumption habits” (Yıldız and Inalhan, 2007). In addition, Kurtuluş (2005)
claimed that because of the demand and supply capacity of the investors in Istanbul
who realize the potential of high-income groups’ demand on the urban environment,
this tendency was more distinct in the city. Today high-status residential areas or

36
gated enclaves can be located all over the city. However, it is necessary to mention
that the high-income groups of the past-1980 period are different from the former
ones in terms of their housing preferences and consumption behaviours.
2.3.4 Changes in Housing Industry
After the 1980s, with reference to the role of state, the actors of housing market, and
the characteristics of housing stock and the characteristics of residential
neighbourhoods, changes in Housing Industry of Turkey as well as Istanbul can be
classified into two distinctive sub-periods: the years between 1985 and 2003 and the
period after 2003.
2.3.4.1 The period between 1985 and 2003: the housing industry is provoked
Since the beginning of the 1950s, apartment blocks and gecekondu were the two
common housing options, often seen as the opposite of each other regarding their
symbolic values and inhabitants Turkey (Bozdoğan, 2002; Geniş, 2007; Işik and
Pınarcıoğlu, 2003). While gecekondu dominates the illegal part of the housing
market and supply mostly low-income groups, apartment blocks dominated the
formal housing market provision that serves mostly middle and upper-middle income
groups (Erman, 1997; see also Şenyapılı, 1998, 2004).

37
Figure 2.9: For Turkey, the Share of housing investment in GDP, the share of Public
and Private Sector housing investments in GFI between 1970 and 2007 (Source: SIS,
2001, 2004; TURKSTAT, 2010)
Until the second half of the 2000s, the state not becoming a direct provider in
housing industry, the private sector retained its important role in the housing market
in Turkey. For example, between 1980 and 1984, the share of private dwelling units
in overall construction permits in Turkey was 72% then decreased to 64% in the
period covered 1985-1989 while it rose to 72% in 1990 and 94 period and to 74% in
the 1994 and 2002 period (SIS, 2001, TURKSTAT, 2005). In a same manner,
between 1974 and 1984, the average value of private housing investment in Gross-
fixed Investment for Turkey was 22% and it increased to 28% in 1985-2002 period
(SIS, 2001; TURKSTAT, 2005). In Figure 2.9, the fluctuation of the share of private
and public investments in Gross-fixed Investment (GFI) is illustrated.
0,0 1,0 2,0 3,0 4,0 5,0 6,0 7,0 8,0 9,0
0,0 5,0 10,0 15,0 20,0 25,0 30,0 35,0 40,0 45,0
1970
1972
1974
1976
1978
1980
1982
1984
1986
1988
1990
1992
1994
1996
1998
2000
2002
2004
2006
Share of Public's housing investment in GFI-TR (2nd axle) Share of Private's housing investment in GFI -TR
Share of housing investment in GDP (2nd axle)

38
Figure 2.10: The total number of starts and the share of cooperatives in total starts for
Turkey and Istanbul in the period 1970-2007 (Source: SIS, 2001, 2004;
TURKSTAT, 2009, 2010)
The foundation of the Mass Housing and Investment Administration (HDA) in 1983
and the Mass Housing Fund (MHF) in 1984 can be seen as the re-definition of the
role of state in the housing industry in the post-1980s period. Keyder (1999b)
claimed that HDA encouraged the formation of housing cooperatives and offered
inexpensive long-term credit to buyers. In other words, with the foundation of HDA,
mass production of housing becomes widespread and gained popularity. In Figure
2.10, the share of cooperative housing dwelling units in overall starts grew from 21%
in the 1980-1984 period to 45% in the 1985-89 period, to 53% between 1990-1994
period, and finally to its highest of 65% in the 1995-2002 period (see Figure 2.10).
While the primary concern of these institutions has been to provide housing for low
income groups, and to finance mass housing projects, Özdemir (2010) pointed that
0
5
10
15
20
25
30
35
40
0
100000
200000
300000
400000
500000
600000
1970197219741976197819801982198419861988199019921994199619982000200220042006
total number of construction permits in Tr total number of construction permits in Ist
% of cooperative for Tr % of cooperatives for Ist

39
the beneficiaries of the fund were also typically middle- and upper-middle income
groups rather than lower-income people who had difficulty in accessing housing so
the housing cooperatives turned into an instrument that frequently enabled families to
purchase houses as a kind of speculative investment. As illustrated in Figure 2.10,
the outskirts of Istanbul were the targets of middle and upper-middle groups’
cooperatives: in Istanbul the share of cooperatives in total starts was 7% between
1980 and 1984, 20% in the period covered 1985-1989. Nevertheless, between 1990
and 1994 this ratio decreased to 17% and to 15% in 1995-2002 periods (SIS, 2001,
2004).
Meanwhile, large-scale private construction firms could only have a small share in
the housing market (Özdemir, 2010). Small or medium-scale construction firms
served for the greater part of the housing market (Işık and Pınarcıoğlu, 2003;
Özdemir, 2010). Within this backdrop, after the 1990s, the metropolitan
municipalities emerged as an alternative actor in the housing industry in Turkey.
Between 1985 and 1989, the share of municipalities in housing starts for Turkey was
0.5% and increased to 1% in the 1990-1994 period and then it increased to 1.5%
between 1995 and 2002 (SIS, 2001, 2004; TURKSTAT, 2009, 2010). These
municipalities are preferred to enter into housing market through their own municipal
companies such as Istanbul Municipality’s “KİPTAŞ” which operated since the
second half of the 1990 in Istanbul. Since the foundation of KİPTAŞ, approximately
50.000 housing units were constructed in Istanbul with all facilities (KİPTAŞ, 2000).
5.3.2.2 The post-2003 period: Does the housing industry deal with quantity
anymore?
While, until the 2000s, the role of public sector in the housing provision in Turkey
was insignificant, with a series of legal arrangements23
HDA became the most
40
powerful real estate developer in the country as well as the most influential actor in
constructing sector in the post mid-2000s (Bayraktar, 2006, 2007).24
In 2001, the
fund of HDA was transferred to the national budget. Then, in 2003, the duties of the
former Land Office were transferred to HDA and HDA would be administered by the
Office of the Prime Minister (Bayraktar, 2007). Consequently, in the second half of
the 2000s, the state’s intervention in housing industry gained its strongest position
since the foundation of HDA in 1984. For example, HDA announced that until 2011
it aims to construct 500.000 housing units, 91% of which were completed between
2003 and 2010 (HDA, 2011).
In the mid-2000 period, the big construction firms with mostly assistance of the
HDA entered the housing industry by building gated communities and middle- and
upper-middle income housing areas (Keyder, 1999). In a same manner, Geniş (2007)
stated that by directly financing them or providing subsidised credits to local
governments and cooperatives through HDA, the state has become enabled the big
construction companies to enter into the housing industry.25
Özdemir (2010)
perfectly clarified this process as “…in order to get finance for social housing
projects for lower-income groups, HDA has been inviting bids from construction
companies, with the winning company paying for the right to build apartments for
middle- and upper-income groups on public land, while HDA retains the balance of
profits in this ‘revenue-sharing’ model”. HDA produced 16000 dwellings and 10000
dwellings by ‘revenue-sharing’ model in Istanbul between 2003 and 2011. In this
respect, between 2003 and 2010 HDA produced 456.000 housing units and 386.000
of these housings are social housing, the others were produced by the revenue-
23
Law no, 4966 in 2003, Law no 5162 in 2004, Law no 5582 in 2007, and Law no 5793 in 2008 24
For a detailed discussion on the changing role of HDA, see also Özdemir (2010) and visit the
internet page. Available at:
http://www.toki.gov.tr/TR/Genel/BelgeGoster.aspx?F6E10F8892433CFFAAF6AA849816B2EF856F
72A66C829B67 25
In similar manner, the state passed a crucial law (No. 5582 in 2007) restructuring the housing
finance sector through institutionalised “mortgage system”.

41
sharing model (HDA, 2011). In a same manner, since 2003 HDA produced 35.000
housing units and 10% of them were social housing or low-income groups’ housings,
in Istanbul (HDA, 2011). While HDA, as an agent of the state, becomes the main
actor in housing industry, urban transformation projects become the main tool for
implementing the states’ interventions on urban land in this period. In a same
manner, as a former major of Istanbul Metropolitan Municipality and as Turkish
Prime Ministry Recep Tayyip Erdoğan said that “Urban transformation projects are
surgical tools than can remove the tumours that have surrounded our cities”
(Radikal, 6 April 2006 cited in Kuyucu and Ünsal, 2010).
As mentioned in the preceding paragraphs, while the new types residential areas such
as sites and gated communities mushroomed in the outskirts of Istanbul, urban
transformation projects has gained momentum in former gecekondu areas in the core
of Istanbul in the post-1980 period. With the assistance of HDA, urban
transformation projects became the main tool for transforming the incompletely
commoditized informal housing areas and deprived inner-city neighbourhoods in the
cities (Kuyucu and Ünsal (2010). During this period, HDA prepared five urban
transformation projects with local municipalities for gecekondu settlements in
Istanbul with an objective constructing 2000 dwelling units, 50% of which is
completed up to 2011 (HDA, 2012).
As indicated previously, ‘revenue-sharing’ model provides opportunities to HDA for
turning revenues to social housing construction for low-income groups. During this
process, HDA can be able to construct ‘for profit’ housing on state land by own
subsidiary construction firms and by public private partnerships (Kuyucu and Ünsal,
2010). Especially in Istanbul, this model has been implemented perfectly since the
mid-2000s. This means that HDA and big construction firms have changed the urban
settings of Istanbul by large-scale housing projects for middle- and upper-middle
income groups since 2005.

42
As known, the construction of gated communities accelerated after the mid-1990s,
nevertheless, since the mid-2000s the characteristics of them have varied
significantly in terms of housing type, housing quality, environmental quality and
tenure profile. In this respect, Baycan-Levent and Gülümser’s (2007) study on 161
gated communities constructed after the 1980s showed that in Istanbul gated
communities show quite different variations regarding their housing types and size,
and environmental structure. Within this backdrop, likewise the former ones newly
constructed (after 2005) gated communities and gated sites locate in urban periphery.
However, the later ones are significantly varied from the former ones, in terms of
size of construction firms, housing type, housing quality, housing size options. In
order to show these variations, the mass housing projects in Büyükçekmece are
analysed in detail. In this respect, some process are selected and examined in detail
(see Table 2.1). As can be seen in the table below, newly constructed housing
projects could supply the diverged demands of vast majority of today’s society in
terms of housing size, number of rooms and purchase values. In short, after the mid-
2000s the housing stock of the city has become suitable to supply the changing
demands of households of the city as well as the country.
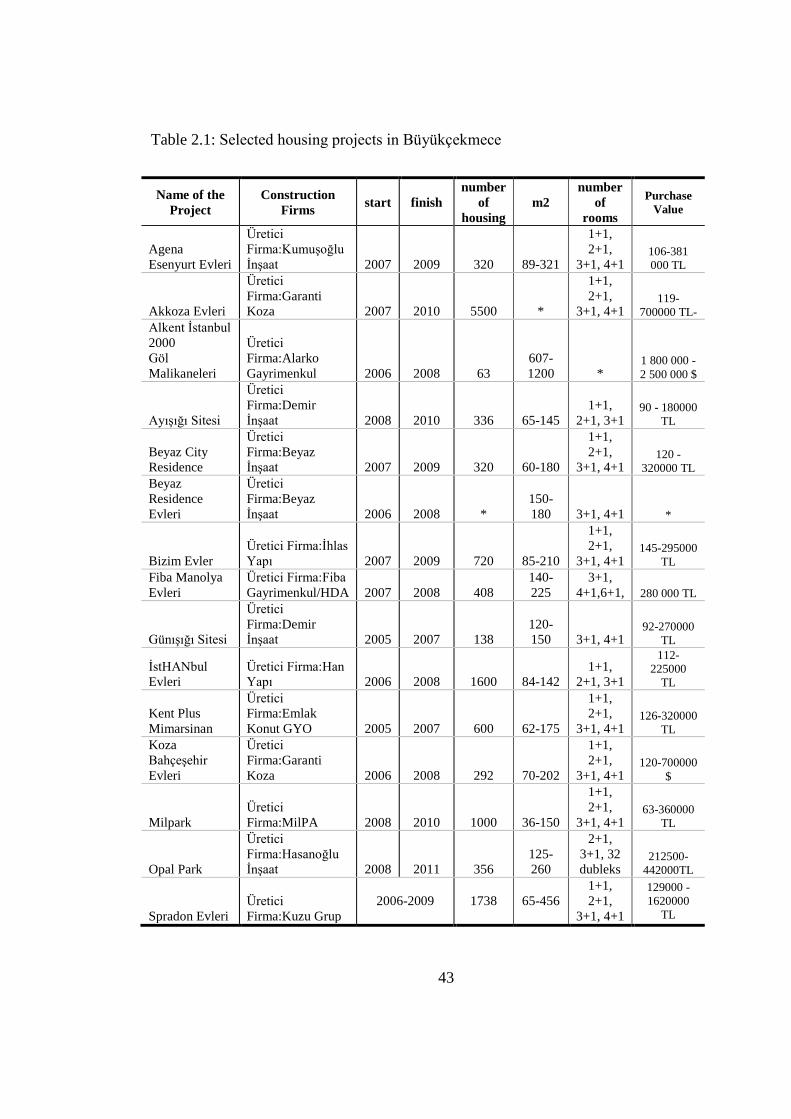
43
Table 2.1: Selected housing projects in Büyükçekmece
Name of the
Project
Construction
Firms start finish
number
of
housing
m2
number
of
rooms
Purchase
Value
Agena
Esenyurt Evleri
Üretici
Firma:Kumuşoğlu
İnşaat 2007 2009 320 89-321
1+1,
2+1,
3+1, 4+1 106-381
000 TL
Akkoza Evleri
Üretici
Firma:Garanti
Koza 2007 2010 5500 *
1+1,
2+1,
3+1, 4+1 119-
700000 TL-
Alkent İstanbul
2000
Göl
Malikaneleri
Üretici
Firma:Alarko
Gayrimenkul 2006 2008 63
607-
1200 * 1 800 000 -
2 500 000 $
Ayışığı Sitesi
Üretici
Firma:Demir
İnşaat 2008 2010 336 65-145
1+1,
2+1, 3+1 90 - 180000
TL
Beyaz City
Residence
Üretici
Firma:Beyaz
İnşaat 2007 2009 320 60-180
1+1,
2+1,
3+1, 4+1 120 -
320000 TL
Beyaz
Residence
Evleri
Üretici
Firma:Beyaz
İnşaat 2006 2008 *
150-
180 3+1, 4+1 *
Bizim Evler
Üretici Firma:İhlas
Yapı 2007 2009 720 85-210
1+1,
2+1,
3+1, 4+1 145-295000
TL
Fiba Manolya
Evleri
Üretici Firma:Fiba
Gayrimenkul/HDA 2007 2008 408
140-
225
3+1,
4+1,6+1, 280 000 TL
Günışığı Sitesi
Üretici
Firma:Demir
İnşaat 2005 2007 138
120-
150 3+1, 4+1 92-270000
TL
İstHANbul
Evleri
Üretici Firma:Han
Yapı 2006 2008 1600 84-142
1+1,
2+1, 3+1
112-
225000
TL
Kent Plus
Mimarsinan
Üretici
Firma:Emlak
Konut GYO 2005 2007 600 62-175
1+1,
2+1,
3+1, 4+1 126-320000
TL
Koza
Bahçeşehir
Evleri
Üretici
Firma:Garanti
Koza 2006 2008 292 70-202
1+1,
2+1,
3+1, 4+1 120-700000
$
Milpark
Üretici
Firma:MilPA 2008 2010 1000 36-150
1+1,
2+1,
3+1, 4+1 63-360000
TL
Opal Park
Üretici
Firma:Hasanoğlu
İnşaat 2008 2011 356
125-
260
2+1,
3+1, 32
dubleks 212500-
442000TL
Spradon Evleri
Üretici
Firma:Kuzu Grup
2006-2009 1738 65-456
1+1,
2+1,
3+1, 4+1
129000 -
1620000
TL

44
In this respect, the first differentiation in the housing typologies was seen in the size
of house dwellings. After the second half of the 1990s, the size of houses increased.
For instance, as can be seen in Figure 2.11, while the share of 150 square meters and
larger houses in overall occupancy permits for Turkey was 3% in the period between
1985 and 1989, and it increased to 5% in the period 1990-1994, then it increased to
23% in the period covered 1995-2002; finally it rose to 36% between 2003 and 2009
(SIS, 2001; TURKSTAT, 2005, 2007, 2008, 2009, 2010b).
Together with this growth, the ‘single house’ typology has shown an important role;
the share of 150 and more sq m-single houses in overall occupancy permits for
Turkey increased from 4%, to 24% and it rose to 34% over the above-mentioned
periods (SIS, 2001; TURKSTAT, 2005, 2007, 2008, 2009, 2010b). Nevertheless,
after the 2000s, as a reflection of changing profile of the population and their housing
demands, the share of dwelling units with less than 49 sq m in overall occupancy
permits for Turkey has increased. Between 1995 and 2002, this ratio was 0.8% then
it increased to 2% in the period 2003 and 2009 (SIS, 2001; TURKSTAT, 2005, 2007,
2008, 2009, 2010b).
In a same manner, apart from the previous periods; while the three and four-room
dwellings still took the lion’s share in the housing stock in Turkey; the proportion of
five-room houses in occupancy permits increased after the second half of the
2000s.26
In the 2000-2005 periods this ratio for Turkey was 28% then it increased to
35% the years between 2006 and 2009 (see Figure 2.12). At this stage, it is necessary
to note that all these findings do not completely characterize the transformation of
housing stock after the 1990s. Hence, the typologies of dwellings were analysed in
detail over the same period. There was a high correlation between the size of
dwellings and the number of rooms until the second half of the 2000s; for instance,
26
For more information the housing preferences of Turkish Households, please visit the internet page
available at: http://www.ilgazetesi.com.tr/2009/01/23/toki-bilinirlik-arastirmasini-yeniledi/

45
the period 2000-2005 the 88% of the 50-74 sq m-dwellings consisted of two-room in
Turkey. However, since the 2005, this correlation seems to have become weakened;
in the period covered 2006-09, the share of two-room dwellings in the overall 50-74
sq m-dwellings for Turkey decreased to 30% while the proportion of the three-room
dwelling was 51% and the proportion of four-room dwellings was 10% in the overall
50-74 sq m-dwellings of Turkey (see Figure 2.11).
Figure 2.11: The diversification of 50-74 sq m dwellings with reference to number of
room in Turkey (SIS, 2001; TURKSTAT, 2005, 2007, 2008, 2009, 2010b)
Here, it is necessary to note that refer to the nature of the housing industry itself; the
respond of housing industry to the changing preferences of households took at least
two years. However, Istanbul’s housing stock responded to the changing housing
demands and preferences of the households faster than rest of Turkey. For instance,
as a reflection of the increasing number of elderly people and the decline in the
05
101520253035404550556065707580859095
100
2000 2001 2002 2003 2004 2005 2006 2007 2008 2009
1 2 3 4 5 6 7

46
households’ size, the small dwellings became the most favourable in the housing
market; the share of the 50-74 sq m dwellings in overall occupancy for Istanbul
increased from 6% in the period 2000-2005 to 11% between 2006 and 2009. In a
same manner, the share of 150 and more sq m dwellings in overall occupancy
permits for Istanbul decreased from 30% to 18% respectively over the same periods.
(See Figure 2.12)
Figure 2.12: The share of dwellings in total occupancy permits with reference to sq
m between 2000 and 2009 in Istanbul (SIS, 2001; TURKSTAT, 2007, 2008, 2009,
2010)
Here, it is necessary to note that refer to the nature of the housing industry itself; the
respond of housing industry to the changing preferences of households took at least
two years. However, Istanbul’s housing stock responded to the changing housing
demands and preferences of the households faster than rest of Turkey. For instance,
0
5
10
15
20
25
30
35
40
45
50
2000 2001 2002 2003 2004 2005 2006 2007 2008 2009
0-49 50-74 75-99 100-119 120-149 150 and more

47
as a reflection of the increasing number of elderly people and the decline in the
households’ size, the small dwellings became the most favourable in the housing
market; the share of the 50-74 sq m dwellings in overall occupancy for Istanbul
increased from 6% in the period 2000-2005 to 11% between 2006 and 2009. In a
same manner, the share of 150 and more sq m dwellings in overall occupancy
permits for Istanbul decreased from 30% to 18% respectively over the same periods.
(See Figure 2.12)
Within a similar perspective, the two room-houses segment (one room and one
lounge) has shown an increase in Istanbul. Between 2000 and 2006 the share of two-
room dwellings in overall OP for Istanbul was 5% and it reached 12% in the period
2006-2009 (TURKSTAT, 2007, 2008, 2009, 2010). In addition, partly as a
consequence of the increasing number of gated communities and HDA prestige
projects in the outskirts of Istanbul, after the second half of the 2000s, for the first
time the seven and more-room dwellings took a significant value in overall
occupancy permits as 12% for Istanbul in the period covered 2006 and 2009
(TURKSTAT, 2007, 2008, 2009, 2010).
As mentioned in the preceding paragraph, the housing type diversified with reference
either to size or to number of rooms without any necessary correlation between. In
this manner, the housing market of Istanbul has offered various alternatives to
households compare to Turkey. For instance, in the period covered the 2000-2005
the 84% of 50-74 sq m dwellings in overall OP for Istanbul consisted of two-room;
nonetheless between 2006 and 2009 this segment consisted of two-room (52%),
three-room (37%), four-room (4%) and five-room (4%) segments. According to the
analyses, it is appropriate to claim that this diversification can be seen in all housing
types in Istanbul since 2005. (See Figure 2.13) To summarize then, while the share of
large dwelling units and the share of smaller dwelling units in overall occupancy
permits increase, meanwhile the typologies of dwellings also change: the share of
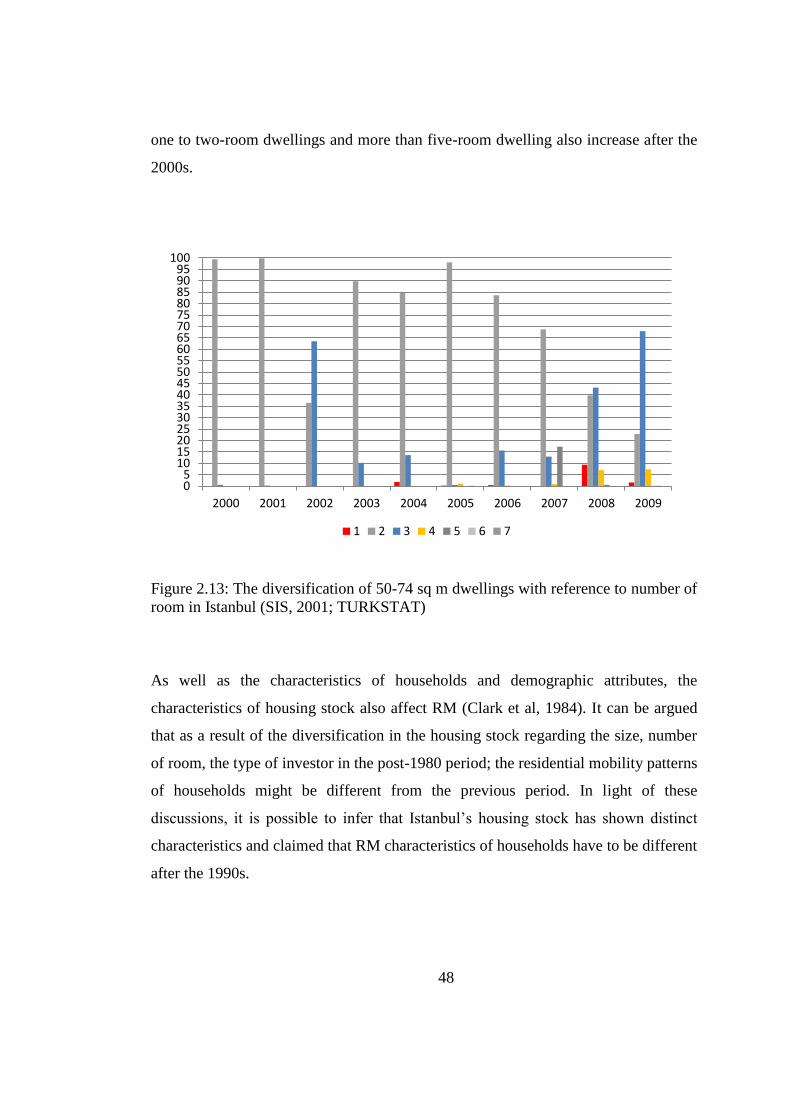
48
one to two-room dwellings and more than five-room dwelling also increase after the
2000s.
Figure 2.13: The diversification of 50-74 sq m dwellings with reference to number of
room in Istanbul (SIS, 2001; TURKSTAT)
As well as the characteristics of households and demographic attributes, the
characteristics of housing stock also affect RM (Clark et al, 1984). It can be argued
that as a result of the diversification in the housing stock regarding the size, number
of room, the type of investor in the post-1980 period; the residential mobility patterns
of households might be different from the previous period. In light of these
discussions, it is possible to infer that Istanbul’s housing stock has shown distinct
characteristics and claimed that RM characteristics of households have to be different
after the 1990s.
05
101520253035404550556065707580859095
100
2000 2001 2002 2003 2004 2005 2006 2007 2008 2009
1 2 3 4 5 6 7

49
2.4 Conclusion
Istanbul is under the spotlight in this chapter. The flow chart (Figure 2.14) below
contains the main events and the main figures of the transformation of the city in the
post-1980 period. In short, Istanbul is ageing, the average household size decrease,
the share of nuclear and single person households increase, the labour force
participation rate of female increase and service industry increases its share in the
city. Meanwhile, the housing industry of Istanbul is also transformed. While the big-
scale construction firms enter into the housing market, state left its audience role and
becomes a one of the important actors in the market. In compatible with this
transformation, the housing units are varied in terms of size, typology and location.
For instance, the shares of small-size (small than 65 m2) as well as extra-large-size
(large than 250 m2) housing units significantly increase in this period. Meanwhile,
upper-class residential areas widespread the geography of the city: such as Kemer-
country (former forest) and Göktürk (former gecekondu neighbourhood) and etc.
Here, it is necessary to restate that the main purpose of this chapter is to provide a
background or a kind of base map for analysing RM process of households of
Istanbul in the macro-level. Keep these findings in mind; basically, it is right to say
that the RM pattern of households of Istanbul have to be different in the post-1980
period. Now, the thesis moves on RM literature.

50
Figure 2.14 Transformation of Istanbul
51
CHAPTER 3
RESIDENTIAL MOBILITY
AS A FUNCTION OF LIFE CYCLE
3.1 Introduction
RM literature can conveniently be subdivided into micro- and macro approaches
(Cadwallader, 1992; Moore, 1972; Golledge and Stimson, 1997). The micro or
disaggregate, or behavioural, approach is mostly characterized by an interest in the
characteristics of movers and is concerned with the construction of models that
realistically represent the individual decision-making process involved in RM
(Quigley and Weinberg, 1977; Cadwallader, 1982, 1992). This involves mainly a
consideration of both why people move and why people do not move. On the other
hand, the macro or aggregate, or ecological, approach is used in two main contexts:
first, to analyse the spatial pattern of mobility flows, and second, to establish the
interrelationships between mobility flows and other features of the urban geography,
such as socio-economic, demographic, and housing characteristics (Moore, 1972;
Cadwallader, 1982, 1992). Here, the focus is on describing population flows
(sometimes in terms of socio-economic characteristics of population) at an aggregate
level between census tracts. Taking the risk of repeating myself, I want to restate that
these two approaches are completing rather than vying (see Golledge, 1980).
Whereas the roles of both approaches are significant in analysing RM, it is clear that
the combined approach of these two points of views could be more appropriate to
examining RM compare with each of them alone.

52
At the broadest level, this thesis aims to understand the relationships between RM
and urban geography in the case of Istanbul. In this respect, this chapter presents an
overview of RM phenomenon. The following review mainly focuses on RM process
in compatible with micro rather than macro-approach. However, it is important to
note that understanding the nature of RM is an important precondition to
understanding of the aggregate effects of mobility on urban geography (see chapter 5
and 6). This chapter of study is organized into five sections. It begins with a
discussion on the RM concept and its background. It then proceeds to the evaluation
of the behavioural modelling of RM studies. And in the next section of the chapter I
examine the micro-level approach in detail and finally summarize the evaluation of
RM from a historical point of view.
3.2 Defining Residential Mobility
Commonly, the permanent or semi-permanent relocation in the residence is defined
as “migration” (Lee, 1966; Roseman, 1971; Weeks, 2002). However, not all kind of
spatial relocation activities are included within this definition. Since the Ravenstein’s
study (1866 cited in Lee 1966), “laws of migration”, migration literature is divided
into the studies of migration, which are supposed to be motivated by the
opportunities for earning economic profits by the move, and the studies of intra-
urban migration or RM, which are presumed to be mainly triggered by the family
issues (Rossi, 1955; Clark and Onaka, 1983; Geist and McManus, 2008).
RM is an issue that has attracted considerable attention over the years.27
Since the
beginning of the 1950s sociologists, economists and psychologists have proposed a
number of interdisciplinary analyses of “who, why, when, and where and how
households move”. Because of the specialization of the mobility term, the RM
27
See Quigley and Weinberg, 1977; Clark, 1982; Dieleman, 2001; Vlist et al; 2002 for review of the
early literature see Li and Tu, 2011 for a review of recent literature.

53
literature gives a series of definitions of residential mobility, ranging from “decision-
making process” to “spatial adjustment process” or “a function of the household’s
dissatisfaction” or “a result of changes in housing needs”. In its simplest terms,
mobility refers to the local moves of the population within a neighbourhood, city, or
metropolitan area (Cadwallader, 1992; Dieleman, 2001). However, the most cited
definition of RM is driven by a mismatch between a household’s residential needs
and preferences as well as the household’s desire to come to a better matching
between the household’s space requirements (Clark and Onaka, 1983).
Dieleman (2001) argued that contemporary RM studies shifted their emphasis from
the demand factors of households (e.g. family size, income, occupation career, life
cycle events, and education attainments) to supply-side factors such as housing
policy and local housing markets’ characteristics. Clark and Onaka (1983), Dieleman
and Everaers (1994), Geist and McManus (2008) highlight the role of life-cycle
events; Böheim and Taylor (1999), Clark (2009) indicate the role of income;
Courgeau (1985), Clark and Winters (2007) analyse the role of family typology, on
mobility. Besides, Huang and Clark (2002), Hui (2005) and Li (2003) point out the
importance of the tenure choice, Teixeira and Murdie (1997) indicate the roles of
developers, real estate agents, and Dieleman et al., (2000), Li and Sui (2001) and
Vlist et al., (2002) focus on the differences of local housing market, in the RM
literature. In taking this forward, Knox and Pinch (2000) indicate that studying RM is
significant since it contributes to an understanding of the formation of urban
structure, which is consisted of many individual movements.
As previously indicated, the decisions about whether and where to move are
determined to a large extent by economic, life-course, housing, and residential
satisfaction factors. The most recent mobility research is defined by the household's
housing aspirations, stage and timing of events in the family life cycle: life-course
(Geist and McManus, 2008). In short, the impact of life-course approach and housing

54
policy strategies – the availability in housing market, the limitations in choosing
housing and the stringency degree in housing market -on residential mobility studies
are well-known.
Figure 3.1: RM and its embeddedness in three geographical scales (Dieleman, 2001)
Dieleman (2001) models RM process embedded in three geographical levels:
metropolitan, national and international levels. According to this model, represented
graphically in Figure 3.1, Dieleman (2001) describes the core as household level and
conceptualizes the interrelations between all scales as:
the matching of households and dwellings at the household level is embedded
in circumstances on these three geographical scales: 1. the metropolitan
55
housing market as a household lives in; 2. the national economic and
demographic circumstances as these develop and fluctuate over time; 3.
National level; differences in housing policies, wealth and tenure structure
which shape the RM process” (Dieleman, 2001:252).
In compatible with this point of view, Clark (2005) defines RM as “… a consistent
and pervasive behaviour forming a major element of the policy context: it affects the
conditions under which policies are developed and exerts a strong influence on their
outcomes” (Clark, 2005:15309).
3.3 Theoretical Perspectives on RM
RM studies are classified into two main perspectives: micro and macro (see
Cadwallader, 1992; Quigley and Weinberg, 1977). The micro approach (or
individual level) examines the movements of households at the individual level;
however, macro approach examines the spatially-dependent links of the movements
between origin and destination points at the aggregate level, in an urban context
(Cadwallader, 1992; Quigley and Weinberg, 1977). The latter studies, including
many ecological studies focusing on aggregate data, mostly use origin and
destination matrices of moves to understand the rules of spatial correlations (Quigley
and Weinberg, 1977). On the other hand, they also criticized this classification and
considered that “the macro level studies only provide extra evidence, based on
contextual effects, bearing on the decision process” (Quigley and Weinberg, 1977).
Another classification, which is under the same title, comes from Cadwallader
(1992). He argues that the macro-approach is concerned with explaining aggregate
mobility behaviour by analysing characteristics of socio-economic and physical
environments, such as age, income, education, etc. On the other hand, the micro-
approach mostly focusses on the psychological triggers of RM and is concerned with

56
why households do move or not move, plus how individuals choose between
alternatives (Cadwallader, 1992). It is necessary to say that while both approaches
are partially successful, a synthesis of these two approaches may be more successful
to understand RM process. In this respect, the conceptualization of Dieleman (2001),
as can be seen in Figure 3.1, is an appropriate attempt that aims to make a synthesis
of these two approaches.
RM was perceived, before the 1950s, as a pathological phenomenon associated with
transience: inadequate dwelling units, distressed in family and neighbourhood
deprivation (Shumaker and Stokols, 1982). In that era, RM studies examined the
standard economic model and develop alternative theories of this pure economic
process. These models are based on consumer utility theory whereby individuals
choose residential location in order to maximize their utility subject to an income
constraint (Dieleman, 2001). The actual decision of whether or not to move is
assumed to be undertaken by a rational individual based on a calculation of the
perceived costs and utilities associated with various alternatives by emphasizing on
the ultimate residential location (the “Where”). Lessons from the previous works on
mobility show that RM cannot be sufficiently explained by pure economic models. In
response, alternative RM theories with reference to sociology and physiology are
developed. These models include the life-cycle then life-course models, residential
satisfaction and environment issues which emphasis on the behavioural process of
moving (the “Why”). This chapter follows by examining micro approaches to RM.
3.3.1 Economically-Oriented RM Studies: Economists’ Utility Maximization
Approach to RM
From economists’ point of view, RM process of households is usually placed in a
partial equilibrium framework that results from the disequilibrium in housing
consumption (Quigley and Weinberg, 1977; Nordvik, 2001). In simple words,
57
economists suggest models in which assume that households move only if the
projected gain surpasses the cost of moving (Quigley and Weinberg, 1977). In this
sense, economists (Brown, 1975; Hanushek and Quigley, 1978) attempt to model the
decision making process using micro-economic principle of utility maximization
(Becker, 1964) or random utility function. These models mostly are based on
housing consumption disequilibrium approach (for review see Nordvik, 2001) or
housing consumption mismatch resulting from an unanticipated economic or
demographic shock (for review see Ihlanfeldt and Sjoquist, 1998).
Hanushek and Quigley (1978) are among the first who attempts to model the
relationships between mobility and housing consumption disequilibrium. In their
model, moving decision is modelled as a function of housing demand, transaction
and search costs, and the distribution of housing prices. Their findings indicate the
importance of changing housing demand in affecting moving decision and searching
intensity. Graves and Linneman (1979) develop a consumption model of residential
choice, in which housing market disequilibrium-induced migration is modelled as a
function of changes in the variables determining the demand and supply of the non-
traded goods which are location specific such as housing type, value of housing.
However, sociologists such as Rossi (1955) and Brown (1975) examine RM in
accordance with the life-cycle approach in the context of housing market.
3.3.2 Behaviourally-Oriented RM Studies: Domination of Sociologists’ Life-
Cycle Approach to RM
In his well-known book, “Why Families Move: a study in the social physiology of
urban RM”, sociologist Rossi (1955) finds that mobility is a common process which
is accomplished by households to adjust their housing demands in order to fit the
needs of an increasing or decreasing household size. He applies the life-cycle
approach to analyse the mobility. In compatible with this formulation RM is a

58
process that aims to adjust the changing households’ needs which are mainly the
outcomes of the changes in life-cycle domains (Rossi, 1955).
The life-cycle approach to RM interprets the mobility as a “functional response” to
the changes in life, mostly in family life (Geist and McManus, 2008). Geist and
McManus (2008) perfectly summarize Rossi’s classic life-cycle model.
The classic life-cycle model assumes an orderly transition through adulthood,
a trajectory that moves from the completion of education to entry into the
labour market, followed by marriage and the establishment of a nuclear
family household, followed by the transition to parenthood and several
decades of child-rearing before retirement (Geist and McManus, 2008:285).
Dieleman (2001) argues that the focus of attention of RM studies is changed by
Rossi towards analysing the triggers of households’ mobility to look for a new
housing in the individual level. Rossi (1955) defines mobility as a decision-making
process itself and points out three steps of mobility: 1) decision to leave old dwelling,
2) search for a new home, and 3) choosing new home from a set of alternatives. He
concludes that the most effective factors of residential relocation choice include life-
cycle issues, the housing tenure, general housing dissatisfaction and residential stress
(Rossi, 1955). In compatible with this point of view, he mentioned that the majority
of movers are driven by a desire to adjust their living space. Accordance with the
RM perception of Rossi, RM is a process that focusses on adjustment to the changes
in household life.
Brown and Moore (1970) state that mobility researches have focused on the decision
to move and RM’s interlinks with life-cycle events, in particular on the associations
with related tenure choice and occupation (see Clark and Onaka, 1983). In this
regard, as can be seen in Figure 3.2, RM is seen as a spatial adjustment process and

59
the aim of RM is rationalized as reducing the stress originating from the
contradiction between housing needs and aspirations, and actual housing
consumption-location, size, type, and tenure form (Brown and Moore, 1970;
Hanushek and Quigley, 1978). Brown and Moore (1970) also focus on the
household’s decision to move. However, as can be seen in Figure 3.3, they take this
point forward and divide the process into two stages:
…people become dissatisfied with their present housing situation, as changes
occur in the household environment or its composition. Afterward, room
stress arises in the present housing situation and eventually leads the
household to second stage: the search for a vacancy in the housing stock and
the decision either to relocate or to stay in the present dwelling (Brown and
Moore, 1970:45).

60
Figure 3.2: Brown and Moore’s RM model (1970)

61
Figure 3.3: Modified RM model of Brown and Moore

62
The complexity of the RM process is illustrated in Figures 3.2 and 3.3 which is a
modified model of the former. Brown and Moore (1970) also mention that
households, after a searching process, could choose or not to choose to move
depending on the availability of appropriate housing in local housing market. In these
circumstances, the inhabitants act in two-way: adjust their needs or make
arrangements in their existing housing units.
Figure 3.4: Speare’s RM model (Speare, 1974)
In the second half of the 1970s, residential satisfaction concept was included more
explicitly into model of RM. Speare et al., (1974) define three stages of RM process
(see Figure 3.4): “(1) development of a decision to consider moving, (2) the selection
of an alternative location, and (3) the decision to move or stay” (Speare et al, 1974).
According to Speare et al, a household will consider moving only if their
dissatisfaction passes some threshold; however, they only actually move if the future

63
benefits of move exceed the costs of moving. These first wave RM researchers’
findings or non-economic models lay the foundation for numerous subsequent
studies on the life-cycle process of RM.
The behaviourally oriented RM studies of Rossi (1955) and Brown and Moore
(1970) have significant effects on the following RM studies. They place the process
of RM in the context of housing studies and shift the focus from the aggregate move
to the move of individuals and their motivation to look for another dwelling. The
keystone of the RM literature is “How households are matched to houses”. In a
similar vein, as Dieleman perfectly says: “RM is seen as an adjustment process and
its impacts can be seen on both the households who move and the places they choose
in their relocation behaviour” (Dieleman, 2001).
Figure 3.5: Modified model of relationship between housing demand and RM
(Source: Thorns and Perkins, 2002)

64
After 1980, housing career concept has been clarified and examined explicitly in the
mobility studies. The term was originally developed in employment studies and
transferred into behavioural mobility models. In short, housing career concept
assumes that if upward mobility is available in employment career, the upward
mobility with improvement of housing situations (tenure, type, size, location,
amenities) is also available (Winstanley et al, 2002). Within this backdrop, in order
to increase in understanding the dynamics of the relationships between life-course
issues and RM process, examining housing careers by concerning the mutual
relations between life-course and RM provides a comprehensive as well as dynamic
way (Clark et al., 2003; Özüekren and Kempen, 2002). This relation can be seen in
Figure 3.5.
As mentioned above, in the previous periods, social scientists preferred more obvious
representations of people’s life and its transition as a result of macro-level
developments. Earlier research on the “life-cycle” assumed that the sequences of life
stages and the ages at which they occurred would be similar for all individuals and
households (Clark, 2001; Dieleman, 2001; Mulder and Dieleman, 2002; Özüekren
and Kempen, 2002); on the other hand, considering the externalities of RM this
interpretation is not right. To redeem these weaknesses of life-cycle approach, the
life-course perspective is developed as a comprehensive structure to represent society
by introducing a historical perspective into the study of how people live from birth to
death (Kertzer, 1983).28
In this approach, researchers have to focus on the events
themselves, and measure the intervals between them (Clark and Huang, 2004).In
compatible with the life-course approach, there are several spheres in life, and each
of them are closely related with social, housing and employment careers (Clark and
Huang, 2003; Dieleman, 2001; Mulder and Dieleman, 2002; Geist and McManus,
2008).
28
For detailed information on evaluation of life-course approach, see Kok (2007).
65
As indicated previously, in the household or individual level, as most of the moves
are short distance moves, the characteristics of local housing markets are closely
related with the RM behaviour of households (Clark and Dieleman, 1996). In this
respect, RM process cannot be understood without considering the attitude of local
housing markets (Dieleman and Everaers, 1994; Dieleman et al., 2000; Clark and
Huang, 2004; Jones et al., 2004). Lawrence (2008) usefully summarises that
relationships:
The housing market is the outcome of set of interrelated actions, procedures
and policies involving a wide range of individuals and institutions including
building contractors, real estate developers, property owners, financial
institutions, local and national authorities dealing with housing, building and
land-use planning, and households (Lawrence, 2008:).
As mentioned before, RM is a process through which the household adjusts its
housing consumption with reference to the demand for housing. Dieleman et al.
(2000) stated that RM creates a vacancy chain which may lead to a better matching
between housing consumption and housing needs. In this sense, housing market
provides an opportunity for households to select their housing and to adjust their
needs.
The variety of RM of households can depend either on what kind of housing is
allowed to be built and where, or on the changes of the housing market at the global
context (Floor et al., 1996 cited in Strassman, 2001). Housing conditions and housing
market options mostly tend to reduce the inequalities between the households. As a
result of diversity of choice in the housing market, levels of mobility can also be
expected to be influenced by the supply side of housing market where private rental
housing could accommodate frustrated potential movers.

66
Housing demand, housing supply, the features of dwellings, residential buildings and
environments as well as neighbourhoods are essential components of housing
markets (Vlist et al., 2002; Clark and Huang, 2003). The variety of RM of
households can be dependent upon both what kind of housing is allowed to be built
and where (Floor et al., 1996 cited in Strassman, 2001). Broadly, RM at the
household level links with local housing market choices which differ from city to
city. In other words, housing stock composition, local housing market, local
economic structure and local government behaviours as well as state’s position
within all these arenas, are assumed as significant variables for understanding the
interaction between RM process and housing market. In a similar vein, Clark and
Dieleman (1996 cited in Dieleman, 2001) assume that the mismatch between the
demand of household and the supply of housing market perfectly identify the
household mobility flows in the well-functioning housing market. Vlist et al (2002)
represents the interrelation between RM and housing as follows: “…first consider
whether there are differences in RM between local housing markets… then consider
what housing-market features determine these differences in RM rates” Vlist et al
(2002).
Seko and Sumita (2007) highlight that while RM is a function of life-course;
however, there are several environmental and institutional limitations to RM: such as
households’ “socioeconomic factors at the time of move and their future
expectations, financial asset position, price of tenure, government interventions on
housing, and housing policy” (Seko and Sumita, 2007). Similarly, residential
preferences and housing dissatisfaction are seen as another important component of
understanding the behaviour of households has the strongest influence not on when
to move but on where to move (Clark, 1991; Adriaans, 2007).
As previously implied, changes within households are not the only reason for
relocation. Here, the socio-spatial characteristics of RM and the quality of life issues

67
are added to the model. In this respect, Clark (1982) referred to the “inertia model”
and argues that “this model posits the longer one remains in a location the less
likelihood there is of moving …and quality of life factors, for example, climate, are
weighed against cost of living variables…”(Clark, 1982). In compatible with this
approach, Shumaker and Stokols (1982, cited in Winstenley et al., 2002) state that
the notion behind the RM is based on the desire to improve the life-style amenities
rather than to get a well-paid job.
As stressed above, there are distinctive regularities in RM studies and most of them
are mutually related with the contexts of the markets. In other words, RM behaviours
of households are dependent on the local housing market regularities and it is right to
expect that in the different market contexts for example US and Europe, RM
regularities act differently (Clark and Dieleman, 1996). Restrictions or regulations on
the local housing market have strong influences on RM. The government regulations
and market policies on housing are seen as an important factor of RM (Clark and
Dieleman, 1996 cited in Strassman, 2001). Briefly, the state and market play
different roles in different modes of RM (Cameron and Muellbauer, 1998).
Strassman (2001) also indicates that government intervention such as housing-
allocation rules as well as demographic shifts decreases the rate of RM. Government
and market play rather different roles on RM behaviour in different systems. For
instance, since complex government interventions in land use, finance, construction,
and pricing of housing constraint the supply of (new) housing in Europe, European
researchers analyse RM at the micro (individual) level and stress the complexity of
RM process (Strassman, 2001). On the contrary, in the US where the faiths in the
efficiency of the markets are dominated by less government control (Strassman,
2001). In such a market economies, housing is private and the main trigger of
housing supply and demand circle is the price (Strassman, 2001). All these
interactions are summarized by Huang and Clark “the different government-market

68
interaction results in different tenure choices and a different profile of housing
distribution among the population” Clark and Huang (2002). This is reflected in the
researchers’ approach to the RM process.
Within this background, Vlist et al. (2002) notice that the changes on households, the
changes on housing and environment, and the changes on housing market are the key
domains of understanding and modelling RM. Until at this point, the relationship
between RM and the changes in housing as well as the changes in housing market are
revealed. In what follows, I focus on the relationship between RM and the changes
on households’ characteristics in detail.
3.4 Changes on Households
As mentioned in the preceding paragraphs, in the RM studies, the reasons for
changing residence vary with the characteristics of the movers. A considerable body
of research has been dedicated to RM, in particular, to analyse the characteristics of
households who move, in other words, to answer “who they are”.
3.4.1 Socio-Demographic Characteristics of Households
As mentioned in the previous paragraphs, RM process is driven by a mismatch
between residential needs as well as preferences of households, and the
characteristics of their current housing situation (Brown and Moore, 1970; Speare et
al, 1974; Quigley and Weinberg, 1977; Ham and Clark, 2009). Clark and Dieleman
(1996 cited in Dieleman, 2001) state that this mismatch is often related with the
changes in households’ demographic profile in which it affects the need for more or
less space. In the same scope, Mulder (1993) highlights that age and composition of
household are among the most important predictors of RM. Singles and couples
without children are known to be more mobile than couples with children, mainly

69
because they are more likely to have few commitments, to have not yet settled and to
be working on their labour-market trajectory. In Clark (2009) income (and,
indirectly, level of education) is assumed to be an important factor in understanding
housing careers. After this short reminder, this section continues with a close look at
demographic characteristics of households who move.
3.4.1.1 Age
Studies in RM uniformly include age as an essential analytical variable. RM studies
fortify that young individuals are more mobile than old ones (Clark and Onaka,
1983; Long, 1992; Wulff, et al., 2010). As mentioned previously, there is a strong
relation between the propensity to move and the stage in the life-cycle or life-course
of an individual. In this context, as Wulff (2006) demonstrates that age also provides
a sociological view point in the life cycle or life-course approaches which are one of
the most used concepts in analysing RM. In all developed countries, people aged
between 20 and 35 are by far the most mobile population brackets, and RM typically
falls as one gets older (Rossi, 1955; Clark et al., 1984; Long, 1992; Clark, 2009).
Most of the RM analyses prove that the triggers of RM such as getting married, birth
of children, divorce or getting a new job, are concentrated at the young ages, this
partially clarifies why mobility decreases with age (Rossi, 1955). In a similar vein
Geist and McManus (2008) find that “…mobility peaks when people are in their 20s
compatible with high degrees of family formation and the establishment of
independent households among the young; then mobility decreases substantially for
individuals in their 30s and 40s, and remains low throughout the remainder of the life
course” (Geist and McManus, 2008).
On the contrary, some studies find that RM increases again in later life. Wulff, et al.,
(2010) focus on the mobility of middle-aged persons (aged between 45 and 64), an

70
understudied cohort in RM. The most important finding of this research is that mid-
life can no longer be simply viewed as settled, but instead represents a period of
great change (Wulff et al., 2010). Furthermore, Huang and Clark (2003) found that
older households were more likely to move in London. In their comprehensive
survey on RM of European elderly, Angelini and Laferre`re (2011) found that the
mobility of elderly was closely related with the housing market dynamics of the
countries, and they tended to move renting and small-size homes despite owning
homes.
3.4.1.2 Household Size
In the light of the literature, it is right to say that the relationship between household
size and RM is ambiguous. In their well-known analyses, Rossi (1955) found that
RM rates increases with household size. Long (1972), found that, on the contrary,
RM rates decreases with the increase in household size. However, the findings of
Torrens (2007) were mixed: two to four person households were more mobile than
single person or more than five-person households.
3.4.1.3 Household Typology or Family Type
Since most movers are dependents, accompanying the head of a household, the
household typology, rather than those of the individuals, is a critical factor
(Simmons, 1968). As indicated previously, the research tradition analysing the effect
of family change on RM has a long history (see Rossi 1955; Li and Tu, 2011). For
example, Courgeau (1985) examines the roles of family on RM in France. The
findings of his study in France show that having a child significantly raises the
likelihood to move. Clark and Withers (2007) observe relatively similar patterns in
their study: in the rental sector couples and nuclear families are less mobile than
single person; on the contrary they are more mobile than single person to move to
71
home ownership. It seems clear that household typology is to have a significant
impact on RM in various ways. First, living as a couple automatically entails a move
from either one or two of the partners (Böheim and Taylor 1999). The impact of
children is relatively complex as they tend to increase mobility at first, but ultimately
decrease it (Geist and McManus, 2008).
3.4.1.4 Education
RM research examines the effects of the changes in the educational career of
households in their mobility process (Geist and Manus, 2008; Clark, 2009). One of
the well-known findings of RM studies is the increase effect of high-education in
mobility (Clark, 2009). In other words, the more educated people are more mobile
than less-educated people. Wu (2007) indicates that Chinese Communist Party
membership and education, both enhancing the chance to move up the job ladder and
increase the mobility rate. In short, “wealthier and better educated families are more
mobile either in the sense of moving for exogenous reasons or moving more
frequently to adjust housing consumption” (Clark, 2009). In the same line of thought,
because better educated people can make easier use and analyse sophisticated
sources of information, they should show a higher propensity to move (Kan, 2007).
3.4.2 Economic Characteristics of Households
This section continues with the close look to economic characteristics of households
such as occupation, employment and tenure profile.
3.4.2.1 Employment
In the literature, unemployment is found to have mixed effects at the individual level;
unemployment increases the probability to proceed to a residential move, otherwise,

72
the overall unemployment level exerts a negative effect on mobility (Pissarides and
Wadsworth, 1989). In the case of unemployed households, whose bad economic
prospects discourage to move, nevertheless, the effect is more significant (Pissarides
and Wadsworth, 1989).
3.4.2.2 Tenure Profile
Tenure choice and mobility decision are usually treated as a simultaneous decision
making process the studies (Clark et al, 1994). Clark and Huang (2003) declare that
the relationship between housing tenure and RM is strong (see also Clark et al.,
1984; Clark, 2006). In general, renters are more mobile than homeowners (Clark et
al., 1984; Clark et al., 2003). This tendency is closely related with the quality of
housing: the quality of owner-occupied houses are mostly higher than rental houses,
so the higher quality of their existing houses declines the owners’ dissatisfaction
levels with the housing situation compared with renters’. Housing tenure with age
and household composition is one of the dominant correlates of the propensity to
move (Dieleman et al., 2000).
3.5 Conclusion
This brief review of RM literature demonstrates the fact that RM is a complex
process in theoretically as well as practically. Conceptualised either as a decision
making process or spatial adjustment process, the decision to move has unpredictable
variables within all levels. In short, this chapter identifies the nature of RM, its most
important domains, and the explanatory theoretical concepts and frameworks applied
in analyses, for example; age, education, household typology, occupation profile of
households and etc. Then, I conclude this chapter by a flowchart (Figure 3.7) which
contains main themes and main researchers of RM process with regard to historical
evaluation.

73
I believe it is important enough to restate that at first life-cycle and then life-course
approaches to modelling RM mainly aim to highlight the motivations of RM process
in the city through the analysis of the relationship between the changes on
households and housing industry. In this thesis, while the motivations of RM are not
mainly concerned, however, the variables of life-cycle method such as age,
education, employment and etc., are used to analyse the characteristics of movers
from the perspective of the thesis. In this respect, the micro-level analysis is carried
out in the following chapter.
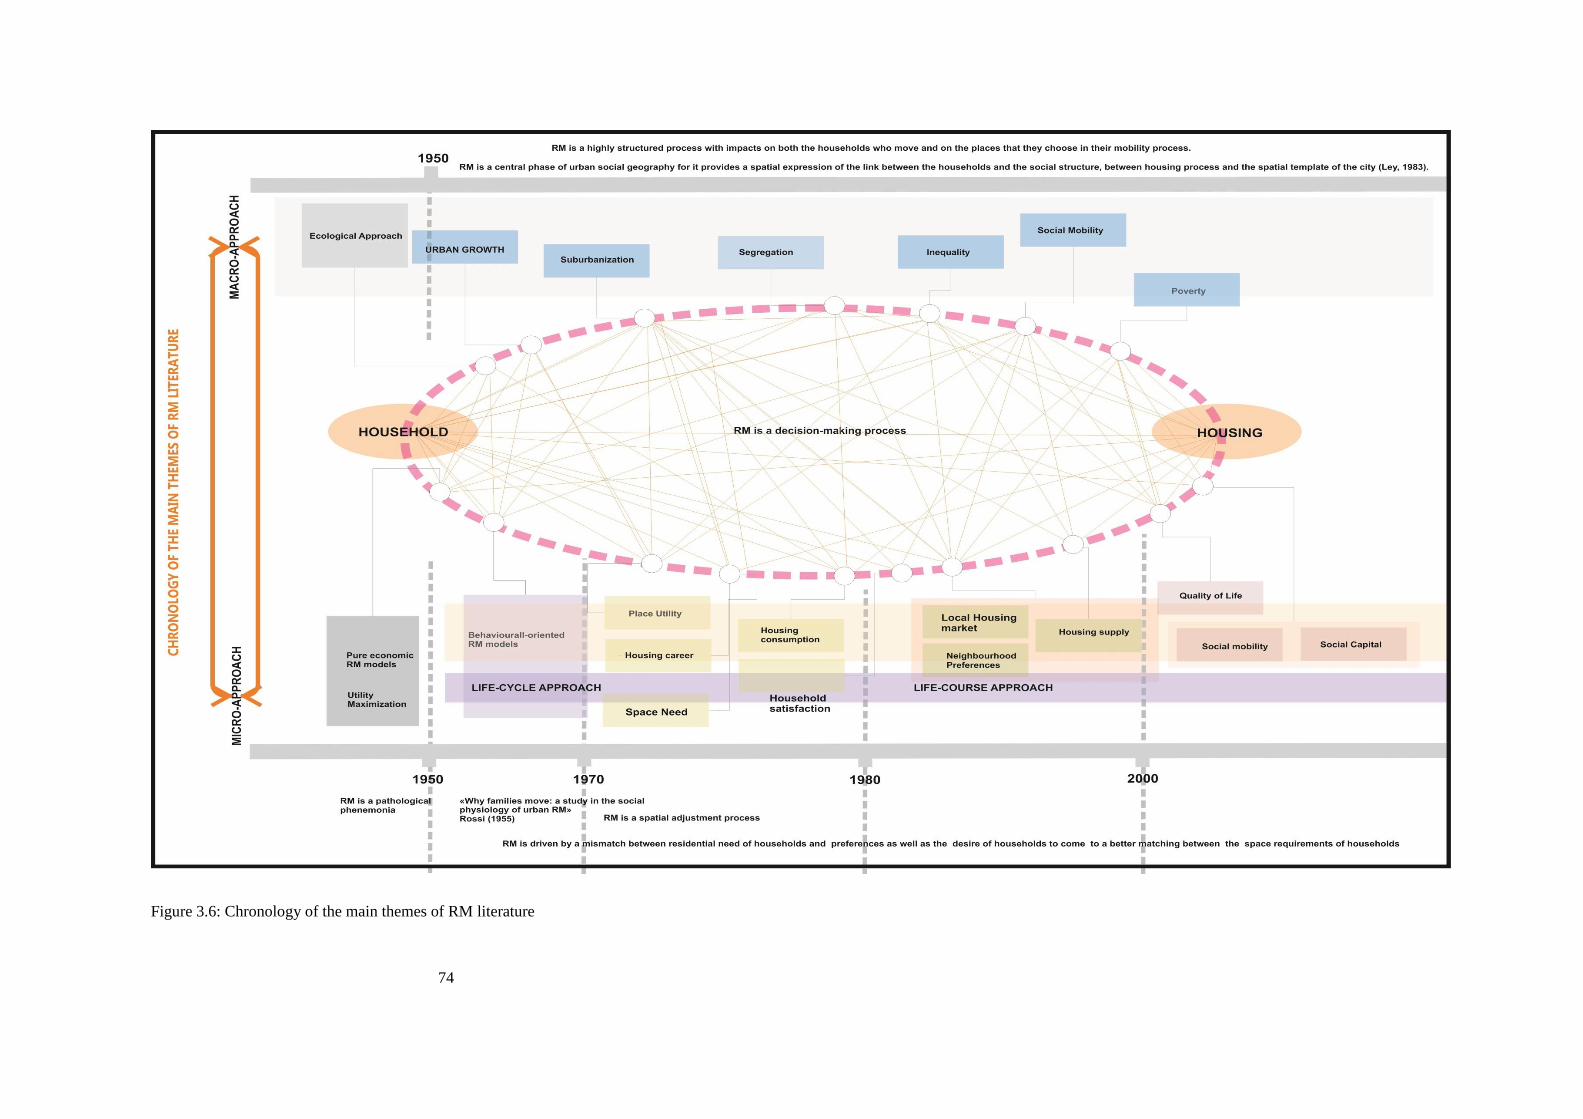
74
Figure 3.6: Chronology of the main themes of RM literature

75
CHAPTER 4
MOVERS: WHO ARE THEY?
4.1 Introduction
In this thesis, RM is assumed as a sequential process which operates by adjusting the
changing dynamics of households and urban geography. In compatible with this
perspective, in order to examine RM process in Istanbul, I develop the analysis with
two-tier. The first stage of the analysis examines the characteristics of movers
(chapter 4) and macro-level analysis highlights the spatial features and the effects of
the moves on urban geography of the city (chapter 6).
Recalling chapter 3, sociologists, economists and psychologist propose a number of
interdisciplinary analyses of “who, why, when, where and how households move”
(Clark, 1982; Dieleman, 2001; Li and Tu, 2011). In this chapter of the thesis, I
conduct an analysis to answer one of the questions above: “who are the movers”.
Life-course approach29
to RM identifies two major set of variables that are
examined: (1) demographic characteristics including age, household size and family
types or household typology; (2) economic status including education, occupation
and industry and labour force status. Within this background, this chapter gives an
29
As indicated in chapter 2, at first life-cycle and then life-course approaches to modelling RM
mainly aim to highlight the motivations of RM process in the city through the analysis of the
relationship between the changes on households and housing industry. In this thesis, while the triggers
of RM are not mainly concerned, however, the variables of life-cycle method such as age, education,
employment and etc., are used to analyse the characteristics of movers from the perspective of the
thesis.

76
overview of the demographic characteristics of the movers of Istanbul for the period
1990-2000, based on age, sex, size of the household and the structure of family. It
also covers the basic socio-economic variables, for instance labour force status,
employment sectors as well as the occupations. As previously indicated, the main
aims of this chapter is to explore the socio-demographic and economic characteristics
of the movers, to highlight the changes on the characteristics of the movers and to
show how RM process changes associated with the changes on these demographic
and economic settings of households during the ten-year period between 1990 and
2000. In other words, my main concern, here, is to explore how such changes
influence the RM process of households in Istanbul between 1990 and 2000. Finally,
it is right to say that the analyses provide a starting point for the macro-level question
of the thesis that rely on searching the linkages between households composition and
urban space in Istanbul.
4.1.1 Methods and Variables of the Analysis
In this section, at first the method (percentage distribution and location quotient
(hereafter LQ) and then the variables (age, size, type, education, labour force status,
employment profile) of the first level analysis are revealed.
4.1.1.1 The Methods of the Analysis: Percentage Distribution and LQ
Hakim (1977, 1978 cited in Visvalingam, 1983) claims that ratios as well as absolute
numbers are mostly used as social indicators in most of the area-based analyses.
However, using these methods is inadequate and misleading while analysing the
area-based social indicators.
Basically, the percentage distribution or ratio (%) is used to standardize the base
populations and to compare them. While Visvalingam (1983) discusses the

77
difficulties of this method, he notes that in small size population more extreme
values are produced by using percentage distribution method, while in large size
population the value remains on the average. The study of Visvalingam (1983) also
shows that percentage distribution cannot be appropriate to use in the case of
consideration of density or a reference points. Consequently, the percentage
distribution represents the problems of small populations more than observed and
also it is inappropriate for area-based analyses (Visvalingam, 1983). Another method
of this thesis is the LQ analysis (Table 4.1).
The formula of LQ30
:
(
)
(∑
∑ )
⁄
Where Eij = economic activity in sub-area i department j
Ei = total economic activity in sub-area i
∑Eij = economic activity of department j in the whole area
∑Ei = total economic activity in the whole area
As can be seen in Table 4.2, while analysing RM, this formula is converted as;
(
)
(∑
∑ )
⁄
Where Cij = independent variable frequency in sub-group of data set i
Ai = total independent variable frequency in sub-group of data set
30
For detailed information about lq and % methods please see this internet page available at:
http://mailer.fsu.edu/~tchapin/garnet-tchapin/urp5261/topics/econbase/lq.htm
(4.1)
(4.2)

78
∑Cij = independent variable frequency in the whole data set
∑Ai = total independent variable frequency in the whole data set
Therefore, the LQ method is commonly used in population geography, locational
analysis and economic geography; it has much wider applicability for calculating and
mapping relative distributions of analysed phenomena. As can be seen, both the
calculation and the interpretation of LQ are quite simple. An LQ = 1 entails that areai
(in this thesis a district of Istanbul under consideration) has the same composition
compared to region as a whole, an LQ> 1 means that there is a relative concentration
of the activity in area i compared to the region as a whole, in other words the activity
concerned is basic; and an LQ < 1 indicates that an activity under consideration is
non-basic for an areai compared to an area concerned.
Researchers of RM mostly prefer to use mostly area-based measurement methods;
therefore, LQ is not one of the commonly used methods in RM studies. However,
this method can be applied in the analysis of RM with reference to cross-sectional
approaches, especially through the case based design of LQ estimation. On the other
hand, according to the findings derived from the macro-level analyses of this thesis,
it is correct to claim that these two methods are not appropriate to figure out the
different patterns of the RM behaviour of households.
4.1.1.2 Variables of the Analysis
As mentioned in chapter 1, in this thesis, RM is measured by the microdata file
variables of population censuses 1990 and 2000. In order to make analysis more
comprehensive and complementary, number of variables are recoded or computed
from the original micro-data file (Figure 4.1). And ın Table 4.3, the input variables of
first-level analysis of this study are descripted.

79
Figure 4.1: The formulation steps of study data-sets

80
Table 4.3: The variables of the first-level analysis of the thesis
Variable
name
Categories of variable Frequency
Data-set
1990
Data-set
2000
Ag
e ca
tego
ry
0-24 age 3148 4472
25-39 age 33177 48740
40-49 age 17137 39405
50-64 age 16380 18033
65 + age 6079 6551
Ed
uca
tio
n
Not completed primary school 8366 9895
completed primary school 40364 58949
completed a middle school 8184 14029
completed high school equivalent 10541 20110
completed higher education schools 8414 14202
Ho
use
ho
ld s
ize
1 4459 10265
2 10704 21606
3 14917 27204
4-5 32280 45656
6-10 13020 12109
11+ 532 572
La
bo
ur
Ma
rket
Sta
tus
Wage –earner 35846 53381
employer 4734 7885
self-employed 11744 14548
unemployed 21375 10376
retired, housewife and 1969 31001
Fa
mil
y T
yp
e
Single person 746
Single parent with one child 292
Single parent with more than one
children
370
Couple 1710
Couple with one child 2988
Couple with more than one children 4092

81
The mobility status of households can be measured with the census in one of two
ways, either by using the districts of residence five years before to define inter-city
movers, or by using the city of residence five years before to define lifetime
migration between cities or nations. In order to measure the RM behaviour of
households, the movement variable has been computed from these two original
variables of microdata files. However, the interval for the districts of residence
question is fixed at five years. Given the focus of the analysis on inter-city
differentiations in RM, movement is defined as a triple variable: MIGRANT= moved
between cities in the past five years; NON-MOVER= lived in same district five years
earlier and MOVER= moved between the districts of the same city in past five years.
Age of households is measured by the age variable reporting the age of the
household head. The AGE variable is recoded from the original age variable of
microdata file and is defined in eleven categories: 0-19, 20-24, 25-29, 30-34, 35-39,
40-44, 45-49, 50-54, 55-59, 60-64, 65 and older for the ease of comparison RM
behaviours of households.
The household size is measured by the household-size variable that is recoded from
the original household size variable of microdata file. It is defined in six categories:
A= one-person households, B= two-person households, C= the three-person
households, D= the household size four to five, E= the household size six or greater
The education attainment level of households is measured by the education variable
that is recoded from original school variable of microdata file. This variable is
defined in five categories: A= illiterates and not schooling, B= primary school, C=
secondary school and its equivalent, D= high school and its equivalent, E= college,
university, master and PhD degree.
82
The family type of households is computed from the original household size and
relationship variables. It is defined in six categories: A= Single Person, B= Single
parent, C= Single parent with more than one child, D=Childless couple, E= Couple
with one child, F= Couple with more children
The labour status characteristics of households are measured by the Lab-Market
variable. This variable is computed from the original “work” and “does not work”
variables of microdata files. During the computing process, the 0-11 age population
is excluded from the “work” variable and the Lab-Market variable is defined in five
categories: A= Wage-earner, B= Employer, C= Self-Employer, D= retired,
housewife and revenue owner.
In the table above, the basic information about the variables used in the macro-level
analysis of the thesis is summarized.
4.2 The Findings
The findings of first level analysis which is basically aimed to examine the
characteristics of movers are listed. The findings are categorized under four
categories: demographic profile, household typology, social profile and economic
profile of movers.
4.2.1 Demographic Profile
Considerable agreement exists that RM is a highly structured process and primarily
driven by the “life-course”, that is age, household size, family type, educational
attainment of household and the occupation profile of households in the
contemporary RM literature. In this respect, I mainly analyse the movers of Istanbul
in terms of age, household size, family type and education attainment levels.

83
4.2.1.1 Age: The younger the more mobile
Istanbul finishes the demographic transition process in the late 1980s. In simplistic
terms, this means that Istanbul is ageing. In compatible with this fact, while the
median age of Istanbul’s households was 37 in 1990, it increased to 41 in the 2000;
and the share of 0-24 age households in overall Istanbul households remains the
same: 4.1% in the same period. In compatible with the ageing process of Istanbul,
while the share of 65 and older households in overall households of Istanbul
increased from 8% in 1990 to 9,5% in 2000; the highest share of households also
shift from 30-34 to 35-39 age bracket during the same periods (see Table 4.4 and
Table 4.5).
Table 4.4 Age profile of the movers, non-movers, migrants and Istanbul in data set-
1990
Demographic
characteristics
Movers Non-movers Istanbul Rate of
Mobility
Change
in rate
of RM Number % LQ Number % Number %
Age (a) (b) (c) (d) (e)
0-19 41 0.50 0.79 215 0.38 474 0.62 8.65
20-24 319 3.86 1.09 1359 2.39 2674 3.52 11.93 3.28
25-29 1293 15.63 1.21 5815 10.21 9813 12.93 13.18 1.25
30-34 1687 20.40 1.29 8642 15.17 12043 15.87 14.01 1.38
35-39 1426 17.24 1.16 8606 15.11 11294 14.88 12.63 -1.38
40-44 1070 12.94 1.02 7432 13.05 9589 12.63 11.16 -1.47
45-49 719 8.69 0.87 6029 10.59 7548 9.95 9.53 -1.63
50-54 518 6.26 0.78 4915 8.63 6120 8.06 8.46 -1.07
55-59 473 5.72 0.76 4743 8.33 5740 7.56 8.24 -0.22
60-64 324 3.92 0.66 3872 6.80 4520 5.96 7.17 -1.07
65 + 182 4.84 0.60 2413 5.25 2773 8 6.59 -0,58

84
Table 4.4 and Table 4.5 also illustrate that non-movers are older than movers in
Istanbul: while the median age of Istanbul is 43 in 2000, for non-mover it is 45 and
the median age of the movers is 38 in the same period. In addition, from 1990 to
2000 non-movers have become older: the share of 65 and older households in overall
non-movers were 5.25% in 1990, however, this share significantly increased to 11%
by 2000. This finding either fortifies the ageing trend of Istanbul’s population or
illustrates the increasing stability of Istanbul’s elderly in the post-1980 period.
Table 4.5 Age profile of the movers, non-movers, migrants and Istanbul in data set-
2000
Demographic
characteristics
Movers Non-movers Istanbul Rate of
Mobility
Change
in rate
of RM Number % LQ Number % Number %
Age (a) (b) (c) (d) (e)
0-19 85 0.59 1.03 354 0.36 719 0.57 11.82
20-24 624 4.34 1.18 2432 2.46 4604 3.67 13.55 1.73
25-29 2628 18.28 1.49 9821 9.92 15363 12.26 17.11 3.56
30-34 2998 20.85 1.41 13622 13.76 18590 14.83 16.13 -0.98
35-39 2544 17.70 1.16 15093 15.25 19088 15.23 13.33 -2.8
40-44 1764 12.27 0.92 13776 13.92 16682 13.31 10.57 -2.76
45-49 1278 8.89 0.81 11489 11.61 13693 10.93 9.33 -1.24
50-54 911 6.34 0.72 9489 9.59 11077 8.84 8.22 -1.11
55-59 598 4.16 0.67 6804 6.87 7821 6.24 7.65 -0.57
60-64 353 2.46 0.53 5209 5.26 5846 4.66 6.04 -1.61
65 + 270 4.13 0.47 4661 11.06 5118 9.46 5.28 -0.76
There is a strong life course trend towards RM and age: the younger the more
mobile. In the case of Istanbul, while focusing on the age composition of moves from

85
1990 to 2000, it can be seen that young households are more mobile than older ones
during this ten-year period. As can be seen in Figure 4.2 and Table 4.4, in column
“e”, mobility rate increase between 20 and 24 years of age, particularly between 30
and 34 years of age, and begin decreasing when households is 35 years old and older.
In compatible with this finding, while LQ value of (column “c”) movers aged
between 30 and 34 is 1.29; for movers aged 35 and 39 this value is 1,16 in 1990.
Here, as a matter of the fact that young households are more mobile than older
households in Istanbul both in 1990 and in 2000; meaning that the highest probability
occurs between the ages of 20s and 30s, with the beginning of married life and the
arrival of children; as a response to the changing housing space needs of families.
And then there tend to be greater stability in the older age. The LQ values of movers
aged 65 and older also fortify this fact: LQ value of those is only 0.60 in 1990. This
means that older households are not over represented among the movers in 1990.
Figure 4.2 RM rate of movers in terms of age in 1990 and 2000
0
2
4
6
8
10
12
14
16
18
0-19 20-24 25-29 30-34 35-39 40-44 45-49 50-54 55-59 60-64 65 +
1990 RM rate 2000 RM rate

86
Figure 4.2 divides the households into eleven sub-groups by age and shows the
distribution of RM rates of each sub-group. As illustrated in Figure 4.2, the gap
between RM rates of younger and older households becomes wider from 1990 to
2000. In other words, between 1990 and 2000, while young households become more
mobile, on the contrary, older households become less mobile in Istanbul. As can be
seen in Figure 4.2 and the tables above, while LQ value of movers aged 25-29 is 1.21
in 1990, this value rise to 1,49 in 2000. In accordance with this change, LQ value of
movers aged 65 and older is only 0.61 in 1990, nevertheless, by 2000 this value
decreases to 0,37. When compare the age profile of movers in Istanbul with
developed countries’ movers such as United States (20-35) and Netherland (19-29);
it is observed that movers of Istanbul are likely to move at a relatively older age
(EUROSTAT, 2011).
However, as known, RM is a process that mainly regulated by either the changes on
demographic profile of households or the variations on the housing stock in terms of
size, type, number, finance, location and etc. In this respect, the increase of young
households’ mobility rate from 1990 to 2000 is also the function of local housing
stock in Istanbul. More explicitly, if the housing stock cannot serve the appropriate
housing units demands of the young households in the post-1980 period, this RM
patterns cannot be seen in the city of Istanbul.
Taking the risk of repeating myself, I want to restate that young is more mobile than
old households; moreover, during the ten-year period between 1990 and 2000, while
young becomes more mobile (RM rate of 25-29 aged movers is 13.1% in 1990 and
17.1% in 2000) on the contrary older becomes less mobile (RM rate of 65 and older
movers is 6.6% in 1990 and 5.3% in 2000) in Istanbul. In other words, there should
be a negative correlation between age and RM rate in the case of Istanbul.

87
4.2.1.2 Household size: The smaller household the more mobile
Population of Istanbul is characterised by a smaller household size compared to that
Turkey. The average household size of Istanbul decreased from 4.1 in 1990 to 3.8 in
2000, while for Turkey the average household size decreased from 5 to 4.5 in the
same period. Recalling Chapter 2, this is closely related with significant decrease on
Child Women Ratio and fertility rate values of Istanbul, particularly in the period
between 1990 and 2000. Moreover, the decrease of average household size is closely
interrelated with changing household size composition of the city for instance the
significant increase of one-person household (from 5,7% in 1990 to 9% in 2000) in
the city.
Table 4.6 Household size profile of the movers, non-movers, migrants and Istanbul
in 1990
Demographic
characteristics
Movers Non-movers Migrants Istanbul Rate of
Mobility Number % LQ
Number % Number % Number %
Household
size
One-person 405 4.9 0.8 3346 5.9 708 6.6 4459 5.8 9.08
Two-person 1263 15.3 1.1 7847 13.8 1594 14.9 10704 14.1 11.80
Three-person 1858 22.5 1.1 10886 19.2 2173 20.3 14917 19.7 12.46
Four to five-
person 3604 43.6 1.0 24743 43.5 3932 36.8 32279 42.5 11.17
More than
six-person 1112 13.5 0.8 9752 17.1 2151 20.1 13015 17.1 8.54
The life-course approach points that household size is an important trigger of RM
process. In the line with this argument, in this thesis, I categorise the household size
into five sub-categories as: one-person, two-person, three-person, four to five-person

88
and more than six-person households, in order to highlight the household size
composition of households, of movers as well as the interaction between the changes
on household size and RM profiles of households in Istanbul. And, I think this point
is important to enough to repeat: household size indirectly affect RM process through
the changes in housing market conditions.
More explicitly, the household size composition of Istanbul remarkably changes
during the ten-year period between 1990 and 2000. As can be seen in Table 4.6 and
4.7, the share of smaller than four-person households in total households increased
from 39% to 52%, while the share of more than four-person households in total
household head decreased from 61% to 48% in the same period. In a simplistic term,
this means that compared to the pre-1980 period, the vast majority of households are
characterized as smaller households after 1990 in Istanbul: the share of one-person
household increased from 6% in 1990 to 9% in 2000; the share of two-person
household increased from 14% in 1990 to 19% in 2000; and for three-person
household this share increased from 19% to 24% in the same period.
Table 4.7 Household size profile of the movers, non-movers, migrants and Istanbul
in 2000
Demographic
characteristics
Movers Non-movers Migrants Istanbul Rate of
Mobility Number % LQ Number % Number % Number %
Household
size
One-person 1497 10.4 1.1 8244 8.3 1727 14.6 11468 9.2 13.05
Two-person 3218 22.4 1.2 17647 17.8 2577 21.7 23442 18.7 13.73
Three-person 3802 26.5 1.1 22667 22.9 2600 21.9 29069 23.2 13.08
Four to five-
person 4869 33.9 0.8 39352 39.8 3454 29.2 47675 38.1 10.21
Six to ten-
person 919 6.41 0.6 10451
10.5
7 1371
11.5
9 12741 10.2 7.21
89
Apart from this, it is important to point out that, in Istanbul, the percentage increase
in the number of one-person households is the largest: approximately 60% between
1990 and 2000. As mentioned in Chapter 2, this profile is closely related with the
increasing divorce rate and the decreasing marriage rate as well as the decreasing
fertility rate of Istanbul in the post-1980 period. Nevertheless, this transformation is
not interpreted by the changes on demographic profile of the city, it is more than this;
it is a reflection of the variation on the urban life-styles; such as single parent,
nuclear family, elderly living alone and yuppies.
In this sense, analysing household size does not give valuable information about the
changing life-styles in the city; as well as its relationship between RM processes.
Thus, in order to understand the relationship between RM and household
composition, a novel household typology (named as family type) is developed in the
following sections of this chapter. By doing so, I aim to answer this question: what
kind of linkage is there between RM and the family type of households in the case of
Istanbul? I believe that this kind of conception gives me an opportunity not only to
highlight the relationship between different family structures and RM, but also to
understand how diverse groups use urban space and how they become in advantage
or in disadvantage position compare to each other, through observing how and to
what extent these relationships change.
The findings show that the movers are smaller households compared to Istanbul.
Whereas, as can be seen from Table 4.6 and Table 4.7, one-person household movers
are underrepresented in 1990 (LQ value of those is 0.83); by 2000 they are
overrepresented (LQ value of those is 1.14). In taking this put forward, data also
indicates that two-person households become significant in this period: while LQ
value of those is 1.08 in 1990, LQ value of those is calculated as 1.20 in 2000. In this
respect, it is right to say that the movers in Istanbul are small households.

90
Figure 4.3 RM rate of movers in terms of household size both in 1990 and 2000
Figure 4.3 divides the households into five sub-groups by household size and shows
the distribution of RM rates of each sub-group both in 1990 and in 2000. In general,
it is noticeable that the smaller than four-person households are more mobile than
larger than four-person households in Istanbul; but in particular, the most mobile
segment is two-person households (RM rate of those 11.5% in 1990 and 13.7% in
2000). As can be seen in the figure above, in the case of Istanbul, RM rate of
households is inversely correlated with the size of households: in 1990, two-person
households’ RM rate was 13%; for three-person households it was 11% and for more
than six-person households it was only 9%. Besides, this already existing picture
becomes much more visible by 2000: RM rate of two-person households was 14%,
for three-person households it was 13% and only 7% more than six-person
households. This means that small households become more mobile, while larger
households become more stable during the ten-year period between 1990 and 2000 in
the city of Istanbul. If, as accepted in this thesis, RM is interpreted as an indicator of
0
2
4
6
8
10
12
14
16
One-person Two-person Three-person Four to five-person
More than six-person
1990 RM rate 2000 RM rate

91
well-being and the mechanism of changing their living arrangements and the
achievement of the adaptation of households to diverse socio-economic conditions;
then, the findings above are also interpreted as an indicator of well-being
improvement of those households.
However, it is interesting to see that the RM rate of one-person households is under
the average of Istanbul in 1990. In compatible with the argument above, it is right to
expect that one-person households to be more mobile. In 1990, as can be seen in
Table 4.6, the three-person households were the most mobile groups in Istanbul
(LQ=1.14). And, by 2000, this profile remarkably changes in Istanbul, the one-
person households becomes more mobile from 1990 to 2000 (LQ=0.83 in 1990 and
LQ=1.14 in 2000). However, as Figure 4.3 illustrates, the proportional increase in
one-person households RM rate is astonishing with 48% (from 9.08% to 13.05). In
this respect, while this tendency is interpreted as a reflection of the socio-economic
and demographic transformations; if the housing industry does not supply to the
varied demands of these new emerged groups, the RM rate of those could not reach
this value. Consequently, this is also interpreted as an indicator of the sensitivity
level of the local housing industry to the demographic transformations of the society.
Nevertheless, I would like to restate that in order to understand completely the
interrelationship between RM and the new formations of the family structure in the
society; the household size does not give adequate information. Thus, novel
categories have to be developed to highlight these interactions perfectly. In this
respect, in the next section of this chapter basically aims to this.
4.2.2 Household Typology
As mentioned in the preceding paragraphs, during the ten-year period between 1990
and 2000, the household size composition of Istanbul changes by a different way. As

92
a matter of fact, one of the most significant transformations is the decrease in the
average size of households. This initiates, also, the increase in small size households
contrary to the decrease in large size households. However, as previously stated, this
situation is closely linked with the significant increase of one-person households in
the post-1980 period.
Table 4.8 Household typology of the movers, non-movers, migrants and Istanbul in
2000
Household
characteristics
Movers Non-movers Migrants Istanbul Rate of
Mobility Number % LQ Numb
er %
Num
ber %
Numbe
r %
Family Type
Single Person 746 6.3 1.01 4930 6.3 759 8.6 6435 9.2 13.5
Single parent
with one child 292 2.4 1.00 2120 2.7 133 1.5 2545 2.6 11.5
Single parent
with more than
one children
370 3.1 0.88 3044 3.9 233 2.6 3647 3.7 10.1
Childless
couple 1710 14.3 1.26 9007 11.4 1112 12.6 11829 11.9 14.5
Couple with
one child 2988 25.0 1.20 16711 21.2 1918 21.7 21617 21.7 13.8
Couple with
more than one
children
4092 34.3 0.91 32271 40.9 2687 30.4 39050 39.2 10.5
After this quick glance to household size profile of population, in order to explore the
changing household composition of the city, the family type variable is computed
from the data sets of the thesis. As can be seen in Table 4.8 and Figure 4.3, the
family composition of households are categorized under six sub-groups as single
person (one person households), single parent with one child, single parent with

93
more than one children, couples with no child, couple with one child, couples with
more than one children. In interpreting these results, it is important to remember that
these values are derived from the modified data-set of 2000; thus, the ratio
distributions by family type sub-groups in the Table 4.8 could be overwhelmed.
4.2.2.1 Single Persons become more mobile between 1990 and 2000
In this period, the most significant transformation in the family structure of the
society is the expansion of single person households (one-person households). As
mentioned in the previous section of this chapter, in Istanbul single person
households become more mobile from 1990 to 2000. In compatible with this
increase, RM rate of single person households significantly increased from 9.08% in
1990 to 13.5% in 2000; meaning that from 1990 to 2000, the percentage increase in
the number of one-person households is the largest: approximately 48% between
1990 and 2000 (see Figure 4.4).
Figure 4.4 RM rate of movers in terms of family type in 1990 and 2000
0
2
4
6
8
10
12
14
16
SinglePerson
Singleparent with
one child
Singleparent withmore than
one children
Coupes withnot child
Couple withone child
Couple withmore than
one children
1990 RM RATE 2000 RM RATE

94
This profile is closely interlinked with the increase of the well-being of whole
society; on the other hand, in order to serve these differentiated preferences of
households, these are the reflections of the restructurings of urban space and housing
industry. If not, such an inconceivable increase on RM rate of single person
households cannot be seen in the city of Istanbul. In explicit terms, the housing
industry gains success to supply the demands of the social groups with the changed
social and RM patterns in the post-1980 period. Otherwise, the increase on single
persons’ RM rate could not be reached in such as significant value.
4.2.2.2. Couples are more mobile than Single Parents
In Istanbul, while single person becomes more mobile from 1990 to 2000, it is not
surprising to see that the most mobile segment in the society was “couples” in the
same period. In accordance with the life-course approach to RM, the moving
probability of people increases with the beginning of married life because of mostly
increase changes in space needs. The mobility tendencies of Istanbul’s households by
family typology also fortify this well-accepted regularity. As indicated in Table 4.6,
except couples with more than one children all couple sub-groups’ RM rate are over
the average of Istanbul: for childless couples it was 14.5, for couple with one child it
was 13.8 and for couple with more than one children it was 10.5, in 2000. On the
other hand, RM rates, of single parent with one child was 11.5 and of single parent
with more than one child was only 10.1 in the same period (See Table 4.8).
4.2.2.2 The more child the less mobility
As can be seen in Table 4.8, LQ value of childless couple mover was 1.26 in 2000,
meaning that in terms of family types, childless couples are far more mobile than
single parents; while LQ value of single parent movers was 1.0 in the same period.
Single persons have high mobility rate compare to single parents with more than one
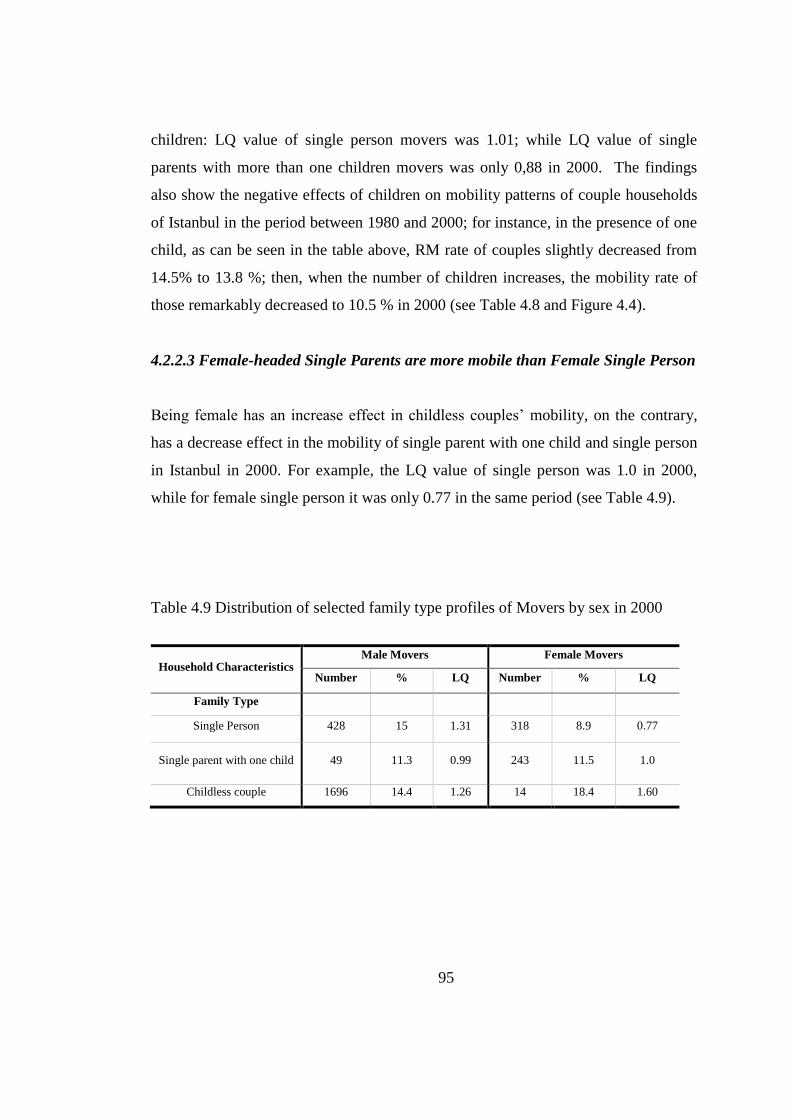
95
children: LQ value of single person movers was 1.01; while LQ value of single
parents with more than one children movers was only 0,88 in 2000. The findings
also show the negative effects of children on mobility patterns of couple households
of Istanbul in the period between 1980 and 2000; for instance, in the presence of one
child, as can be seen in the table above, RM rate of couples slightly decreased from
14.5% to 13.8 %; then, when the number of children increases, the mobility rate of
those remarkably decreased to 10.5 % in 2000 (see Table 4.8 and Figure 4.4).
4.2.2.3 Female-headed Single Parents are more mobile than Female Single Person
Being female has an increase effect in childless couples’ mobility, on the contrary,
has a decrease effect in the mobility of single parent with one child and single person
in Istanbul in 2000. For example, the LQ value of single person was 1.0 in 2000,
while for female single person it was only 0.77 in the same period (see Table 4.9).
Table 4.9 Distribution of selected family type profiles of Movers by sex in 2000
Household Characteristics Male Movers Female Movers
Number % LQ Number % LQ
Family Type
Single Person 428 15 1.31 318 8.9 0.77
Single parent with one child 49 11.3 0.99 243 11.5 1.0
Childless couple 1696 14.4 1.26 14 18.4 1.60

96
4.2.3 Social Profile
Under this title, the education attainment levels of households by mobility behaviour
and the interrelation between education attainment levels and RM profile are
examined. Furthermore, the transformation of this relationship is also on the agenda
of this sub-section.
4.2.3.1 Education levels: The level of education increases the rate of mobility
increase.
Clark et al., (2006), states that the level of education (indirectly the income) is
thought to be an important factor in understanding the changing patterns of RM. In
compatible with this argument, the research on RM shows that the higher level of
education, the greater the likelihood that households will have residentially mobile
during a given period of time. Within this background, Istanbul is not an exception.
Table 4.10 Education attainment level of the movers, non-movers, migrants and
Istanbul in data set-1990
Social
characteristics
Movers Non-movers Migrants Istanbul Rate of
Mobility Number % LQ Number % Number % Number %
Education
Attainment
Not formal
diploma 588 7.1 0.64 6708 11,8 1070 10,0 8366 11,0 7,03
Primary
school
graduates
4284 51.8 0.97 30795 54,1 5258 49,4 40337 53,2 10,62
Secondary
school
graduates
929 11.2 1.04 6117 10,7 1138 10,6 8184 10,8 11,35
High school
and its
equivalent
graduates
1334 16.1 1.16 7439 13,1 1768 16,5 10541 13,9 12,66
University or
College
graduates
1132 13.7 1.23 5855 10,3 1427 13,4 8414 11,1 13,45

97
As can be seen in Table 4.10 and Table 4.11, during the ten-year period between
1990 and 2000, the households of Istanbul became more educated in general. For
instance, whereas the share of households with no-formal diploma (hereafter low-
educated) in Istanbul decreased from 11% in 1990 to 8.3% in 2000; the share of
households with university diploma (hereafter high-educated) increased from 11% to
13% in the same period. This profile is closely related with the significant increase
on educational opportunities in Turkey as well as Istanbul. By 1990, the compulsory
schooling is extended from five to eight years, and linking with the opening up the
new universities both public and private, operating the distance learning (such as
Open University) systems could be seen as triggers of this significant increase.
Table 4.11 Education attainment level of the movers, non-movers, migrants and
Istanbul in data set-2000
Social
characteristics
Movers Non-movers Migrants Istanbul Rate of
Mobility Number %
LQ Number % Number % Number %
Education
Attainment
Not formal
diploma 651 4,5 0,55 8911 9,0 833 7,0 10395 8,3 6,26
Primary
school
graduates
5789 40,3 0,82 51379 51,9 4657 39,3 61825 49,4 9,36
Secondary
school
graduates
1784 12,4 1,04 11938 12,1 1197 10,1 14919 11,9 11,96
High school
and its
equivalent
graduates
3115 21,7 1,23 15997 16,2 2882 24,3 21994 17,6 14,16
University or
College
graduates
3037 21,1 1,65 10741 10,9 2294 19,3 16072 12,8 18,90
Within this background, the movers of Istanbul are shown more educated profile than
non-movers and overall Istanbul during the ten-year period between 1990 and 2000.

98
In other words, the movers are more educated than non-movers of Istanbul in the
same period. For instance, the share of university graduated households in movers
was 13.7% in 1990, among the non-movers this share was 10.3% in the same year.
The fact above also is fortified by LQ analysis of households educated attainment
levels. The findings of this analyses show that whereas the LQ value of movers with
no-diploma was 0.64 this value for university graduated movers was 1.23 in 1990.
Figure 4.5 RM rate of movers in terms of education attainment levels in 1990 and
2000
This profile, as can be seen in Table 4.11, is valid among the movers of Istanbul in
2000. In simplistic terms, these findings are interpreted as evidence that there is a
positive correlation between education levels of households and RM rate. In other
words, households with higher-education level are more mobile than households with
lower-education level. For instance, as Figure 4.5 perfectly illustrates, in 1990
whereas low-educated movers’ RM rate was 7.0%, high-educated movers’ RM rate
was 13.5% in the same period. The movers of 2000 also reflect this profile: the low-
0
2
4
6
8
10
12
14
16
18
20
Not formaldiploma
Primary school Secondaryschool
graduates
High school andits equivalent
graduates
University orCollege
graduates
1990 RM rate 2000 RM rate

99
educated movers’ RM rate was 6.3% and the high-educated movers’ RM rate was in
the same period 19.0% in 2000.
While focusing on these two tables with a comparative perspective, it is obvious that
the movers are more educated than Istanbul; moreover, their education attainment
level remarkably increases during the ten-year period between 1990 and 2000. The
changes on LQ values of the movers verify this argument as well: for instance, the
LQ value of low-educated movers was 0.64 in 1990 since then it decrease to 0.55 in
2000. In addition, the LQ value of high-educated movers was 1.23 in 1990 however
it increased to 1.65 in 2000. In the line of these findings, as Figure 4.5 illustrates, it is
a matter of fact that high-educated households (in 1990 RM rate= 14%, in 2000 RM
rate=19%) are more mobile than low-educated households (in 1990 RM rate=7%, in
2000 RM rate=6%), and their mobility rate increases between 1990 and 2000. These
findings also highlight that during the ten-year period between 1990 and 2000 the
high-educated households are the most mobile segment of the society in Istanbul. In
the same scope, it is also the fact that low-educated households are more stable than
high-educated households and their stability increases between 1990 and 2000 (see
Figure 4.4).
The interrelationship between education and poverty is clear: well-educated people
have higher income earning potential, and are better able to improve the quality of
their lives. As Tsakloglou (1990) claims that there is a negative correlation between
education attainment level of households and the likelihood of being poor. In the
case of Turkey, the findings of research which was conducted in 2009, supports the
argument above. 31
In 2009, the poverty rate for the people who are not literate or
who are not graduated from a school is approximately 30%, this rate decreases to
15% for the people graduated from primary school. For the people graduated from
31
The research, here, is done by TURKSTAT which is one of the main bodies to investigate the
relationship between education and poverty in Turkey.

100
high school or equivalent professional schools the rate was 5% and was 0.7% for the
people graduated from a university degree. In simplistic terms, this means that as the
educational level of the households increases the probability of that household being
poor decreases.
Within this background, I believe it is right to state that high-educated households
are regarded as well-being or high-status groups; and in a similar perspective, low-
educated households are regarded as poor or low-status groups. In compatible with
this perception, as a matter of fact that during the ten-year period between 1990 and
2000, the high-status groups are more mobile than low-status groups; also, the high-
status groups become more mobile, the low-status groups become more stable in the
city of Istanbul. This formulation helps me to interpret the RM behaviours of these
groups within the context of the restructurings of Turkey in terms of social,
demographical and economical in the post-1980 period.
As mentions in the preceding paragraph, according to the findings of disaggregated
analyses of the thesis, high-status households are the most mobile segment of the
society; on the contrary, the low-status groups are less mobile segment in the society.
At this point, I think that these two groups are the subject of detailed analyses. One
way to both capture the role of education and provide an expression of the
differences between low-and high-educated groups is the cross-tabulation of
disaggregated data with education. By doing so, I assume that the effect of education
on RM process of households has become more perceptible and is better able to
interpret in the case of Istanbul.

101
Figure 4.6 The LQ analysis of movers: cross tabulation of age and education levels
for 1990 and 2000
As can be seen in Figure 4.6, in 1990, LQ values of college or university graduated
prime age movers was 1,5, meaning that young university graduates are far more
mobile than other groups; while LQ value of high-educated elderly movers was only
0,5. This makes it clear that the advantages brought about by virtue of having a
university degree are off-set by the disadvantages brought about by being elderly. In
compatible with this fact, by 2000, the already existing picture stays the same for
both age groups: LQ value of college or graduated prime age movers increased to
2.0; besides, LQ value of high-educated elderly movers was only 0.3, meaning that
the advantages brought about by virtue of having high-educated do not work later in
life; however, their effect is multiplier for young people.
1990 2000 1990 2000 1990 2000 1990 2000 1990 2000
Not FormalEducation
Primary SchoolGraduates
SecondarySchool
Graduates
High-school andits equivalent
College andUniversityGraduates
0-24 0,3 0,7 1,1 0,9 1,1 1 0,9 0,9 1,8 1,8
25-39 0,8 0,6 1,1 0,8 1,2 1 1,4 1,3 1,5 2,3
40-54 0,7 0,5 0,9 0,5 1 0,6 1 0,8 1,1 1,3
55-64 0,6 0,3 0,7 0,3 0,7 0,5 0,7 0,6 0,9 0,9
65+ 0,6 0,2 0,7 0,3 0,6 0,3 0,6 0,4 0,5 0,3
0
0,5
1
1,5
2
2,5
LQ

102
Figure 4.7 The LQ analysis of movers: cross tabulation of household size and
education levels for 1990 and 2000
In 2000, as indicated in Figure 4.7, LQ value of college or university graduated two-
person household movers was 2.1 and LQ value of college or university graduated
more than six-person household movers 1.1; meaning that high-educated smaller size
households are far more mobile than the other segments of the society. However,
focusing on the figure 4.6 in detail, it is seen that LQ value of college or university
graduated more than four-person households was 1.2 in 1990 and 1.5 in 2000. In a
simplistic term, means that while more than four-person households are not more
mobile, college or university graduated more than four-person households are more
mobile.
1990 2000 1990 2000 1990 2000 1990 2000 1990 2000
Not FormalEducation
PrimarySchool
Graduates
SecondarySchool
Graduates
High-schooland its
equivalent
College andUniversityGraduates
One-person 0,4 0,5 0,8 0,7 0,8 1,1 1 1,3 1,3 2
Two-person 0,5 0,4 1,1 0,8 1,1 1,2 1,2 1,7 1,3 2,1
Three-person 0,7 0,5 1,1 0,9 1,2 1,2 1,4 1,4 1,3 1,8
more than four-person 0,7 0,5 0,9 0,7 0,9 0,8 1 1 1,2 1,5
0
0,5
1
1,5
2
2,5
LQ

103
Furthermore, it is interesting to see that LQ value of college or university graduated
one-person households was 1.3 in 1990, meaning that apart from the general profile
of one-person households, college or university graduated one-person households are
more mobile. All these findings fortify that the advantages of having a university
degree have an increased effect on all household size groups but the advantages of
having college or university graduated have multiplied effect for larger-size
households. However, as mentioned proceeding section, this profile is not only the
reflection of the restructuring in demographic settings of the city, but also the
function of the variations in the local housing market in terms of: finance, location,
type and size of housing units in the post-1980 period.
Figure 4.8 The LQ analysis of movers: cross tabulation of family type and education
levels in 2000
Not formalEducation
PrimarySchool
graduates
SecondarySchool
graduates
High schooland its
equivalentgraduates
College oruniversitygraduates
Single person 0,4 0,8 1 1 1,7
Single Parent 0,5 0,8 1,4 1,1 1,7
Single Parent with more than onechildren
0,5 0,8 1 1,4 1,5
Couples with no child 0,4 0,8 1,4 1,7 2,1
Couples with one child 0,5 0,9 1,1 1,3 1,7
Couple with more than one children 0,6 0,8 0,9 1 1,3
0
0,5
1
1,5
2
2,5
LQ

104
College or university graduated couples are far more mobile than the other groups, as
can be seen in Figure 4.8, LQ value of those was 2.1 in 2000. It is interesting to see
that, in 2000, LQ value of college or university graduates single parent movers was
1.7, in addition to this, LQ value of college or university graduated single parent with
more than one child movers was 1.5, meaning that compare to single parent movers
high-educated single parent movers are more mobile. In this respect, it is clear that
the disadvantages of being single parent are off-set by the advantages brought about
by virtue of having a university degree. Here, taking the risk of repeating myself, I
want to say that this already existing picture is not an output of the restructuring of
the socio-economic and demographic profile of the city; it is much more related with
the transformations of the local housing market in the post-1980 period. In a
simplistic term, this RM patterns are only seen if local housing market is supplied the
diverse housing demands of these groups in terms of finance, type, size and etc.
Within this background, in the next section of this chapter, economic profile of
households and the relationship between the RM profile and economic characteristics
of households is examined in either 1990 or 2000.
4.2.4 Economic Profile
In this section, economic profile of mobile households (mover) is examined under
three sub-titles: labour force status, employment sector and occupation profile.
Moreover, during the ten-year period between 1990 and 2000, the changes on
economic profile of the movers and the effect of these changes on RM profiles of
those are on the agenda of this section.
4.2.3.1 Labour force status: Employers are more mobile than wage-earners
A closer look at the distribution of labour force status of households in Istanbul
reveals that an even higher proportion of labour force is in wage-employment. As
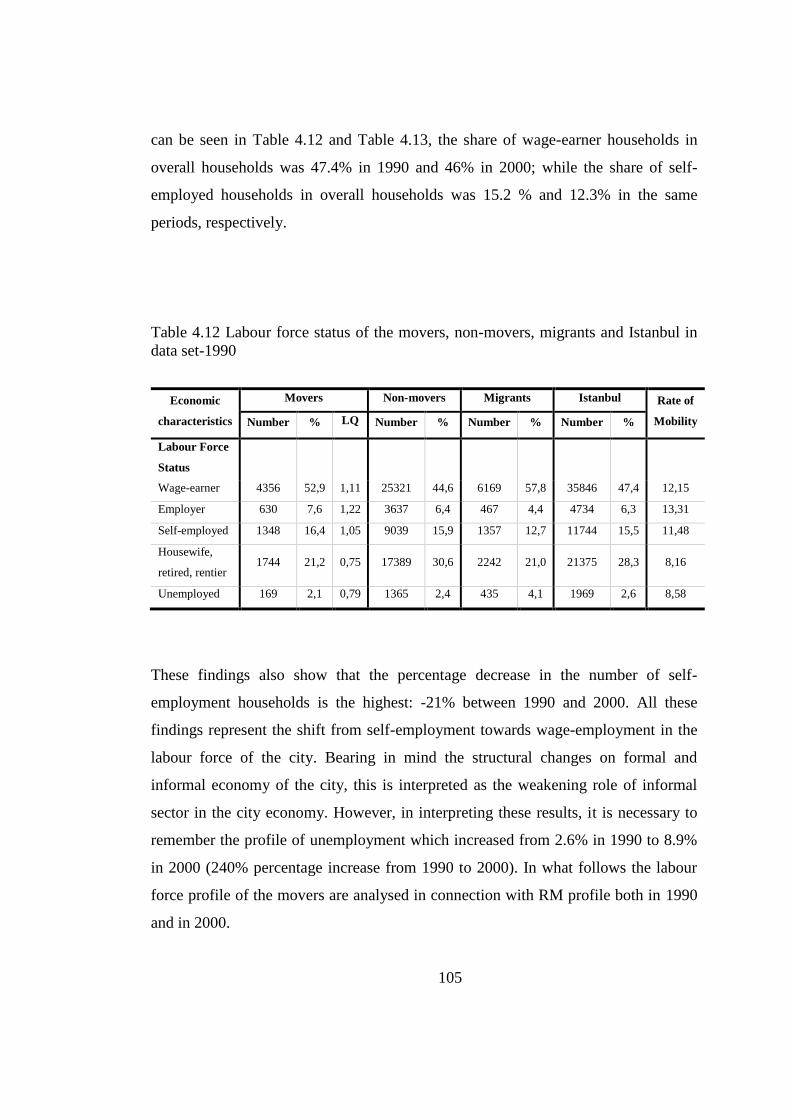
105
can be seen in Table 4.12 and Table 4.13, the share of wage-earner households in
overall households was 47.4% in 1990 and 46% in 2000; while the share of self-
employed households in overall households was 15.2 % and 12.3% in the same
periods, respectively.
Table 4.12 Labour force status of the movers, non-movers, migrants and Istanbul in
data set-1990
Economic
characteristics
Movers Non-movers Migrants Istanbul Rate of
Mobility Number % LQ Number % Number % Number %
Labour Force
Status
Wage-earner 4356 52,9 1,11 25321 44,6 6169 57,8 35846 47,4 12,15
Employer 630 7,6 1,22 3637 6,4 467 4,4 4734 6,3 13,31
Self-employed 1348 16,4 1,05 9039 15,9 1357 12,7 11744 15,5 11,48
Housewife,
retired, rentier 1744 21,2 0,75 17389 30,6 2242 21,0 21375 28,3 8,16
Unemployed 169 2,1 0,79 1365 2,4 435 4,1 1969 2,6 8,58
These findings also show that the percentage decrease in the number of self-
employment households is the highest: -21% between 1990 and 2000. All these
findings represent the shift from self-employment towards wage-employment in the
labour force of the city. Bearing in mind the structural changes on formal and
informal economy of the city, this is interpreted as the weakening role of informal
sector in the city economy. However, in interpreting these results, it is necessary to
remember the profile of unemployment which increased from 2.6% in 1990 to 8.9%
in 2000 (240% percentage increase from 1990 to 2000). In what follows the labour
force profile of the movers are analysed in connection with RM profile both in 1990
and in 2000.

106
Table 4.13 Labour force status of the movers, non-movers, migrants and Istanbul in
data set-2000
Economic
characteristic
s
Movers Non-movers Migrants Istanbul Rate of
Mobilit
y Number %
LQ Number % Number %
Numbe
r %
Labour
Force Status
Wage-earner 7986 55,55 1,20 42664 43,11 7247 61,08 57897 46,2 13,79
Employer 1308 9,10 1,37 6667 6,74 344 2,90 8319 6,6 15,72
Self-employed 1897 13,20 1,08 12378 12,51 1080 9,10 15355 12,2 12,35
Housewife,
retired, rentier 1989 13,84 0,53 28542 28,84 1917 16,16 32448 25,9 6,13
Unemployed 1195 8,31 0,93 8719 8,81 1277 10,76 11191 8,9 10,68
As indicated in Table 4.12, LQ value of employer movers was 1.22 in 1990, meaning
that employers are far more mobile than retired, housewives and rentier, while their
LQ value was only 0.75 in the same period. This tendency holds true in 2000 (see
Table 4.13): LQ value of former was 1.37 and for later it was 0.53. As the figure
given below make it clear that during the ten-year period while employer becomes
more mobile; housewives, retired and rentier become more stable in the city of
Istanbul.

107
Figure 4.9 RM rate of movers in terms of labour force status in 1990 and 2000
The bars, in Figure 4.9 show the distribution of RM rate between 1990 and 2000 in
terms of labour force status sub-groups. In this respect, the figure 4.8 shows that the
biggest increase is in the employer households RM rate. It is interesting to see that
while unemployed movers were less mobile, their mobility rate increased from 8.6%
in 1990 to 10.7% in 2000. It is obvious that this profile is closely interlinked with
changing urbanization dynamics including life-styles in the city after 1980. In what
follows on this section the education attainment profile of movers are analysed by
labour force status groups. However, this is also the reflection of the transformations
in the housing industry, which means the increase on RM rate of unemployed movers
is accordance with the changes on housing industry in terms of finance, type and size
of housing, etc.
0
2
4
6
8
10
12
14
16
18
Wage-earner Employer Self-employed Housewife,retired, rentier
Unemployed
1990 RM rate 2000 RM rate

108
Figure 4.10 LQ analysis of movers: cross tabulation of labour force status and
education levels for 1990 and 2000
As can be seen in Figure 4.10, there are differences in the labour force status sub-
groups for RM by education level. LQ value of college or university graduated
movers was 2.1 in 1990 and 1.7 in 2000, meaning that high-educated wage-earners
are more mobile than other groups. Besides, it is interesting to see that high-educated
households have the highest LQ values in all labour force status groups including
unemployment. This makes it clear that the advantages brought about by virtue of
having a university degree are off-set by the disadvantages brought about by being
unemployed. In other words, these also represent the remarkable effects of education
on RM profile of households during the ten-year period between 1990 and 2000 in
the city of Istanbul.
1990 2000 1990 2000 1990 2000 1990 2000 1990 2000
Not FormalEducation
Primary SchoolGraduates
SecondarySchool
Graduates
High-schooland its
equivalent
College andUniversityGraduates
Wage-earner 0,7 0,8 0,9 1 1,1 1,1 1,5 1,4 2,1 1,9
Employer 0,5 0,5 1 1 1,5 1,4 1,6 1,6 1,8 1,8
Self-employed 0,6 0,7 0,9 0,9 1,3 1,3 1,4 1,4 1,8 1,7
Unemployed 0,6 0,6 0,8 0,8 0,9 1 1,3 1,2 1,7 1,7
Housewife, retired, rentier 0,4 0,4 0,4 0,5 0,6 0,6 0,7 0,7 0,7 0,7
0
0,5
1
1,5
2
2,5
LQ

109
4.2.3.2 Occupation and Employment sectors: Employing in FIRE has an increase
effect on RM of households
Table 4.14 and Table 4.15 show the shares of employment by selected sectors
(manufacturing, construction and FIRE) of Istanbul, movers and non-movers, and the
RM rates of households by selected employment sectors. In Istanbul, while
manufacturing and construction are in decreased trend FIRE, on the contrary, is in
the increased trend between 1990 and 2000. As can be seen in the tables below, the
share of FIRE slightly increased from 5.06% to 5.1% in the same period.
Table 4.14: The distribution of the movers, non-movers, migrants and Istanbul by
selected employment sector in 1990
Economic
characteristics
Movers Non-movers Istanbul Rate of
Mobility Number % LQ Number % Number %
Industry Type
Manufacturing 2062 25 1,2 12158 21,4 16320 22 12,63
Construction 386 5 0,78 3040 5,3 4515 6 8,55
Finance,
Insurance, Real
Estate and
Rental and
Leasing (FIRE)
567 7 1,3 2727 4,8 3839 5,06 14,77
However, in interpreting these results it is necessary to look at the percentage
increase of these values: the highest percentage increase is at FIRE (2%) while for
manufacturing (-5%) and for construction (-2%) in the same period. This makes it
clear, in assistance with huge service sector investments in the city, after the 1990s,
the growth of service becomes significant. However, in order to further our

110
understanding of the interrelationship between the RM profile of households and in
which they employed, I focus on the characteristics of movers in detail.
Table 4.15: The distribution of the movers, non-movers, migrants and Istanbul by
selected employment sector in 2000
Economic
characteristics
Movers Non-movers Istanbul Rate of
Mobility Number % LQ Number % Number %
Industry Type
Manufacturing 3546 24,5 1,2 20086 20 25880 21 13,8
Construction 642 4,5 0,8 5078 5,1 6640 5,3 10
Finance,
Insurance, Real
Estate and
Rental and
Leasing (FIRE)
1848 13 1,5 4447 4,5 6384 5, 19
As Table 4.14 and Table 4.15 illustrate, the share of households employed in FIRE in
movers significantly increased from 7% in 1990 to 13% in 2000 (with 85%
proportional increase); while the shares of manufacturing and construction remained
almost same value in this period. This means that households work in FIRE are more
mobile than counterparts who work in manufacturing and construction; and they
become more mobile from 1990 to 2000: RM rate of those increased from 14% to
19% in the same period. Here, I believe that before interpreting these results, it is
necessary to explore the linkages between movers’ education profile and movers’
employment sector.
As indicated in Figure 4.11, it is not surprising to see that LQ value of college or
university graduated and works in FIRE movers was 1.4 in 1990 and 2.0 in 2000;
meaning that they are far more mobile than the other groups. Moreover, this table
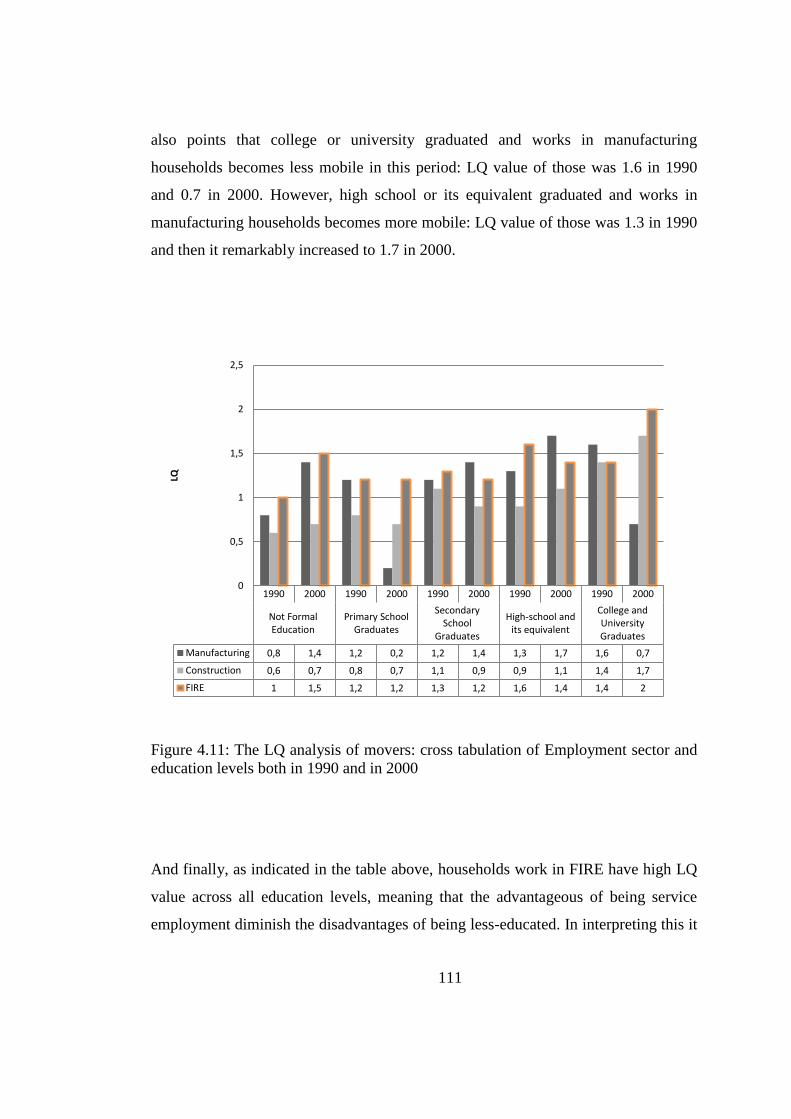
111
also points that college or university graduated and works in manufacturing
households becomes less mobile in this period: LQ value of those was 1.6 in 1990
and 0.7 in 2000. However, high school or its equivalent graduated and works in
manufacturing households becomes more mobile: LQ value of those was 1.3 in 1990
and then it remarkably increased to 1.7 in 2000.
Figure 4.11: The LQ analysis of movers: cross tabulation of Employment sector and
education levels both in 1990 and in 2000
And finally, as indicated in the table above, households work in FIRE have high LQ
value across all education levels, meaning that the advantageous of being service
employment diminish the disadvantages of being less-educated. In interpreting this it
1990 2000 1990 2000 1990 2000 1990 2000 1990 2000
Not FormalEducation
Primary SchoolGraduates
SecondarySchool
Graduates
High-school andits equivalent
College andUniversityGraduates
Manufacturing 0,8 1,4 1,2 0,2 1,2 1,4 1,3 1,7 1,6 0,7
Construction 0,6 0,7 0,8 0,7 1,1 0,9 0,9 1,1 1,4 1,7
FIRE 1 1,5 1,2 1,2 1,3 1,2 1,6 1,4 1,4 2
0
0,5
1
1,5
2
2,5
LQ
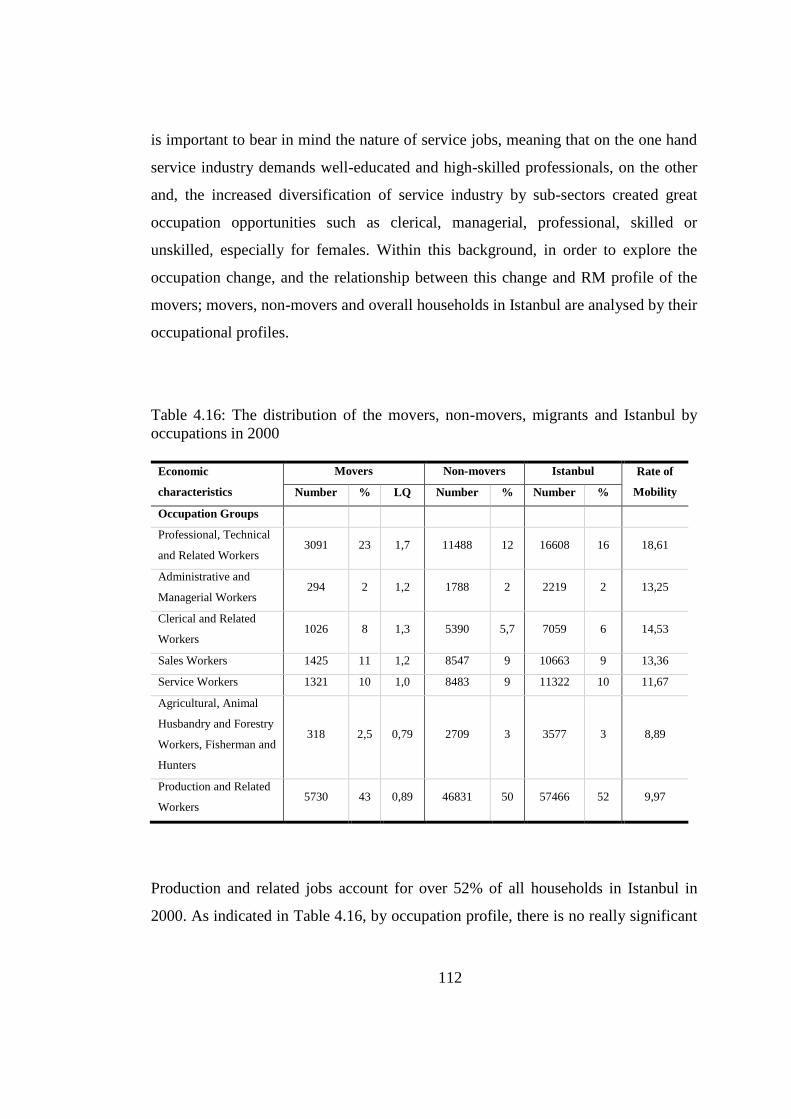
112
is important to bear in mind the nature of service jobs, meaning that on the one hand
service industry demands well-educated and high-skilled professionals, on the other
and, the increased diversification of service industry by sub-sectors created great
occupation opportunities such as clerical, managerial, professional, skilled or
unskilled, especially for females. Within this background, in order to explore the
occupation change, and the relationship between this change and RM profile of the
movers; movers, non-movers and overall households in Istanbul are analysed by their
occupational profiles.
Table 4.16: The distribution of the movers, non-movers, migrants and Istanbul by
occupations in 2000
Economic
characteristics
Movers Non-movers Istanbul Rate of
Mobility Number % LQ Number % Number %
Occupation Groups
Professional, Technical
and Related Workers 3091 23 1,7 11488 12 16608 16 18,61
Administrative and
Managerial Workers 294 2 1,2 1788 2 2219 2 13,25
Clerical and Related
Workers 1026 8 1,3 5390 5,7 7059 6 14,53
Sales Workers 1425 11 1,2 8547 9 10663 9 13,36
Service Workers 1321 10 1,0 8483 9 11322 10 11,67
Agricultural, Animal
Husbandry and Forestry
Workers, Fisherman and
Hunters
318 2,5 0,79 2709 3 3577 3 8,89
Production and Related
Workers 5730 43 0,89 46831 50 57466 52 9,97
Production and related jobs account for over 52% of all households in Istanbul in
2000. As indicated in Table 4.16, by occupation profile, there is no really significant

113
difference between the movers and general profile of households in 2000. It is in the
category of professionals that difference of the movers becomes more apparent; in
2000, accounted for 16 % of all households in Istanbul, but was the largest group in
the movers at 23%. As can be seen in Table 4.16, this means that households work in
professional occupations including corporate managers, general managers, physical
mathematical and engineering science professionals, teaching professionals and etc.,
are far mobile than other groups; in 2000, LQ value of those was 1.7 and their RM
rate was approximately 19% (see Table 4.16).
Next comes households work in clerical occupations including secretaries, keyboard-
operators library, mail and other workers and etc., LQ value of those was 1.3 and RM
rates’ was almost 15%. If RM is seen as a mechanism that reproduces the socio-
economic profiles of the society, these findings also are represented as an indicator
of the initial phrases of the three most important trends in the socio-economic profile
of the city in the last three decades: 1. the decay both in skilled and unskilled jobs in
non-service industries, 2. the growth in the share of all employment has been in
professional and managerial service jobs; and 3. the growth in the share of people are
employed in clerical, sales, personal and protective service jobs. If RM is assumed as
a function of households’ ability to move, these findings can be reded as an indicator
the increase of well-beings in the whole society.
The findings, in Table 4.17, fortify this interpretation: LQ value of college or
university graduated professional workers movers was 1.7 in 2000 and LQ value of
college or university graduated agricultural workers was 2.6 in the same period. This
means that education level has an increase effect on the mobility of households;
besides, this effect becomes multiplier in low-waged workers. In addition to these,
Table 4.15 also reveals that occupational status is more closely tied to an educational
achievement (in 2000, LQ value of college or university graduated movers was 1.7;
while LQ value of no formal educated clerical movers was only 0.4). Within this

114
background, I think this point is important enough to repeat: this already existing
picture is outcomes not only of demographic and socio-economic restructuring, but
also, of the variation/differentiation in housing market.
Table 4.17 The LQ analysis of movers: cross tabulation of employment sector and
education in 2000
Education Level
LQ
Not
formal
educatio
n
Primary
school
graduates
Secondary
school
graduates
High school
and its
equivalent
graduates
College
or
universit
y
graduate
s
Occ
up
ati
on
Pro
file
Professional, Technical
and Related Workers 0,5 1,1 1,3 1,4 1,7
Administrative and
Managerial Workers 0,8 0,8 1,2 1,4 1,5
Clerical and Related
Workers 0,4 0,9 1,0 1,3 1,7
Sales Workers 0,6 0,9 1,3 1,5 1,6
Service Workers 0,9 0,9 1,0 1,2 1,5
Production and Related
Workers 0,6 0,9 1,1 1,2 1,1
4.3 Conclusion
The analyses in this chapter identify the particular groups in which they experienced
“constant rates” of mobility as well as an increase in mobility rate: those who are
young, small households, couples, high-educated, employer, high paid professional
work in service sector mobile than households who are elderly, large households,
single parents, low-educated, housewife-rentier or retired, low-paid workers. This

115
finding is interpreted as an indicator of profiling two distinct status groups of the
society. Regarding socio-economic and demographic profile of households, the first
status group represents well-beings or wealthy, while the second status groups
represents the poor. Consequently, it can be said that while wealthy is more mobile
than poor, they become more mobile in the period 1990-2000. In other words, from
1990 to 2000, while wealthy becomes more mobile; as opposed to these groups, poor
becomes less mobile or more stable. Furthermore, it is clear from the findings of
first-level analysis; “education attainment level” is interpreted as a key indicator or
factor variable to examine the diversification of RM processes of households in
Istanbul both in 1990 and in 2000.
Taking the risk of repeating myself, I would like to remind that there are differences
on RM profile of movers in terms of their socio-economic and demographic
characteristics, such as younger are more mobile than older, couples are more mobile
than single parents, etc. Keep in mind these findings; I think it is right to assume that
these differences reflect themselves on the interrelationship with urban geography. In
other words, I assume that movers’ effects on urban geography of the city are varied
regarding socio-economic and demographic characteristics of households. In the
same scope, it is now to draw out more detail the way in which RM interacts with
urban geography. So, as a second literature review, I focus on the interrelationship
between RM and urban geography in the fourth chapter of the thesis.

116
Figure 4.12: The findings of analysis (Who are movers)
117
CHAPTER 5
RESIDENTIAL MOBILITY
AS A RESTRUCTURING PROCESS OF URBAN
GEOGRAPHY
5.1 Introduction
Both migration and RM were embedded in the functioning of contemporary societies
and are fundamental elements in the development of new urban fabric (Dieleman,
2001). Clark and Huang (2004) correctly stated that
…mobility and migration were among the processes that distribute and
redistribute population across the metropolitan structure of urban society, and
within the communities and neighbourhoods of metropolitan areas (Clark and
Huang, 2004:326).
Studying RM is one of the popular topics among social scientists after mid-1930s.
Quigley and Weinberg (1977) perfectly define the reasons that make RM study an
inexhaustible source of research topics in this period. They claim that “the results or
effects of RM decision are critical to understanding the changes in the spatial
character of regions and of urban areas” (Quigley and Weinberg, 1977). In a same
scope, Cadwallader (1982) claimed that analysing the underlying processes related
with residential moves’ patterns is the crucial elements of understanding the
changing socio-economic and demographic and spatial structure of the city
(Cadwallader, 1982). In taking this forward, at first Knox and Pinch (2000) and

118
Feijten and van Ham (2009) then indicate that studying RM is significant since it
contributes to an understanding of the formation of urban space32
, which is comprises
many individual movements. The complexity of the process is illustrated in Figure
5.1.
Figure 5.1: The system formed by mobility flows and the structuration of space
Source: Knox and McCarty, 2005
32
In this thesis, “urban space” refers to the space conceptualization of Lefebvre. Lefebvre (1974,
1991) in his most-cited book, titled “The Production of Space”, re-conceptualises the socio-spatial
perspective through a Marxian and critical approach, and introduces the idea of “social production of
urban space”. He introduces three concepts: to reveal how capital, state and society conceive, live and
perceive urban space in a capitalist society through the trial schema: representations of space, spaces
of representation and spatial practice; representations of space illustrates the organization of urban
space, which is created by power, spaces of representation is the lived space where social relations are
experienced depending on particular symbols and signs, and dialectical relation between spaces of
representation and representations of space gives rise to spatial practice (Lefebvre, 1991).
Demographic

119
As mentioned in Chapter 3, the early studies of RM are mostly modelled in
compatible with demand-oriented approaches (mostly based on age, family size,
marriage, and some socio-economic characteristics of households such as education
and occupation of households (Rossi, 1955; Brown and Moore, 1970; Clark et al,
2006). The demand-oriented approach of RM is challenged by a number of
researchers who comment that the context in which mobility occurs deserves more
attention than residential preferences in motivating RM (Huang and Clark, 2002; Li
and Sui, 2001).
Here, I believe it is important enough to repeat that one of the aims of this thesis is to
highlight the interrelation between RM process and urban space in the case of
Istanbul. In other words, the effects of RM process of households on urban
geography of the city are one of the main concerns. Within this background, at first I
briefly examine RM studies from ecological perspective which is useful to interpret
RM patterns in the city by categorising them in terms of socio-economic and
demographic, as well as distance and direction profiles. Then I focus on the
substantial relationship between RM and neighbourhood context and segregation
phenomena.
5.2 Macro Approaches to Residential Mobility
Cadwallader (1982, 1992) said that as opposed to the micro approach to RM (see
Chapter 3) the macro approach is rooted in the ecological studies. 33
Short (1978
cited in Cadwallader, 1992) claimed that the macro approach focussed upon the
spatial distribution of RM rates associated with urban sub-areas, and the relationship
between these mobility rates and other socio-economic and demographic
characteristics. For example, the findings of a detailed study of the distribution of
33
For example, the urban growth models of Burgess (1924) and Hoyt (1937) contain statements
regarding RM (Cadwallader, 1982; Maloutas, 2004; Erginli and Baycan, 2011).

120
mobility rates in Brisbane which is made by Moore (1971) show that RM is a direct
function of population density. In compatible with this argument, it follows that
mobility rates should decline with increasing distance from the city centre, as is the
case with population density (McDonald and Bowman, 1976 cited in Cadwallader,
1982).
While urbanization is the creation of built-environment, it also plays an
indispensable role in producing spaces that would be compatible with existing social
relations. But, how can one figure out the characteristics of patterns of this process?
RM can be seen a most important mechanism that produces and reproduces urban
geography. Macro approaches to RM basically aim to examine mobility flows
between origin and destination points by categorizing moving patterns regarding RM
rate at the aggregate level. In a sense, macro approaches to RM aims to highlight the
divergence RM patterns of households in the broader context (Boyle, 1993). These
divergence mobility patterns could point out that there is something else affecting or
influencing mobility, namely “neighbourhood effect” It would thus provide a good
basis for future studies on what this ‘something else’ might be.
On the other hand, Quigley and Weinberg (1977) stated that macro-level approach to
RM cannot be seen as an explanatory framework for analysing mobility, to some
extent it provides additional evidence based on “contextual effects”, bearing on the
household decision process mind. In compatible with this view-point, I think it is
right to say that while the micro approaches try to find the determinants of
households’ decision to move, on the other hand, the macro approaches aim to
conceptualize RM in broader contexts such as urbanization and etc. I believe it is
important enough to repeat that these two approaches are partially successful; a
synthesis of these two approaches can be more successful to understand RM process.

121
5.3 Relating Residential Mobility to the Urban Structure
“The macroform of metropolitan areas changed from a mono-centric structure to
poly-centric structure characterized by surrounding areas containing new urban
socio-spatial settings” (Knox and McCarthy, 2005). In accordance with this
interpretation, urbanism is theorized as the complex pattern of “residential
neighbourhoods”, developed regarding overlapping cleavages of socio-economic
profile, household type, ethnicity, and life-style of the inhabitants (Knox and
McCarthy, 2005). In this respect, in order to understand the two-way relationship
between RM and urban geography, the relationship between RM and neighbourhood
change is clarified in the next section of this chapter.
5.3.1 Residential Mobility and Neighborhood Change
As Knox and McCarthy (2005) stated that each neighbourhood is a product of a
frequent flux of change: “investment and disinvestment, physical deterioration of
housing stock and housing obsolescence, social and demographic changes in place,
household mobility (incomers and outgoers) that totally change a neighbourhood”
(see Figure 5.2).34
Before examining RM with a specific emphasis on the role of
neighbourhood change, I want to clarify the basic dimensions of neighbourhood
change which enable this transformation to occur.
The most obvious aspect of neighbourhood change is the physical deterioration of
the housing stock (Knox and McCarthy, 2005). As Knox and McCarthy (2005)
claimed that most of the housing areas are settled for particular and relatively similar
34
The different components of neighbourhood change can be clarified as: the aging of the physical
environment, the aging of residents and the movement of households into and out of the
neighbourhood. Ley (2001 cited in Knox and McCarty, 2005) claimed that each of these components
of neighbourhood change exhibits a different periodicity and that overall effect can be conceptualized
in terms of neighbourhood life-cycles.

122
groups. As a consequence, of the filtering process, the compositions of occupants
change regarding socio-economic, demographic, ethnic, or life-style (Knox and
McCarthy, 2005).35
After this brief clarification, I would like to examine the
interrelationship between RM and neighbourhood change in detail.
Figure 5.2: The principal components of neighbourhood change Knox and McCarthy
(2005)
35
Basically, the differences among neighbourhoods in terms of the rate and the nature of the changes
affect the landscape of investment opportunities. For example, neighbourhood with socially and
demographically stable and physically quite sound may nevertheless be considered ripe for
redevelopment or reinvestment; because the differences between current rates of return on property in
the area and the rates of anticipated from investment in a change in neighbourhood character (Knox
and McCarthy, 2005).

123
Residential mobility is a central facet of urban social geography, for it
provides a spatial expression of the link between the individual household
and the social structure, between the households’ life-world and its
biographical situation, between internal culture-building processes and the
spatial template of the city…The residential choices of individual households
in aggregate define the social areas of the city. But there is a two-way
relationship between individual and aggregate levels, for at the same time the
individual’s pattern of choices is constrained by the pre-existing set of spatial
opportunities in the city and the households’ own biography-such as those
characteristics of income, stage in the life-cycle, ethnic status and life-style
which will close off certain housing opportunities to it and substantially
reduce its range of choice (Ley, 1983:298)
I think the citation from David Ley provides an appropriate description of the overall
relationship between RM and urban residential structure. In the figure below, the
effects of RM and urban residential structure on each other are emphasized. In this
respect, the complex residential structure of metropolitan areas is seen as a product
of RM, which in turn is a product of housing opportunities as well as households’
needs.
In the light of RM studies, it is clear that each city is divided not just into
neighbourhoods of different socio-economic and demographic composition but also
different rates of RM and different rates of socio-economic change (Knox and
McCarthy, 2005). Moore (1972 cited in Knox and McCarthy, 2005) captured these
significant dimensions of urbanization in a four-fold typology for American cities
(see, Table 5.1).

124
Figure 5.3 Relationship between RM, neighbourhood composition and housing stock
(Knox and McCarthy, 2005).
In simplistic words, Type I situations are characterized by high RM and rapid
change, and include the classic invasion-succession sequence (Moore, 1972 cited in
Knox and McCarthy, 2005). Type II situations are represented the newer suburbs for
newly established middle-income household or neighbourhoods. Type III situations
are characterized by neighbourhoods that experience a gradual demographic change
in place.

125
Table 5.1: A typology of neighbourhood change (Moore, 1972 Knox and McCarthy,
2005)
Neighbourhoods with significant socio-
demographic change
Neighbourhoods with little socio-
economic change
Nei
gh
bo
urh
oo
ds
wit
h
hig
h m
ob
ilit
y r
ate
I
a. Rapid change: owing to the
result of ethnic or racial
conflict in residential enclave.
b. Change: Because of the
specific social groups,
residential area gains high-
social status.
c. Change: because of the rapid
deterioration of physical built
environment
d.
II
a. Because of the inflexibility in
housing, the area is not catered
to large range of household
typology
b. In-migrants’ terminal point.
Nei
gh
bo
urh
oo
ds
wit
h
low
-mo
bil
ity
ra
te
III
a. Change: Many households tend
to live in this type of residential
are because of their flexible
housing composition
b. Deterioration: in-migration
causes social and physical
deterioration in the area.
c.
IV
a. Networks of ethnic minorities
mostly structured the socio-
economic and physical
composition of the residential
neighbourhood..
The typology above indirectly indicates that RM is a selective process, with some
neighbourhoods are dominated by households with little propensity to move and vice
versa. Until here, RM literature is explored regarding its role and position on
neighbourhood change, in the next section of this chapter; the effects of
neighbourhood on RM process are examined in detail.
5.3.2 Neighbourhoods Effects and Residential Mobility
In their well-known article, Quigley and Weinberg (1977) stated that RM was the
main cause of the changes in structures and characteristics of neighbourhoods where

126
people live. “Little work has been done on the specific neighbourhood factors
affecting mobility behaviour” (Quigley and Weinberg, 1977) In other words, in the
literature, it is hard to find studies which examine how the neighbourhood affects
moves (Ioannides, 2002).
Nevertheless, the studies of RM do not disregard the importance of the
characteristics of locality. There is a growing body of evidence that the
characteristics of neighbourhood are also part of the explanation of RM (Clark et al,
2006; Feijten and Ham, 2009). In the same manner, Mustard et al., (2003) and
Sampson et al., (2002) discuss in what ways a neighbourhood affects inhabitants’
mobility decision through considering how social processes in the neighbourhood
affects decision making such as local role models, relative status of groups and etc.
Some recent studies basically focus on the relationship between local context,
migrants’ decision-making, and levels of out-mobility; such as Ham and Clark
(2009).
Amérigo (2002 cited in Adriaans, 2007) claimed that the growing RM literature
distinguished two sets of neighbourhood characteristics which have potential
influences on the mobility of inhabitants. These two characteristics are embedded in
attractiveness concept. The first one was the physical structure of the neighbourhood.
In a same manner, Brown and Moore (1970) claimed that attractiveness is that makes
a household choose one dwelling over another. This is a search for a new location
which is considered as more attractive than the previous residential areas. This
process is profound to the dwelling’s feature, such as size and neighbourhood
characteristics, location and socio-economic profile of inhabitants. Nevertheless, this
choice was limited to a few alternatives which were evaluated based on the
households’ subjective interpretations of at attractiveness (Brown and Moore, 1970).
127
In a same manner, Jones (1990) says that during the examination of the mobility
flows between origin and destination points, the crucial conception is attractiveness.
According to “neighbourhood effect” theory, distance is an important factor affecting
attractiveness (Jones, 1990). There is a variety of ways to measure distance, for
example, social distance and geographical distance. While geographical distance was
still important; social distance affects households’ propensities to move into an area
with different social environment; that’s why most moves were engaged between
areas of similar socio-economic and environmental characteristics (Jones, 1990). It is
obvious that geographical distance is closely related to local social network: for
movers, short distance moves enable to maintain their social network. Jones (1990)
assumed that local social network and knowledge were the components of
attractiveness, and for mover having closed social network and/or social capital
increased the possibility to move among short distance. Within this backdrop, it can
be assumed that if socio-economic, demographic, ethnic or built environment
compositions of neighbourhood affect RM; spatial preferences of mobility patterns
should show these effects.
Based on the well-known studies on the interrelationship between RM and the
attractiveness of locality (in a sense neighbourhood effect), it is right to say that the
out-mobility rate in distressed or disadvantageous or unattractive residential areas is
significantly high. For example, Bailey and Livingston (2007) conducted a research
for the UK, and they found that neighbourhoods with a large percentage of rented
dwellings and many young singles could be show the highest population mobility
(Ham and Clark, 2009). In a same manner, put the relationship between local
housing composition and mobility in mind, it can be expected that RM is likely to be
highest in housing markets with many opportunities for households to find a
dwelling that matches their housing needs.
128
And the second characteristic which potentially influences RM is the socioeconomic
and ethnic characteristics of the inhabitants of neighbourhoods. Ham and Clark
(1999) claimed that when given the opportunity, people exhibit a tendency to move
away from neighbourhoods with low socio-economic status. There is a large
literature that show a range of contextual effects of poor or low socio-economic
status neighbourhoods on social position and social opportunities, for instance social
exclusion (Buck, 2001); and social mobility (Mustered et al, 2003). In a similar vein,
Harris (1999), in his well-documented literature review, shows that households with
children attempt to avoid neighbourhoods with low socio-economic status and
inhabitants who diverge from normal norms and values (such as unemployment and
low-levels of education).
Bailey and Livingston (2007) pointed out the large number of assumptions about the
relationship between neighbourhood socio-economic status and RM in
neighbourhoods (Bailey and Livingston, 2007). Nevertheless, the literature explained
the neighbourhood-level mobility refer to not only the socio-economic characteristics
of neighbourhoods but also the mix of the neighbourhood population and
characteristics of the housing stock, was limited (Bailey and Livingston, 2007; Hui,
2005; Ham and Clark, 2009).
In their well-organized study, Ham and Clark (2009) assumed that those who leave a
neighbourhood have a potentially large effect on neighbourhood change when they
are replaced by others with different characteristics. As mentioned in the previous
paragraphs, the socio-economic and demographic characteristics of neighbourhood
play a significant role in clarifying mobility at disaggregate or individual level (Clark
et al, 2006; Ham and Feijten, 2008; Feijten and Ham, 2009). The results of the study
of Bruch and Mare (2010) illustrated the ways in which individual-level mobility
preferences for different kinds of neighbourhoods that modified residential patterns
at the aggregate level. Harris (1999) initiated the linkage between the socioeconomic

129
status of neighbourhood and RM, at first Clark (1992) and then Crowder (2000)
mentioned the linkage between RM and the ethnic mix of the neighbourhood
population. In this manner, Bruch and Mare (2010) stated that for the potential
movers, the relative attractiveness of neighbourhoods was altered sequentially by the
changes in neighbourhoods. In this respect, both, Feijten and Ham (2009) and Lee et
al (1994) initiated that RM studies should focus on the effect of changes in the
neighbourhood as determinants of mobility behaviour.
5.3.3 Residential Mobility and Ethnicity and Race
The debate on the role of the neighbourhood socioeconomic status in understanding
selective RM is closely related to the debate on the role of the ethnic composition of
the neighbourhood population (Clark, 2007). Two main explanatory mechanisms
have been suggested through which the ethnic composition of neighbourhoods
influences mobility. The first one is proposed by Schelling (1969) - different ethnic
groups live in different neighbourhoods because of their different preferences for
own-race and other-race combinations. In simplistic words, individuals of one race or
ethnicity cumulatively settle in highly segregated neighbourhoods.
And the second explanatory mechanism is based on the `racial proxy hypothesis'
(Ham and Clark, 2009). In the line with this hypothesis, in neighbourhoods with a
high percentage of ethnic minority residents, a whole range of social problems are
concentrated and that people want to escape neighbourhoods with higher
concentrations of ethnic minority residents (Clark, 1992; Harris, 1999; Taub et al,
1984 cited in Quillian and Bruch, 2010). In a similar scope, it is appropriate to claim
that an increase in members of ethnic minorities in a neighbourhood can function as
a proxy for an increase in a range of problems in the neighbourhood.

130
Within this background, Alba and Logan (1993) developed an alternative theoretical
perspective on the selectivity of relocation process: the place stratification model in
order to understand the relationship between race and RM:
The place stratification model directs attention to the hierarchical ranking of
places and social groups and the means by which advantaged social groups
distance themselves-socially as well as spatially-from disadvantaged groups,
including many racial and ethnic groups, especially African Americans (Alba
and Logan, 1991:1391)
However, it is necessary to mention that the place stratification model does not deny
that life-cycle and socioeconomic factors shape black RM patterns, but adds that
these explanations by emphasizing the structural constraints that facilitate the
mobility of blacks between different types of communities within urban areas (Alba
and Logan, 1991).
5.3.4 Residential Mobility and Residential Segregation
Galster and Killen (1995) say that neighbourhoods’ social and physical settings
affect the decision making behaviour of households. Recalling Chapter 3,
households’ mobility decisions are case-specific. Households’ life-styles,
preferences, objectives as well as the idiosyncratic conceptualization of achievable
effects form the mobility patterns of households. In simplistic words, social
processes which affect the all components above, are continuously formed within the
neighbourhood, and have a reciprocal effect in households’ mobility. Put this
reciprocal relationship in mind, it is right to say that at the aggregate level the
households’ mobility has an effect in the socio-economic as well as spatial
characteristics of neighbourhoods both in a way of change and stabilize them. Within
this backdrop, analysing RM patterns of households provides an opportunity to

131
examine the segregation. However, there are very few studies on how
neighbourhoods affect RM and the interrelation between RM and segregation (for
example Ham and Feijten, 2008). Waldorf (1990, 1993) claimed that the connection
between residential segregation and RM is important; because RM is a principal
force contributing to the change of residential segregation over time and vice versa.
Maloutas (2004) claimed that the relationship between RM and segregation are
evolved in the mutual relationship between mobility and the modern city. He
supported his assumption throughout Burgess Model. As known, mobility (both
social and residential mobility) is the basic principle of Burgess Model; and at the
aggregate level social and RM are combined by the assumption that the “socially
mobile will inevitably be residentially mobile” (Maloutas, 2004). From this point of
view, it is accepted that segregation is generated by the shifting and sorting of
population by RM (Maloutas, 2004). In a sense, Knox and Pinch (2000) argue that
the change in local social environment is produced by RM, and they claim that
Although it is widely accepted that the shaping and reshaping of urban social
areas is a product of the movement of households from one residence to
another, the relationships between residential structure and patterns of RM
are only imperfectly understood (Knox and Pinch, 2000: 522).
5.5 Conclusion
Literature points out that RM is one of the most important dynamic forces structuring
and changing urban space in a given city. As RM can either provide explanations
about the dynamics hindered in the mutualistic relationships between relocation and
households’ life cycle events, or arise the ways to recognise different social status
groups and urban forms across and within cities; RM can provide a kind of links to
wider themes of urban restructuring.

132
In the same manner, neighbourhood effect as well as neighbourhood change can be
examined by analysing RM patterns both in individual and in aggregate levels. It is
clear from the literature that residential segregation, in this context, is seen as an
outcome of RM in the aggregate level. In this respect, macro or ecological
approaches to RM give another point of view to researchers to interpret flows of RM
and understand divergent patterns of RM. Consequently, in the following chapter of
this thesis, I analyse RM patterns of households considering their roles during
neighbourhood change and the effects of neighbourhoods on RM.

133
CHAPTER 6
RESIDENTIAL MOBILITY AND URBAN GEOGRAPHY OF
ISTANBUL: DOES RM MATTER?
“Insanların kaderleri besbelli evlere bağlı:
Zengin evler fakirlere çok yüksekten baktılar,
Kendi seviyesine evler kız verdi, kız aldı
Bazıları özlediler daha yüksek hayatı,
Çırpındılar daha üste çıkmaya,
Evler bırakmadılar.
…”
(Behçet Necatigil, 1947, “Evler”, Varlık, pp. 329)
RM is a central phase of urban geography for it provides a spatial expression of the
link between the households and the social structure, between housing processes and
the spatial setting of the city (Ley, 1983; Knox and McCarthy, 2005). In a same
manner, RM is a highly structured process with impacts on both those who move and
on the places they choose in their mobility process (Cadwallader, 1992). In this
sense, RM process in any given city is understood by profiling movers as well as by
exploring their interlinked mobility flows.
This last point of view constitutes the core arguments of this chapter. The pattern and
rate of which people change their homes is obviously a process deeply rooted in the
spatial organization of urban areas, but spatial factors cannot wholly explain the
134
characteristics of RM. Although such conditions as proximity or distance or direction
or physical structure or socio-economic/demographic profile of local are significant
parameters in any equation of movements, they can only be made expressive when
RM is conceptualized in the context of social, political and economic and spatial
settings of neighbourhood or city or urban area or state.
In Istanbul, raw “RM rate”36
was 10.8 % in 1990 and was 11.5 % in 2000.37
This
means that the raw mobility rate of Istanbul rose with a small percentage increase
(6.5%) between 1990 and 2000. As indicated in Chapter 5, there are plenty of
reasons for this shift such as increase in population, decrease in household size, and
increase in education attainment levels of the society and the differentiation in
housing stock regarding size, type and location, of housing units. As known, I am not
interested in the motivations behind such RM, notwithstanding I am particularly
interested in to answer the questions (1) “Who does move”, and (2) “Where do they
move and “Does it matter?” In this respect, this chapter focuses on answering the
second main question of the study.
Referring chapter 1, in this study, as well as identifying the spatial patterns of RM
flows, establishing the interrelationship between RM and other features of the urban
setting such as socio-economic and demographic characteristics, is also of interest.
As known, this thesis focuses on RM at the aggregate level. Nevertheless, it is also
interested in the differentiation of RM regarding households’ socio-economic
characteristics such as age, education and family typology, at the disaggregate level.
Because of the fact that “education” is seen as a factor variable that represents the
36
Formula of RM rate is as follows:
Raw
37 In spite of the fact that Istanbul cannot be compared with other cities with respect to RM rate
because of the lack of available data. However, I would like to inform you about mobility rate profile
of such selected cities: Tokyo was 9.3% in 2004 (Seko and Sumita, 2007); Hong Kong was 36% in
2001 (Hui and Yu, 2009).

135
low-status and high-status households’ RM preferences (as discusses in Chapter 4,
Section 4.2.3.1). In this respect, the spatial patterns of RM of low-educated and high-
educated households are also agenda of the second-phase analysis of this study, to
highlight idiosyncratic interaction among mobility, urban setting and those groups.
Within this background, the second level analysis mainly aims to explore the
reciprocal interactions between RM and changes on urban setting in the case of
Istanbul through answering these questions: Are there specific spatial mobility
patterns of households in the city? If so, what are the basic characteristics of RM
patterns and how are they differentiated in terms of social status? Are these mobility
patterns differentiated between 1990 and 2000? Does RM change the composition of
districts’ population? If so, do high-status or low-status group have the same impact
on these changes? The next section describes methods of the analysis.
6.1.1 Graph Analysis: Flow Priority Graph and From/To Matrix
A graph is a kind of representation that consists of a set of points (an area under
consideration such as places, districts or regions) and a set of lines represent the links
between a pair of points. However, in RM and migration studies, 'digraphs' (directed
graphs) are used which reflect in the real world structural patterns of relations of a
system under consideration (Kipnis, 1985).
In order to illustrate the direction and concentration of RM moves, three graph
methods are mostly preferred to use: “the dominant flows, the significant flows and
the flow priority index” (Kipnis, 1985). Kipnis (1985) stated that “all three methods
are complementary and each discloses similar basic flow patterns along a few
distinctive features of the flow elements” (Kipnis, 1985). However, Flow Priority
Graph is chosen to examine residential moves in this thesis, partly because of the
characteristics of data and partly because it is the most appropriate approach to

136
answer the questions above.
6.1.1.1 Flow Priority Graph
Flow priority exhibits RM preferences among regions of a matrix (Kipnis,
1985). The graphs are defined on the basis of a “0 flow Priority Index (PR) in which
where is the total observed number of people who moved from region i to
region j, and
(
) (
)
where ‘mt’ is the total number of people who are residentially mobile in the whole
urban area. Pi and Pj are the total population of area i and j respectively, and Pt is the
total population of the urban area” (Kipnis, 1985)
6.1.1.1.1 In-comers Index and Out-goers Index
In order to find how flow priorities and the overall mobility are balanced in each
region, Kipnis (1985) developed two related indices: In-Migration Index and Out-
Migration Index. In this thesis, the level of mobility for districts is analysed using
(6.1)
(6.2)

137
these indices. The formula of the In-migration Index (hereafter termed as “In-comers
Index”):
(
) (
)⁄
in which is the number of people entering region i. The out-migration index
(hereafter termed as “Out-goers Index”) is similarly calculated as:
(
) (
)⁄
where is the number of people leaving region i (Kipnis, 1985).
6.1.1.2. From/To or Flow Matrix
The mutual data base for almost all graph analyses is a flow or FROM/TO matrix
( ). The matrix consists of rows and columns with same labels in a corresponding
sequence and it shows the relationship between a set of variables or indicators. And
the entries can be representing the distance or number of person or number of trips,
and etc. In the case of Istanbul: i rows and j columns of the Istanbul with i=j=29,
refer the origin and destination districts of the matrix, respectively (See Figure 6.1).
While the captions of horizontal and vertical sequences of are not changed, the
scope of entries can be formulated in the specific manners; such as, for high-
educated or low-educated movers, etc. As previously mentioned, every type of
(6.3)
(6.4)

138
FROM/TO matrix reports about the mobility patterns of households of Istanbul; for
instance - FIRE simplifies the mobility patterns of movers work in FIRE.
Briefly, this matrix is a crucial part of the macro-level analysis while choosing case
study groups.
Ori
gin
Poin
ts Destination Points
Figure 6.1: The FROM/TO Matrix
6.1.2 The Socio-economic Development Index
How do residential moves influence the socio-economic settings of Istanbul? In order
to answer this broad question, the Development Index is developed. Mainly, the
Socio-economic Development Index is a composite statistic that ranks the areas by
their development degree. In other words, the Development Index is designed to
compare the development status of areas at a given point in time.
Socio-economic Development Index is an area level index, and is assigned to areas,
not to individuals. It indicates the collective selected socio-economic and
demographic status of the people living in an area. It may be assumed that relatively
under-developed areas are likely to have a high proportion of people with illiterate,
large household size and low labour force participation rate. However, such an area
is also likely to contain people who do not reflect such characteristics, as well as
people who are relatively high of socio-economic and demographic profile.
Frequency of
movers

139
When area level indices, like Socio-economic Development index, are used as proxy
measures of individual level socio-economic status, many people are likely to be
misclassified. This is known as the ecological fallacy (see Piantadosi, et al., 1988;
Nabi and Oliver, 2009). Because the boundaries of the relevant areas may have
changed, the distribution of the minimum and maximum index values will have
changed; it is not recommended using the development index to compare
development status of areas from different census years. In this thesis, as can be seen
in Table 6.5, the Development Index is accepted and used as a comparative measure
of education, employment, and demography for the scale of districts:
Table 6.5 Input variables for the Development Index
A- EDUCATION
A1- Rate of literacy The higher the level of the indicator, the
more developed the district
A2- Percentage of university
graduates
The higher the level of the indicator, the
more developed the district
A3- Difference between
male and female literacy
The lower the level of the indicator, the
more developed the district
B- EMPLOYMENT
B1- FIRE sector employment The higher the level of the indicator, the
more developed the district
B2-Labour force
participation rate
The higher the level of the indicator, the
more developed the district
B3- Difference between male
and female labour force
participation rates
The lower the level of the indicator, the
more developed the district
C- DEMOGRAPHY
C1- Household size The lower the level of the indicator, the
more developed the district
C2- Child Women Ratio The lower the level of the indicator, the
more developed the district
Education: Education is commonly recognised as a leading tool for promoting
economic growth. It can also change the demography of the community through

140
contributing to reduce fertility rate and population growth. In short, having a
university diploma gives a person an advantage over someone with no qualifications
while the high rates of literacy and the rate of university graduates variables are
positively correlated, on the contrary, for difference between male and female
literacy variable is negatively correlated with development level of selected district.
Işık and Ataç (2011) examined the relationship between households’ education level
and their social status: it is clear that households with higher education have a great
propensity to be members of high-status groups in the society, vice versa.
Employment: Another employment indicator used in the development index is the
difference between female and male labour force participation rates. In simplistic
word, the lower rate of this variable indicates the high-level of development.
Demography: Işık and Pınarcıoğlu (2006, 2010) show the reciprocal relationship
between demography and socio-economic development level of households. The
household size and child women ratio variables are selected. As known, the Child
Women Ratio and average household size has significantly decreased since the
middle-1980s. While there is a close relationship between the income level and status
of groups, the area with low Child Women Ratio and the average household size
shows high-development profile. In the table above, the input variables of the
Development Index are indicated. The formula:
⁄
, is the value of selected variable in selected district
, are the highest and lowest values the variable x, respectively.
(6.6)

141
Here, the point that has to be considered is that this normalization process is applied
to "The higher the better” variables. "The lower the better” variables are normalized
as Min=1 and Max=0. And, finally, as can be seen from the formula below, all these
values are summed and are divided to the total number of variables (It means that
this method is run without weight variables). And the total score is the Socio-
economic Development Index of selected district.
Selected district
As measures of development level, the index is ordinal. It can be used to rank areas,
yet cannot be used to measure the size of the difference in development level
between areas. For example: it cannot be interpreted that an area with an Index of
Development value of for example 0.3 is twice as less-developed as an area with an
index value of 0.6; and the difference in development between two areas with values
of 0.7 and 0.8 is not necessarily the same as the difference between two areas with
values of 0.8 and 0.9. Briefly, it is only used to distinguish whether the area is a high-
development or a less-development.
6.2 Findings: The Effects of RM on Urban Setting
The findings of second-phase analysis of the study are classified under three
categories: (1) RM and urban form, (2) RM and built environment, (3) RM and
social environment.
(6.7)
142
6.2.1 RM and Urban Form
Most models on RM focus on the direction and distance preferences of mobility
flows. Distance can be calculated in different ways, for instance, driving distance,
geodetic distance or bird’s eye distance. While, the most appropriate one is driving
distance, because of the geographic characteristics and variation in the transport
lines, in this thesis, I use “distance” as a straight-line between the centre points of
districts (See Appendix B).
RM researches show that the vast majority of residential moves are short distances
Clark and Dieleman, 2006). In the case of Istanbul, the average distance of
residential moves is 13.7 km, 70% of moves being less than 10 km, while only 6% of
moves more than 25 km of their previous residence in 2000. Besides, RM verifies
that when people move, they consider not only distance but also direction. In the
following part of this section, the findings represent the interaction between RM and
urban form as well as urban growth.
6.2.1.1 There is a tendency to move towards periphery
Both in 1990 and in 2000, RM flows of Istanbul exhibit relatively complex patterns.
In order to decrease this complexity as well as to show the relationship between RM
and urban form, as a first step Istanbul’s districts are grouped in three sub-groups by
housing stocks’ construction periods, in 2000. Table 6.8 initiates the description and
districts, of sub-groups.38
And as a second step, I calculate Flow priority From/To
Matrix of Istanbul for each sub-groups (see Table 6.9).
38
In the following parts of this study, sub-group 1 refers to the “inner-zone” of the city, sub-group 2
refers to the “middle-zone” of the city, and sub-group 3 refers to the “outer-zone” of the city in 2000.

143
Table 6.8 Sub-groups of districts by construction period of housing stock in Istanbul
Sub-groups Description Districts
Core
Periphery
Sub-group 1 Nearly more than half of its
housing stock was constructed
before the 1970s
Eminönü, Fatih, Beşiktaş,
Şişli, Beyoğlu
Sub-group 2 Nearly more than half of its
housing stock was constructed
in the period 1970-1990
Bakırköy, Bayrampaşa, Beykoz,
Esenler, Sarıyer, Bağcılar, Kağıthane,
Kadıköy, Güngören, Eyüp,
Ümraniye, Bahçelievler, Üsküdar,
Zeytinburnu,
Sub-group 3 Nearly more than half of its
housing stock was constructed
in the period 1990-2000
Pendik, Tuzla, Büyükçekmece,
Sultanbeyli, Avcılar, Gaziosmanpaşa,
Küçükçekmece, Kartal, Maltepe
A closer look at the distribution of flow priority index value of sub-groups in
Istanbul reveals that people tend to move from inner and middle zones towards the
outer-zone of the city in 2000. As can be seen in Table 6.3, the priority index value
of from inner-zone to outer-zone flows was 0.3 in 2000, while the priority index
value of from inner-zone to middle-zone flows was only -0.5 in the same period. The
in-comers and out-goers index values for each sub-group also fortify this tendency:
in 2000 the in-comers index value of inner-zone was only 0.7, while for outer-zone
this value was 1.2 (see table 6.3).
Table 6.9 Priority Index From/To matrix, the In-comers and Out-goers Indices of
Istanbul for sub-groups in 2000
1995-2000
Priority Index In-
comers
Index
Out-
goers
Index Destination
Inner Middle Outer
Ori
gin
Inner - -0.5 0.3 0.7 1.5
Middle -0.2 - 0.4 0.9 1.1
Outer -0.6 -0.3 - 1.2 0.8
144
In a same manner, Küçükçekmece and Ümraniye were the most favourable outer-
zone districts in 1990. As can be seen in Table 6.10, the in-comers index of
Küçükçekmece was 3.1 and for Ümraniye this rate was 1.8 in 1990. It is clear that
the mobility flows from Kadıköy, Üsküdar, Şişli, Beşiktaş and Beyoğlu to Ümraniye
represent priority (see Figure 6.2). However, in the case of Küçükçekmece, flows
from Bakırköy, Zeytinburnu and Fatih represent priority. The findings of the analysis
also show that while in-comers of Küçükçekmece were relatively high-status groups,
the in-comers of Ümraniye were mostly middle-status groups in 1990.
By 2000, Büyükçekmece became the most favourable district with 2.6 in-comers
index. The mobility flows from Bakırköy and Bahçelievler to Büyükçekmece show
priority (see figure 6.3). As can be seen in Table 6.10, the in-comers index of
Maltepe was 1.3; this means that in Anatolian side Maltepe was the most favourable
district of households. A closer look at the composition of the in-comers of those
districts shows that while Büyükçekmece was preferred by mostly high-educated
households, Maltepe was the favourable district of elderly in 2000.
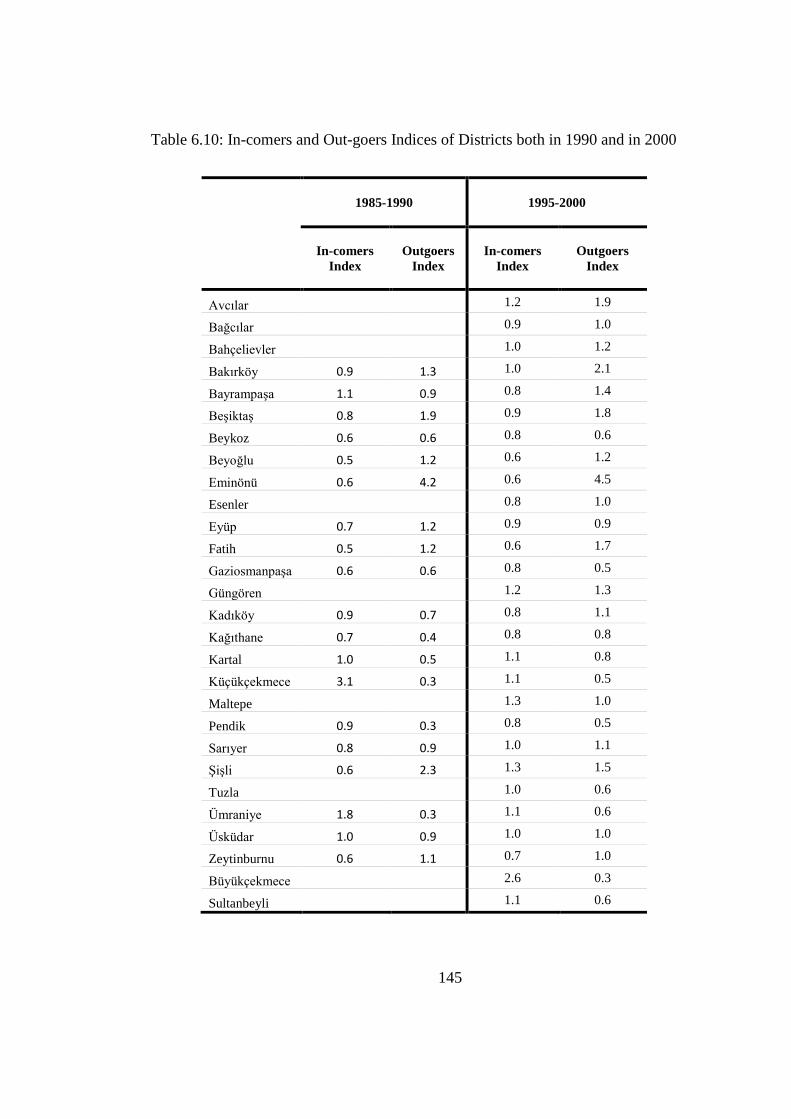
145
Table 6.10: In-comers and Out-goers Indices of Districts both in 1990 and in 2000
1985-1990 1995-2000
In-comers
Index
Outgoers
Index
In-comers
Index
Outgoers
Index
Avcılar 1.2 1.9
Bağcılar 0.9 1.0
Bahçelievler 1.0 1.2
Bakırköy 0.9 1.3 1.0 2.1
Bayrampaşa 1.1 0.9 0.8 1.4
Beşiktaş 0.8 1.9 0.9 1.8
Beykoz 0.6 0.6 0.8 0.6
Beyoğlu 0.5 1.2 0.6 1.2
Eminönü 0.6 4.2 0.6 4.5
Esenler 0.8 1.0
Eyüp 0.7 1.2 0.9 0.9
Fatih 0.5 1.2 0.6 1.7
Gaziosmanpaşa 0.6 0.6 0.8 0.5
Güngören 1.2 1.3
Kadıköy 0.9 0.7 0.8 1.1
Kağıthane 0.7 0.4 0.8 0.8
Kartal 1.0 0.5 1.1 0.8
Küçükçekmece 3.1 0.3 1.1 0.5
Maltepe 1.3 1.0
Pendik 0.9 0.3 0.8 0.5
Sarıyer 0.8 0.9 1.0 1.1
Şişli 0.6 2.3 1.3 1.5
Tuzla 1.0 0.6
Ümraniye 1.8 0.3 1.1 0.6
Üsküdar 1.0 0.9 1.0 1.0
Zeytinburnu 0.6 1.1 0.7 1.0
Büyükçekmece 2.6 0.3
Sultanbeyli 1.1 0.6

146
Figure 6.2 Priority Flows of Istanbul in 1990
Figure 6.3 Priority Flows of Istanbul in 2000

147
6.2.1.2 People tend to leave from historical core of the city
As indicated in chapter 2, processes of changes on economic, social, and
demographic and technical domains also create dispersal of population. Table 6.9
indirectly indicates the tendencies of movers in the redistribution of population
within Istanbul metropolitan area, with the inner zone experiencing substantial but
declining loss of population, as did the middle-suburbs.
Table 6.11 In-comers and Out-goers Indices of inner-zone districts both in 1990 and
in 2000
1985-1990 1995-2000
In-comers
Index
Outgoers
Index
In-comers
Index
Outgoers
Index
Beşiktaş 0.8 1.9 0.9 1.8
Beyoğlu 0.5 1.2 0.6 1.2
Eminönü 0.6 4.2 0.6 4.5
Fatih 0.5 1.2 0.6 1.7
Şişli 0.6 2.3 1.3 1.5
The out-goers index values of all inner-zone districts are significant: Beşiktaş with
1.9, Şişli with 2.3 and Eminönü with 4.2 in 1990 (see Table 6.11). Considering the
in-comers index values of those districts, it is clear that people tend to move from
historical core of the city and this is a one-way flow. However, on the contrary to the
other inner-zone districts, the out-goers index values of Eminönü and Fatih increased
in the period between 1990 and 2000. As can be seen in Table 6.11, the out-goers
index, of Eminönü increased from 4.2 in 1990 to 4.5 in 2000, of Fatih it increased
from 1.2 to 1.7 in the same period. It is right to expect that this situation is closely
related with decentralization of industry from inner-city since the early 1980s.

148
Furthermore, this tendency is also in compatible with the labelling Eminönü as one
of the touristic points of Istanbul in the post-1990 period. At the aggregate level, this
indicates the decline of the historical core of the city.
6.2.1.3 High-educated people diffused from inner-city
Both in 1990 and in 2000, high-educated households mostly prefer to leave inner-city
districts, in particular Eminönü and Fatih. Table 6.12 illustrates that the out-goers
index score of high-educated households was 0.6 for Eminönü, was 0.5 for Beşiktaş,
was 0.2 for Fatih, in 2000. These movements do not show reciprocal characteristics,
except Beşiktaş: the in-comers index score of the district was 0.3. This means that
the turnover rate of Beşiktaş regarding high-educated households is relatively higher
than the rest of the city in 1990. It is clear that high-educated households mostly
move towards districts with high development index which is discussed in detail in
the following part of this chapter. In compatible with the deprivation of inner-city,
the decentralization of high-educated movers has gained momentum by 2000. Table
6.12 provides evidence to this tendency regarding in-comers and out-goers indices.
In Eminönü, the out-goers rate of high-educated households was 0.8, while the in-
comers rate of those was only 0.1. It is not difficult to see the same profile in Fatih:
of high-educated households the in-comers rate was 0.11 and the out-goers rate was
only 0.40 in the same period. Nevertheless, Beşiktaş and Şişli show different
composition. In simplistic words, the flows of Beşiktaş and Şişli are two-way. In
other words, Beşiktaş and Şişli are either origin or destination points for high-
educated households. For example, in 2000, both the out-goers and in-comers indices
of Beşiktaş were significant: 0.5 and 0.8 respectively. This can be interpreted as
Beşiktaş and Şişli were still among the favourable districts of high-educated
households, on the contrary to Eminönü and Fatih.

149
Table 6.12 High-educated households’ In-comers and Out-goers indices both in 1990
and in 2000
1985-1990 1995-2000
In-comers
Index
Outgoers
Index
In-
comers
Index
Outgoers
Index
Avcılar 0.16 0.43
Bağcılar 0.05 0.07
Bahçelievler 0.17 0.29
Bakırköy 0.10 0,12 0.41 0.75
Bayrampaşa 0.08 0.04 0.05 0.13
Beşiktaş 0.28 0.47 0.50 0.78
Beykoz 0.05 0.11 0.22 0.12
Beyoğlu 0.06 0.10 0.10 0.19
Eminönü 0.06 0.56 0.06 0.77
Esenler 0.03 0.05
Eyüp 0.07 0.05 0.12 0.11
Fatih 0.07 0.21 0.11 0.40
Gaziosmanpaşa 0.03 0.04 0.03 0.05
Güngören 0.19 0.19
Kadıköy 0.28 0.14 0.36 0.40
Kağıthane 0.05 0.04 0.11 0.11
Kartal 0.14 0.09 0.18 0.12
Küçükçekmece 0.19 0.03 0.16 0.10
Maltepe 0.36 0.24
Pendik 0.07 0.04 0.10 0.09
Sarıyer 0.10 0.15 0.43 0.31
Şişli 0.14 0.36 0.49 0.41
Tuzla 0.17 0.21
Ümraniye 0.08 0.03 0.15 0.08
Üsküdar 0.18 0.15 0.35 0.27
Zeytinburnu 0.05 0.09 0.13 0.12
Büyükçekmece 0.77 0.05
Sultanbeyli 0.03 0.07

150
In short, as can be seen in Figure 6.4 and 6.5, high-educated households
decentralized from the city-centre to the new developed residential areas that were
mostly sites and gated communities (as discussed in chapter 2, section 2.3.3). This
tendency also accelerated the filtering down of housing opportunities and the
movement of low-educated households into higher-income residential areas in the
periphery of Istanbul in the post-1980 period.
6.2.1.4 D-100 is not a boundary any longer for high-educated households
As indicated previously, high-educated households diffused from core of the city in
1990 and this tendency became more visible in 2000. Looking at from the broader
perspective, it is obviously the fact that high-educated households’ residential moves
take place among the middle and upper-middle districts lying on both sides of the
Bosphorus (see Figure 6.4). As known, these districts are on the route of D-100
highway; so, D-100 can be seen as a boundary for high-educated moves in 1990. In
this period, Beşiktaş, Kadıköy and Küçükçekmece were the favourable districts of
high-educated households, the in-comers index of those districts were 0.3, 0.3 and
0.2 respectively (see Table 6.12)
In 2000, high-educated households move significantly towards Büyükçekmece with
0.8 in-comers index (see Table 6.12). Beşiktaş, Şişli, Kadıköy and Maltepe were also
favourable districts of high-educated households in 2000. As can be seen in Table
6.6, the in-comers index of Beşiktaş and Şişli was 0.5, along with Kadıköy, Sarıyer
and Maltepe was 0.4 in 2000. This means that Büyükçekmece was chosen by vast
majority of high-educated household in 2000. Considering the housing stock
characteristics of Büyükçekmece, I think it is right to say that high-educated movers
tend to live relatively new residential areas in the city of Istanbul.

151
Figure 6.4 Priority Flows of High-educated households in 1990
Figure 6.5 Priority Flows of High-educated households in 2000

152
As can be seen in Figure 6.4 and 6.5, these patterns show that the interaction between
high-educated households and the city increased between 1990 and 2000. Especially,
the reciprocal moves between the new CBDs (Beşiktaş and Kadıköy) increased in
2000. If you look at more closely, it is clear that D-100 is not a boundary any longer;
the districts which high-educated households interact with located unevenly in the
city. In consistent with the growing middle- and upper-middle income residential
areas at the outskirts of the city, residential moves of high-educated households
towards the outskirts areas such as Beykoz, Şişli, Küçükçekmece, Büyükçekmece
and Eyüp, have gained momentum in 2000. These patterns also show the
differentiated as well as increased number of sub-urbanization patterns of high-
educated households both in 1990 and in 2000 (see Figure 6.4 and 6.5).
6.2.1.5 People tend to move short distance in the city: Proximity matters
In order to examine distance preferences of mobility flows in Istanbul, I analyse
mobility flows in 2000 in terms of distance and direction tendencies. Table 6.13
illustrates this analysis. As can be seen in this table, some of the cells are highlighted
regarding priority index value (PR>2). Furthermore, it is necessary to mentioned
that districts are listed according to the distance from each other. 39
This means that
while Beşiktaş and Şişli are close by each other, Beşiktaş and Tuzla are far from each
other.
It is clear that proximity matters but there is not general profile which represents all
RM patterns in Istanbul. However, most of the mobility flows of households in
Istanbul are relatively short distance moves. For example, out-goers of Eminönü
mostly prefer to move to the nearest districts-Fatih and Zeytinburnu: the out-goers
index of these flows was 12 in 2000. In a same manner, households who move from
39
The hierarchical clustering of districts in terms of their distance to each other can be seen in
Appendix D.
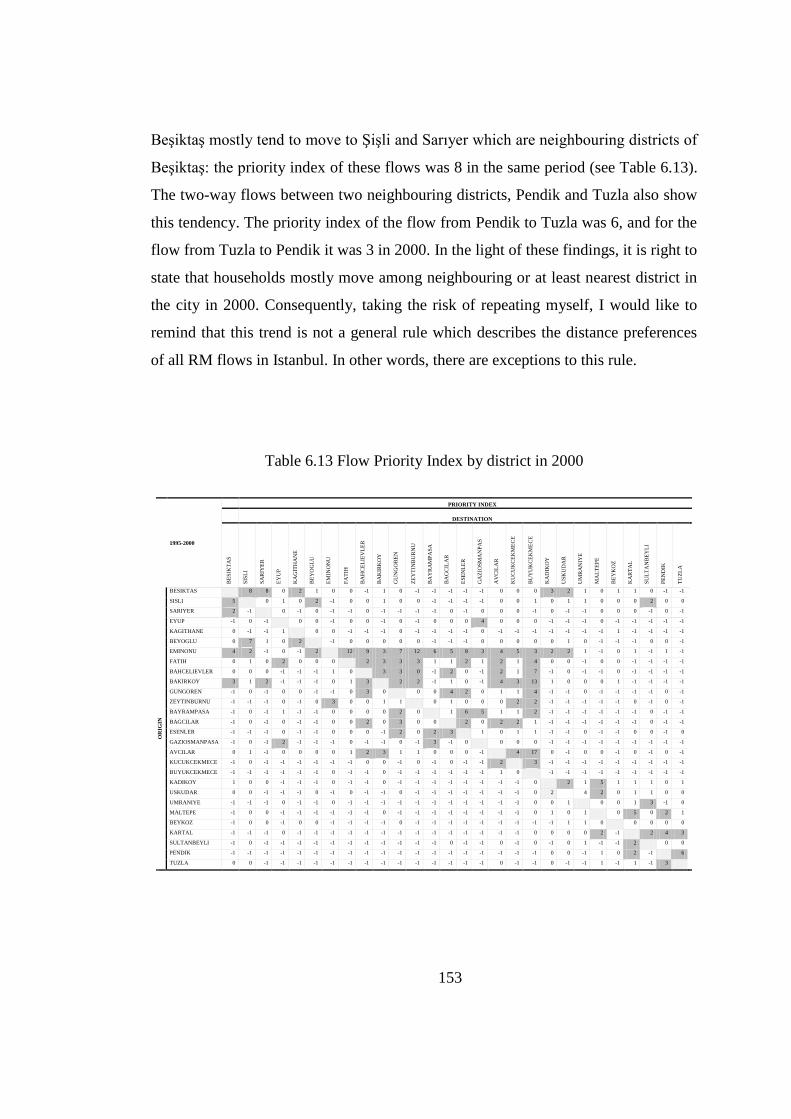
153
Beşiktaş mostly tend to move to Şişli and Sarıyer which are neighbouring districts of
Beşiktaş: the priority index of these flows was 8 in the same period (see Table 6.13).
The two-way flows between two neighbouring districts, Pendik and Tuzla also show
this tendency. The priority index of the flow from Pendik to Tuzla was 6, and for the
flow from Tuzla to Pendik it was 3 in 2000. In the light of these findings, it is right to
state that households mostly move among neighbouring or at least nearest district in
the city in 2000. Consequently, taking the risk of repeating myself, I would like to
remind that this trend is not a general rule which describes the distance preferences
of all RM flows in Istanbul. In other words, there are exceptions to this rule.
Table 6.13 Flow Priority Index by district in 2000
1995-2000
PRIORITY INDEX
DESTINATION
BE
SIK
TA
S
SIS
LI
SA
RIY
ER
EY
UP
KA
GIT
HA
NE
BE
YO
GL
U
EM
INO
NU
FA
TIH
BA
HC
EL
IEV
LE
R
BA
KIR
KO
Y
GU
NG
OR
EN
ZE
YT
INB
UR
NU
BA
YR
AM
PA
SA
BA
GC
ILA
R
ES
EN
LE
R
GA
ZIO
SM
AN
PA
S
AV
CIL
AR
KU
CU
KC
EK
ME
CE
BU
YU
KC
EK
ME
CE
KA
DIK
OY
US
KU
DA
R
UM
RA
NIY
E
MA
LT
EP
E
BE
YK
OZ
KA
RT
AL
SU
LT
AN
BE
YL
I
PE
ND
IK
TU
ZL
A
OR
IGIN
BESIKTAS 8 8 0 2 1 0 0 -1 1 0 -1 -1 -1 -1 -1 0 0 0 3 2 1 0 1 1 0 -1 -1
SISLI 5 0 1 0 2 -1 0 0 1 0 0 -1 -1 -1 -1 0 0 1 0 1 1 0 0 0 2 0 0
SARIYER 2 -1 0 -1 0 -1 -1 0 -1 -1 -1 -1 0 -1 0 0 0 -1 0 -1 -1 0 0 0 -1 0 -1
EYUP -1 0 -1 0 0 -1 0 0 -1 0 -1 0 0 0 4 0 0 0 -1 -1 -1 0 -1 -1 -1 -1 -1
KAGITHANE 0 -1 -1 1 0 0 -1 -1 -1 0 -1 -1 -1 -1 0 -1 -1 -1 -1 -1 -1 -1 1 -1 -1 -1 -1
BEYOGLU 0 7 1 0 2 -1 0 0 0 0 0 -1 -1 -1 0 0 0 0 0 1 0 -1 -1 -1 0 0 -1
EMINONU 4 2 -1 0 -1 2 12 9 3 7 12 6 5 8 3 4 5 3 2 2 1 -1 0 1 -1 1 -1
FATIH 0 1 0 2 0 0 0 2 3 3 3 1 1 2 1 2 1 4 0 0 -1 0 0 -1 -1 -1 -1
BAHCELIEVLER 0 0 0 -1 -1 -1 1 0 3 3 0 -1 2 0 -1 2 1 7 -1 0 -1 -1 0 -1 -1 -1 -1
BAKIRKOY 3 1 2 -1 -1 -1 0 1 3 2 2 -1 1 0 -1 4 3 13 1 0 0 0 1 -1 -1 -1 -1
GUNGOREN -1 0 -1 0 0 -1 -1 0 3 0 0 0 4 2 0 1 1 4 -1 -1 0 -1 -1 -1 -1 0 -1
ZEYTINBURNU -1 -1 -1 0 -1 0 3 0 0 1 1 0 1 0 0 0 2 2 -1 -1 -1 -1 -1 0 -1 0 -1
BAYRAMPASA -1 0 -1 1 -1 -1 0 0 0 0 2 0 1 6 5 1 1 2 -1 -1 -1 -1 -1 -1 0 -1 -1
BAGCILAR -1 0 -1 0 -1 -1 0 0 2 0 3 0 0 2 0 2 2 1 -1 -1 -1 -1 -1 -1 0 -1 -1
ESENLER -1 -1 -1 0 -1 -1 0 0 0 -1 2 0 2 3 1 0 1 1 -1 -1 0 -1 -1 0 0 -1 0
GAZIOSMANPASA -1 0 -1 2 -1 -1 -1 0 -1 -1 0 -1 3 -1 0 0 0 0 -1 -1 -1 -1 -1 -1 -1 -1 -1
AVCILAR 0 1 -1 0 0 0 0 1 2 3 1 1 0 0 0 -1 4 17 0 -1 0 0 -1 0 -1 0 -1
KUCUKCEKMECE -1 0 -1 -1 -1 -1 -1 -1 0 0 -1 0 -1 0 -1 -1 2 3 -1 -1 -1 -1 -1 -1 -1 -1 -1
BUYUKCEKMECE -1 -1 -1 -1 -1 -1 0 -1 -1 0 -1 -1 -1 -1 -1 -1 1 0 -1 -1 -1 -1 -1 -1 -1 -1 -1
KADIKOY 1 0 0 -1 -1 -1 0 -1 -1 0 -1 -1 -1 -1 -1 -1 -1 -1 0 2 1 5 1 1 1 0 1
USKUDAR 0 0 -1 -1 -1 0 -1 0 -1 -1 0 -1 -1 -1 -1 -1 -1 -1 0 2 4 2 0 1 1 0 0
UMRANIYE -1 -1 -1 0 -1 -1 0 -1 -1 -1 -1 -1 -1 -1 -1 -1 -1 -1 0 0 1 0 0 1 3 -1 0
MALTEPE -1 0 0 -1 -1 -1 -1 -1 -1 0 -1 -1 -1 -1 -1 -1 -1 -1 0 1 0 1 0 5 0 2 1
BEYKOZ -1 0 0 -1 0 0 -1 -1 -1 -1 0 -1 -1 -1 -1 -1 -1 -1 -1 -1 1 1 0 0 0 0 0
KARTAL -1 -1 -1 0 -1 -1 -1 -1 -1 -1 -1 -1 -1 -1 -1 -1 -1 -1 0 0 0 0 2 -1 2 4 3
SULTANBEYLI -1 0 -1 -1 -1 -1 -1 -1 -1 -1 -1 -1 -1 0 -1 -1 0 -1 0 -1 0 1 -1 -1 2 0 0
PENDIK -1 -1 -1 -1 -1 -1 -1 -1 -1 -1 -1 -1 -1 -1 -1 -1 -1 -1 -1 0 0 -1 1 0 2 -1 6
TUZLA 0 0 -1 -1 -1 -1 -1 -1 -1 -1 -1 -1 -1 -1 -1 -1 0 -1 -1 0 -1 -1 1 -1 1 -1 3

154
At this point, as assumption comes up “when the distance between the districts of
origin and that of destination increases, the priority index of mobility flows
decreases” In order to test this assumption I examine the in-comers and out-goers
flows of districts in terms of distance and direction composition. In this respect, I
focus on the distance and direction preferences of the flows of Şişli and Güngören, in
detail. As can be seen in Table 6.13, Şişli’s out-goers mostly tend to move to
Beşiktaş, Beyoğlu and Sultanbeyli: the priority index of the flow from Şişli to
Beşiktaş was 5 and it was 2 for both the flows to Beyoğlu and Sultanbeyli. This
means that although Şişli and Sultanbeyli are noticeably far from each other, the
priority index of the flow from Şişli to Sultanbeyli was the same as the flow from
Şişli to Beyoğlu which are neighbouring districts. This trend is also true for the flows
from Güngören. For example, the outgoers of Güngören mostly tend to move
towards Bağcılar, Bahçelievler and Büyükçekmece. As can be seen in Table 6.13, the
priority index of the flows from Güngören to Bahçelievler was 2 in 2000; however
the out-goers index of the flows from Güngören to Bağcılar and Büyükçekmece was
the same: 4 in the same period. In the light of these findings, it is clear that the
assumption above is refuted.
6.2.1.6 High-educated Households Move Further than Low-educated Households
In the case of Istanbul, the average distance is 13.7 km, 70% of moves being less
than 10 km, while only 6% of them moves more than 25 km of their previous
residence in 2000. In the same period, for moves of high-educated households the
average distance was 14.5 km and for low-educated households it was 11.5 km:
meaning that high-educated move further than low-educated households. Here, it is
right to say that the proximity to former housing is not significant for high-educated
households’ moves, on the contrary to the low-educated households’ moves. A closer
look at this situation highlights that low-educated with unemployed households move
farther than average low-status groups. For instance, when analysing the in-comers
155
of Sultanbeyli, I find that approximately 50% of low-educated in-comers moved
from Bağcılar to Sultanbeyli were unemployed in 2000. This holds true for the cases
of Ümraniye-Bağcılar and Tuzla. And it is significant that the socio-economic
development indexes of these districts are low and their levels are very close to each
other.
As indicated in the previously, high-educated households move further than low-
educated households. The average distance of high-educated movers’ moves was
14.1 km in 2000; while the average distance of low-educated movers’ moves was
12.5 km. This indirectly implies that the distance between workplace and home are
still important for low-status movers in their choice of residents, yet, for high-status
households the distance between workplace and residence does not seem to be
important in such a decision. According to social capital theory, households can
derive financial and emotional support from its social networks, and once it moves to
another neighbourhood, this kind of social capital may be lost (Kan, 2007). In this
sense, the low-mobility rate and short-distance moves of poor could also be seen as a
survive mechanism in Istanbul until the 2000s.
6.2.1.7 Low-educated households stuck in one-side of the city
Referring chapter 4, RM rate of low-educated household significantly decreased
from 11% in 1990 to 8.3% in 2000. This shift can be seen through the changes on
spatial patterns of low-educated households both in 1990 and in 2000. This profile
can also been seen through the changes in the spatial patterns of their mobility flows.
As can be seen in Figure 6.8, in 1990, four distinct patterns of low-educated
households’ residential moves were realized. In 1990, following Küçükçekmece,
Ümraniye was the second most favourable district of low-educated households: the
in-comers index of this district was 0.3 (see Table 6.14). The flows from Kadıköy to

156
Ümraniye and Pendik, see figure 6.6, display the mobility of mostly middle-aged and
large low-educated households. The second mobility pattern of low-educated
households is the flows from Eminönü to Bayrampaşa and Bakırköy which show the
mobility of low-educated with small households. In compatible with the
decentralization of small industry from core of the city, low-educated households
who mostly were employed these sites preferred to move from inner-city (such as
Eminönü) to new industrial sites such as Bayrampaşa and Bakırköy in this period.
The in-comers and out-goers indices also fortify this interpretation: for example
while the out-goers index of Eminönü was 0.28 and the in-comers index of
Bayrampaşa was 0.14 in 1990. In compatible with the argument on decentralization
of industry, low-educated households move from Şişli to Kağıthane and Sarıyer.
Referring Chapter 2, in the post-1980 period Şişli was labelled as a new finance
centre of the city. In order to gain this aim, the small manufacturing was
decentralized from Şişli. As one of the consequences of this process, low-educated
households move from the district. Furthermore, a closer look at these movers
highlights that these are mostly low-educated with large-households. Considering the
distance and housing preferences of low-educated households, it is not surprising to
see that Kağıthane and Sarıyer (with high-percentage of gecekondu and closest
districts from Şişli) are destinations of them. Apart from the other segments of low-
educated households, older ones tend to move from Üsküdar and Şişli to Kadıköy.
Here, in the light of the findings of this study, it is right to claim that Kadıköy is one
of the favourable districts for older and retirement in 1990.
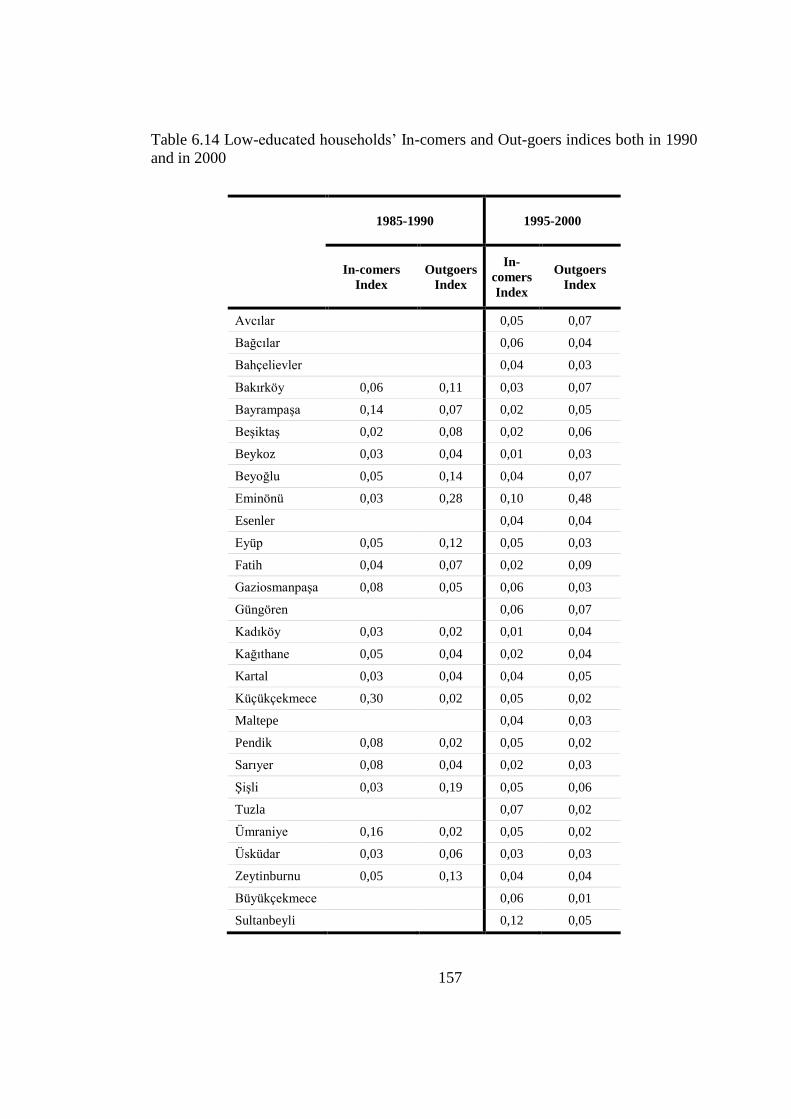
157
Table 6.14 Low-educated households’ In-comers and Out-goers indices both in 1990
and in 2000
1985-1990 1995-2000
In-comers
Index
Outgoers
Index
In-
comers
Index
Outgoers
Index
Avcılar 0,05 0,07
Bağcılar 0,06 0,04
Bahçelievler 0,04 0,03
Bakırköy 0,06 0,11 0,03 0,07
Bayrampaşa 0,14 0,07 0,02 0,05
Beşiktaş 0,02 0,08 0,02 0,06
Beykoz 0,03 0,04 0,01 0,03
Beyoğlu 0,05 0,14 0,04 0,07
Eminönü 0,03 0,28 0,10 0,48
Esenler 0,04 0,04
Eyüp 0,05 0,12 0,05 0,03
Fatih 0,04 0,07 0,02 0,09
Gaziosmanpaşa 0,08 0,05 0,06 0,03
Güngören 0,06 0,07
Kadıköy 0,03 0,02 0,01 0,04
Kağıthane 0,05 0,04 0,02 0,04
Kartal 0,03 0,04 0,04 0,05
Küçükçekmece 0,30 0,02 0,05 0,02
Maltepe 0,04 0,03
Pendik 0,08 0,02 0,05 0,02
Sarıyer 0,08 0,04 0,02 0,03
Şişli 0,03 0,19 0,05 0,06
Tuzla 0,07 0,02
Ümraniye 0,16 0,02 0,05 0,02
Üsküdar 0,03 0,06 0,03 0,03
Zeytinburnu 0,05 0,13 0,04 0,04
Büyükçekmece 0,06 0,01
Sultanbeyli 0,12 0,05

158
Figure 6.6 Priority Flows of low-educated households in 1990
Figure 6.7 Priority Flows of low-educated households in 2000

159
In 2000, the picture above significantly changed. Figure 6.7 perfectly shows this
transformation. As can be seen, three clear patterns are recognized:
• The flow from Eminönü to Güngören, Bahçelievler, Bakırköy and Avcılar
show the mobility of low-educated household and couples with children as well as of
low-educated with single parents. This pattern shows the decentralization of low-
educated households from historical core of the city. In 2000, the out-goers index of
Eminönü was 0.48 (see Table 6.14). As mentioned previously, this situation is
closely interlinked with the changing employment profile of Eminönü.
• The flow from Kartal to Sultanbeyli shows the mobility of low-educated
household with large households, couple with children and unemployed (see figure
6.7). This means that the most disadvantaged segment of low-educated households
prefer to move to Sultanbeyli. In other words, the least mobile segment of low-status
groups can move from Kartal to Sultanbeyli, considering the distance preferences of
low-educated households this movement becomes more meaningful.
• The flow from Esenler, Kağıthane and Bayrampaşa towards Eminönü shows
the mobility of low-educated household with single parent. This means that, on the
contrary to high-educated households, for low-educated households Eminönü was
still attractive in 2000. The in-comers index of Eminönü was 0.1 in the same period.
However, it is necessary to remind you that its attractiveness is limited. This can be
interpreted like that Eminönü can serve appropriate housing units (mostly single
room) for this particular segment of low-status groups in 2000.
Within this background, it is clear that while RM rate of low-educated households
decreases, in addition, the spatial patterns of those became undiversified in terms of
number, distance and direction, from 1990 to 2000. In other words, of low-educated
movers; the number of priority flows decreased, the average distance of moves

160
decreased, the scope of directions significantly decreased in this period. In this sense,
it is right to claim that the interaction between urban space and low-educated
households significantly decreased in 2000.
6.2.2 Built Environment
How a neighbourhood affects the mobility tendencies of a household. As indicated in
Chapter 5, there is large number of studies which focus on the mutual relationships
between neighbourhood and inhabitants, as well as the role of mobility during the
formulation of these relationships. One of the major findings of these studies is that
the place of residence has particular effect on relocation process of households both
in terms of built environment and socio-economic as well as ethnic composition. In
this study, the interrelation between built environment and RM is examined referring
to age of the housing stock by districts.
6.2.2.1 There is a tendency towards new residential areas in the city
The composition of the housing stock and the characteristics of the population living
in the stock are the most important predictors of variation in mobility between
districts (Quigley and Weinbeg 1977; Bailey and Livinston, 2007). Thus it is
appropriate to assume that RM patterns of households are constrained by the existing
set of spatial settings and housing opportunities in the city. In order to test this
assumption, I examine the relationship between in-comers index and the age of
housing stock, by districts in 2000.

161
Figure 6.8 Housing stock by age and the in-comers index of districts in 2000
In Figure 6.8, the bar chart illustrates the housing age (primary index) and the line,
the in-comers index (secondary index) in 2000, by districts. It is clear that there is a
negative relationship between RM and the housing age, of districts. This means that
the availability of new housing stock in these areas has an increasing effect on RM.
In simplistic words, districts with a large percentage of new buildings show the
highest in-comers index such as Büyükçekmece, Maltepe and like.
Regarding the housing stock age composition, in Büyükçekmece, as can be seen in
figure 6.8 more than 70% of its housing stock aged <10, and of its housing stock
0,0 0,5 1,0 1,5 2,0 2,5 3,0
0 10 20 30 40 50 60 70 80 90
AVCILAR
BAGCILAR
BAHCELIEVLER
BAKIRKOY
BAYRAMPASA
BESIKTAS
BEYKOZ
BEYOGLU
EMINONU
ESENLER
EYUP
FATIH
GOP
GUNGOREN
KADIKÖY
KAĞITHANE
KARTAL
KÜÇÜKÇEKMECE
MALTEPE
PENDİK
SARIYER
ŞİŞLİ
TUZLA
ÜMRANİYE
ÜSKÜDAR
ZEYTİNBURNU
BÜYÜKÇEKMECE
SULTANBEYLİ
>30 <10 in-comers Index

162
only 2% aged>30 in 2000. In a same vein, Eminönü shows just the opposite profile:
more than 70% of housing stock aged >30 and only 5% of housing stock aged <10,
in Eminönü. This composition becomes more meaningful, considering the in-comers
rates of those districts: Eminönü was the least on the contrary Büyükçekmece was
the most favourable districts of Istanbul in 2000. This profile can be interpreted like
that while the gap between housing stock age composition of district increase in
favour of young housing units, the attractiveness of district decreases in the case of
Istanbul.
Referring chapter 2, in Turkey, while housing age of housing stock decreases, the
differentiation of housing stock (in terms of the number of rooms and housing size)
increase in the post-1980 period. This tendency is also true in the case of Istanbul.
Within this background, thus, it is right to state that mobility is likely to be highest in
local housing markets with relatively new and many opportunities for households to
find a dwelling that suits their housing needs. In this sense, it is right to assume that
there is a close relationship between high mobility rate and the variety in housing
opportunities that are supplied the selective demands of households.
As a conclusion, the efforts to generalize the nature of directional preferences of
households across different districts failed, however, largely based on the findings of
second-phase analysis of this study, it is right to state that the direction of moves are
sensitive to the distinctive location of new housing opportunities in the city of
Istanbul.
6.2.3 Social Environment
Over time, the residential moves and the changes that they bring ultimately effect
and transform the population composition as well as the spatial structure of
neighbourhoods. In simplistic word, neighbourhoods change as people move in and

163
out. Within this framework, I can conceptualize the changes on urban socio-spatial
structure as the outcome of residential moves. Here, the focus is specifically on the
effects of residential moves on the districts’ socio-economic composition where they
move.
6.2.3.1 People Tend To Move Mostly among Relatively Similar Development Status
Districts
The most significant regularity in residential mobility patterns is that households tend
to move between areas of similar socio-economic status (Cadwallader, 1992; Clark,
1976). Is this argument valid in the case of Istanbul between 1980 and 2000? In the
case of Istanbul, with the aim of examining the interrelationship between RM
patterns and socio-economic profiles of districts, at first I develop a “socio-economic
development index” of districts (see Section 6.1.2). Then I classify districts of
Istanbul into four categories regarding their “development index” value in 2000 (see
table 6.9). By doing so, I aim to simplify the complex nature of flows and to show
the direction preferences of households.
Table 6.15 Sub-groups of districts regarding the socio-economic development index
value in 2000
Sub-
groups
Description Districts Socio-economic
development Index
Category 1 Higher development
districts
Beşiktaş, Kadıköy, Bakırköy,
Büyükçekmece, Şişli, Üsküdar
High
Low
Category 2 Middle development
districts-a
Maltepe, Sarıyer, Fatih, Avcılar,
Bahçelievler, Güngören, Kartal,
Beykoz
Category 3 Middle development
districts-b
Kağıthane, Eyüp, Bayrampaşa,
Zeytinburnu, Beyoğlu, Ümraniye,
Küçükçekmece
Category 4 Lower development
districts
Eminönü, Pendik, Tuzla,
Gaziosmanpaşa, Bağcılar, Esenler,
Sultanbeyli

164
In Table 6.15, as can be seen, priority flows are highlighted. A closer look at this
pattern shows that the mobility flows from Beşiktaş to Şişli, Kadıköy and Bakırköy
show priority. The priority Index of the flows from Beşiktaş to Sarıyer and Şişli was
8, for the flows from Beşiktaş to Kadıköy it was 2 and for the flows from Beşiktaş to
Bakırköy it was 1 in 2000. In a similar vein, the priority index of the flows towards
Beşiktaş from Şişli was 5, from Kadıköy to Beşiktaş was 1, and from Bakırköy to
Beşiktaş it was 3, in the same period. In the light of these findings, it is right to say
that the mobility among districts with high socio-economic index is significant in the
case of Istanbul.
Table 6.16 From/To Matrix (Priority Index) in 2000
1995-2000
PRIORITY INDEX
DESTINATION
Avcil
ar
Bağcıl
ar
Bahçeli
evle
r
Bakır
köy
Bayra
mpaşa
Beşi
kta
ş
Beykoz
Beyoğlu
Em
inönü
Ese
nle
r
Eyüp
Fati
h
Gazio
smanpaşa
Güngöre
n
Kadık
öy
Kağıt
hane
Kart
al
Küçükçekm
ece
Malt
epe
Pendik
Sarı
yer
Şiş
li
Tuzla
Üm
raniy
e
Üsk
üdar
Zeyti
nburn
u
Büyükçekm
ece
Sult
anbeyli
OR
IGIN
Avcılar 0 2 3 0 0 -1 0 0 0 0 1 -1 1 0 0 0 4 0 0 -1 1 -1 0 -1 1 17 -1
Bağcılar 2 2 0 0 -1 -1 -1 0 2 0 0 0 3 -1 -1 -1 2 -1 -1 -1 0 -1 -1 -1 0 1 0
Bahçelievler 2 2 3 -1 0 0 -1 1 0 -1 0 -1 3 -1 -1 -1 1 -1 -1 0 0 -1 -1 0 0 7 -1
Bakırköy 4 1 3 -1 3 1 -1 0 0 -1 1 -1 2 1 -1 -1 3 0 -1 2 1 -1 0 0 2 13 -1
Bayrampaşa 1 1 0 0 -1 -1 -1 0 6 1 0 5 2 -1 -1 -1 1 -1 -1 -1 0 -1 -1 -1 0 2 0
Beşiktaş 0 -1 -1 1 -1 1 1 0 -1 0 0 -1 0 3 2 1 0 0 -1 8 8 -1 1 2 -1 0 0
Beykoz -1 -1 -1 -1 -1 -1 0 -1 -1 -1 -1 -1 0 -1 0 0 -1 0 0 0 0 0 1 1 -1 -1 0
Beyoğlu 0 -1 0 0 -1 0 -1 -1 -1 0 0 0 0 0 2 -1 0 -1 0 1 7 -1 0 1 0 0 0
Eminönü 4 5 9 3 6 4 0 2 8 0 12 3 7 2 -1 1 5 -1 1 -1 2 -1 1 2 12 3 -1
Esenler 0 3 0 -1 2 -1 -1 -1 0 0 0 1 2 -1 -1 0 1 -1 -1 -1 -1 0 0 -1 0 1 0
Eyüp 0 0 0 -1 0 -1 -1 0 -1 0 0 4 0 -1 0 -1 0 0 -1 -1 0 -1 -1 -1 -1 0 -1
Fatih 2 1 2 3 1 0 0 0 0 2 2 1 3 0 0 -1 1 0 -1 0 1 -1 -1 0 3 4 -1
Gaziosmanpaşa 0 -1 -1 -1 3 -1 -1 -1 -1 0 2 0 0 -1 -1 -1 0 -1 -1 -1 0 -1 -1 -1 -1 0 -1
Güngören 1 4 3 0 0 -1 -1 -1 -1 2 0 0 0 -1 0 -1 1 -1 0 -1 0 -1 0 -1 0 4 -1
Kadıköy -1 -1 -1 0 -1 1 1 -1 0 -1 -1 -1 -1 -1 -1 1 -1 5 0 0 0 1 1 2 -1 0 1
Kağıthane -1 -1 -1 -1 -1 0 1 0 0 -1 1 -1 0 0 -1 -1 -1 -1 -1 -1 -1 -1 -1 -1 -1 -1 -1
Kartal -1 -1 -1 -1 -1 -1 -1 -1 -1 -1 0 -1 -1 -1 0 -1 -1 2 4 -1 -1 3 0 0 -1 0 2
Küçükçekmece 2 0 0 0 -1 -1 -1 -1 -1 -1 -1 -1 -1 -1 -1 -1 -1 -1 -1 -1 0 -1 -1 -1 0 3 -1
Maltepe -1 -1 -1 0 -1 -1 0 -1 -1 -1 -1 -1 -1 -1 1 -1 5 -1 2 0 0 1 1 0 -1 0 0
Pendik -1 -1 -1 -1 -1 -1 0 -1 -1 -1 -1 -1 -1 -1 0 -1 2 -1 1 -1 -1 6 -1 0 -1 -1 -1
Sarıyer 0 0 0 -1 -1 2 0 0 -1 -1 0 -1 0 -1 0 -1 0 0 0 0 -1 -1 -1 -1 -1 -1 -1
Şişli 0 -1 0 1 -1 5 0 2 -1 -1 1 0 -1 0 0 0 0 0 0 0 0 0 1 1 0 1 2
Tuzla 0 -1 -1 -1 -1 0 -1 -1 -1 -1 -1 -1 -1 -1 0 -1 1 -1 1 3 -1 0 -1 -1 -1 -1 -1
Ümraniye -1 -1 -1 -1 -1 -1 0 -1 0 -1 0 -1 -1 -1 0 -1 1 -1 0 -1 -1 -1 0 1 -1 0 3
Üsküdar -1 -1 -1 -1 -1 0 0 0 -1 -1 -1 0 -1 0 2 -1 1 -1 2 0 -1 0 0 4 -1 0 1
Zeytinburnu 0 1 0 1 0 -1 -1 0 3 0 0 0 0 1 -1 -1 0 2 -1 0 -1 -1 -1 -1 -1 2 -1
Büyükçekmece 1 -1 -1 0 -1 -1 -1 -1 0 -1 -1 -1 -1 -1 -1 -1 -1 0 -1 -1 -1 -1 -1 -1 -1 -1 -1
Sultanbeyli 0 0 -1 -1 -1 -1 -1 -1 -1 -1 -1 -1 -1 -1 -1 -1 2 -1 -1 0 -1 0 0 1 0 -1 0

165
This tendency is also seen through the mobility flows among middle-development
districts. For example, see Table 6.16, the priority index of the flows from Eyüp to
Gaziosmanpaşa was 4 in 2000. In addition, the in-comers to Eyüp mostly move from
Gaziosmanpaşa and Fatih with priority index of those flows was 2 in 2000.
Considering the socio-economic development level of those districts, this means that
the argument above is also true in the case of middle-development districts of
Istanbul in 2000.
In the mobility flows among the less-development districts of Istanbul, this tendency
is also shown in 2000. For example, as can be seen in Table 6.16, while in-comers of
Tuzla mostly move from Pendik (the priority index of this flow was 6), the out-goers
from Tuzla mostly move to Pendik (the priority index of this flow was 3), in 2000.
In this thesis, I state that RM of households can be occurred if the housing stock in
destination point is available to supply the demand of those households. Taking this
statement as point of departure, it is right to say that these findings emphasize the
reciprocal relationship among RM and, socio-economic and housing characteristics,
of districts. In simplistic words, households can move to a district if there are
appropriate housing units regarding size, type but in particular regarding purchasing
level of households. This means that households move a house if only they can
afford it. In this respect, the finding above can be interpreted like that people tend to
move between districts with relatively similar socio-economic level because of the
fact that at the aggregate level there is a two-way relationship between characteristics
of housing units and of users.
6.2.3.2 Mobility changes the population composition of districts
In order to explore the effects of residential moves on destination districts, as
mentioned previously, I calculate the changes on the development index score of

166
districts (for the method used see Appendix C) and then I summarize results in Table
6.17. Figure 6.9 is a visual representation of Table 6.17. In the figure below, socio-
economic development index (grey bar) is represented in the primary index, and in
the secondary index the red bar represents the percentage contribution of in-comers
(Movers) and the green bar represents the contribution of migrants (%) to the
percentage change on socio-development index, by district in 2000.
Figure 6.9 Socio-economic development Index, the contribution (%) by movers and
migrants to development Index, by districts in 2000
-20,0 -10,0 0,0 10,0 20,0 30,0 40,0
0 0,1 0,2 0,3 0,4 0,5 0,6 0,7 0,8 0,9
Sultanbeyli
Esenler
Bağcılar
Eminönü
Gaziosmanpaşa
Pendik
Tuzla
Küçükçekmece
Ümraniye
Beyoğlu
Kağıthane
Zeytinburnu
Bayrampaşa
Eyüp
Beykoz
Bahçelievler
Kartal
Güngören
Sarıyer
Fatih
Avcılar
Büyükçekmece
Maltepe
Üsküdar
Şişli
Kadıköy
Bakırköy
Beşiktaş
DI of immobiles Movers % Migrants %

167
Table 6.17 Contributions of Movers and Migrants on the change in Development
Index, by Districts in 2000
Districts
in 2000
Socio-
economic
development
Index
Socio-
economic
development
Index of
immobiles
The
contribution of
both Migrants
and Movers to
development
index (%)
The
contribution
of Migrants
(%)
The
contribution
of Movers
(In-comers)
(%)
Avcılar 0.459278 0.474164 -3.14 -2.32 -0.82
Bağcılar 0.237535 0.229221 3.63 3.61 0.02
Bahçelievler 0.412271 0.412323 -0.01 -1.43 1.41
Bakırköy 0.738722 0.756528 -2.35 -1.79 -0.56
Bayrampaşa 0.376687 0.377210 -0.14 1.22 -1.36
Beşiktaş 0.849840 0.834364 1.85 0.85 1.00
Beykoz 0.433532 0.407895 6.29 3.27 3.01
Beyoğlu 0.349541 0.336371 3.92 3.76 0.16
Büyükçekmece 0.575740 0.500350 15.07 1.49 13.58
Eminönü 0.222277 0.253181 -12.21 -8.81 -3.40
Esenler 0.208851 0.203848 2.45 3.80 -1.35
Eyüp 0.389103 0.398650 -2.39 -2.88 0.49
Fatih 0.455525 0.461192 -1.23 0.01 -1.24
Gaziosmanpaşa 0.274187 0.269258 1.83 1.34 0.49
Güngören 0.426123 0.433756 -1.76 -3.09 1.33
Kadıköy 0.723684 0.726120 -0.34 -0.74 0.40
Kağıthane 0.361729 0.340012 6.39 3.97 2.42
Kartal 0.421834 0.417596 1.01 -1.34 2.35
Küçükçekmece 0.332378 0.326310 1.86 -0.26 2.12
Maltepe 0.522213 0.505000 3.41 -0.66 4.07
Pendik 0.295995 0.284161 4.16 4.47 -0.30
Sarıyer 0.507040 0.455528 11.31 4.26 7.04
Sultanbeyli 0.025544 0.021791 17.22 -15.87 33.09
Şişli 0.591690 0.568717 4.04 -0.46 4.50
Tuzla 0.315863 0.294992 7.07 4.65 2.42
Ümraniye 0.348638 0.335320 3.97 1.37 2.60
Üsküdar 0.525759 0.508548 3.38 -0.36 3.74
Zeytinburnu 0.371165 0.375639 -1.19 -1.44 0.25

168
Basically, Table 6.17 and Figure 6.10 provide important information on to what
degree migrants and in-comers or movers affect the socio-economic and
demographic settings of Istanbul, by district. For an example of how to read this
table, take the second row which begins with Bağcılar: both immigrants and in-
comers are responsible for 3.63 % increase on socio-economic development index of
Bağcılar. Out of this, in-comers account for 3.61% of the increase whereas
immigrants are responsible for the remaining 0.02%.
It can be seen that both migrants and movers have significant impacts on
development levels of districts in 2000. The complexity of the interrelationships
between development index and the effects of migrants and movers can be seen in
Table 6.17 and Figure 6.10. However, a closer look at the analysis results highlights
that there are four generalisations of relationship between development levels and the
impacts of movers and migrants, of districts.
Figure 6.10 illustrates that the changes on socio-economic development index of
higher development districts are mostly on account of the increase effect of in-
comers to those districts’ population compositions in 2000. In other words, for higher
development districts, in-comers (movers) are mostly responsible for the increase in
the socio-economic development. For example, for Beşiktaş, the total contribution of
immigrants and in-comers on development index is 1.85% increase in 2000. Whereas
immigrants were responsible for 0.86%, the remaining 1.0% increase was mainly
spurred by the in-comers to Beşiktaş in 2000. This tendency is also seen in the case
of Maltepe. As can be seen from the twentieth row of Table 6.17, at aggregate
immigrants and in-comers of Maltepe were responsible for 3.41% increase on socio-
economic development index of districts. The contribution of immigrants on this
increase was -0.66% and the remaining 4.5% was accounted for in-comers, of
Maltepe in 2000. In a similar sense, Sarıyer, Şişli and Büyükçekmece also show this
profile in 2000. In short, these findings show that in-comers of most of the higher

169
development districts have similar or higher socio-economic status compared to the
immobiles composition of those districts. Besides, in the case of the higher
development districts, the in-comers to those districts have compensated the negative
contribution of the immigrants to the development index changes in such districts.
Another generality derived from the findings is that in peripheral districts of the city
such as Beykoz, Büyükçekmece, Sarıyer, Kağıthane and Gaziosmanpaşa, either
immigrants or in-comers have an increase effect on socio-economic development
index. For example, as can be seen in Table 6.17 and Figure 6.10, the total
contribution of immigrants and in-comers on socio-economic development index of
Beykoz is nearly 6.3%. Whereas the in-comers of Beykoz account for approximately
3% of this increase, the remaining 3.3% is the contribution of immigrants of Beykoz
in 2000.
In a similar vein, Büyükçekmece is also appropriate example: the immigrants and in-
comers are responsible for approximately 15.1% increase on socio-economic
development index of Büyükçekmece; whereas the in-comers of Büyükçekmece
account for approximately 13.6% of this increase; the remaining 1.5% is the
contribution of immigrants of Büyükçekmece in 2000. The picture above shows that
either immigrants or in-comers of most of the peripheral districts have higher socio-
economic and demographic profile compare to the composition of immobiles in
those districts. Bering the nature of the socio-economic development index in mind,
this situation is also interpreted like that high-status immigrants as well as high-status
in-comers tend to move more likely to peripheral districts having young housing
stock in Istanbul. Taking the risk of repeating myself, I would like restate that these
findings are also incompatible with the previous findings of the study (see sections
6.2.1.3 and 6.2.1.4).
170
While the decrease in the socio-economic development index of most of the inner-
city districts (Beşiktaş, Beyoğlu and Şişli) accounts for the in-comers’ contributions,
migrants are significantly responsible for the deprivation of the historical core of the
city in this period. It can be seen from Table 6.17 and Figure 6.10, migrants and in-
comers to Eminönü decreased socio-economic index of district by approximately -
12.2% in total. Out of this, the contribution of migrants to this change is
approximately -9% and the remaining -3.4% is contributed by in-comers of
Eminönü. The main reason of this composition is that relatively low-status in-comers
and migrants mostly tend to move towards Eminönü, and they have multiplier effect
on deprivation process in district. Nevertheless, as mentioned, migrants are the
primary actors compared to in-comers, on this process.
The other generality shows that migrants are responsible for the increase in the socio-
economic development index of lower development districts of Istanbul such as
Bağcılar, Tuzla, Ümraniye, Esenler and Pendik. It can be seen in the twenty-fifth row
of the table 6.11; both immigrants and in-comers are responsible for approximately
7.1 % increase in the socio-economic development index of Tuzla. Out of this,
migrants account for 4.7% of the increase whereas in-comers are responsible for the
remaining 2.4. This means that in the case of lower development districts the inflows
of immigration play a leading role on the increase of the socio-economic
development level. In other words, migrants are mainly responsible for population
composition changes at lower development districts.
There are, nevertheless, a few exceptions of these rules. Sultanbeyli is the most
noticeable one. While Sultanbeyli is the least development district in Istanbul,
however, regarding the contribution share of movers on its population composition
change it is on the top. As can be seen in Table 6.17, for Sultanbeyli, the total
contribution of immigrants and in-comers to the development index is approximately
increase by 17%. Whereas immigrants were responsible for -15.9%, the remaining

171
33.1% increase was mainly spurred by the in-comers to Sultanbeyli in 2000. This
means that despite of the fact that the share of high-status groups in Sultanbeyli is
relatively low; the in-comers to Sultanbeyli compensate the negative contribution of
migrants on population composition of the district.
At this point the question comes up “Do people tend to live with people having
similar socio-economic profile?” The answer of this question is somewhat
complicated. Nevertheless, in the following part of this chapter, I try to answer this
significant question of the study.
6.2.3.3 High-educated households tend to live households with similar profile
Do people want to live with people have similar profile? In order to answer this
broad question, whereas education is a factor variable to analyse households
composition in this study; I examine the changes on high-educated households’ rate
and the effects of in-comers and migrants on this change. By doing so, I attempt to
highlight the selectiveness as well as generalities in the mobility tendencies of
households.40
Table 6.18 indicates that there are two generalities. The first one is that high-
educated movers mostly tend to move districts with high-rate of high-educated
immobiles such as Beşiktaş, Sarıyer, Şişli, Kadıköy and Bakırköy. For example, as
can be seen from sixteenth row of the Table 6.18; both immigrants and in-comers are
responsible for 7.8 % increase on high—educated households’ rate of Kadıköy. Out
of this, in-comers account for 4% of the increase whereas immigrants are responsible
40
With this aim, at first, I examine the rate of high-educated households by districts (existing). Then, I
calculate the ratio of immobiles with high-educated, by districts and I subtract the rate of immobiles
high-educated household from the rate of household (existing). And I calculate the percentage
increase or decrease of this value. The result of this calculation is the total contribution of movers and
migrants to the rate of high-educated households. Then I analyse the percentage contribution of
migrants and of movers for each districts.

172
for the remaining 3.8%. Bearing the rate of high-educated immobiles of Kadıköy
(23%) in mind, it is right to say that high-educated households tend to live
households with similar education profiles. At the aggregate level, this tendency
could increase segmentation level in the city of Istanbul.
Nevertheless, Büyükçekmece and Sultanbeyli are the most significant exceptions of
this regularity. Whereas for Büyükçekmece the rate of high-educated immobiles is
low, high-educated in-comers significantly prefer to move to the district. As can be
seen in Table 6.18, the rate of high-educated immobiles in Büyükçekmece was
approximately 4.7%; the rate of high-educated households was approximately 8.7%
in existing households of Büyükçekmece. It is clear that 4% of high-educated
households in Büyükçekmece move to this district either RM or migration between
1995 and 2000. This means that both immigrants and in-comers are responsible for
relatively 87% increase on the rate of high-educated households in Büyükçekmece.
Out of this, in-comers account for 65% of the increase whereas immigrants are
responsible for the remaining 22%. However, this profile is in compatible with high-
educated movers’ tendency regarding being likelihood to move towards outskirts of
the city.
The other generalization aims to represents the preferences of high-educated
migrants in the city. Table 6.18 indicates that for high-educated migrants, to live with
high-educated households is not a criterion to choose the district to move. This
means that high-educated migrants tend to move either districts with higher
development or lower development. This can be interpreted like that bearing in mind
that mobility is a function of housing, these findings are also interpreted as the
evidence of being distinctive movement patterns of households with and without
information on housing market characteristics of the city.

173
Table 6.18 Share of high-educated households for existing, and immobiles; and the
contribution of movers and migrants on the rate of change in high-educated
households, by Districts in 2000
Districts
in 2000
High-
educated
households
%
existing
High-
educated
households
%
Immobiles
The
contribution
of both
Migrants and
Movers to
high-educated
households
(%)
The
contribution
of Migrants
(%)
The
contribution
of Movers
(In-comers)
(%)
Avcılar 7.79 7.65 1,8 1,9 -0,1
Bağcılar 2.67 2.43 9,8 6,4 3,3
Bahçelievler 8.10 7.26 11,6 6,1 5,4
Bakırköy 24.57 22.71 8,2 4,8 3,4
Bayrampaşa 3.72 3.40 9,1 5,7 3,5
Beşiktaş 31.89 28.42 12,2 7,2 5,0
Beykoz 6.50 4.50 44,6 14,2 30,4
Beyoğlu 5.27 4.45 18,4 11,7 6,7
Büyükçekmece 8.70 4.66 86,4 22,0 64,5
Eminönü 3.87 3.97 -2,5 -7,0 4,4
Esenler 1.97 1.64 19,9 16,8 3,1
Eyüp 4.51 4.12 9,7 2,8 6,9
Fatih 9.14 8.38 9,0 6,8 2,2
Gaziosmanpaşa 2.29 2,02 13,3 8,4 4,9
Güngören 7.02 6,29 11,8 3,8 7,9
Kadıköy 24.85 23,06 7,8 3,8 4,0
Kağıthane 4,40 3,59 22,7 10,2 12,5
Kartal 6,32 5,31 19,1 7,7 11,3
Küçükçekmece 4,84 4,17 16,0 4,1 11,8
Maltepe 12,34 10,53 17,3 6,5 10,8
Pendik 4,55 3,96 14,8 7,0 7,8
Sarıyer 11,62 8,15 42,6 15,5 27,1
Sultanbeyli 1,51 1,21 25,5 23,7 1,8
Şişli 13,99 11,26 24,2 10,7 13,5
Tuzla 4,84 3,39 42,7 19,7 23,1
Ümraniye 4,32 3,43 25,8 13,8 12,1
Üsküdar 13,38 11,11 20,4 8,5 12,0
Zeytinburnu 4,89 3,91 25,1 13,8 11,3

174
However, at the aggregate level these tendencies represent the segmentation patterns
in the city. In this respect, it can be said that while RM relatively increase the
segmentation level and make them more visible, apart from Istanbul’s migrants in the
period between 1995 and 2000.
6.3 Conclusion
The second-phase analysis of the study confirms that people mostly tend to move to
urban periphery. And, this tendency increased in the period between 1990 and 2000.
In the light of the findings, it is right to say that sub-urbanization process increased
and diversified regarding direction preferences of population in the same period.
Within this process, the roles of high-status group is noticeable important. High-
status groups left the historical core of the city and mostly move towards new
residential areas such as sites and gated communities located in the urban peripheral
districts. In other words, they passed through the middle-income housing areas
located on D-100 (buffer zone between high-income residential areas along with
Bosphorus and forest areas in north of the city) and they move to high-security
enclaves. These mobility patterns of high-status groups are also incompatible with
distance preferences of those groups. The findings state that high-status groups move
further than low-status groups in the case of Istanbul. This profile can be interpreted
like that in making their RM decision; high-status groups may exercise choice over a
wide spectrum of city and of housing markets within a city. In a sense, this
composition can be interpreted as the increase in the role of high-status groups on
restructuring of Istanbul’s urbanization after the mid-1990s.
Meanwhile, RM of low-status groups decreased in terms of rate and direction
differentiations. In a sense, they stuck in the city. There is a plenty of explanation on
this profile. Nevertheless, housing market conditions of the city can serve much
appropriate explanation on the changes in RM of low-status groups in the city of

175
Istanbul. As previously mentioned, RM operates smoothly when local housing
market is appropriate to supply the housing preferences of all segments of the
society. In compatible with this point of view, it is clear that between 1990 and 2000,
for high-status groups the housing opportunities increase in terms of location, size
and typology. On the other hand, for low-status groups the housing opportunities are
limited in terms of type, size and location in the same period.
The findings also support that people tend to live with people having similar profile
or people with similar composition tend to concentrate in certain areas. The findings
also show that while RM increases this tendency, contrary to migration. In a sense,
RM increases the segmentation level in the city between 1990 and 2000.
It is clear that RM is an important or main force that restructures population
composition of the city. In particular, in-comers (movers) are responsible for the
changes in population composition of higher development districts. Nevertheless, the
contributions of migrants at lower development districts are significant. In other
words, while RM is responsible for the population composition changes in most of
the higher development districts; most of the lower development districts are
transformed by the impacts of migrants in Istanbul.
176
CHAPTER 7
CONCLUDING
REMARKS
This thesis studies RM in Istanbul. This, to the best of my knowledge, is the first
study to examine residential mobility in Istanbul at an aggregate level. To what
degree is RM interrelated with the “shifts of urbanization in Istanbul” that seem to
have taken place between 1990 and 2000? Basically, it is this broad question that I
have tried to answer in this thesis. By doing this, I gain a perspective to review the
urbanization of Istanbul as well as such diverse socio-economic phenomena as
poverty, segregation, polarization, suburbanization in the post-1980 period. Before
turning to the summary of the major findings, I would like to make a few
introductory remarks.
The study of RM involves a dynamic interaction between urban space and its
inhabitants. RM redistributes and relocates the inhabitants over space. This in all is a
complex process as RM is not the only dynamic element involved, but both entities;
space and its inhabitants, are also mobile in their own contexts under the influence of
various exogenous and endogenous factors. Mobility over urban space is displayed
through evolution of built-up environment. This evolutionary process is structured
through exogenous factors, determinants like different categories and scales of urban
and environmental plans, implementations of the local and supra-local
administrations, urban housing and land market strategies and policies, attitude and
behaviour of relevant agents and stakeholders in the urban housing and land markets
and finally attitude and behaviour of the inhabitant segments who move in and out,

177
locate and relocate in that specific residential space in different periods of time
through RM.
The inhabitants on the other hand are motivated into RM through various exogenous
but mostly endogenous and integral factors like their socio-cultural, demographic,
and economic specifications and combinations of them. So a comprehensive research
designed to discuss both elements their causal and functional interrelation through
RM and the final impact of RM on both elements demands an extensive pool of
relevant data and a meticulous design of research. This study aims to clarify the
character, nature and specifications of RM in a city striving to become a global urban
socio-economic and cultural node, namely İstanbul, in a certain period range of time,
and its impact on the urban space.
Urbanization entered a new phase under mostly the pressure of neo-liberal policies
after the 1980s. In the demographic sphere Istanbul became more older, the fertility
rate decreased, the average household size decreased and the nuclear family replaced
traditional extended family; in the economic sphere while industry was still the
dominant sector service industry enlarged its share in economy; and in spatial sphere
the peripheral urban areas occupied mostly by low-status groups were opened to
middle and high-status groups residents like gated communities. Consequently, the
dynamics of the urbanization after the 1980s can no longer be explained through the
concepts and concerns of the preceding period such as gecekondu, informal sector,
migration and poverty.
Within this background, Turkish cities faced new problems such as new urban
poverty, segregation and suburbanization in addition to the inherited problem areas
of previous era such as gecekondu and informal sector in the post-1980 period. As
mentioned in Chapter 4, the transformation of Istanbul represents a unique and
particularly vivid example of the nature of Turkish urbanization story. The findings
178
derived from the analyses have proved that Istanbul has shown different profile than
the country; today’s problems, concerns and potential of the city of Istanbul with
reference to socio-economic, demographic and housing issues are likely to be faced
by Turkey at least one decade later. I believe that through an analysis of the mobility
behaviours of various households, the urbanization experience of Istanbul could be
rethought in a proper way.
One of the major limitations of this research is the lack of appropriate data that could
take into account residential moves within districts themselves. Whereas the intra-
districts residential moves take into account in this study; I speculate that RM rate of
Istanbul would most probably be higher than the current value. Furthermore, the RM
rates of RM of high-educated and in particular low-educated households would be
higher than current values. Furthermore, while the data includes intra-districts
moves, I assume that the major findings of this study are rectified. Another important
problem of the data stems from the fact that the boundaries of geographical units
change considerably between the censuses. Consequently, the researchers who study
Istanbul have to be so careful while comparing the periods and generalizing the
assumptions through Istanbul (Işık and Pınarcıoğlu, 2009). Another limitation of
studying RM in Istanbul is linked with the physical geography of Istanbul:
Bosphorus is a natural boundary between Anatolia side and European side, and the
golden horn also creates another boundary at the southern end of the Bosphorus. In a
sense, the city acts like the combination of three separated zones: Anatolia, Europe
and Historical core. In this respect, this physical nature of the city probably affects
the RM of households in Istanbul. Nevertheless, the data do not allow calculating the
effects of this physical geography of the city. For example, while examining the
distance preferences of RM, the effects of Bosphorus on distance of mobility flows
cannot be calculated.

179
Within the backdrop, one of the major findings of the thesis is that young, well-
educated and couple households were more mobile than elder, less-educated and
single parent households both in 1990 and in 2000. Nevertheless, whereas the former
has become more mobile from 1990 to 2000; the latter has become more stable in the
same period. As indicated in Chapter 4, the former ones indirectly represents high-
status groups or wealthy, whereas the latter indirectly represents low-status groups or
poor in the post-1980 period.
Another finding is that the vast majority of moves have been towards the outskirts of
the city in both 1990 and 2000. This finding indicates the picture of suburbanization
in the city between 1980 and 2000. In simplistic terms, there is a tendency to move
from old residential areas to the new developed residential areas mostly located in
the outskirts of Istanbul. As known, by the opening Bosphorus and Fatih Sultan
Mehmet Bridges with peripheral highways reinforce the suburbanization process in
the city; and the finding above, in a way, reflect the results of these developments.
Moreover, another important finding of this thesis is that there is a tendency towards
new residential areas in the city. The composition of the housing stock is one of the
most important predictors of variation in mobility between districts. The analysis
shows that there is a negative relationship between RM and the housing age, of
districts. This means that the availability of new housing stock in these areas has an
increase effect on RM. In 2000, districts with a large percentage of new buildings
show the highest in-comers index such as Büyükçekmece, Maltepe.
The other finding of this study is that high-status groups diffused from inner-city and
tend to move towards the urban peripheral areas both in 1990 and in 2000. Until the
1980s, urban fringe has been preferred mostly by immigrants, in the past-1980
period, middle and high-status groups also preferred to live in these areas. This
means that in the post-1980 period, the outskirts of the city were characterized as

180
bipolar neighbourhood. Mostly, the villa style settlement located far from the city
center and isolated from the other parts of the city was preferred by these groups. In
majority, these villa sites or ‘gated communities’ were located in the forests whose
accessibility to the city is easy via the provision of D-100 and TEM. Especially after
1990, high-status households have mostly preferred to move to new suburban areas
mostly developed after the 1990s such as Büyükçekmece on the European side and
Kadıköy on the Anatolian side of the city. As mentioned in chapter 6, this situation is
closely linked with the characteristics of housing stock. In this sense, it is right to say
that the residential mobility of high-status groups were dominated by mostly housing
quality and housing type concerns in the post-1990 period.
Moreover, another important finding of the study is that high-status groups move
farther than low-status groups in the 1990s and in the 2000. This means that
“proximity” is not as a significant criteria for high-status movers as it is to low-status
movers in Istanbul. This indirectly implies that the distance between workplace and
home are still important for low-status movers in their choice of residents, yet, for
high-status movers the distance between workplace and residence does not seem to
be important in such a decision. Here, it is clear that “proximity” is an important
trigger of mobility of low-status movers in Istanbul. From the social capital theory
point of view, high RM rate reduces social network and weakened social ties in a
neighbourhood. In this respect, households can derive financial and/or emotional
support from their social networks, and once they move to another neighbourhood,
this kind of social capital may be lost. In this sense, the low-mobility rate and short-
distance moves of the poor could also be seen as a survival mechanism or a
mechanism in order to combat poverty in Istanbul until the 2000s.
The other finding of this thesis is that low-educated households are stuck on one-side
of the city. RM rate of low-educated households significantly decreased from 11% in
1990 to 8.3% in 2000. In this period, as indicated in chapter 6, the number of
181
mobility patterns of low-educated movers decreased and the range of these patterns
also declined by the year 2000. As known, in this study, it is accepted that
households can move if they found appropriate housing units. In other words, the
availability of housing stock for differentiated demands of households is a key
mechanism of RM in Istanbul. In this respect, it is appropriate to say that one of the
reasons behind this significant increase on RM of low-educated households is the
lack of available housing units that supply their changing demands. In a sense, this
profile represents the decrease of interaction between low-status groups and urban
space in this period.
Another major finding of the study is that the vast majority of the moves are between
districts having similar status groups. In other words, high-status group moves
between mostly districts with high-development score, vice versa. All these findings
indicate that in some degree RM causes homogenization as well as polarization in the
city. However, the findings indicate that whereas the destinations of high-status and
low-status groups were significantly different in 1990, in 2000 high-status and low-
status groups mostly moved towards the districts with bipolar neighbourhoods in
outskirts. Considering the mutual relationship between RM and polarization
phenomena it is right to state that the polarization level between social status groups
has increased between 1990 and 2000.
In compatible with the finding above, this thesis also confirms that both high-
educated and low-educated households tend to live with households have similar
profile. However, for high-educated migrants, it does not matter. This means that
high-educated migrants tend to move either districts with higher development or
lower development. This can be interpreted like that bearing in mind that mobility is
a function of housing, these findings are also interpreted as the evidence of being
distinctive movement patterns of households with and without information on
housing market characteristics of the city. However, at the aggregate level these
182
tendencies represent the segmentation patterns in the city. In this respect, it can be
said that while RM relatively increase the segmentation level and make them more
visible, apart from Istanbul’s migrants in the period between 1995 and 2000.
RM is one of the major force shaping the the social geography of Istanbul. The
finding of this study is that RM changes the population composition of districts. The
findings indicate that while in-comers (movers) are responsible for the increase on
the development level of higher development districts, immigrants (migrants) are
responsible for the increase on the development level of lower development districts
of Istanbul in 2000. This means that in-comers of higher development districts have
similar or higher socio-economic status compare to the immobiles of those districts.
This interpretation is also true for the relationship between migrants and lower
development districts.
I speculate that these tendencies become more visible in the post-2000s. In the post-
2000 period, both urban periphery and historical core became the targets of urban
rent and transformed by big scale local, international and global capital owners and
public institutions. In a similar vein, with assistance of HDA, global capital owners
developed to new partnerships for when development in this era. Within this
backdrop, this tendency collapsed one of the important as well as a unique
integration way of integration of low status groups’ into urban society (Buğra, 2008).
Apart from the developed world’s metropolitan cities, in Istanbul, the strategy of real
estate market investments is depended on the leading role of the nation state rather
than local government. HDA was founded in 1984, nevertheless, its power is
strengthened and it became the main actor in housing industry in Turkey by the first
half of the 2000s. The former chair of HDA and the current Minister of Environment
and Urban Planning Bayraktar (2006, 2007) stated that regarding the changed scope
and powers of HDA, it is oriented to construct not only housing units for middle and

183
low-income people, but also luxury housing and associated up-market consumer
services for the upper-middle and upper classes such as Tramptower, IstHANbul,
Saphire and etc.
Istanbul’s housing stock responded to the changing housing demands and
preferences of the households faster than rest of Turkey. For instance, as a reflection
of the increasing number of elderly people and the decline in the household size, the
small size dwelling became the most favourable in the housing market; the share of
the 50-74 sq m dwellings in overall occupancy for Istanbul increased from 6% in the
period 2000-2005 to 11% between 2006 and 2009. In a same manner, the share of
150 and more sq m dwellings in overall occupancy permits for Istanbul decreased
from 30% to 18% respectively over the same periods. Within a similar perspective,
the two room-houses segment (one room and one lounge) has shown an increase in
Istanbul. In addition, partly as a consequence of the increasing number of gated
communities and HDA prestige projects in the outskirts of Istanbul, by the second
half of the 2000s, for the first time the seven and more-room dwellings took a
significant value in overall occupancy permits with 12% for Istanbul in the period
covered between 2006 and 2009.
In the post-2000 period, the main tool for urban restructuring the city is urban
transformation projects which are micro scale projects but also arranging the macro
scale relations. In this scope, urban transformation projects in prestigious areas of the
urban space are transferred in the best interests of particular urban social groups;
mostly for wealthy in this period. Gecekondu areas and old city centres will be
emptied from its users and turned into prestige residential areas for an upper-class.
An unfamiliar period has started on gecekondu areas in respect of former years. The
large-scale developments directly fortify the capitalist property rights on urban
periphery. This is the end of one of the important integration ways of low-status
groups into urban society.
184
These interventions not only changed Istanbul’s economic and urban structure but
also led to an increase in socio-economic inequalities and segregation. In this
manner, the contradiction among urban social groups has significantly increased, and
an unequal spatial distribution has become more visible, and the likelihood of the
meeting on the same urban space with different classes is decreasing in the urban
space in the post-2000 period.
Prime Minister Recep Tayyip Erdoğan frequently uses “tumour” and “elements that
contort the city” with reference to the gecekondu (Erdem, 2006). Thus, as the issue is
not discussed with reference to the dynamics resulting in the urban poverty or
segregation on such a large scale and limited only to the appeared consequences of
the situation for the other parts the society, the solutions suggested do not aim to
decrease the economic and social inequalities in the urban area but are limited to the
elimination of appearances of urban poverty.
All of the gecekondu areas are determined as urban transformation areas in Istanbul.
Recep Tayyip Erdogan, Prime Minister of Turkey, stated in his opening speech in
General Housing Assembly organized by HDA in 2004 that gecekondus are
“tumours” of the city of Istanbul and have to be got rid of. In a parallel vein,
Bayraktar (former head of HDA, 2002-2011) announced new declarations one after
another. Bayraktar, the first minister of Environment and Urban Planning of Turkey
said that “…urban transformation is the second biggest issue in Turkey after
unemployment”… and “…Gecekondu areas are the regions where all negative
things, mafia organizations and unlawful developments can flourish. We have to get
rid of gecekondus for the sake of our children’s future…” (DoğanNewsAgency,
2010), and “…urban transformation is one of the important problems in Turkey…,
we cannot restrict the migration to Istanbul, and nevertheless, we should find a way
to keep poor people from the city of Istanbul…” (Bayraktar, 2006)

185
Behind this point of view, the perception is that Istanbul is a global city; it is the
centre of finance and tourism. According to them, city is an uncanny space that has
to be sterilized and have to be protected from insecurity. And within this
imagination, Istanbul is just composed of wealthy; in other words, there is no place
for the poor in the city. Within this scope the main tool of HDA that used for
restructuring the city irreversible way “urban transformation projects” acts like a
kind of social and spatial exclusion process in which the residents of the gecekondus
are forced to leave their houses and to leave HDA’s low-income residential areas in
the outskirts of the city. This means that urban transformation projects are not only
urban transformation projects, but also they are social exclusion projects. In this
respect, the spatial representation of social exclusion process is based on the
equilibrium between income distribution and differentiated housing stock. And, RM
is a process that perfectly aimed to gain equilibrium of those two concerns.
In the light of the preceding discussions, I argue that it is possible to depict three
tendencies in RM in Istanbul in the post-2000 period. As mentioned previously, there
are differences among different social groups in terms of mobility level and
movement patterns. Intervention on socio-spatial setting of Istanbul such as urban
transformation in old gecekondu areas directly increases the housing problem of
urban poor in the post-2000s. In addition to these transformations, the role of family
on the survival mechanism of poor regarding finding housing as well as jobs in the
city has declined. In this scope, while poor were less mobile in the period between
1990 and 2000, I assume that their RM rate decreases in the post-2000 period and
they mostly move towards HDA’s mass housing projects in the urban periphery. This
propensity also indicates the poor’s lock-in situation in the city.
In the former period, whereas middle-income groups unevenly distributed among the
city, they tend to move towards semi-luxury and secured housing units in urban
periphery in the post-2000 period. Large-scale builders construct residential units for
186
middle-income groups at the peripheral urban areas and this tendency gained speed
after the second half of 2000s. For instance, in the former period the direction of
suburbanization was towards northern part of the city; however, with the huge
construction activities of HDA in the post-2000 period this occurred throughout east-
west direction of the city.
The third tendency is that in the post 2000 period wealthy groups become more
mobile than those in previous periods. This is closely interlinked with the weighted
role of those groups in the social and spatial structure of the city as well as the
response of housing industry in this period. They mostly demand high-secure
residential areas and so they mostly tend to live in new constructed gated
communities in the urban periphery. Nevertheless, they also tend to turn back to live
in the gentrified neighbourhood in the historical core of the city. This means that
restructuring of Istanbul mainly aims to satisfy the demands and needs of wealthy
groups which are also in compatible with the demands and interventions of neo-
liberal urbanism.
In closing, I note some warnings to my work and suggestions for future research. My
thesis does not result in any advice to planners or practitioners. It is an academic
thesis and contains empirical conclusions. In this respect, the findings of this thesis
should be seen as contributions to the existing research on RM in Turkey. As known,
this thesis tries to draw the contours of the socio-spatial changes in the city of
Istanbul through RM process of households in the period between 1990 and 2000. In
other words, it paves the way to reveal the main dynamics behind such significant
shifts in urbanization dynamics of Turkey through unique way. This thesis raises as
many questions as it answers. In the light of the findings of my research, it is
appropriate to assume that in the post-2000 period RM increases residential
polarization level in Istanbul. I think, the interrelation between RM and residential
segregation deserves further investigations on the possible consequences of

187
restructuring process of Istanbul to reveal the future of the city.
Consequently, RM matters…

188
REFERENCES
Adriaans, C., 2007. Measuring residential satisfaction: a residential environmental
satisfaction scale (RESS). Housing Built Environment, Volume 22, pp. 287-304.
Alkay, E., 2011. In Depth Analysis of the Home to Work Travel Pattern in the
Istanbul Metropolitan Area. Vienna, ERSA conference papers ersa11p371, European
Regional Science Association..
Anon.,2010. TurkishLifeNews. [Online]
Availableat:http://www.turkishlifenews.com/index.php?option=com_contentandview
=articleandid1302:turkeys-employment-figures-on-rise-while-eus-unemployment-
rate-climbs-in-q2andcatid=90:english-news[Accessed 15 February 2011].
Aydemir, D., 1984. Intraurban residential mobility in Turkey (Effects of intraurban
relocations on the efficiency of housing stock use).. Ankara: Unpublished Master
Thesis, METU.
Bailey, N. and Livingston, M., 2007. Population Turnover and Area Deprivation.
Bristol: The Policy Press.
Baycan-Levent, T. and Gülümser, A. A., 2007. Gated Communities in Istanbul: The
New Walls of the City. [Online] Available at:
http://www.susdiv.org/uploadfiles/ed2007-051.pdf[Accessed 1 November 2009].
Bayraktar, E., 2006. Gecekondu ve Kentsel Yenileme. Ankara: Ekonomik
Araştırmalar Merkezi.
Bayraktar, E., 2007. Bir İnsanlık Hakkı Konut. İstanbul: Boyut Yayın Grubu.
Behar, C. et al., 1999. Türkiye'nin Fırsat Penceresi Demografik Dönüşüm ve
İzdüşümleri, İstanbul: Lebin Yalkın Yayımları ve Basım İşleri A.Ş..
Bloom, D. E. and Williamson, J. G., 1998. Demographic Transitions and Economic
Miracles in Emerging Asia. The World Economic Review, 12(3), pp. 419-455.

189
Bolt, G. and Van Kempen, H., 2003. Escaping poverty neighbourhoods in the
Netherlands. Housing, Theory and Society, 20(4), pp. 209-222.
Boyle, P., 1993. Modelling the Relationship Between Tenure and Migration in
England and Wales. Transactions of the Institute of British Geographers , Volume
18, pp. 359-376.
Bozdoğan, S., 2002. Modernizm ve Ulusun İnşaası. İstanbul: Metis Yayınları.
Böheim, R. and Taylor, M., 1999. Residential mobility, Housing Tenure and the
Labor Market in Britain, s.l.: working paper.
Brown, H. J., 1975. Changes in workplace and residential locations. Journal of
American Institute of Planners, Volume 41, pp. 3-39..
Brown, L. and Moore, E., 1970. The intra-urban migration process: a perspective.
Geografisca Annalar, Series B, Human Geography, 52(1), pp. 1-13.
Bruch, E. and Mare, R., 2010. Methodological Issues in the Analysis of Residential
Preferences and Residential Mobility, Los Angeles:
http://papers.ccpr.ucla.edu/papers/PWP-CCPR-2010-044/PWP-CCPR-2010-044.pdf.
Brummel, A. C., 1979. A Model of Intraurban Mobility. Economic Geography,
55(4), pp. 338-352.
Buck, N., 2001. Identifying Neighbourhood Effects on Social Exclusion. Urban
Studies, 38(12), p. 2251–227.
Buğra, A., 2008. Kapitalizm, Yoksulluk ve Türkiye'de Sosyal Politika. 1 dü. İstanbul :
İletişim Yayınları .
Cadwallader, M., 1992. Migration and Residential Mobility: Macro and Micro
Approaches. Wisconsin: The University of Wisconsin Press.
Cadwallader, M., 1982. Urban Residential Mobility: A Simultaneous Equations
190
Approach. Transactions of the Institute of British Geographers, New Series, 7(4), pp.
458-473.
Cengiz, H., 1995. İstanbul’un Çağdaş Metropoliten Kent Merkezi Oluşumu,
Büyükdere Caddesi Aksı. İstanbul: YTÜ.
Clark, W., 1982. Recent research on migration and mobility: A review and
interpretation. Progress in Planning, Volume 18, pp. 1-56.
Clark, W., 1991. Residential Preferences and Neighbourhood Racial Segregation: A
Test of the Schelling Segregation Model. Demography, 28(1), pp. 1-19.
Clark, W., 1992. Residential Preferences and Residential Choices in a Multiethnic
Context. Demography, 29(3), pp. 451-466.
Clark, W., 2005. Intervening in the residential mobility process: Neighborhood
outcomes for low-income populations. Proceedings of the National Academy of
Sciences of the United States of America, Volume 43, pp. 15307-15312.
Clark, W., 2007. Race, Class and Place Evaluating Mobility Outcomes for African
Americans. Urban Affairs Review, 42(3), pp. 295-314.
Clark, W., 2009. Changing Residential Preferences across Income, Education and
Age Findings from the Multi-city Study of Urban Inequality. Urban Affairs Review,
44(3), pp. 334-355.
Clark, W. A., Duerloo, M. C. and Dieleman, F. M., 1984. Housing Consumption and
Residential Mobility. Annals of the Association of American Geographers, 74(1), pp.
29-43.
Clark, W. A., Duerloo, M. C. and Dieleman, F. M., 2003. Housing Careers in the
United States 1968-93: Modelling the Sequencing of Housing States. Urban Studies,
40(1), pp. 143-160.
Clark, W. A. and Huang, Y., 2003. The Life Course and Residential Mobility in
British Housing Markets. Environment and Planning A, Volume 35, pp. 323-339.

191
Clark, W. A. and Onaka, J. L., 1983. Life-cycle and Housing Adjustment as
Explanations of Residential Mobility. Urban Studies, Volume 20, pp. 47-57.
Clark, W. A. V., 1991. Residential Preferences and Neighbourhood Racial
Segregation: A Test of the Schelling Segregation Model. Demography, Volume 28,
pp. 1-19.
Clark, W. A. V., Deurloo, M. C. and Dieleman, F. M., 1994. Tenure changes in the
context of micro level family and macro level economic shifts. Urban Studies, 31(1),
p. 137–154.
Clark, W., Duerloo, M. and Dieleman, F., 2006. Residential Mobility and
Neighbourhood Outcomes. Housing Studies, 21(3), pp. 323-342.
Clark, W. and Huang, Y., 2004. “Linking Migration and Mobility: Individual and
Contextual Effects in British Housing Markets. Regional Studies, 38(6), pp. 617-628.
Clark, W. and Onaka, J., 1983. Life cycle and housing adjustment as explanations of
residential mobility. Urban Studies, Volume. 20, pp. 47-57.
Clark, W. and Withers, S., 2007. Family migration and mobility sequences in the
United States: Spatial mobility in the context of the life course. Demographic
Research, Volume 17, pp. 591-622.
Cohen, M. G., 1987. Free Trade and the Future of Women's Work: Manufacturing
and Service Industries. Toronto: Garamond Press.
Courgeau, D., 1985. Interaction between spatial mobility, family and career life-
cycle: A French Survey. E u r o p e a n Sociological Review, 2(1), pp. 139-162.
Crowder, K., 2000. The Racial Context of White Mobility: An Individual-level
Assessment of the White Flight Hypothesis. Social Science Research, Volume 29,
pp. 223-257.
Crowder, K., South, S. J. and Chavez, E., 2006. Wealth, Race, and Inter-
Neighborhood Migration. American Sociological Review, 71(1), pp. 72-94.
192
Çekiç, T. and Ferhani, G., 2004. İstanbul Metropoliten Kent Çeperindeki Yeni
Kullanıcılar: Lüks Konut Alanları. Kent Gündemi 6, Volume 6, pp. 99-106..
Danielson, M. N. and Keleş, R., 1985. The Politics of Rapid Urbanization:
Government and Growth in Modern Turkey. New York: Holmes and Meier.
Dieleman, F., Clark, W. and Duerloo, M. C., 2000. The Geography of Residential
Turnover in Twenty-seven Large US Metropolitan Housing Markets 1985-95. Urban
Studies, 37(2), pp. 223-245.
Dieleman, F. and Everares, P., 1994. From Renting to Owning: Life Course and
Housing Market Circumstances. Housing Studies, 9(1), pp. 11-26.
Dieleman, F. M., 2001. Modelling Residential Mobility: A review of Recent Trends
in Research. Journal of Housing and the Built Environment, Volume 16, pp. 249-
265.
DoğanNewsAgency, 2010. HurriyetDailyNews. [Online]
Available at:http://www.hurriyetdailynews.com/default.aspx?pageid=438andn=state-
body-wages-war-against-shantytowns-2010-12-05[Accessed 1 6 2010].
Doorn, P. K. and Van Rietbergen, A., 1990. Lifetime Mobility: Interrelationships of
Labour Mobility, Residential Mobility and Household Cycle. Canadian
Geographers, Volume 34, pp. 33-48.
Dökmeci, V. and Berköz, L.1994. Metropoliten Bölgelerde Konut İhtiyacı ve
Niteliğinin Belirlenmesi,,, Taşkışla,: İTÜ Mimarlık Fakültesi, Şehir ve Bölge
Planlaması Bölümü Seminerleri.
Dökmeci, V. and Berköz, L., 1994. Transformation of Istanbul from a Monocentric
to a Polycentric City. European Planning Studies, Volume 2, p. 193–205.
Ercan, F., 1996. Kriz ve Yeniden Yapilanma Surecinde Dunya Kentleri ve
Uluslararasi. Toplum ve Bilim, Volume 71, pp. 61-95.
Erdem, S., 2006. 40 Gün 40 Gece İstanbul. Radikal, 13 04.
193
Erder, S., 1997. Kentsel Gerilim: Enformel İlişki Ağları Alan Araştırması. İstanbul:
um:ag Yayınları.
Erder, S., 2006. İstanbul'a Bir Kent Kondu: Ümraniye. İstanbul: İletişim Yayınları.
Erginli, B. E. and Baycan, T., 2011. Analysis of Intra-Metropolitan Mobility in
Marmara Region. Barcelona, 51st Congress of European Regional Science
Association (ERSA).
Erkip, F., 2000. Viewpoint: Global Transformations versus Local Dynamics in
Istanbul, Planning in a Fragmented Metropolis. Cities, 17(5), pp. 371-377.
Erman, T., 1997. Squatter (gecekondu) Housing versus Apartment Housing: Turkish
Rural to-Urban Migrant Residents’ Perspectives. Habitat International , 28(1), pp.
91-106.
Eurostat, 2009. Employment Rate. [Online] Available at:
http://epp.eurostat.ec.europa.eu/tgm/table.do?tab=tableandlanguage=enandpcode=tsi
em010andtableSelection=1andfootnotes=yesandlabeling=labelsandplugin=1[Accesse
d 14 September 2010].
Feijten, P. and van Ham, M., 2009. Neighbourhood Change... Reason to Leave?.
Urban Studies, 46(10), p. 2103–2122.
Ferreira, F., Gourko, J. and Tracy, J., 2008. Housing Busts and Household Mobility,
New York: Federal Reserve Bank of New York Staff Reports No 350.
Fredland, D. R., 1974. Residential Mobility and home purchase: A longitudinal
Perspective on the Family Life Cycle and the Housing Market. Lexington: Lexington
Books.
Galster, G. and Killen, S., 1995. The geography of metropolitan opportunity: A
reconnaissance and conceptual framework. Housing Policy Debate, Cilt 6, pp. 7-43.
Galster, G. and Killen, S., 1995. The geography of metropolitan opportunity: A
reconnaissance and conceptual framework. Housing Policy Debate, Volume 6, pp. 7-

194
43.
Geist , C. and McManus, P. A., 2008. Geographical Mobility over the Life-course:
Motivations and Implications. Population Space Place, Volume 14, pp. 283-303.
Geniş, S., 2007. Producing Elite Localities: The Rise of Gated Communities in
Istanbul. Urban Studies, Volume 44, pp. 771-798.
Golledge, R. G. and Stimson, R. J., 1997. Spatial Behaviour: A Geographic
Perspective. New York: The Guilford Press.
Golledge, R. G., 1980. A Behavioral View of Mobility and Migration Research. The
Professional Geographer, Volume 32, pp. 14-21.
Graves, P. and Linneman, P., 1979. Munich Personal RePEc Archive. [Online]
Available at: http://mpra.ub.uni-muenchen.de/19920/1/MPRA_paper_19920.pdf
[Accessed 4 October 2010].
Güvenç, M., 1998. Beş Büyükşehirde Statü-Gelir Temelinde Mekansal Farklılaşma:
İlişkisel Çözümlemeler. In: Y. Sey, ed. 75 Yılda Değişen Kent ve Mimarlık. İstanbul:
Tarih Vakfı Yayınları, pp. 115-138.
Güvenç, M., 2004. 1990-2000 Döneminde İstanbul'un İstihdam Profilinde Dönüşüm.
İstanbul, Volume 50, pp. 43-46.
Güvenç, M., 2004. İstanbul'u Haritalamak 1990 Sayımından İstanbul Manzaraları.
İstanbul, Volume 34, pp. 35-40.
Güvenç, M. and Işık, O., 1996. İstanbul'u Okumak: Statü-Konut Mülkiyeti
Farklılaşmasına İlişkin Bir Çözümleme Denemesi. Toplum ve Bilim, Volume 71, pp.
6-60.
Ham, M. v. and Clark, W., 2009. Neighbourhood Mobility Context: Household
Moves and Changing Neighbourhoods in the Netherlands. Environment and
Planning A, 41(6), p. 1442 – 1459.

195
Ham, M. v. and Feijen, P., 2008. Who wants to leave the neighbourhood? The effect
of being different from the neighbourhood population on wishes to move.
Environment and Planning A, Volume 40, p. 1151–1170.
Hanushek, E. and Quigley, J., 1978. An explicit model of intra-metropolitan
mobility. Land Economics, 54(4), pp. 411-429.
Harris, D., 2009. "Property Values Drop when Blacks Move In, Because..." Racial
and Socioeconomic Determinants of Neighborhood Desirability. American
Sociological Review, Volume 64, pp. 461-479.
Hayward, L., 2004. Mid-life patterns and the residential mobility of older men.
Canadian Journal on Aging-Revue Canadienne Du Vieillissement, Volume 23, pp.
73-89.
HDA, 2011. Faaliyet Raporu 2003-2011. [Online]
Availableat:http://www.toki.gov.tr/TR/Genel/BelgeGoster.aspx?F6E10F8892433CF
FAAF6AA849816B2EFDF36587C4B003136[Accessed 13 October 2011].
HDA, 2012. Faaliyet Özeti. [Online] Available at: http://www.toki.gov.tr/[Accessed
13 October 2011].
Huang, Y. and Clark, W., 2002. Housing Tenure Choice in Transitional Urban
China: A Multilevel Analysis. Urban Studies, 39(1), pp. 7-32.
Huff, J. O. and Clark, W. A. V., 1978. Cumulative Stress and Cumulative Inertia: A
Behavioral Model of the Decision to Move. Environment and Planning A, 10(10),
pp. 1101-1119.
Hui, E., 2005. Residential mobility of Chinese immigrants: An analysis of housing
conditions and tenure structure. Journal of Housing and the Built Environment,
Volume 20, p. 379–39.
Hui, E. C. and Yu, K. H., 2009. Residential mobility in an era of economic
transformations and population reformations: A case study of Hong Kong. Habitat
International, Volume 33, pp. 445-453.

196
İBB, 1995. 1/50.000 Ölçekli İstanbul Metropoliten Alan Alt Bölge Nazım Planı,,
İstanbu: İstanbul Şehir Planlama Müdürlüğü..
Ihlanfeldt, K. and Sjoquist, D., 1998. The spatial mismatch hypothesis: A review of
recent studies and their implications for welfare reform. Housing Policy Debate,
8(4), p. 849–889.
İMP, 2007. 1/25 000 ölçekli İstanbul Metropoliten Alan Araştırma Raporu, İstanbul:
İMP.
Ioannides, Y. M., 2002. Residential neighborhood effects. Regional Science and
Urban Economics, 32(2), pp. 145-165.
Işık , O. and Ataç, E., 2011. Yoksulluğa Dair: Bildiklerimiz, Az Bildiklerimiz,
Bilmediklerimiz. Birikim, Volume 268-269, pp. 66-85.
Işık , O. and Pınarcıoğlu, M., 2006. Geographies of a silent transition: A
geographically weighted regression approach to regional fertility differences in
Turkey. European Journal of Population, 22(4), pp. 399-421.
Işık, O., 1996. 1980'lerden Günümüze Türkiye'de Kent ve Kentleşme. In:
Cumhuriyet Dönemi Türkiye Ansiklopedisi, Yüzyıl Biterken Türkiye. İstanbul:
İletişim Yayınları, pp. 780-801.
Işık, O. and Pınarcıoğlu, M. M., 2003. Nöbetleşe Yoksulluk. İstanbul: İletişim
Yayınları.
Işık, O. and Pınarcıoğlu, M. M., 2010. Back to the Year When It all Started Local
Determinants of Party Preferences in 2002 Turkish Elections. METU JFA, 27(1), pp.
161-183.
Jones, C., Leishman, C. and Craig, W., 2004. Intra-Urban Migration and Housing
Submarkets: Theory and Evidence. Housing Studies, 19(2), pp. 269-283.
Jones, E., 1990. Metropolis: the World’s Great Cities. Oxford: Oxford University
Press.

197
Kan, K., 1999. Expected and Unexpected Residential Mobility. Journal of Urban
Economics, Volume 45, pp. 72-96.
Kan, K., 2007. Residential mobility and social capital. Journal of Urban Economics,
Volume 61, p. 436–457.
Kertzer, D. I., 1983. Generation as a Sociological Problem. Annual Review of
Sociology, Volume 9, pp. 125-149.
Keyder, Ç., 1992. İstanbul'u Nasıl Satmalı?. İstanbul, Volume 3.
Keyder, Ç., 1999a. The Setting. In: Ç. Keyder, ed. İstanbul between the Global and
Local. Boston Way, Lanham, Maryland: Rowman and Littlefield Publishers, pp. 3-
30.
Keyder, Ç. ,1999b. The Housing Market from Informal to Global. In: Ç. Keyder, ed.
Istanbul: Between the Global and the Local. Boston Way, Lanham, Maryland:
Rowman and Littlefield Publishers, pp. 143-160.
Keyder, Ç., 2005. Globalization and Social Exclusion in Istanbul. International
Journal of Urban and Regional Research, 29(1), pp. 124-134.
Keyder, Ç., 2009. Türkiye'de Devlet ve Sınıflar. İstanbul: İletişim Yayınları.
Keyder, Ç. and Öncü, A., 1993. Istanbul and the Concept of World Cities. İstanbul:
Window Publications.
Kipnis, B., 1985. Graph Analysis of Metropolitan Residential Mobility:
Methodology and Theoretical Implications. Urban Studies, Volume 22, pp. 179-185.
KİPTAŞ, 2000. About KİPTAŞ. [Online] Available at:
http://www.kiptas.com.tr/EN/KIPTAS/default.asp [Accessed 12 November 2010].
Kıray, M., 1998. Az Gelişmiş Ülkelerde Metropolleşme Süreçleri. In: Y. Sey, ed. 75
Yılda Değişen Kent ve Mimarlık. İstanbul: Tarih Vakfı Yayınları, pp. 107-114.
198
Knox, P. L. and McCarthy, L. M., 2005. Urbanization: An Introduction to Urban
Geography. 2 ed. Upper Saddle River, NJ: Prentice Hall.
Knox, P. and Pinch, S., 2000. Urban Social Geography: An Introduction. 4 ed.
Toronto: Prentice Hall.
Kocatürk, F. and Bölen, F., 2005. Kayseri’de konut alanı yer seçimi ve hanehalkı
hareketliliği. itüdergisi/a mimarlık, planlama, tasarım, 2(4), pp. 17-24.
Kok, J., 2007. Principles and Prospects of the Life Course Paradigm. Annales de
Démographic Historique, Volume 1, pp. 203-230.
Köroğlu, B. and Ercoşkun, Ö. Y., 2006. Urban Transformation: a Case Study on 7
Çukurambar, Ankara. G.U. Journal of Science, 19(3), pp. 173-183.
Kurtuluş, H., 2011. Gated Communities As A Representation of New Upper and
Middle Classes in Istanbul. İ.Ü. Siyasal Bilgiler Fakültesi Dergisi, Volume 44, pp.
49-65.
Kuyucu, T. and Ünsal, Ö., 2010. Urban Transformation' as State-led Property
Transfer: An Analysis of Two Cases of Urban Renewal in Istanbul. Urban Studies,
Volume 47, pp. 1479-1499.
Lee, B. A., Oropesa, R. S. and Kanan, J. W., 1994. Neighborhood context and
residential-mobility. Demography, 31(2), p. 249–270.
Lee, E., 1966. A Theory of Migration. Demography, Volume 3, pp. 47-57.
Lefebvre, H., 1991. The Production of Space. Madon, Oxford, Carlton: Blackwell
Publishing Ltd..
Leventhal , T. and Brooks-Gunn, J., 2000. The neighbourhoods they live in: Effects
of neighbourhood residence on child and adolescent outcomes. Psychological
Bulletin, 126(2), pp. 309-337.

199
Ley, D., 1983. A Social Geography of the City. New York: Harper and Row.
Li, P. and Tu, Y., 2011. Behaviors on Intra-urban Residential Mobility: A Review
and Implications to the Future Research, s.l.: IRES Working Paper Series.
Li, S., 2003. Housing Tenure And Residential Mobility In Urban China: A Study of
Commodity Housing Development in Beijing and Guangzhou. Urban Affairs
Review, Volume 38, pp. 510-534.
Li, S. and Sui, Y., 2001. Residential Mobility and Urban Restructuring under Market
Transition: A Study of Guangzhou, China. Professional Geographer, 53(2), pp. 219-
229.
Logan, J. and Alba, R., 1993. Locational Returns to Human Capital: Minority Access
to Suburban Community Resources. Demography, Volume 30, pp. 243-36.
Long, L., 1992. Changing Residence: Comparative Perspectives on its Relationship
to Age, Sex and Marital Status. Population Studies, 46(1), pp. 141-158.
Maloutas, T., 2004. Segregation and residential mobility. Socially entrapped social
mobility and. European Urban and Regional Studies,, Volume 11, pp. 3-24.
Manski, C. F., 1993. Identification of Endogenous Social Effects: The Reflection
Problem. The Review of Economic Studies, 60(3), pp. 531-542.
Moore, E., 1971. Comments on the use of ecological models in the study of
residential mobility in the city. Economic Geography, Volume 47, pp. 73-85.
Mulder, C., 1993. Migration Dynamics: A Life Course Approach. Amsterdam:
PDOD Publications.
Mulder, C. and Dieleman, F., 2002. Living arrangements and housing arrangements
Introduction to the special issue. Journal of Housing and the Built Environment,
Volume 17, p. 209–21.

200
Necatigil, B., 1947. Evler. [Art] (Varlık Yayınları).
Nordvik, V., 2001. Moving Costs and the Dynamics of. Urban Studies, 38(3), pp.
519-533.
Öncü, A., 1988. The politics of the urban land market in Turkey: 1950–1980.
International Journal of Urban and Regional Research,, 12(1), p. 38–63..
Özdemir, D., 2002. The Developments in the Central Business District of Istanbul in
the 1990s. [Online] Available at: http://www-sre.wu-
wien.ac.at/ersa/ersaconfs/ersa02/cd-rom/papers/439.pdf [Accessed 13 October 2009].
Özdemir, D., 2010. The Role of the Public Sector in the Provision of Housing Supply
in Turkey, 1950-2009. International Journal of Urban and Regional Research,
Volume 25, pp. 120-136.
Özüerken, Ş. A. and Kempen, R. V., 2002. Housing Careers of Minority Ethnic
Groups: Experiences, Explanations and Prospects. Housing Studies, 17(3), pp. 365-
379.
Palm, R., 1976. Real Estate Agents and Geographical Information. Geographical
Review, Volume 66, pp. 267-280.
Piantadosi, S., Byar, D. P. and Green, S. B., 1988. The Ecological Fallacy. American
Journal of Epidemiology, 127(5), p. 893–904.
Pınarcıoğlu, M. M. and Işık, O., 2009. Segregation in Istanbul: Patterns and
Processes. Tijdschrift voor Economische en Sociale Geografie, Volume 100, pp. 4-.
Quigley, J. M. and Wienberg, D. H., 1977. Intra-urban Residential Mobility: A
Review and Synthesis. International Regional Science Review, Volume 2, pp. 41-66.
Quillian, L. and Bruch, E., 2010. Race and Class in Neighborhood Mobility: A
Conditional Logit Model of Neighborhood Migration. Priceton, Extended Abstract of
Paper Proposed for Presentation at the Meetings of the Population Association of
America, April 2010.

201
Robin, N. L. and Oliver, M. B., 2009. The SAGE Handbook of Media Processes and
Effects. s.l.:SAGE.
Roseman, C., 1971. Migration as a spatial and temporal process. Annals of the
Association of American Geographers, 61(3), pp. 589-598.
Rossi, P., 1955. Why Families Move, A study in the social psychology of urban
residential mobility. New York: Free Press.
Sampson, R. J., Morenoff, J. and Gannon-Rowley, T., 2002. Assessing
Neighbourhood Effects: Social Processes and New Directions in Research. Annual
Review of Sociology, Volume 28, pp. 443-478.
Sassen, S., 1991. The Global City: New York, London, Tokyo. New Jersey: Princeton
University Press.
Schelling, T. C., 1969. Models of Segregation. American Economic Review, 59(2),
pp. 488-493.
Seko, M. and Sumita, K., 2007. Effects of government policies on residential
mobility in Japan: Income tax deduction system and the Rental Act. Journal of
Housing Economics, 16(2), pp. 167-188.
Simmons, J., 1968. Changing Residence in the City: A Review of Intra-urban
Mobility. Geographical Review, 58(4), pp. 622-651.
SIS, 1972. 1970 Census of Population Social and Economic Characteristics of
Population Province: Istanbul. Ankara: State Institute of Statistics Printing Division.
SIS, 1972b. 1970 Building Census. Ankara: State Institute of Statistics Publishing
Division.
SIS, 1983. 1980 Census of Population Social and Economic Characteristics of
Population Province: Istanbul. Ankara: State Institute of Statistics Printing Division

202
SIS, 1993. 1990 Census of Population Social and Economic Characteristics of
Population Province: Istanbul. Ankara: State Institute of Statistics Printing Division.
SIS, 1995. Türkiye Nüfusu 1923-1994 Demografi Yapısı ve Gelişimi. 2 ed. Ankara:
SIS.
SIS, 2001 . Building Census 2000. Ankara: State Institute of Statistics Printing
Division .
SIS, 2002. 2000 Census of Population Social and Economic Characteristics of
Population Province: Istanbul. Ankara: State Institute of Statistics Printing Division
.
SIS, 2003. 2000 Census of Population Turkey Social and Economic Characteristics
of Population. Ankara: State Institute of Statistics Printing Division .
SIS, 2004b. 2003 Household Labour Force Statistics. Ankara: State Institute of
Statistics Printing Division.
SIS, 2004. Building Construction Statistics 2003. Ankara: State Institute of Statistics
Printing Division.
Sönmez, M., 1996. İstanbul'un İki Yüzü 1980'den 2000'e Değişim. Ankara: Arkadaş
Yayınları.
Speare, A. J., Goldstein, S. and Frey, W., 1974. Residential Mobility, Migration and
Metropoliten Change. Cambridge: Masss Ballinger.
Stokols, D. and Shumaker, S., 1982. The Physiological Context of Residential
Mobility and Well-being. Journal of Social Issues, Volume 38, pp. 149-171.
Strassman, W., 2001. Residential Mobility: Contrasting Approaches in Europe and
the United States. Housing Studies, 16(1), pp. 7-20.
Şenyapılı, T., 1998. Cumhuriyet'in 75. Yılı Gecekondunun 50. Yılı. In: 75 Yılda

203
Değişen Kent ve Mimarlık. Istanbul: Türk Tarih Vakfı, pp. 301-317.
Şenyapılı, T., 2004. Charting the 'Voyage' of Squatter Housing in Urban Spatial
'Quadruped'. European Journal of Turkish Studies, Volume 1, p.
http://ejts.revues.org/index142.html.
Taub, R., Taylor, G. and Dunham, J., 1984. Paths of Neighborhood Change.
Chicago: University of Chicago Press.
Teixeira, C. and Murdie, R., 1997. The role of ethnic real estate agents in the
residential relocation process: A case study of Portuguese homebuyers in suburban
Toronto. Urban Geography, Volume 18, p. 497–520.
Tekeli, İ., 1994. The Development of the Istanbul Metropolitan Area: Urban
Administration and Planning. İstanbul: IULA-EMME.
Timur, T., 2004. Türkiye Nasıl Küreselleşti?,. İstanbul: İmge Kitabevi Yayınları.
Tsakloglou, P., 1990. Aspects of Poverty in Greece. Review of Income and Wealth,
36(4), pp. 381-402.
TURKSTAT, 2005. Building Permit Statistics 2002-2004. Ankara: Turkstat.
TURKSTAT, 2007. Building Permit Statistics 2006. Ankara: Turkish Statistical
Institute Printing Division.
TURKSTAT, 2008. Building Permit Statistics 2007. Ankara: Turkish Statistical
Institute Printing Division.
TURKSTAT, 2008. Household Consumption Expenditure by Type of Household for
Turkey. Ankara: Turkish Statistical Institute.
TURKSTAT, 2009a. 2008 Address Based Population Registration System Results.
Ankara: Turkish Statistical Institute Printing Division.

204
TURKSTAT, 2009b. 2008 Bölgesel İstatistikler TR 10 İstanbul. Ankara: Türkiye
İstatistik Kurumu Matbaası.
TURKSTAT, 2009. Building Permit Statistics 2008. Ankara: Turkish Statistical
Institute Printing Division.
TURKSTAT, 2010a. 2009 Bölgesel İstatistikler TR 10 Istanbul. Ankara: Türkiye
İstatistik Kurumu Matbaası.
TURKSTAT, 2010. Building Permit Statistics 2009. Ankara: Turkish Statistical
Institute Printing Division.
TURKSTAT, 2011. 2010 Household Labour Force Statistics. Ankara: Turkish
Statistical Institute Printing Division.
Türel, A., 1979. A study of housing and residential location in Ankara. PhD Thesis.
London: London School of Economics
Türel, A., 2002. Housing Provision in Istanbul: Dominance of Unauthorised House
building. Vienna, ENHR International Housing Research Conference "Housing
Cultures-Convergence and Diversity".
Türel, A. and Koç, H., 2007. Variation of Housing Production among Provinces in
Turkey. Rotterdam, ENHR International Housing Conference "Sustainable Urban
Areas".
Türkün, A. and Kurtuluş, H., 2005. Giriş. In: H. Kurtuluş, ed. İstanbul'da Kentsel
Ayrışma: Mekansal Dönüşümde Farklı Boyutlar. İstanbul: Bağlam Yayınları, pp. 9-
24.
Viola, A. and Laferre`re, A., 2011. Residential Mobility of the European Elderly.
CESifo Economic Studies, p. doi:10.1093/cesifo/ifr017.
Visvalingam, M., 1983. Area-based Social Indicators: Signed chi-square as an
Alternative to Ratios. Social Indicator Research, Volume 13, pp. 311-329.

205
Vlist, A., Cees Gorter, A., Nijkamp, P. and Rietveld, P., 2002. Residential Mobility
and Local Housing Market Differences. Environment and Planning A, Volume 35,
pp. 1147-1164.
Waldorf, B. S., 1990. Housing Policy Impacts on Ethnic Segregation Patterns:
Evidence from Dusseldorf, West Germany. Urban Studies, 27(5), pp. 637-652.
Waldorf, B. S., 1993. Segregation in Urban Space: A New Measurement Approach.
Urban Studies, 30(7), pp. 1151-1164.
Weeks, J., 2002. Population, an Introduction to Concepts and Issues. 8th Edition ed.
Belmont, USA: Wadsworth/Thomson Learning.
Wilson, W., 1985. Cycles of Deprivation and the Underclass Debate. Social Science
Review, Volume 59, p. 541–559.
Winstanley, A., Thorns, D. and Perkins, H., 2002. Moving house, creating home:
Exploring residential mobility. Housing Studies, 17(6), pp. 813-832.
Wu, F., 2007. The poverty of transition: from the industrial district to poverty
neighbourhood in the city of Nanjing, China. Urban Studies, 44(13), p. 2673–2694.
Wulff, M., Champion, A. and Lobo, M., 2010. Household Diversity and Migration in
Mid-life: Understanding Residential Mobility among 45–64 Year Olds in Melbourne,
Australia. Population Space Place, Volume 16, pp. 307-321.
Yalçıntan, M. and Erbaş, A., 2003. Impacts of “Gecekondu” on the Electoral.
International Labour and Working-Class History, Volume 64, pp. 91-111.
Yildiz, H. and Inalhan, G., 2007. Cultural and Spatial Dynamics of Istanbul: New
Housing Trends. Rotterdam, ENHR International Conference “Sustainable Urban
Areas".
Yüceşahin, M. M., 2009. Türkiye’nin demografik geçiş sürecine coğrafi bir
yaklaşım. Coğrafi Bilimler Dergisi, 7(1), pp. 1-25.

206
APPENDIX A
The selected RM researches and the methods, variables and the
findings of selected researches
Research Main argument Data source Method Main Findings
GEIST, C. and
MCMANUS, P.A.,
2008, “Geographical
Mobility over the life
Course: Motivations
and Implications”
Mobility decreases
with age in early
adulthood, and
continues to decline
slowly through the
later years.
The 1999-2005
March Annual
Social and
Economic
Supplement of the
Current Population
Survey
(Longitudinal
data)
Cross-
sectional and
Longitudinal
Weights,
Regression
analyses
Mobility trajectories
(age, education, etc.)
and motivations for
movers vary by
economic status and
family status.
SEKO, M., and
SUMITA, K, 2007,
Effects of
Government policies
on residential
mobility in Japan:
Income tax deduction
system and the Rental
Act
The effect of Japan
rent control system
on residential
mobility based on an
estimate of the
implicit subsidy
resulting from this
act.
Keiko Household
Panel Survey,
2004-2005-2006-
2007.
Hazard
Model, log-
normal and
log-logistic
regression
analyses.
Government policies
have a strong impact on
residential mobility.
SOMIK V. LALL,
AJAY SURI AND
UWE DEICHMANN,
2006, “Household
Savings and
Residential Mobility
in Informal
Settlements in
Bhopal, India”,
Urban Studies, Vol.
43, No. 7, 1025–1039
There is a direct
correlation between
the saving and RM.
The household-
level data set in
Bhopal, India.
Regression
analyses
In situations with
limited access to
institutional housing
finance in general, and
for slum-dwellers in
particular, the ability of
households to save
regularly significantly
improves their chances
for moving out of
slums.
W. A. V. CLARK, M.
C. DEURLOO, and
F. M. DIELEMAN,
1984, “Housing
Consumption and
Residential
The nature of
housing consumption
by tenure and life-
cycle characteristics
of households and the
impact of space
The Netherlands
household-level
data set
Stepwise logit
and
discriminant
models
The space
considerations are
central stimuli in the
mobility process and
that square meters per
person is the most
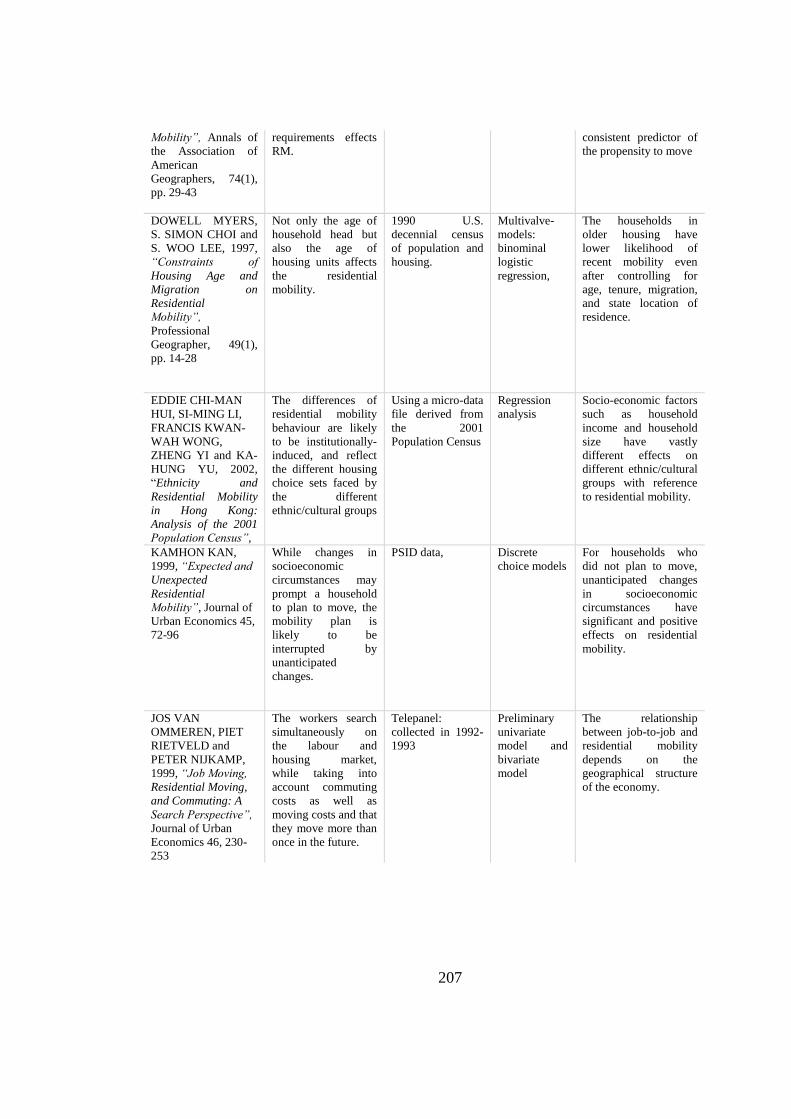
207
Mobility”, Annals of
the Association of
American
Geographers, 74(1),
pp. 29-43
requirements effects
RM.
consistent predictor of
the propensity to move
DOWELL MYERS,
S. SIMON CHOI and
S. WOO LEE, 1997,
“Constraints of
Housing Age and
Migration on
Residential
Mobility”,
Professional
Geographer, 49(1),
pp. 14-28
Not only the age of
household head but
also the age of
housing units affects
the residential
mobility.
1990 U.S.
decennial census
of population and
housing.
Multivalve-
models:
binominal
logistic
regression,
The households in
older housing have
lower likelihood of
recent mobility even
after controlling for
age, tenure, migration,
and state location of
residence.
EDDIE CHI-MAN
HUI, SI-MING LI,
FRANCIS KWAN-
WAH WONG,
ZHENG YI and KA-
HUNG YU, 2002,
“Ethnicity and
Residential Mobility
in Hong Kong:
Analysis of the 2001
Population Census”,
The differences of
residential mobility
behaviour are likely
to be institutionally-
induced, and reflect
the different housing
choice sets faced by
the different
ethnic/cultural groups
Using a micro-data
file derived from
the 2001
Population Census
Regression
analysis
Socio-economic factors
such as household
income and household
size have vastly
different effects on
different ethnic/cultural
groups with reference
to residential mobility.
KAMHON KAN,
1999, “Expected and
Unexpected
Residential
Mobility”, Journal of
Urban Economics 45,
72-96
While changes in
socioeconomic
circumstances may
prompt a household
to plan to move, the
mobility plan is
likely to be
interrupted by
unanticipated
changes.
PSID data, Discrete
choice models
For households who
did not plan to move,
unanticipated changes
in socioeconomic
circumstances have
significant and positive
effects on residential
mobility.
JOS VAN
OMMEREN, PIET
RIETVELD and
PETER NIJKAMP,
1999, “Job Moving,
Residential Moving,
and Commuting: A
Search Perspective”,
Journal of Urban
Economics 46, 230-
253
The workers search
simultaneously on
the labour and
housing market,
while taking into
account commuting
costs as well as
moving costs and that
they move more than
once in the future.
Telepanel:
collected in 1992-
1993
Preliminary
univariate
model and
bivariate
model
The relationship
between job-to-job and
residential mobility
depends on the
geographical structure
of the economy.

208
APPENDIX B
DISTANCE MATRIX

209
APPENDIX C
The Method used for highlighting the effects of Movers on socio-
economic Development Index
1. Calculation of
a. The Development Index by districts (DI). It reflects the existing
profile of population in districts.
b. The Development Index for Immobiles. It reflects only immobile
populations profile in the districts.
c. The Development Index for Immobiles plus Migrants. It reflects both
immobile and migrants profiles in districts.
2. Then,
a.
b.
c.
3. Finally, I calculate the percentage change of each scores. Express this
increase or decrease as a percentage of index scores.
a. Migrants and Movers %: This illustrates the percentage of the
contribution of both migrants and movers to development index score
of selected district.
b. Migrants %: This illustrates the percentage of the contribution of
migrants to the development index score of selected district.
c. Movers %: This illustrates the the percentage of the contribution of
movers to the development index score of selected district.

210
APPENDIX D
The hierarchical clustering of districts in terms of their distance
to each other

211
CURRICULUM VITAE
PERSONAL INFORMATION
Surname, Name: Kamacı, Ebru
Nationality: Turkish (TC)
Date and Place of Birth: 13 October 1978, Istanbul
Marital Status: Single
Phone: +90 312 2106295
Fax: +90 312 2106295
email: [email protected]
EDUCATION
Degree Institutions Year of Graduation
BS Yıldız Technical University 2003
High School Çapa Anatolian High School 1996
WORK EXPERIENCE
Year Place Enrolment
2003-2012 METU, Department of CRP Research Assistant
FOREIGN LANGUAGES
English
PUBLICATIONS
1. Örmecioğlu, H. T. and Kamacı, E. 2004. “Istanbul 1956 and Menderes
Operations”, Paper presented in 5th International Postgraduate Research Conference
in the Built and Human Environment.
2. Kamacı, E. and Örmecioğlu, H.T. 2005 “Koruma Amaçlı İmar Planlarının
Değerlendirilmesi: Antalya Kaleiçi Örneği”, Antalya İnşaat Mühendisleri Odası,
Antalya, Türkiye.
3. Kamacı, E. et al. 2006. “Kentsel Dönüşümün Temsiline İlişkin Bir Önerme”,

212
Mimarlar Odası Bülteni, Bülten 40/Mayıs-Haziran Ankara, Türkiye.
4. Kamacı, E., 2009. “Güneybatı Ankara Koridoru Gelişimi: Yenikent Bahçelievler
Yapı Kooperatifi” in Gecekondu, Dönüşüm, Kent, eds Kayasü, S., Işık, O., Uzun,
N., Kamacı, E., MF Publications, pp. 327-352 Ankara.
HOBBIES
Tango