> re: revised annual pdf files - s3. · pdf filelow $ 19.00 $ 26.60 $ 19.98 $ 25.90 $ 15.22...
TRANSCRIPT

ANNUAL REPORTS E A R S C A N A D A I N C .
2008Improving the lives of Canadians.
ENERGY STAR®: Over $600 million sold and Sears named ENERGY STAR Retailer of the Year
Personalized gift cards: Sears is the first major retailer to offer this customization
Sears National Kids Cancer Ride: Raised $1.1 million engaging Canadians across 7,000 km
Liz & Co.: Sears Canada launches exclusive designer-inspired affordable fashion
“Budget Relief Price Drop” program: Sears stretches customers’ budgets with exceptional value
Home Energy Efficiency: Sears offers innovative solutions including tankless water heaters

Table of ConTenTs
1 Financial Highlights/Common Share Market Infomation
2 Letter to Our Shareholders
5 Letter From Chief Financial Officer
6 Eleven Year Summary
7 Quarterly Summary
9 Management’s Discussion and Analysis
48 Management’s Responsibility for Financial Statements
49 Auditors’ Report
50 Consolidated Statements of Financial Position
51 Consolidated Statements of Earnings and Comprehensive Income/
Consolidated Statements of Retained Earnings
52 Consolidated Statements of Cash Flows
53 Notes to Consolidated Financial Statements
78 Directors and Officers
79 Corporate Information
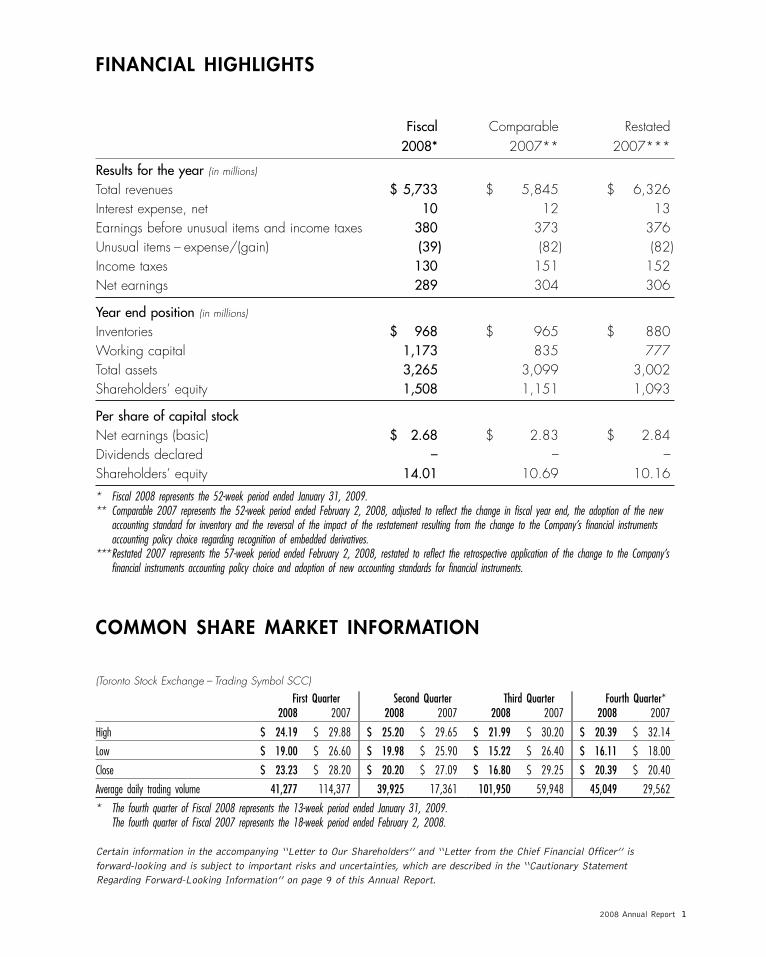
FINANCIAL HIGHLIGHTS
Fiscal Comparable Restated2008* 2007** 2007***
Results for the year (in millions)
Total revenues $ 5,733 $ 5,845 $ 6,326Interest expense, net 10 12 13Earnings before unusual items and income taxes 380 373 376Unusual items – expense/(gain) (39) (82) (82)Income taxes 130 151 152Net earnings 289 304 306
Year end position (in millions)
Inventories $ 968 $ 965 $ 880Working capital 1,173 835 777Total assets 3,265 3,099 3,002Shareholders’ equity 1,508 1,151 1,093
Per share of capital stockNet earnings (basic) $ 2.68 $ 2.83 $ 2.84Dividends declared – – –Shareholders’ equity 14.01 10.69 10.16
* Fiscal 2008 represents the 52-week period ended January 31, 2009.** Comparable 2007 represents the 52-week period ended February 2, 2008, adjusted to reflect the change in fiscal year end, the adoption of the new
accounting standard for inventory and the reversal of the impact of the restatement resulting from the change to the Company’s financial instrumentsaccounting policy choice regarding recognition of embedded derivatives.
***Restated 2007 represents the 57-week period ended February 2, 2008, restated to reflect the retrospective application of the change to the Company’sfinancial instruments accounting policy choice and adoption of new accounting standards for financial instruments.
COMMON SHARE MARKET INFORMATION
(Toronto Stock Exchange – Trading Symbol SCC)
First Quarter Second Quarter Third Quarter Fourth Quarter*2008 2007 2008 2007 2008 2007 2008 2007
High $ 24.19 $ 29.88 $ 25.20 $ 29.65 $ 21.99 $ 30.20 $ 20.39 $ 32.14
Low $ 19.00 $ 26.60 $ 19.98 $ 25.90 $ 15.22 $ 26.40 $ 16.11 $ 18.00
Close $ 23.23 $ 28.20 $ 20.20 $ 27.09 $ 16.80 $ 29.25 $ 20.39 $ 20.40
Average daily trading volume 41,277 114,377 39,925 17,361 101,950 59,948 45,049 29,562
* The fourth quarter of Fiscal 2008 represents the 13-week period ended January 31, 2009.The fourth quarter of Fiscal 2007 represents the 18-week period ended February 2, 2008.
Certain information in the accompanying ‘‘Letter to Our Shareholders’’ and ‘‘Letter from the Chief Financial Officer’’ isforward-looking and is subject to important risks and uncertainties, which are described in the ‘‘Cautionary StatementRegarding Forward-Looking Information’’ on page 9 of this Annual Report.
2008 Annual Report 1

LETTER TO OUR SHAREHOLDERSA Message from Dene Rogers, President and Chief Executive Officer
Improving the Lives of Canadians
Sears Canada delivered solid results in 2008 despite a deteriorating economy in which the consumer confidence index fell to its lowest level in 27 years.
Operating EBITDA (Earnings Before Interest, Taxes, Depreciation and Amortization) before unusual items was $517 million in fiscal 2008 and $521.6 million in 2007. Same store sales in 2008 versus 2007 decreased 1.6% and gross margin rate increased 24 basis points. Earnings Per Share (EPS), excluding unusual items, increased 8.1% from $2.23 to $2.41.
2008 2007 2006 2005
Total revenues (MM) $5,733.2 $5,844.9 $5,943.1 $5,920.0
Same Store Sales -1.6% -1.1% -0.1% -3.6%
Gross margin 38.97% 38.73% 37.67% 36.78%
Operating EBITDA (MM) $517.0 $521.6 $472.6 $340.6
Operating EPS $2.41 $2.23 $1.62 $0.77
Published EPS $2.68 $2.83 $1.47 $0.84
Note 1 - Fiscal years presented are comparable 12-month periods ending the Saturday closest to January 31st.
Note 2 - Operating EBITDA & EPS exclude unusual items.Note 3 - Published EPS includes unusual items. Note 4 - 2005 fiscal year excludes the sale of Credit and Financial
Services Operations and the payroll savings of the October, 2005 staffing reductions.
The credit for these results goes to our leaders and their teams who, through their abilities and skill, worked hard to deliver the products, services and solutions which were positively received by customers.
At Sears, we are committed to fulfilling our Vision of “improving the lives or our customers” and in 2008 this Vision was advanced in new and value-added ways. The following are a few examples:
Budget Relief Price Drop:
In response to the deteriorating economy, Sears launched a new program called “Budget Relief Price Drop” which gave customers exceptional value and stretched their budgets. This program proved popular with customers as every week prices were dropped on key items ranging from plasma and LCD televisions, to mattresses, appliances, brand name denim, outerwear, watches and gold jewelry. A poll conducted in January, 2009 showed that more Canadians perceived Sears as having reduced its prices than eight of its major competitors.
Sears.ca:
Sales on sears.ca, the Company’s online shopping site, grew more than 18% in 2008 and the number of visitors increased to 63 million. In addition, sears.ca reached more than 600,000 subscribers in its email marketing program, making it one of the largest retail email databases in Canada. This email program was a key reason for the recognition sears.ca received from the industry through two awards:
• The Retail Council of Canada 2008 Excellence in Retailing Award for Best Online Retailer
• The Canadian Marketing Association Silver award for the email newsletter, “What’s In Store for You?”.
Sustainability:
Sears is committed to bringing to life a culture of sustainability in which associates are asked to think and act “green” and help to achieve three goals:
• Increase the availability of sustainable products and services
• Reduce Sears carbon footprint, and • Make sustainability part of Sears culture
Sustainability is also a priority of Canadians as evidenced by Sears selling more than $600 million of ENERGY STAR® products during 2008. Sears was named ENERGY STAR Retailer of the Year by Natural Resources Canada, and was awarded the BC Hydro PowerSmart award for Outstanding Energy Efficiency Project.
Home Energy Efficiency:
Sears offers a broad range of energy saving appliances and services including high-efficiency furnaces, air conditioning units, windows, drain-water heat recovery systems, roofing, sustainable flooring and kitchen and bathroom renovations. In 2008, Sears launched tankless hot water systems which save space and energy costs. They are significantly smaller in size than conventional water heaters. Also, tankless hot water systems have the benefit of providing an endless supply of hot water because the water is heated as it is used which saves energy. Sears either sells or rents these systems, offers deferred financing options, does the installation and assists customers to apply for tax allowances from the government.
Sears Canada Inc.2

Credit Card Redemption at Point-of-Sale:
To improve the benefits of Sears Club membership, Sears now offers instant redemption of loyalty points at any retail store for a gift card to use immediately or give as a gift. This time-saving and convenient option has proved successful with over 33,000 customers redeeming in the first three months of the program’s introduction. Sears is also the first major retailer to offer personalized gift cards, allowing customers to tailor each Sears gift card they purchase with a customized photo and message.
Sears National Kids Cancer Ride:
In 2008, Sears sponsored the inaugural “Sears National Kids Cancer Ride”, a 7,600 kilometre cycling event from Vancouver to Halifax which raised $1.1 million for children’s cancer research and treatment programs for patients. The event was very well supported by numerous Sears stores and facilities, which provided food and refreshments to cyclists, and participated in fundraising initiatives with their local communities.
Operation Wish:
2008 was the third year of “Operation Wish”, conducted in cooperation with the military family resource centres, to provide military personnel serving overseas with the Sears Wish Book. Sears offers the personnel a special discount as they place gift orders for their loved ones at home. The program was augmented this past year with the creation of a huge 16 foot wide by 4 foot high banner containing the photographs of families of military personnel serving overseas. The banner was sent across the country to Sears stores located near communities of military bases from which personnel serving in Afghanistan were deployed and then sent to Kandahar where Canadians are serving.
––––––––––––––––––––––––––––––––––––––––––––––––––
2009:
The outlook for the Canadian economy in 2009 is for continued low consumer confidence and increased job losses which will negatively impact retail sales.
Despite the forecasted difficult economic circumstances, in 2009 Sears will continue to introduce new products and services to improve customers’ lives as our first priority. The following are some examples:
Liz & Co.
Liz & Co., a division of Liz Claiborne, exclusive to Sears and launching in Sears stores in Spring, is bringing to customers designer-inspired fashion at very affordable prices. In addition to a complete line of tops, pants and skirts, this Liz Claiborne brand will also include handbags and jewelry. Liz & Co. provides busy, active customers with an easy way to put several fashionable classic looks together all from one convenient shop.
Sears Travel:
Sears Travel is one of Canada’s leading travel services. In 2009, Sears is introducing a no-cost “Sears Travel Vacation Rewards” loyalty program to reward members with travel and vacation options worldwide. The program also includes free benefits such as pre-flight seat selection and in-flight services, and discounts on Sears travel related merchandise. Sears Club members will be able to redeem their Sears loyalty points instantly when they book their travel or vacation.
Gift Registry:
Sears is well placed to offer a total home solution of gift related products and services, from fragrances, to bedding, appliances, electronics, and home improvement such as curtains and other home décor services. To grow the gift registry business, Sears is dedicating registry consultants in-store, expanding the assortment of gift and bridal merchandise, and actively participating in gift and bridal shows.
––––––––––––––––––––––––––––––––––––––––––––––––––
Lastly, I would like to again thank our 33,000 associates who are committed to “improving customers’ lives by providing quality services, products and solutions that earn their trust and build lifetime relationships”. By being committed to this Vision, Sears can become Canada’s #1 retailer.
Sincerely,
Dene Rogers President and Chief Executive Officer
2008 Annual Report 3

This page has been intentionally left blank.
Sears Canada Inc.4

Letter from the Chief Financial Officer
Sears Canada is in a very solid financial state. The Company has a strong balance sheet with a cash, restricted cash, and investments balance of $964.6 million versus $876.8 million in 2007. Total long-term debt is $364.6 million, resulting in a debt to EBITDA ratio of 0.7:1.
The erosion of consumer confidence and increased unemployment in 2008 impacted the fourth quarter, the largest sales quarter of the year. At the end of the third quarter, operating EBITDA was up 11.3% versus 2007. By year’s end, operating EBITDA for 2008 was $517.0 million as compared to $521.6 million in 2007. The increase in EBITDA from 2005 to 2008 is 52%, and operating Earnings per Share over the same period has increased 313%.
The Company entered into a U.S. $120 million letter of credit facility in December, 2008 to support the off-shore merchandise purchasing program. The 2009 goal is to convert to an electronic funds payment process which will significantly reduce the need for letters of credit in the future.
Sears Canada’s capital investment principle is based on the belief that capital invested in any area of business should generate a minimum return on investment. In 2008, Sears invested approximately $97 million in capital across several hundred projects to ensure future growth and value for shareholders, including $17 million to relocate the Company’s Toronto Head Office from Jarvis Street to the Toronto Eaton Centre.
Significant actions have already taken place in order to prepare the Company for the transition to International Financial Reporting Standards (“IFRS”) effective 2011. An enterprise-wide project team has been established and an executive steering committee, to ensure a smooth transition to meet all IFRS reporting and disclosure requirements.
Throughout 2009, Sears will continue to manage margin and expenses, which are the critical priorities in these difficult economic times. However, an even greater focus will be on longer-term strategic objectives to progress Sears to become Canada’s #1 retailer.
Allen Ravas Sr. Vice-President and Chief Financial Officer
2008 Annual Report 5

ELEVEN YEAR SUMMARY 1
RestatedFiscal Year 2008 2007 2 2006 2005 2004 2003 9 2002 2001 2000 1999 1998
Results for the Year (in millions)Total revenues 3 $ 5,733 $ 6,326 $ 5,933 $ 6,238 $ 6,230 $ 6,223 $ 6,536 $ 6,726 $ 6,356 $ 5,777 $ 5,132Depreciation and amortization 127 150 152 164 166 166 165 182 137 117 96Earnings before unusual items and income taxes 380 376 264 210 193 226 207 164 316 339 269Unusual items – expense/(gain) (39) (82) 25 (748) 3 5 189 (5) (13) – –Earnings before income taxes 419 458 239 958 189 221 18 169 329 339 269Income taxes (recovery) 130 152 87 187 61 96 (26) 80 106 143 123Net earnings 289 306 153 771 129 125 44 89 223 196 146Dividends declared – – 13 1,557 26 26 26 26 26 26 25Return of capital – – – 470 – – – – – – –Capital expenditures 4 96 72 50 86 161 208 219 159 482 249 142
Year End Position (in millions) 5
Accounts receivable 7 $ 139 $ 118 $ 136 $ 136 $ 1,620 $ 1,340 $ 1,393 $ 958 $ 1,027 $ 1,137 $ 1,164Inventories 8 968 880 805 788 790 801 754 865 1,015 814 716Capital assets 713 742 874 981 1,066 1,100 1,102 1,234 1,245 1,002 868Total assets 6,7 3,265 3,002 3,060 3,258 4,356 4,230 4,208 4,133 4,090 3,855 3,262Working capital 1,173 777 373 219 1,318 1,124 1,061 953 685 515 898Debt 365 372 542 749 756 770 776 813 699 686 844Shareholders’ equity 1,508 1,093 785 645 1,877 1,781 1,627 1,608 1,543 1,343 1,164
Per Share of Capital StockNet earnings $ 2.68 $ 2.84 $ 1.42 $ 7.22 $ 1.21 $ 1.17 $ 0.41 $ 0.83 $ 2.09 $ 1.85 $ 1.38Dividends declared – – 0.12 14.50 0.24 0.24 0.24 0.24 0.24 0.24 0.24Return of capital – – – 4.38 – – – – – – –Shareholders’ equity 14.01 10.16 7.29 6.01 17.67 16.67 15.24 15.07 14.49 12.64 10.98
Financial Ratios 3,5
Return on average shareholders’ equity (%) 22.2 32.6 21.3 47.3 7.0 7.3 2.7 5.7 15.4 15.7 13.3Current ratio 7 2.1 1.6 1.2 1.1 1.9 1.9 1.7 1.5 1.4 1.3 1.7Return on total revenues (%) 5.0 4.8 2.6 12.4 2.1 2.0 0.7 1.3 3.5 3.4 2.8Debt/equity ratio 19/81 25/75 41/59 54/46 29/71 30/70 32/68 34/66 31/69 34/66 42/58Pre-tax margin (%) 7.3 7.2 4.0 15.4 3.0 3.5 0.3 2.5 5.2 5.9 5.2
Number of Selling UnitsFull-line department stores 122 121 123 123 121 122 123 125 125 110 109Home stores 48 48 48 49 49 47 42 37 33 25 20Outlet stores 11 13 11 11 13 14 15 17 15 12 12Specialty type: Appliances & Mattresses / Lands’
End stores 6 5 5 5 4 – – – – – –Dealer stores 171 163 158 158 153 144 141 132 128 110 93Floor Covering Centres 30 37 50 50 50 53 48 38 33 15 –Coverings stores – – – 1 2 – – – – – –Sears Home Services showrooms 13 14 14 14 12 11 10 6 5 3 1Cantrex Buying Group Members 824 825 847 873 – – – – – – –Corbeil 30 30 29 28 – – – – – – –Travel offices 106 106 106 112 112 110 110 110 107 87 85Catalogue selling locations 1,858 1,826 1,898 2,116 2,258 2,233 2,220 2,157 2,103 2,005 1,8981 Fiscal years 1999 to 2003 have been restated to reflect a correction in accounting for lease incentives and other allowances. Historically, lease allowances were
classified as a reduction to capital assets as opposed to a deferred credit. The lease allowances were historically amortized as a reduction to depreciation expenseover the expected life of the asset to which it related, as opposed to a reduction to rent expense over the term of the related lease.
Sears Canada Inc.6

2 Restated 2007 represents the 57-week period ended February 2, 2008, restated to reflect the retrospective application of the change to the Company’s financialinstruments accounting policy choice and adoption of new accounting standards for financial instruments. The Company changed its year end from the Saturdayclosest to December 31 to the Saturday closest to January 31. See Section 1e ‘‘Change in Year End & Restatement of Prior Year Results’’ for further details.
3 Total revenues and cost of merchandise sold have been restated to reflect guidance on recording of revenues. Revenues relating to the travel business and licenseddepartment businesses are now recorded in revenues net of cost of sales. The restatement had no impact on net earnings. The change in policy, effective in 2000,has been applied retroactively.
4 Capital expenditures have not been reduced by cash payments outstanding at year end resulting from normal trade terms.5 The 1999 balance sheet has been restated to reflect the finalization of the accounting for the acquisition of Eatons.6 The 1998 to 2003 balance sheets have been restated to conform to the 2004 financial statement presentation.7 Fiscal years 1998 to 2006 have been restated to reflect the liability pertaining to the reduction in revenue for sales transactions for which the merchandise has yet
to be delivered. Note that the Company sold its Credit and Financial Services Operations in 2005, which included the sale of $1,542 in accounts receivable.8 As a result of the Company’s change in accounting policy for inventories, the inventory balances included in this table are not comparable. See Note 1 ‘‘Summary of
Accounting Policies and Estimates – Changes in Accounting Policy’’ of the Notes to the Consolidated Financial Statements for further details.9 Fiscal year comprised of a 53-week period.
QUARTERLY SUMMARY
(unaudited) First Quarter Second Quarter Third Quarter Fourth Quarter***
Comparable Restated Comparable Restated Comparable Restated Comparable Restated
(in millions, except per share amounts) 2008 2007* 2007** 2008 2007* 2007** 2008 2007* 2007** 2008 2007* 2007**
Total revenues $ 1,254.4 $ 1,282.7 $ 1,219.1 $ 1,420.3 $ 1,413.0 $ 1,443.9 $ 1,442.2 $ 1,434.0 $ 1,367.6 $ 1,616.3 $ 1,715.2 $ 2,295.8
Earnings before income taxes $ 87.6 $ 45.1 $ 18.5 $ 90.4 $ 78.3 $ 66.6 $ 96.9 $ 148.2 $ 148.7 $ 144.0 $ 183.3 $ 224.4
Net earnings $ 63.1 $ 31.8 $ 14.3 $ 61.1 $ 49.7 $ 42.3 $ 68.9 $ 103.7 $ 104.0 $ 95.5 $ 119.0 $ 145.4
Earnings per share $ 0.59 $ 0.30 $ 0.13 $ 0.56 $ 0.46 $ 0.39 $ 0.64 $ 0.96 $ 0.97 $ 0.89 $ 1.11 $ 1.35
Diluted earnings per share $ 0.59 $ 0.30 $ 0.13 $ 0.56 $ 0.46 $ 0.39 $ 0.64 $ 0.96 $ 0.97 $ 0.89 $ 1.11 $ 1.35
* Comparable 2007 represents the 52-week period ended February 2, 2008, adjusted to reflect the change in fiscal year end, the adoption of the new accountingstandard for inventory and the reversal of the impact of the restatement resulting from the change to the Company’s financial instruments accounting policy choiceregarding recognition of embedded derivatives.
** Restated 2007 represents the 57-week period ended February 2, 2008, restated to reflect the retrospective application of the change to the Company’s financialinstruments accounting policy choice and adoption of new accounting standards for financial instruments.
***The fourth quarter of Restated 2007 represents the 18-week period ended February 2, 2008. The 2008 and 2007 Comparable fourth quarters are 13-week periodsending January 31, 2009 and February 2, 2008, respectively.
The Company’s operations are seasonal in nature. Accordingly, merchandise and service revenues, as well as performance payments received from JPMorgan Chase Bank,N.A. (Toronto Branch), also referred to in this document as credit revenues, will vary by quarter based upon consumer spending behaviour. Historically, the Company’srevenues and earnings are higher in the fourth quarter than in any other quarter due to the Holiday season. The Company is able to adjust certain variable costs inresponse to seasonal revenue patterns; however, costs such as occupancy are fixed, causing the Company to report a disproportionate level of earnings in the fourthquarter. Other factors that affect the Company’s sales and financial performance include actions by its competitors, timing of its promotional events and changes inpopulation and other demographics. Accordingly, the Company’s results for any one fiscal quarter are not necessarily indicative of the results to be expected for any otherquarter, or the full year, and comparable store stales for any particular future period may increase or decrease.
2008 Annual Report 7

RECONCILIATION OF FISCAL YEAR 2007FINANCIAL STATEMENT CAPTIONS
Restated Fiscalincrease/(decrease) in millions 2007* Change 2007**
Inventories 1 $ 879.7 $ 24.3 $ 855.4Prepaid expenses and other assets 1 91.1 (24.3) 115.4Current portion of future income tax assets 2 29.2 (1.4) 30.6Accrued liabilities 2 438.6 (0.4) 439.0Income and other taxes payable 2 80.2 (1.3) 81.5Retained earnings 2 1,077.7 0.3 1,077.4
* As presented in the 2008 Annual Report** As presented in the 2007 Annual Report1 Represents the change in classification of part supplies from the Company’s parts and service business originally classified as prepaid expenses and other
assets to inventories.2 Represents the changes in these account balances as a result of the retrospective application of the change to the Company’s financial instruments
accounting policy choice and adoption of new accounting standards for financial instruments.
RECONCILIATION OF FISCAL YEAR 2007 CONSOLIDATEDSTATEMENTS OF EARNINGS AND COMPREHENSIVE INCOME
Restated Fiscal(in millions, except per share amounts) 2007* Change 1 2007**
Total revenues $ 6,326.4 $ 6,326.4
Cost of merchandise sold, operating, administrative and selling expenses 5,787.6 3.8 5,783.8Depreciation and amortization 150.1 150.1Interest expense, net 12.7 12.7Unusual items – (gain) expense (82.2) (82.2)
Earnings before income taxes 458.2 (3.8) 462.0
Income taxes expense (recovery)Current 74.4 (1.3) 75.7Future 77.8 77.8
152.2 (1.3) 153.5
Net earnings $ 306.0 $ (2.5) $ 308.5
Other comprehensive income (loss) – – –
Total comprehensive income $ 306.0 $ (2.5) $ 308.5
Net earnings per share $ 2.84 $ (0.03) $ 2.87Diluted net earnings per share $ 2.84 $ (0.03) $ 2.87
* As presented in the 2008 Annual Report** As presented in the 2007 Annual Report1 Reflects the change due to the retrospective application of the change to the Company’s financial instruments accounting policy choice and adoption of
new accounting standards for financial instruments.
Sears Canada Inc.8

MANAGEMENT’S DISCUSSION AND ANALYSISMarch 24, 2009
‘‘Sears’’, ‘‘Sears Canada’’ or ‘‘the Company’’ refers to Sears Canada Inc. and its subsidiaries,Table of Contents together with its proportionate share of the assets, liabilities, revenues and expenses of joint
venture interests.Management’s Discussion and Analysis (‘‘MD&A’’) contains commentary from Sears management1. Company Performance 10regarding strategy, operating results and financial position. Management is responsible for itsa. Vision 10accuracy, integrity and objectivity, and develops, maintains and supports the necessary systemsb. Leadership Changes 10and controls to provide reasonable assurance as to the accuracy of the comments contained
c. Business Segments 10 herein.d. Strategic Initiatives 10 This MD&A should be read in conjunction with the Consolidated Financial Statements and Notese. Change in Year End & Restatement of to the Consolidated Financial Statements for the 2008 fiscal year – the 52-week period ended
Prior Year Results 14 January 31, 2009 (‘‘Fiscal 2008’’). This MD&A is current as of March 24, 2009 unlessf. Use of Non-GAAP Measures and otherwise stated.
Reconciliation of Net Earnings to Additional information relating to the Company, including the Company’s Annual Information FormOperating EBITDA 15 (‘‘AIF’’) dated March 24, 2009 and the Management Proxy Circular dated March 24, 2009, are
available online at the Company’s website, www.sears.ca, or by contacting Sears Corporateg. Consolidated Financial Results 16Communications department at 416-941-4425. The 2008 Annual Report, together with the AIFi. Fourth Quarter Results 20and Management Proxy Circular, have been filed electronically with securities regulators in Canada
2. Segment Performance 23 through the System for Electronic Document Analysis and Retrieval (‘‘SEDAR’’) and can beaccessed on the SEDAR website at www.sedar.com.a. Merchandising Operations 23Unless otherwise indicated, all amounts are expressed in Canadian dollars.i. Overview 23
ii. Strategic Initiatives 26Cautionary Statement Regarding Forward-Looking Informationiii.Results from MerchandisingCertain information in the Annual Report and in this MD&A is forward-looking and is subject toOperations 28important risks and uncertainties. Forward-looking information concerns, among other things, theb. Real Estate Joint Venture Operations 30Company’s future financial performance, business strategy, plans, expectations, goals andi. Overview 30objectives, and includes statements concerning possible or assumed future results set out underii. Strategic Initiatives 30 Section 1 ‘‘Company Performance’’, Section 2 ‘‘Segment Performance’’, Section 3 ‘‘Liquidity and
iii.Results from Real Estate Joint Financial Position’’, Section 4 ‘‘Capital Resources’’ and Section 9 ‘‘Accounting Policy andVenture Operations 31 Estimates’’. Often, but not always, forward-looking information can be identified by the use of
words such as ‘‘plans’’, ‘‘expects’’ or ‘‘does not expect’’, ‘‘is expected’’, ‘‘budget’’, ‘‘scheduled’’,3. Liquidity and Financial Position 32 ‘‘estimates’’, ‘‘forecasts’’, ‘‘intends’’, ‘‘anticipates’’ or ‘‘does not anticipate’’, or ‘‘believes’’, orvariations of such words and phrases, or statements that certain ‘‘endeavoured’’ actions, events or4. Capital Resources 34results ‘‘may’’, ‘‘could’’, ‘‘would’’, ‘‘might’’ or ‘‘will’’ be taken, occur or be achieved. Although the
5. Financial Instruments and Off-Balance Company believes that the estimates reflected in such forward-looking information are reasonable,Sheet Arrangements 35 such forward-looking information involves known and unknown risks, uncertainties and other
factors which may cause actual results, performance or achievements to be materially different6. Funding Costs 35 from any future results, performance or achievements expressed or implied by the forward-looking
information and undue reliance should not be placed on such information.7. Related Party Transactions 36Factors which could cause actual results to differ materially from current expectations include, but are
8. Company Initiated Purchases and Sales not limited to: the ability of the Company to successfully implement its cost reduction, productivityof Shares 36 improvement and strategic initiatives and whether such initiatives will yield the expected benefits; the
results achieved pursuant to the Company’s long-term credit card marketing and servicing alliance witha. Employee Profit Sharing Plan 36JPMorgan Chase Bank, N.A. (Toronto Branch); general economic conditions; competitive conditions inb. Stock Option and Share Purchase Plansthe businesses in which the Company participates; changes in consumer spending; seasonal weatherfor Employees and Directors 37patterns; customer preference toward product offerings; the creditworthiness and financial stability oftenants and partners, with respect to the Company’s real estate joint venture interests; changes in the9. Accounting Policies and Estimates 37Company’s relationship with its suppliers; changes in the Company’s ownership by Sears Holdingsa. Critical Accounting Estimates 37Corporation, the controlling shareholder of the Company; interest rate fluctuations and other changes inb. Accounting Standards Implemented infunding costs and investment income; fluctuations in foreign currency exchange rates; investment returnsFiscal 2008 39 in the Company’s pension plan which are materially better or worse than expected; new accounting
c. Recently Issued Accounting Standards 40 pronouncements, or changes to existing pronouncements, that impact the methods the Company usesd. Future Accounting Standards 41 to report its financial condition and results from operations; uncertainties associated with criticale. Disclosure Controls and Procedure 41 accounting assumptions and estimates; the outcome of pending legal proceedings; and changes in laws,
rules and regulations applicable to the Company. Information about these factors, other material factors10. Risks and Uncertainties 42 that could cause actual results to differ materially from expectations and about material factors or
assumptions applied in preparing forward-looking information, may be found under Section 10 ‘‘Risksand Uncertainties’’ and elsewhere in the Company’s filings with Canadian securities regulators. TheCompany does not undertake any obligation to update publicly or to revise any forward-lookinginformation, whether as a result of new information, future events or otherwise, except as requiredby law.
2008 Annual Report 9

1. Company Performance
a. Vision
Sears is committed to improving the lives of its customers by providing quality services, products and solutionsthat earn their trust and build lifetime relationships.
b. Leadership Changes
At the Company’s Annual Meeting of Shareholders held on April 24, 2008, the shareholders of the Companyelected eight directors, of whom four were independent and four were non-independent. Three of thenon-independent directors who currently sit on the Company’s board of directors (the ‘‘Board’’) are executives ofSears Holdings Corporation (‘‘Sears Holdings’’), the controlling shareholder of the Company, and one director isan officer of the Company.
Effective August 22, 2008, Mark C. Good resigned from the Board, concurrent with his resignation fromSears Holdings. Mr. Good had been elected to the Board at the Company’s Annual Meeting of Shareholderson May 9, 2006. On November 21, 2008, the Board filled the vacancy created upon Mr. Good’s resignation byappointing William R. Harker to the Board. Mr. Harker currently holds the position of Senior Vice-President,Human Resources, General Counsel and Corporate Secretary of Sears Holdings.
On October 17, 2008, the Company announced the appointment of Mr. Allen Ravas to the role of SeniorVice-President and Chief Financial Officer and the departure of Mr. David B. Merkley, former SeniorVice-President and Chief Financial Officer.
c. Business Segments
The Company reports its operations in two business segments: merchandising and real estate joint ventureoperations.
Merchandising Operations – This segment includes the sale of goods and services through the Company’s Retailchannel, which includes its Full-line, Sears Home, Dealer, Outlet, Appliances and Mattresses, Cantrex Group Inc.(‘‘Cantrex’’) and its wholly-owned subsidiary, Corbeil Electrique Inc. (‘‘Corbeil’’), and its Direct(catalogue/internet) channel. It also includes service revenues related to the Company’s product repair, homeimprovement, Cantrex, travel and logistics services, and performance payments received from JPMorgan ChaseBank, N.A. (Toronto Branch) (‘‘JPMorgan Chase’’) under the Company’s long-term credit card marketing andservicing alliance with JPMorgan Chase.
Real Estate Joint Venture Operations – This segment includes income from the Company’s joint venture interestsin shopping centres across Canada.
d. Strategic Initiatives
The Company is committed to its mission of building customer relationships, increasing profitability andimproving every day. The Company remains focused on several strategic initiatives geared toward growingprofitable sales, customer segmentation and productivity improvement initiatives. These strategic initiatives arediscussed in greater detail below and throughout this MD&A. There can be no assurance that the Company willsuccessfully implement these strategic initiatives or whether such initiatives will yield the expected results. In lightof the current downturn in the economy and declining consumer confidence, the Company expects a challengingeconomic climate. The Company, however, possesses unique resources that give it the capability to managethrough the challenging economic times as well as differentiate itself from its competitors. These resourcesinclude the Company’s:
• Brands – (Private brands – Jessica�, Nevada�, Attitude�, Distinction�, Boulevard�, Tradition�, Protocol�,Retreat�, Alpinetek�, Pure NRG�, Trendzone�, Baby Boots� and Whole Home�; Licensed brands – Kenmore�,Craftsman�, DieHard� and Lands’ End�; and many non-proprietary national brands) are one of the
Sears Canada Inc.10

Company’s most important resources. The Company believes that each of these brands has significantrecognition and value with customers;
• Expansive physical and online presence that puts the Company in proximity to its customers – the Companyoperates 122 Full-line department stores, 266 specialty stores (48 furniture and appliances stores, 171 dealerstores operated under independent local ownership, 5 appliances and mattresses stores, 30 Corbeil stores,1 Lands’ End store and 11 outlet stores), 30 floor covering stores, 1,858 catalogue pick-up locations and106 travel offices. Sears Canada also conducts business over the Internet through its website, www.sears.ca, toenhance its multi-channel customer experience; and
• Specialized service offerings which attract a broad customer base – apart from merchandise retail, theCompany also offers a wide range of specialized services from its various businesses including the sale,installation, maintenance and repair of heating and cooling equipment, roofing, door and window replacement,flooring, window coverings and energy audits from its Home Improvement Products and Services business,kitchen and bathroom renovations, home security, carpet and upholstery cleaning, duct cleaning and maidservices from its Home Maintenance Services business and other services including parts and repair, portraitstudio, optical, floral, wireless and long distance, insurance and real estate services.
Sears management is confident that the Company is financially strong and well positioned to operate should thecurrent conditions persist. The Company continues to focus on the following strategic initiatives and is preparingto take full advantage of the many opportunities that will exist when the economy stabilizes and recovers.
Growing Profitable Sales
One of the Company’s most important strategies is to grow profitable sales and create new demand. In Fiscal2008, various initiatives to achieve these objectives were undertaken, including:
• Strengthening the Company’s organizational capability to ensure that company-wide goals and strategiesare achieved;
• Repositioning the Company’s private brands and providing product assortments that are exciting and relevantto consumers’ needs;
• Leveraging the Company’s online business, www.sears.ca, to engage new customers and demographics. Despitea continued focus on expense management, the Company continues to invest in online capabilities as it believesthat a compelling multi-channel experience will be an important factor for success in the years and decadesto come;
• Strengthening the Company’s policy and procedures to significantly reduce inventory shrinkage and productreturns;
• Improving the Company’s inventory management, replenishment and direct importing practices to improvemargins and enhance competitive pricing capabilities to grow profitable sales;
• Rolling out new products and services that leverage the Company’s multi-channel capability, with a particularfocus on its Home Improvement channel to meet the growing consumer interest in energy efficient andenvironmentally friendly products and services;
• Increasing customer convenience through expanding the Company’s Dealer network by opening 12 additionalstores and 32 additional catalogue merchandise pick-up locations;
• Implementing local store initiatives designed to generate customer traffic, especially on weekends; and
2008 Annual Report 11

• Implementing Sears Card and Sears MasterCard initiatives directed to increasing the usage and transactionvolume on these proprietary cards.
Customer Segmentation Initiatives
To grow profitable sales, the Company must provide the right products to the right customers at the right time.In Fiscal 2008, the Company undertook various initiatives to achieve this goal, including:
• Using customer segmentation market research to develop unique strategies for each of the Company’scategories and channels to drive sales and market share growth;
• Utilizing information and technology to better understand its customer so that the Company can continue tofulfill its Vision of improving the lives of its customers;
• Continuing merchandise initiatives to increase sales and volumes through expanded assortments, enhancedin-store presentation, signage and staff training; and
• Issuing special, targeted catalogues (‘‘Specialogues’’) that are geared toward specific product and lifestylethemes.
Productivity Improvement Initiatives
The Company continues to focus on organizational and productivity improvements to improve profitability. DuringFiscal 2008, Sears pursued further operational improvements throughout the organization, including:
• Realigning resources to improve efficiencies and enhance organizational capability;
• Developing stronger vendor partnerships to improve profitability, overall competitiveness and ultimately, betterrelationships with its customers;
• Implementing improved processes to more effectively source and manage inventory throughout the Company’svaried channels;
• Relocating the Company’s head office operations to unoccupied space above the Toronto Eaton Centre Full-linedepartment store to reduce costs and improve efficiencies; and
• Continuing to focus on expense management.
Real Estate Investments
The Company reviews its real estate holdings and joint venture interests on a regular basis. The primary objectiveof the Company’s real estate joint venture operations is to maximize the returns on its investment in shoppingcentre real estate. The Company’s real estate holdings and shopping centre joint venture investments are non-coreassets that the Company sells when it is financially advantageous to do so.
On September 18, 2008, the Company opened its new Eastgate Square Full-line department store in Hamilton,Ontario. As noted in the Company’s 2007 Annual Report, the Company sold the property where the Centre MallFull-line department store operated and relocated operations in September to a leased store in Eastgate Square.
In February 2008, the Company completed the sale of its property in Calgary, Alberta. The financial details ofthis transaction are discussed in this MD&A under Section 1g ‘‘Consolidated Financial Results’’. In the firstquarter of Fiscal 2008 the Company converted the Deerfoot Mall Outlet store in Calgary, Alberta into a SearsFull-line department store.
The Company sold its head office building and adjacent land at 222 Jarvis Street in Toronto, Ontario, in Fiscal2007 and leased back the property for the balance of Fiscal 2007 and during Fiscal 2008 while it was to
Sears Canada Inc.12
complete a relocation of all head office operations to unoccupied space above the Toronto Eaton Centre Full-linedepartment store. The relocation is expected to result in improved efficiencies and an enhanced officeenvironment and was completed in the first quarter of the 2009 fiscal year. The cost of the relocation atapproximately $17 million was under budget.
Business Development Opportunities
On an ongoing basis, management reviews the Company’s existing operations and opportunities for growing andexpanding the products and services offered throughout its various channels. On February 24, 2008, SearsCanada acquired, at a cost of $7.0 million, the assets of privately-held Excell Duct Cleaning Inc., and a relatedprivately-held company (collectively, ‘‘Excell’’), which managed a network of air duct cleaning licensees for theCompany across Canada. As a result of the $7.0 million acquisition, net of cash acquired of Nil, assets with afair value of $0.4 million and goodwill in the amount of $6.6 million were recorded on the Company’s statementof financial position during the first quarter of Fiscal 2008. The Company performs a goodwill impairment testannually or more frequently if changes in circumstances indicate a potential impairment. No impairment has beenrecognized on the Company’s goodwill since acquisition.
Corporate Social Responsibility Initiatives
The Company conducts its operations with a commitment to achieving success at the economic, social andenvironmental levels. The three key areas of focus with respect to sustainability leadership during Fiscal2008 included:
• Developing a strategy for increasing sales of green products and services;
• Reducing the environmental impact and reputation risks of the Company’s operations while also reducingcosts; and
• Creating a culture of sustainability across the Company.
During the fourth quarter of Fiscal 2008, the Company was officially granted a national license by NaturalResources Canada to conduct household energy audits in order to identify energy saving opportunities that mayalso qualify for Federal and Provincial rebates in their implementation. The Company will be able to service thepotential audit requirements for customers by providing Energy Star� appliances, furnaces and windows, alongwith recommending new products. By also providing financing options, such as a new rental program for energyefficient furnaces, air conditioners and hot water tanks, the Company will make it easy for customers to makeenergy efficient choices. On June 4, 2008, the Government of Canada, through Natural Resources Canada,presented Sears Canada with its second Energy Star� Retailer of the Year award, in recognition of theCompany’s excellence and commitment to promoting Energy Star� appliances, electronics and heating, ventilationand air conditioning equipment.
On May 15, 2008, BC Hydro awarded Sears Canada with the 2008 Power Smart Excellence Award forOutstanding Energy Efficiency Project for the Company’s innovation and efforts in improving its operational andenergy efficiency. Sears Canada worked with Direct Energy and BC Hydro on the installation of variablefrequency drives on heating, ventilation and air conditioning fan motors and the replacement of higher-wattagefluorescent lighting resulting in the largest energy-saving retrofit in the retail sector in Fiscal 2007 and costsavings for the Company.
During Fiscal 2008, the Company began selling a fashionable reusable shopping bag, called the envirotote, inSears department stores nationwide to help reduce the amount of plastic bags that will eventually end upin landfills.
2008 Annual Report 13

e. Change in Year End & Restatement of Prior Year Results
Historically, the Company’s fiscal year consisted of the 52- or 53-week period ending on the Saturday closest toDecember 31. In order to end its fiscal year on a date which allows for a full seasonal cycle, including the saleof holiday merchandise, and to align itself with the fiscal year of most North American retailers, includingSears Holdings, the Company changed its fiscal year end to the Saturday closest to January 31, effective the2007 fiscal year. As a result, the Company’s 2007 fiscal year was a transition year comprised of a 57-weekperiod ended February 2, 2008 (‘‘Fiscal 2007’’) and the 2007 fourth quarter comprised of an 18-week periodfrom September 30, 2007 to February 2, 2008.
Throughout this MD&A, certain comparative figures have been reclassified to conform to the current year’spresentation. Fiscal 2007, represented as ‘‘Restated 2007’’ in this document, has been adjusted to reflect theretrospective application of the change to the Company’s financial instruments accounting policy choice andadoption of new accounting standards for financial instruments. The Company made this change in policy choiceconcurrent with the implementation of hedge accounting in February 2008 and, as a result, discontinued therecognition of certain embedded derivatives. The Company believes this change in accounting policy results inmore relevant net earnings and other comprehensive income (‘‘OCI’’), as the change in market value of thehedged item is now recognized consistent with the change in market value of the hedging item. The Restated2007 information has not been adjusted for the change in fiscal periods arising from the change in year end andis therefore not comparable to Fiscal 2008.
See Note 1 ‘‘Summary of Accounting Policies and Estimates’’ of the Notes to the Consolidated FinancialStatements for further details on the fiscal year and the restatement.
Unless otherwise noted, the unaudited fourth quarter (‘‘Fourth Quarter’’) and full year audited periods forFiscal 2008 comprise the 13- and 52-week periods ended January 31, 2009 and the fourth quarter and full yearperiods for Fiscal 2007 comprise the 18- and 57-week periods ended February 2, 2008.
In addition, to aid in the analysis of the Company’s results relative to Fiscal 2008, pro forma information forFiscal 2007, represented as ‘‘Comparable 2007’’ in this MD&A, is presented to reflect: (i) the change in fiscalyear end, such that the 2007 fourth quarter and full year periods comprise the 13- and 52-week periods endedFebruary 2, 2008; (ii) the adoption of the new accounting standard for inventory (see Section 9b of this MD&A‘‘Accounting Standards Implemented in Fiscal 2008 – Inventories’’) as if it had been applied retrospectively withrestatements to prior periods; and (iii) the reversal of the impact of the restatement resulting from the change tothe Company’s financial instruments accounting policy choice regarding the recognition of certain embeddedderivatives.
The Company’s change in year end resulted in a shift in the commencement of the Fiscal 2008 and each quarterof Fiscal 2008 by one month and one week (five weeks in total). The Comparable 2007 information reflectsmanagement’s best estimate of the impact of this five week shift. Management endeavoured to compute theincremental results attributable to the shift in calendar within the constraints imposed by the information systemsof the Company. Certain results, such as retail merchandise sales, are tabulated daily based on point-of-saleactivities. Other revenue streams and many expenses are calculated monthly, requiring management to exercisejudgment in separating elements attributable to the five week shift.
References in this MD&A to the Company’s results for the 2006 fourth quarter and fiscal year, represented as‘‘Fiscal 2006’’, comprise the 13- and 52-week period ended December 30, 2006, and have not been restated. Tofacilitate the analysis and commentary of the Company’s Fiscal 2007 results relative to Fiscal 2006 throughoutthis MD&A, the 13- and 52-week period ended December 29, 2007 is defined as the ‘‘Comparable Quarter’’ and‘‘Comparable Year’’, respectively.
14 Sears Canada Inc.

f. Use of Non-GAAP Measures and Reconciliation of Net Earnings to Operating EBITDA
The Company’s financial statements are prepared in accordance with Canadian generally accepted accountingprinciples (‘‘GAAP’’). Management uses GAAP and non-GAAP measures to better assess the Company’sunderlying performance and provides this additional information in this MD&A so that readers may do the same.
Same store sales is a measure used by management and the retail industry to compare retail operations,excluding the impact of store openings and closures. More specifically, the same store sales metric compares thesame calendar weeks for each period and represents the 13- and 52-week periods ended January 31, 2009 andthe 13- and 52-week periods ended February 2, 2008. The calculation of same store sales is a non-GAAPmeasure and may be impacted by store space expansion and contraction.
Operating earnings before interest, taxes, depreciation and amortization (‘‘Operating EBITDA’’) is a non-GAAPmeasure. Operating EBITDA excludes non-operating gains and losses, often referred to as unusual ornon-comparable items, net interest expense, income tax expense and depreciation and amortization.
These measures do not have any standardized meaning prescribed by GAAP and are, therefore, unlikely to becomparable to similar measures presented by other reporting issuers.
A reconciliation of the Company’s net earnings to Operating EBITDA is outlined in the following table:
Fourth Quarter Full Year
(in millions, except per share amounts) 2008 2007 2008 2007
Net earnings1 $ 95.5 $145.4 $288.6 $306.0
Unusual items, net of taxes:Restructuring activities – (0.2) (1.1) (0.2)Sale of real estate/ joint venture – – (28.3) (67.3)Sale of airplane – – – (2.3)Settlement of lawsuit – – – 2.4Enivronmental Remediation – 2.9 – 2.9
Net earnings excluding unusual items1 $ 95.5 $148.1 $259.2 $241.5
Depreciation and amortization 31.4 43.0 126.9 150.1Interest expense, net 4.5 (1.7) 10.0 12.7Income taxes expense excluding taxes on unusual items1 48.5 80.5 120.9 134.5
Operating EBITDA2 $179.9 $269.9 $517.0 $538.8
Adjustments to arrive at Comparable period Operating EBITDA3 for 2007:Change in fiscal year end (47.0) (26.9)New inventory standard 6.5 5.9Retrospective change in financial instruments accounting policy (10.7) 3.8
Comparable Period Operating EBITDA3 $179.9 $218.7 $517.0 $521.6
Net earnings per share $ 0.89 $ 1.35 $ 2.68 $ 2.84Net earnings per share excluding unusual items $ 0.89 $ 1.38 $ 2.41 $ 2.251 Net earnings and income taxes expense for the fourth quarter and full year 2007 have been restated to reflect the retrospective application of the
change to the Company’s financial instruments accounting policy choice and adoption of new accounting standards for financial instruments.2 The fourth quarter and Fiscal 2008 and the fourth quarter and full year Restated 2007 periods represent the 13 and 52-week periods ended
January 31, 2009 and the 18 and 57-week periods ended February 2, 2008, respectively.3 For the fourth quarter and Fiscal 2008 and the fourth quarter and full year Comparable 2007 periods, Operating EBITDA represents the 13- and
52-week periods ended January 31, 2009 and February 2, 2008, respectively.
2008 Annual Report 15

g. Consolidated Financial Results
As noted, certain comparative figures have been reclassified to conform to the current year’s presentation. SeeSection 9 – ‘‘Accounting Policies and Estimates’’ of this MD&A and the Notes to the Consolidated FinancialStatements for further information about the critical accounting estimates used and the accounting policiesadopted by the Company.
% Change Fiscal2008 vs % Change Fiscal % Change
Fiscal Comparable 2008 vs Comparable Restated Restated 2007 Fiscal(in millions, except per share amounts) 2008* 2007 Restated 2007 2007** 2007*** vs Fiscal 2006 2006*
Total revenues $5,733.2 (1.9%) (9.4%) $ 5,844.9 $6,326.4 6.6% $5,932.8Cost of merchandise sold, operating,
administrative and selling expenses 5,216.2 (2.0%) (9.9%) 5,323.3 5,787.6 5.8% 5,468.3
Operating EBITDA**** 517.0 (0.9%) (4.0%) 521.6 538.8 16.0% 464.5Depreciation and amortization 126.9 (7.6%) (15.5%) 137.4 150.1 (1.3%) 152.1Interest expense, net 10.0 (13.0%) (21.3%) 11.5 12.7 (73.5%) 48.0Unusual items – expense/(gain) (38.8) nm nm (82.2) (82.2) nm 25.2Income taxes 130.3 (13.5%) (14.4%) 150.7 152.2 75.8% 86.6
Net earnings $ 288.6 (5.1%) (5.7%) $ 304.2 $ 306.0 100.5% $ 152.6
Earnings per share $ 2.68 $ 2.83 $ 2.84 $ 1.42Diluted earnings per share $ 2.68 $ 2.83 $ 2.84 $ 1.42
‘‘nm’’ means ‘‘not meaningful’’* Fiscal 2008 represents the 52-week period ended January 31, 2009. Fiscal 2006 represents the 52-week period ended December 30, 2006.** Comparable 2007 represents the 52-week period ended February 2, 2008, adjusted to reflect the change in fiscal year end; the adoption of the
new accounting standard for inventory; and the reversal of the impact of the restatement resulting from the change to the Company’s financialinstruments accounting policy choice regarding recognition of embedded derivatives.
*** Restated 2007 represents the 57-week period ended February 2, 2008, restated to reflect the retrospective application of the change to theCompany’s financial instruments accounting policy choice and adoption of new accounting standards for financial instruments.
**** Please see Section 1f ‘‘Use of Non-GAAP Measures and Reconciliation of Net Earnings to Operating EBITDA’’ regarding use of non-GAAP measures.
2008 Compared with 2007 – Total revenues in Fiscal 2008 decreased 1.9% over the Comparable 2007 period.Net merchandise sales declined 3% as a result of lower sales in Full-line, Direct, Outlet, Sears Home, Corbeiland Cantrex offset with higher revenues generated in the Dealer channel, which opened 12 new stores in Fiscal2008. Credit revenues increased 2.1% relative to the Comparable 2007 period. Service revenues increased 7.8%relative to the Comparable 2007 period due to improved results from Home Improvement Products Services,Sears Line Haul and delivery revenue being partially offset by lower sales in Travel and Cantrex. Growth ininternet sales remained positive, increasing 18.3% over the Comparable 2007 period. As compared to theRestated 2007 fiscal year, total revenues decreased 9.4%, primarily due to the change in fiscal year-end andthere being an additional 5 weeks in the Restated 2007 fiscal year.
Joint venture revenue decreased 6.7% as a result of the Company’s disposition of its interests in the Place Vertushopping centre in Montreal, Quebec in the first quarter of Restated 2007 and the Heritage Place shoppingcentre in Owen Sound in the third quarter of Restated 2007.
Same store sales represent merchandise sales generated through operations in Full-line, Sears Home, Dealer andCorbeil stores that were continuously open during both of the periods being compared. More specifically, thesame store sales metric compares the same calendar weeks for each period and represents the 13- and 52-weekperiods ended January 31, 2009 and the 13- and 52-week periods ended February 2, 2008. Relative to theComparable 2007 period, same store sales for Fiscal 2008 declined by 1.6% as sales were negatively impactedby the worsening economic climate and declining consumer confidence, specifically in the fourth quarter as samestore sales increased 0.3% for the first nine months of Fiscal 2008. Sales in home and hardlines in Fiscal 2008
Sears Canada Inc.16

decreased by 0.7% relative to the Comparable 2007 period, with the biggest decline in the home decor category.As a result of the Company’s recharge initiatives to expand and improve product assortment and relevance forthe needs of its consumers, electronics and mattresses continued to exhibit significant growth at 19.6% and13.3%, respectively, in relation to Comparable 2007 period. The Company also experienced 17.7% sales growthin seasonal hardware driven by record snow blower sales.
Sales in apparel and accessories categories decreased 6.2% in Fiscal 2008 relative to the Comparable 2007period. The general state of the economy and increased competitive landscape were factors that representedchallenges for all categories of apparel and accessories. In spite of these challenges, Sears national brands,seasonal footwear and outerwear experienced sales growth. The Company has addressed the challengesexperienced in Fiscal 2008 by reviewing assortment, focusing on strategic sourcing and inventory managementprocesses.
The cost of merchandise sold, operating, administrative and selling expenses were 2.0% lower in Fiscal 2008relative to the Comparable 2007 period, driven by lower sales and resulting in lower variable costs, lower payrolland benefit costs and advertising expenses as a result of the Company’s continued effort to manage costs.Included in expenses are operational one time items of $4.9 million (Comparable 2007: $6.9 million) providing anet increase to results from operations. These one-time items include a change in the Company’s historicalaccounting treatment of operating lease assets from a service business purchased in late 2003 and a modificationmade to the Company’s software capitalization policy. In 2007, these items included a gain on the sale of certainequity securities and an adjustment to the Company’s reserve for Home Improvement Products. Relative to theRestated 2007 fiscal year, the cost of merchandise sold, operating, administrative and selling expenses havedecreased by 9.9% primarily due to the change in fiscal year-end and there being an additional 5 weeks in theRestated 2007 fiscal year.
The gross margin rate for Fiscal 2008 improved 24 basis points and 76 basis points relative to the Comparable2007 and Restated 2007 periods, respectively. The improvement in gross margin rate for both periods ispredominantly due to significant improvement in inventory shrinkage and favourable exchange rates on importedmerchandise due to the Company’s foreign exchange hedging program.
Depreciation and amortization expense was 7.6% lower in Fiscal 2008 relative to the Comparable 2007 periodpredominantly due to lower capital expenditures in recent years and partially offset by a $1.2 million assetimpairment charge relating to four underperforming stores. As compared to the Restated 2007 fiscal year,depreciation and amortization decreased by 15.5% due to the additional five weeks of operations in the Restated2007 fiscal year.
Interest expense declined by 13.0% in Fiscal 2008 relative to the Comparable 2007 period as a result of a loweraverage debt balance being maintained throughout the year due to the repayment on maturity of the $125 milliondebenture in November 2007 and higher cash balances. When compared to the Restated 2007 fiscal year,interest expense declined by 21.3%, due to the reasons described above as well as the additional five weeks inthe year.
Income taxes decreased by 13.5% in Fiscal 2008 relative to the Comparable 2007 period, primarily due to areduction in the statutory tax rates and lower taxes payable on the sale of the Company’s real estate holdings. Ascompared to the Restated 2007 period, income taxes decreased by 14.4%, predominantly due to the combinationof lower pre-tax operating profits, lower statutory tax rates and lower taxes payable on the sale of theCompany’s real estate holdings.
As discussed above in Section 1f ‘‘Use of Non-GAAP Measures and Reconciliation of Net Earnings to OperatingEBITDA’’, Operating EBITDA does not include unusual or non-comparable gains and losses arising fromactivities outside of the Company’s principal operations. Operating EBITDA decreased by 0.9% and 4.0%relative to the Comparable 2007 and Restated 2007 periods. The decline, due to the decrease in sales indicatedabove, occurred in the last three months of Fiscal 2008 as Operating EBITDA for the first nine months of 2008
2008 Annual Report 17

was up 11.3% and 25.4% versus the Comparable 2007 and Restated 2007 periods, respectively. The followingis a list of the unusual or non-comparable gains and losses in Fiscal 2008 and Restated 2007.
• During the third quarter of Fiscal 2008, the Company recorded a pre-tax gain of $1.6 million related to thereduction in its restructuring liability originally accrued in 2005 and Fiscal 2006.
• During the first quarter of Fiscal 2008, the Company completed the sale of its property in Calgary, Albertawhere it operated a Full-line department store, receiving proceeds of approximately $40 million. A$37.2 million pre-tax gain, net of transaction costs, was recorded in the first quarter of Fiscal 2008.
• During the third quarter of Restated 2007, the Company recorded a $3.2 million pre-tax gain from thedisposition of its interest in the Heritage Place joint venture in Owen Sound, Ontario, recorded a $68.9 millionpre-tax gain on the sale of its headquarters office building and adjacent lands at 222 Jarvis Street, Toronto,Ontario, and recognized a $5.1 million pre-tax gain on the sale of property where the Company operated itsFull-line department store in Hamilton, Ontario. Subsequent to the sale the Company relocated its Hamiltonstore to the Eastgate Shopping Centre.
• During the second quarter of Restated 2007, the Company recognized a $3.5 million pre-tax gain on the saleof the Company’s airplane and expended $5.0 million to settle a lawsuit relating to a commercial dispute. Ofthe total settlement, a pre-tax expense of $3.6 million is included in unusual items as $1.4 million was accruedin previous years.
• A $9.3 million pre-tax gain was recognized on the sale of the Company’s interest in the Place Vertu shoppingcentre in Montreal, Quebec during the first quarter of Restated 2007. Joint venture interests in shoppingcentres are non-core assets that the Company sells when it is financially advantageous to do so.
2007 Compared with 2006 – Total revenues in Restated 2007 increased 6.6% over Fiscal 2006 due to theadditional five weeks of operations pertaining to the change in the Company’s year end. Relative to Fiscal 2006,merchandise sales increased 6.2%, service revenues increased 10.6% and credit revenues increased 8.9% inRestated 2007.
In relation to the Comparable Year, total revenues were down 1.5% compared to the Fiscal 2006 period as lowersales in Full-line, Direct, Outlet, Travel and other services offset higher revenues generated in Sears Home,Dealer, Product Repair and Home Improvement Products and Services channels. Merchandise sales decreased1.4% and service revenues decreased 2.8%, while credit revenues were higher by 0.4% following the successfulintroduction of various initiatives designed to increase proprietary card usage.
Relative to Fiscal 2006, same store sales for the Comparable Year decreased 0.8%. Although same store salesfor the January to June 2007 period increased 1.9% compared to the same period in Fiscal 2006, same storesales in the July to December 2007 period decreased 2.9% as sales were negatively impacted by increased cross-border shopping activity as a result of the appreciation of the Canadian dollar versus the U.S. dollar. Relative tothe 57 weeks ended February 3, 2007; same store sales for Restated 2007 decreased 0.7% as the Companyachieved positive same store sales growth during the five weeks in January 2008 due to strength in the Homeand Dealer channels, largely as a result of strong performance in the electronics, major appliances and outdoorpower categories.
Compared to Fiscal 2006, the cost of merchandise sold, operating, administrative and selling expenses were5.8% higher in Restated 2007 primarily due to the change in fiscal year-end and there being an additional5 weeks in the Restated 2007 fiscal year. Included in expenses for Restated 2007 are one-time items totalling$7.6 million (Fiscal 2006: $5.2 million) providing a net increase to results from operations. These one-timeitems include a gain on the sale of certain equity securities and an adjustment to the Company’s reserve forHome Improvement Products and Services, which was made in January 2008. In Fiscal 2006, the Companyrevised certain assumptions used to calculate the loyalty program and insurance reserves based on redemptionand claims experience, respectively.
Sears Canada Inc.18

On a Comparable Year basis, the cost of merchandise sold, operating, administrative and selling expenses were2.4% lower in 2007, relative to Fiscal 2006 due to lower variable costs, as a result of lower revenues, andcontinued improvements in controlling costs. Advertising expense was higher relative to last year due to increasedexpenditures to support merchandising initiatives. Payroll expenses were flat compared to Fiscal 2006. Benefitscosts were lower than Fiscal 2006 due to the pension plan and post-retirement benefits program changesannounced in February 2007.
Depreciation and amortization in Restated 2007 was 1.3% lower than Fiscal 2006 despite the inclusion of theadditional five weeks of operations in Restated 2007 resulting from the change in year end. Excluding theseadditional five weeks, depreciation and amortization was 7.8% lower relative to Fiscal 2006, due to lowercapital expenditures in recent years.
Relative to Fiscal 2006, net interest expense declined 73.5% in Restated 2007. The decline results from loweraverage debt and higher cash and short-term investment balances. In November 2007, the Company repaid thematuring $125 million secured debenture. In addition, interest expense in Fiscal 2006 included $8.9 million tosettle the cross-currency interest rate swaps and $0.9 million to write-off previously capitalized issue costspertaining to the secured U.S. $260 million term loan, which was repaid in September 2006.
In Fiscal 2006, the Company incurred pre-tax restructuring charges of $25.2 million. These charges relate to theimplementation of various productivity improvement initiatives, previously announced in 2005, which includedstrategic staffing decisions, the rationalization of facilities, a review of sourcing and procurement practices andvarious other operational efficiency improvements. These expenses include severance and related charges resultingfrom a workforce reduction of approximately 775 associates in certain departments and positions, including thelogistics and transportation divisions, the Product Repair Services organization and executive positions. As partof the above initiatives, and included in the above figures in Fiscal 2006, the Company recorded a non-cashcharge of $0.5 million related to the write-down of fixed assets from the Product Repair Services organizationand charges of $4.9 million associated with pension enhancements pertaining to the severance of certainexecutive positions.
Income taxes increased 75.8% in Restated 2007 relative to Fiscal 2006. The increase is due to the additionaltaxes payable on the sale of certain of the Company’s real estate holdings and higher pre-tax operating profits.The Company’s effective tax rate was lower in Restated 2007 due to the lower applicable capital gains tax rateon the real estate dispositions and the elimination of the large corporation tax. The Company wrote down itsfuture income tax asset in Fiscal 2006 by $3.8 million, of which $2.3 million resulted from the elimination ofthe large corporation tax. Income taxes in Fiscal 2006 also included a net tax recovery of $2.2 million relatedto an adjustment in a previous year’s reported tax expense, partially offset by an expense to record ananticipated unfavourable prior period assessment.
2008 Annual Report 19

i. Fourth Quarter ResultsFourth % Chg % Chg Fourth Fourth % Chg Fourth
Quarter 2008 vs 2008 vs Quarter Quarter Restated QuarterFiscal Comparable Restated Comparable Restated 2007 vs Fiscal
(in millions, except per share amounts) 2008* 2007 2007 2007** 2007*** 2006 2006*
Total revenues $1,616.3 (5.8%) (29.6%) $1,715.2 $2,295.8 22.5% $1,874.0Cost of merchandise sold, operating, administrative and selling expenses 1,436.4 (4.0%) (29.1%) 1,496.5 2,025.9 21.0% 1,674.7
Operating EBITDA**** 179.9 (17.7%) (33.3%) 218.7 269.9 35.4% 199.3Depreciation and amortization 31.4 (4.6%) (27.0%) 32.9 43.0 15.6% 37.2Interest expense, net 4.5 (364.7%) (364.7%) (1.7) (1.7) (128.3%) 6.0Unusual items – expense/(gain) – nm nm 4.2 4.2 nm –Income taxes 48.5 (24.6%) (38.6%) 64.3 79.0 66.0% 47.6
Net earnings $ 95.5 (19.7%) (34.3%) $ 119.0 $ 145.4 34.0% $ 108.5
Earnings per share $ 0.89 $ 1.11 $ 1.35 $ 1.01Diluted earnings per share $ 0.89 $ 1.11 $ 1.35 $ 1.01
‘‘nm’’ means ‘‘not meaningful’’* Fourth Quarter of Fiscal 2008 represents the 13-week period ended January 31, 2009. Fourth Quarter of Fiscal 2006 represents the 13-week
period ended December 30, 2006.** Fourth Quarter of Comparable 2007 represents the 13-week period ended February 2, 2008, adjusted to reflect the change in fiscal year end; the
adoption of the new accounting standard for inventory; and the reversal of the impact of the restatement resulting from the change to theCompany’s financial instruments accounting policy choice regarding recognition of embedded derivatives.
*** Fourth Quarter of Restated 2007 represents the 18-week period ended February 2, 2008, restated to reflect the retrospective application of thechange to the Company’s financial instruments accounting policy choice and adoption of new accounting standards for financial instruments.
**** Please see Section 1f ‘‘Use of Non-GAAP Measures and Reconciliation of Net Earnings to Operating EBITDA’’ regarding use of non-GAAP measures.
2008 Compared with 2007 – Total revenues and merchandise net sales for the Fourth Quarter of 2008 decreased5.8% and 7.6%, respectively over the Comparable 2007 fourth quarter. With the exception of Product RepairServices, all channels experienced lower sales. Internet sales for the Fourth Quarter of Fiscal 2008 increased11.9% relative to the Comparable 2007 period. Compared to the Restated 2007 fourth quarter results, totalrevenues decreased by 29.6% primarily due to the change in fiscal year-end resulting in there being 18-weeks inthe Restated 2007 fourth quarter and only 13-weeks in the Fiscal 2008 Fourth Quarter.
In relation to the Comparable 13-week period ended February 2, 2008, same store sales for the Fourth Quarterof Fiscal 2008 decreased by 6.2%. Sales across most categories were negatively impacted by the worseningeconomic conditions which resulted in consumers holding back discretionary spending during the holiday shoppingseason in the Fourth Quarter of Fiscal 2008. Home and hardlines categories sales decreased by 6.3% relative tothe Comparable 2007 fourth quarter with major appliances and home decor experiencing the largest salesdeclines, primarily driven by competitive pricing pressures. In spite of the economic downturn, electronicscontinued to exhibit healthy growth as sales increased 7.0% in the Fourth Quarter of Fiscal 2008 relative to theComparable 2007 fourth quarter due to the Company’s recharge initiatives in prior periods designed to provideproduct offerings, such as high-definition televisions and other electronics that are relevant to consumers’ needs.The Company also experienced sales growth in its seasonal hardlines, led by record snow blower sales. Appareland accessories categories sales declined 9.1% in the Fourth Quarter of Fiscal 2008 in relation to theComparable 2007 fourth quarter with the biggest sales declines in women’s and men’s wear due to increasedcompetitive pricing and difficult economic conditions.
Relative to the Comparable 2007 fourth quarter, the cost of merchandise sold, operating, administrative andselling expenses were 4.0% lower in the Fourth Quarter of Fiscal 2008 primarily driven by lower sales resultingin lower variable costs and continued improvements in managing costs partially offset by a reduction in grossmargin rates. Operating expenses declined due to a reduction in payroll and variable compensation expense, thebenefits of a cost sharing arrangement entered into by the Company with respect to marketing expenses and
Sears Canada Inc.20

lower advertising expenditures. The gross margin rate declined 156 basis points in the Fourth Quarter of Fiscal2008 relative to the Comparable 2007 period due to a combination of lower selling prices resulting frompromotional and price matching programs implemented to address the highly competitive environment and a shiftin the balance of sale from higher margin to lower margin products, such as electronics, offset by a significantreduction in inventory shrinkage due to the Company’s initiative to improve inventory management and tightenloss prevention and higher markdown and price protection subsidies resulting from successful vendor negotiations.Relative to the fourth quarter of the Restated 2007 year, the cost of merchandise sold, operating, administrativeand selling expenses decreased by 29.1% in the Fourth Quarter of Fiscal 2008 primarily due to the change infiscal year-end and there being an additional 5 weeks in the fourth quarter of the Restated 2007 fiscal year.
Depreciation and amortization expense was 4.6% lower in the Fourth Quarter of Fiscal 2008 relative to theComparable 2007 fiscal year, predominantly due to a $1.2 million asset impairment charge relating to fourunderperforming stores and there being lower capital expenditures in recent years. As compared to the Restated2007 fiscal year, depreciation and amortization decreased by 27.0% in the Fourth Quarter of Fiscal 2008primarily due to the change in fiscal year-end and there being an additional 5 weeks in the fourth quarter of theRestated 2007 fiscal year.
Interest expense declined by 364.7% relative to the Comparable 2007 fourth quarter as a result of a loweraverage debt balance being maintained throughout the year due to the repayment on maturity of the $125 milliondebenture in November 2007 and higher cash balances. When compared to the Restated 2007 fourth quarter,interest expense declined by 364.7% in the Fourth Quarter of Fiscal 2008 which is due to the above reasons aswell as the additional five weeks in the Restated 2007 fourth quarter.
Refer to Section 1f ‘‘Use of Non-GAAP Measures and Reconciliation of Net Earnings to Operating EBITDA’’ fora discussion of unusual items that occurred in the Fiscal 2008 and 2007 fourth quarter periods.
Income taxes decreased by 24.6% and 38.6% relative to the Comparable 2007 and Restated 2007 fourthquarters, respectively. The decrease in income tax expense for both the Comparable 2007 and Restated 2007periods is predominantly due to lower income. The effect of the lower income is further compounded by areduction in the statutory tax rates in Fiscal 2008 compared to the Comparable 2007 and Restated2007 periods.
2007 Compared with 2006 – Total revenues for the fourth quarter of Restated 2007 increased 22.5% comparedto the fourth quarter of Fiscal 2006 primarily due to the change in fiscal year-end and there being an additional5 weeks in the fourth quarter of the Restated 2007 fiscal year. On a Comparable Quarter basis relative to Fiscal2006, both total revenues and merchandise net sales decreased 3.4%, respectively. Higher revenues in the Dealer,Product Repair Services, Home Improvement, Cantrex and Corbeil channels were offset by lower revenues inother channels. Internet sales were 25.4% higher than the fourth quarter of Fiscal 2006.
Compared to the 18-week period ended February 3, 2007, same store sales for the fourth quarter of Restated2007 decreased 1.8%. Relative to the fourth quarter of Fiscal 2006, same store sales for the ComparableQuarter decreased 2.4%. The Company achieved 0.7% same store sales growth during the five weeks ofJanuary 2008 due to strength in the Home and Dealer channels largely due to strong performance in theelectronics, major appliances and outdoor power categories.
Relative to the fourth quarter of Fiscal 2006, the Company experienced challenges early in the fourth quarter ofRestated 2007 due to a number of factors, including an increase in cross-border shopping activity due to theappreciation of the Canadian dollar versus the U.S. dollar throughout 2007, softer economic conditions in theCanadian manufacturing sector, unseasonably warm weather in the fall of 2007 and continued difficulties withapparel product selection.
On a Comparable Quarter basis relative to Fiscal 2006, home and hardlines sales were 1.2% lower and sales inapparel and accessories were 6.2% lower in Restated 2007. Sales across most categories were negatively
2008 Annual Report 21

impacted by cross-border shopping and aggressive pricing in the marketplace in response to the higher value ofthe Canadian dollar. Toy sales were dampened by industry recalls, which created product selection andreplacement problems during the high-demand Christmas season, and competitive pricing. Higher sales inelectronics continued in the fourth quarter of Restated 2007 due to initiatives undertaken in prior quartersdesigned to improve the relevance of the Company’s product offerings to its customers, for example, LCD andplasma televisions. Large sales increases occurred in the fourth quarter in certain seasonal categories,particularly boots, children’s outerwear and snow blowers, due to early snow in many major markets that hadexperienced unseasonably warm weather in the same period in Fiscal 2006. Record snowfall in many Canadianmarkets prior to Christmas negatively impacted store traffic, but the potential sales loss was partially offset byincreased internet sales.
Compared to the fourth quarter of Fiscal 2006, the cost of merchandise sold, operating, administrative andselling expenses were 21.0% higher in the fourth quarter of Restated 2007. On a Comparable Quarter basis, thecost of merchandise sold, operating, administrative and selling expenses were approximately 5% lower relative tothe same period in Fiscal 2006 due to lower variable costs, as a result of lower revenues, and continuedimprovements in controlling costs. Advertising expense on a Comparable Quarter basis was higher relative to thesame period in Fiscal 2006 due to higher expenditures to support the additional Specialogues, increased preprintadvertising for home and hardlines initiatives and new programs directed to promote Sears Card and SearsMasterCard usage. Although slightly higher payroll expenses were incurred due to the Company’s strategicinitiatives, these expenses were offset by lower benefits costs due to the pension plan and post-retirement benefitsprogram changes announced in February 2007.
Relative to the fourth quarter of Fiscal 2006, the gross margin rate was 159 basis points higher in theComparable Quarter. The improvement in gross margin rate largely resulted from higher advertising subsidiesreceived from suppliers, improvements in the management of returns and promotional offers, benefits derivedfrom the appreciation of the Canadian dollar on imported products and related improvements in pricing fromvendors. These factors continued into January 2008 such that the gross margin rate in January 2008 was219 basis points higher than January 2007 which, when combined with higher sales and the inclusion of an extraweek in January 2008, contributed to the strong results for the month. In the fourth quarter of Restated 2007,the Company introduced its ‘‘Stronger Dollar – Lower Prices’’ initiative to permanently reduce prices to benefitcustomers and to mitigate increased cross-border shopping activity. The result was an improvement in sales and areduction in margins. During this time, Sears worked with its suppliers to obtain costs which more accuratelyreflected the higher value of the Canadian dollar.
Compared to the fourth quarter of Fiscal 2006, depreciation expense increased 15.6% in the fourth quarter ofRestated 2007. Relative to the fourth quarter of Fiscal 2006, for the Comparable Quarter, depreciation expensedeclined 11.1% due to lower capital expenditures in recent years.
For the fourth quarter of Restated 2007, earnings before interest, unusual items and income taxes increased40.0% compared to the fourth quarter of Fiscal 2006. For the Comparable Quarter, earnings before interest,unusual items and income taxes increased 15.9%.
As a result of proceeds received from the sale of real estate, a net higher cash balance generated fromoperations, and lower debt due to the repayment of the $125 million secured debenture in November 2007, theCompany earned interest income in the fourth quarter of 2007, compared to incurring net interest expense in thefourth quarter of Fiscal 2006.
Compared to the fourth quarter of Fiscal 2006, income taxes increased 66.0% for the fourth quarter ofRestated 2007. On a Comparable Quarter basis, income taxes increased 44.9% due to higher pre-tax operatingincome. Income taxes in the fourth quarter of Fiscal 2006 included a recovery of $6.7 million resulting from therecovery of a previously disclosed future income tax liability. As a result, the fourth quarter of 2007 had a highereffective tax rate than in Fiscal 2006.
Sears Canada Inc.22

2. Segment Performance
a. Merchandising Operations
i. Overview
The Company’s merchandising segment includes the sale of goods and services through the Company’s Retail andDirect channels. The Retail channel includes merchandise sales from the Company’s mall-based and off-mallformat stores. Sears store formats are either corporate or independently-owned and operated. The corporatestore formats include Full-line, Sears Home, Appliances and Mattresses, and Outlet stores. Sears Dealerlocations are independently operated stores offering a merchandise selection that reflects local demand, oftencontaining a catalogue merchandise pick-up location. The Direct channel encompasses catalogue and internetshopping at www.sears.ca. Merchandising operations also include service revenues related to travel and homeservices, which include home improvement products and services and a nationwide home maintenance, repair andservice network. Sears home improvement products and services include Floor Covering Centres and Sears HomeServices showrooms located within Sears Home stores. Merchandising is also supported by the Company’slogistics operations.
As described above, on February 24, 2008, the Company acquired the assets of Excell, which managed anetwork of air duct cleaning licensees for Sears across Canada. Excell operations are managed within the HomeServices network.
The Company’s locations were distributed across the country as follows:
As at As at As atJanuary 31, February 2, December 30,
2009 2008 2006Atlantic Quebec Ontario Prairies Pacific Total Total Total
Full-line department stores 12 27 46 22 15 122 121 123Sears Home stores 2 12 19 10 5 48 48 48Outlet stores 1 1 7 1 1 11 13 11Specialty type: Appliances & Mattresses /
Lands’ End – – 5 1 – 6 5 5
Corporate stores 15 40 77 34 21 187 187 187
Dealer stores 29 15 45 49 33 171 163 158
Sears Home Services Showrooms 1 3 6 1 2 13 14 14
Corbeil – 28 2 – – 30 30 29
Sears Floor Covering Centres 2 2 8 11 7 30 37 50
Cantrex Buying Group Members 69 314 203 120 118 824 825 847
Travel offices 7 20 44 20 15 106 106 106
Catalogue merchandise pick-up locations 262 459 531 457 149 1,858 1,826 1,898
In Fiscal 2008, the Company relocated its Centre Mall Full-line department store to Eastgate Square, both ofwhich were located in Hamilton, Ontario, relocated its Red Deer Parkland Mall Full-line store to Red Deer BowerPlace Shopping Centre, both of which were located in Red Deer, Alberta, closed two Outlet stores and convertedthe one Outlet store in Deerfoot, Alberta to a Full-line department store. The Company also opened 12 newDealer locations and closed four. New Dealer locations opened in Petawawa, Ontario, Blairmore, Alberta andGander, Newfoundland during the Fourth Quarter of Fiscal 2008. One Sears Home Services Showroom and sevenSears Floor Covering Centres were closed during Fiscal 2008. The reduction in Cantrex members in Fiscal 2008is due to the normal fluctuation of members choosing to source their inventory requirements through othermeans. Although the Company closed certain catalogue merchandise pick-up locations which were in close
2008 Annual Report 23

proximity to other Sears locations, the number of catalogue locations increased in Fiscal 2008 following theformation of the arrangement with The UPS Store, as described under Section 2.ii. ‘‘Strategic Initiatives – DirectChannel Business’’.
Retail Channels
Full-line Department Stores – Sears Full-line department stores are located primarily in suburban enclosedshopping centres. The major merchandise categories include the following:
Home & Hardlines – Major appliances, home furnishings and mattresses, home decor, lawn and garden,hardware, electronics and leisure and seasonal products.
Apparel & Accessories – Women’s, men’s and children’s apparel, nursery products, cosmetics, jewellery, footwearand accessories.
Although merchandise varies by store, the merchandise sales mix between the two major categories isapproximately 52% apparel and accessories and 48% home and hardlines.
Full-line department stores also offer home improvement products and services and include a Sears cataloguemerchandise pick-up location. Sears Travel offices and licensed businesses, such as optical centres and portraitstudios, are also located in most of the Company’s Full-line department stores.
Sears Home Stores – Sears Home stores are typically located in power centres and present an extensive selectionof furniture, mattresses and box-springs, electronics and major appliances. The majority of these stores range insize from 35,000 to 60,000 square feet. Home Improvement Products and Services operations are located within11 Sears Home stores and one Outlet store. The showrooms provide a range of products and services sold underthe Sears Home Services banner that are complementary to home furnishings and major appliances.
Appliances and Mattresses Stores – The Sears Appliances and Mattresses stores are part of the Company’sstrategy to bring its product categories to a growing number of customers who shop in conveniently locatedpower centres. These stores are smaller in size (approximately 10,000 to 15,000 square feet) and feature a wideselection of major appliances, mattresses and box-springs, and include Sears private labels and a variety ofnational brands.
Outlet Stores – Sears Outlet stores offer clearance merchandise, particularly from the Company’s Directchannels, as well as surplus inventory of big-ticket items from all channels.
Dealer Stores – Sears Dealer locations are independently operated and offer major appliances, furniture, homeelectronics, lawn and garden power products as well as a catalogue merchandise pick-up location. Selections varyby dealer – for example, mattress sets are offered in 112 Sears Dealer stores while 28 stores include furniture.Most Dealer stores are located in markets that had previously been served by a catalogue agent and continue tolack the population to support a Full-line department store.
Home Improvement Products and Services – Sears Home Improvement Products and Services are marketedthrough 88 Full-line department stores and 14 Sears Home Services� showrooms located within Sears Home andOutlet stores, by telephone at 1-800-4-MY-HOME (English) or 1-800-LE-FOYER (French) and online atwww.sears.ca. Sears Home Services provides a broad range of home services, including the sale, installation,maintenance and repair of heating and cooling equipment, roofing, doors and windows, flooring, windowcoverings and energy audits. In addition, home services such as kitchen and bathroom renovations, home security,carpet and upholstery cleaning, duct cleaning and maid services are offered.
Sears Canada Inc.24

Product Repair Services – Sears Product Repair Service is the largest and most comprehensive parts and servicenetwork in Canada, with over 1 million parts available and a network of more than 1,800 technicians andcontractors.
Floor Covering Centres – Sears Floor Covering Centres, a network managed by Cantrex, are independent,licensed centres that offer an assortment of broadloom and hard floor coverings.
Cantrex – Cantrex is the largest buying group in Canada, representing 825 independent retailers with over1,200 locations across Canada.
Corbeil – Corbeil is a major chain of appliance specialty stores located throughout Quebec and Eastern Ontario.There are 30 stores in the chain, 19 of which are franchised. The chain also includes one liquidation centre.Stores average approximately 6,500 square feet in size.
Travel – Sears Travel Service operates within 106 Sears Full-line department stores, 9 private travel agents, anonline travel service at www.searstravel.ca and 1-866-FLY-SEARS, which connects customers to the nearestgeographical branch as well as a Travel Consultant.
As at the end of the Fiscal 2008, Fiscal 2007 and Fiscal 2006 years, the gross square footage for corporatestore locations was as follows:
As at As at As atJanuary 31, February 2, December 30,
(square feet, millions) 2009 2008 2006
Full-line department stores 16.5 17.4 17.8Sears Home stores 2.2 2.2 2.2Outlet stores 0.9 1.1 0.9Appliances and Mattresses stores 0.1 0.1 0.1Corbeil 0.1 0.1 0.1
Total 19.8 20.9 21.1
Gross square footage for Full-line department stores decreased as at January 31, 2009 compared to February 2,2008 due to the relocation of the Hamilton, Ontario and Red Deer, Alberta Full-line department stores to smallerpremises, the conversion of the Calgary Deerfoot location from an Outlet to a Full-line department store and theconversion of some of the Toronto Eaton Centre Full-line department store retail space to office space. Thedecrease in gross square footage for Outlet Stores is attributable to the conversion of the Calgary Deerfoot Outletto Full-line department store space and the closure of the Brampton Shoppers World Outlet Store, in Brampton,Ontario.
Gross square footage for Full-line department stores decreased as at February 2, 2008 compared to as atDecember 30, 2006 due to the closure of the Full-line department stores in Calgary, Alberta and St. John’s,Newfoundland and Labrador. The increase in gross square footage for Outlet stores is attributable to the openingof two new stores in Brampton, Ontario and Scarborough, Ontario in the fourth quarter of Fiscal 2007.
Direct Channels
With two distribution centres exclusively dedicated to servicing the direct channels and with 1,858 cataloguemerchandise pick-up locations nationwide, Sears can deliver orders within 72 hours in most areas of the country.Orders can be placed by telephone at 1-800-26-SEARS, by mail, fax, online at www.sears.ca or in personthrough Sears stores and catalogue agents. At the end of Fiscal 2008, approximately 1,699 of the total1,858 catalogue merchandise pick-up locations were independently operated under independent local ownership,with the remaining 159 units located within Sears stores.
2008 Annual Report 25

Catalogue – In Fiscal 2008, 18 different catalogues were distributed throughout Canada reaching up toapproximately four million households. In addition, in Fiscal 2008, Sears launched 16 Specialogues designed tooffer more seasonally relevant merchandise to specific customers.
Sears.ca – The Company’s website, www.sears.ca, continues to be one of the leading online shopping destinationsin Canada. The website enables the Company to provide new and exciting merchandise offers direct to web andhighlights the Company’s extensive general catalogue selection. Sears is committed to maintaining its reputationas a trusted Canadian retailer by focusing on customer privacy, security and satisfaction when shopping onwww.sears.ca.
Logistics
Distribution Service Centres – Sears operates five distribution centres and one cross dock facility strategicallylocated across the country. The total floor area of these service centres was 6.3 million square feet at the end ofFiscal 2008, of which 5.4 million square feet is devoted to warehouse and logistics operations. The remainder ofthe space is utilized for other Sears operations, including call centre services.
S.L.H. Transport Inc. (‘‘SLH’’) – The Company’s wholly-owned subsidiary, SLH, transports merchandise tostores, catalogue merchandise pick-up locations and direct to customers. SLH is responsible for providinglogistics services for the Company’s merchandising operations by operating a fleet of tractors and trailers toprovide carrier services for Sears and contract carrier services to commercial customers who are unrelated toSears. The arrangements with third parties increase SLH’s fleet utilization and improve the efficiency of itsoperations. SLH continues to grow and has developed a nationwide distribution network to provide better andmore consistent service to its customers.
ii. Strategic Initiatives
Sears is committed to building customer relationships, increasing profitability and improving every day. TheCompany has undertaken several strategic merchandising initiatives to achieve these objectives, including:
Relevant and Current Product Assortment – The Company endeavours to produce profitable sales by increasingsales and volumes of product assortments that are relevant to its existing customers, while attracting newcustomers through innovative products and brands, including the Sears brand, private label brands andnon-proprietary brands exclusive to Sears. On a regular basis, the Company undertakes ‘‘recharges’’ to improveproduct selection, promotion, customer service and staff product knowledge. These initiatives also permit Searsto introduce new brands and substitute or discontinue existing brands. During Fiscal 2008, the Companycommenced recharges in: (i) electronics and video games; (ii) mattresses; (iii) home furnishings, includingfurniture for small spaces; (iv) the home decor category, where the Company intends to expand existing lines suchas Whole Home�; (v) the gift registry business, so as to offer a new in-store concept and an enhancedmerchandise selection that capitalizes on the Company’s breadth of product and service offerings, including homeimprovement products and services; and (vi) men’s wear. The Company expects to continue these recharges andto undertake similar initiatives in 2009.
Private Brand Growth – One of the Company’s most important strengths is the recognition and reputation of itsprivate-label brands, some of which include:
• Jessica�, Nevada�, Attitude�, Distinction�, Boulevard�, Tradition�, Protocol�, Retreat�, Alpinetek�, PureNRG�, Trendzone�, Baby Boots� and Whole Home�
The Company also has licenses from Sears, Roebuck and Co. (‘‘Sears Roebuck’’), a wholly-owned indirectsubsidiary of Sears Holdings, to use the following brands:
• Kenmore�, Craftsman�, DieHard� and Lands’ End�
Sears Canada Inc.26

In addition, the Company also has exclusivity relationships with many non-proprietary national brands. Byleveraging and building upon its portfolio of brands, the Company strives to deliver relevant products thatresonate with its customers and gives them additional reasons to continue to shop at Sears.
Pricing Strategy – The Company’s pricing strategy is anchored to its Value Strategy, which offers everyday valuewith an active promotional program. Sears Value Strategy focuses on solutions for the customer, fromcoordinating a particular look to providing easy-to-understand product benefits and features. This strategy allowsthe Company to increase the average transaction value and improve profitability.
In response to customer concerns about the worsening economic climate and continued focus on value for theirdollar, the Company introduced the ‘‘Budget Relief Price Drop’’ program. The program provides lower prices on awide selection of merchandise aimed to demonstrate to customers that they are getting the best prices forapparel and home products without having to lower their standards of quality. Sears Canada remains committedto providing customers with everyday value by routinely reviewing its regular and sale prices as well as rolling outinnovative incentives to maximize opportunities to grow profitability.
Product and Service Innovation – The Company strives to provide an innovative and exciting product assortmentand service selection that leverages the Company’s multi-channel capability. In Fiscal 2008, the Companyundertook several initiatives to introduce new businesses and products targeted to specific customer segments andlocal market opportunities, with a particular focus on its Home Improvement channel to meet the growingconsumer interest in energy efficient products and services. During the Fourth Quarter of 2008, the Company wasofficially granted a national license by Natural Resources Canada to conduct household energy audits in order toidentify energy saving opportunities that may also qualify for Federal and Provincial rebates in theirimplementation. The Company will be able to service the potential audit requirements for customers by providingEnergy Star� appliances, furnaces and windows, along with recommending new products. By also providingfinancing options, such as a new rental program for energy efficient furnaces, air conditioners and hot watertanks, the Company will make it easy for customers to make energy efficient choices. On June 4, 2008, theGovernment of Canada, through Natural Resources Canada, recognized Sears Canada with the Energy Star�Retailer of the Year award for the Company’s excellence and commitment to promoting Energy Star� appliances,electronics and heating, ventilation and air conditioning equipment.
Customer Segmentation – The Company offers focused merchandise selection to specific customer segments, oneof which is by way of Specialogues. The concept was expanded in Fiscal 2007 and has been continuedthroughout Fiscal 2008 during which time Sears leveraged its exclusive catalogue partnerships to increase theassortment of new product offerings. In Fiscal 2008, 16 Specialogues were produced, had a duration ofapproximately 15 weeks and averaged approximately 62 pages, compared to 12 Specialogues, averaging72 pages, during the fiscal year ended February 2, 2008.
During the third quarter of Fiscal 2008, as part of the Company’s regular ‘‘Back to School’’ initiative, Searslaunched pilot ‘‘pop-up’’ mobile retail locations at select Ontario universities, including Queen’s, Western,McMaster and Brock Universities. Each pop-up location was approximately 900 square feet and offered anassortment of essentials for university students, including housewares, home furnishings, home decor items andelectronics, as well as Sears Travel services and Sears MasterCard application capabilities. Sears will continuethis customer segmentation initiative where appropriate.
Direct Channel Business – One of the Company’s strengths is its multi-channel operations that permit anenhanced merchandise selection and a wide offering of services to consumers. In an effort to further enhance theconvenience of online and catalogue shopping, the Company entered into an arrangement to permit online andcatalogue purchases to be picked up at certain locations of The UPS Store where a catalogue pick-up locationdid not already exist. This arrangement is expected to provide a more consistent level of service and expandedhours of operations for customers in urban markets.
2008 Annual Report 27

In June 2008, the Company was the recipient of the Online Retailing Award from the Retail Council of Canada’sAnnual Excellence in Retailing Awards in recognition of the Company offering an outstanding e-retailingexperience at its website, www.sears.ca.
Loyalty Rewards Program – On December 11, 2008, the Company announced the introduction of instant pointredemption of Sears Club Points for gift cards. As a result, customers may redeem Sears Club Points with noredemption fee, from their Sears Card or Sears MasterCard in exchange for a gift card.
Productivity Improvement Initiatives – The Company continues to focus on expense management to improveprofitability while actively re-engineering internal processes and capabilities to improve efficiencies. In order toposition the Company to continue operating efficiently during a challenging economic environment, the Companyreduced its staffing levels in February 2009. A reduction of less than one percent of its workforce across theCompany was made with corresponding severance payments. The workforce reductions occurred at the Company’shead office across a variety of departments and at its repair business and are not expected to impact customerservice levels. The Company also completed the relocation of its head office operations to the vacant space abovethe Toronto Eaton Centre Full-line department store in the first quarter of the 2009 fiscal year. The relocation isexpected to result in improved efficiencies and an enhanced office environment.
iii. Results from Merchandising Operations
Since November 15, 2005, revenues and earnings from the credit card marketing and servicing alliance withJPMorgan Chase, including costs associated with the Company’s loyalty program, certain overhead expenses andthe remaining net assets of the former Credit and Financial Services operations, have been recorded in themerchandising segment. Refer to the Company’s Annual Reports from 2005 and prior years for historicalinformation pertaining to the revenues and earnings reported in the credit segment.
% Chg 2008 % Chg 2008 % Chg 2007Fiscal vs 2007 vs 2007 Comparable Restated Restated vs Fiscal
(in millions) 2008 Comparable Restated 2007* 2007** 2006 2006
Revenues $ 5,687.3 (1.9%) (9.3%) $ 5,795.7 $ 6,272.6 6.7% $ 5,880.1
Operating EBITDA*** $ 492.6 (0.3%) (3.2%) $ 493.9 $ 508.7 16.8% $ 435.4
* Comparable 2007 represents the 52-week period ended February 2, 2008, adjusted to reflect the change in fiscal year end; the adoption of the newaccounting standard for inventory; and the reversal of the impact of the restatement resulting from the change to the Company’s financial instrumentsaccounting policy choice regarding recognition of embedded derivatives.
** Restated 2007 represents the 57-week period ended February 2, 2008, restated to reflect the retrospective application of the change to the Company’sfinancial instruments accounting policy choice and adoption of new accounting standards for financial instruments.
***Please see Section 1f ‘‘Use of Non-GAAP Measures and Reconciliation of Net Earnings to Operating EBITDA’’ regarding use of non-GAAP measures.
2008 Compared with 2007 – Revenues from merchandising operations decreased 1.9% in Fiscal 2008 relative tothe Comparable 2007 fiscal year due to lower sales across the Full Line, Sears Home, Direct, Outlet, Corbeil andCantrex channels, which was partially offset by increased sales in the Dealer channel, which opened 12 newstores in Fiscal 2008. Service revenues increased 7.8% relative to the Comparable 2007 period due to improvedresults from Home Improvement Products Services, Sears Line Haul and delivery revenue partially offset bylower sales in Travel and Cantrex. Growth in internet sales remained positive, increasing 18.3% over theComparable 2007 period. As compared to the Restated 2007 fiscal year, revenues from merchandising operationsdecreased 9.3% primarily due to the change in fiscal year-end and there being an additional 5 weeks in theRestated 2007 fiscal year.
Sears Canada Inc.28

Same store sales declined 1.6% in Fiscal 2008 relative to the Comparable 2007 period as sales were negativelyimpacted by the worsening economic climate and declining consumer confidence, specifically in the fourth quarteras same store sales increased 0.3% for the first nine months of Fiscal 2008. Sales in home and hardlines inFiscal 2008 decreased by 0.7% relative to the Comparable 2007 period, with the biggest decline in the homedecor category. As a result of the Company’s recharge initiatives to expand and improve product assortment andrelevance for the needs of its consumers, electronics and mattresses continued to exhibit significant growth at19.6% and 13.3%, respectively, in relation to the Comparable 2007 period. The Company also experienced17.7% sales growth in seasonal hardware driven by record snow blower sales.
Sales in apparel and accessories categories decreased 6.2% in Fiscal 2008 relative to the Comparable 2007period. The general state of the economy and increased competitive landscape were factors that representedchallenges for all categories of apparel and accessories. In spite of these challenges, Sears national brands,seasonal footwear and outerwear experienced sales growth. The Company has addressed the challengesexperienced in Fiscal 2008 by reviewing assortment, focusing on strategic sourcing and inventory managementprocesses.
The cost of merchandise sold, operating, administrative and selling expenses were 2.0% lower in Fiscal 2008relative to the Comparable 2007 period primarily due to improvements in gross margin rates and a continuedfocus on managing expenses. Payroll expenses in Fiscal 2008 were flat relative to the Comparable 2007 period.Benefits expenses decreased due to lower variable compensation expenses. Advertising expense in Fiscal 2008was lower than the Comparable 2007 period partially due to the benefits from a cost sharing arrangemententered into by the Company with respect to certain marketing costs.
The gross margin rate for Fiscal 2008 improved 24 basis points and 76 basis points relative to the Comparable2007 and Restated 2007 periods, respectively. The improvement in gross margin rate for both periods ispredominantly due to significant improvement in inventory shrinkage and favourable exchange rates on importedmerchandise due to the Company’s foreign exchange hedging program.
Operating EBITDA decreased by 0.3% and 3.2% relative to the Comparable 2007 and Restated 2007 fiscalyears primarily driven by the decline in sales as noted above. The decline for both periods is primarily from thelast three months of the year as Operating EBITDA for the first nine months of Fiscal 2008 was up 13% and28.7% versus the Comparable 2007 and Restated nine-month periods.
2007 Compared with 2006 – Total revenues for Restated 2007 increased 6.7% compared to Fiscal 2006. On aComparable Year basis relative to Fiscal 2006, total revenues decreased 1.5%. Merchandise net sales were1.4% lower than Fiscal 2006 as higher revenues in the Sears Home, Dealer and Corbeil channels were offset bylower revenues in Full-line, catalogue and Outlet formats. Service sales declined 2.8% in 2007 relative to Fiscal2006. Improved results in Product Repair Services, Home Improvement Products and Services and Cantrexchannels were insufficient to offset softer sales in the travel and logistics operations. Internet sales for 2007 were27.7% higher than in Fiscal 2006.
On a Comparable Year basis, same store sales decreased 0.8%. Relative to the 57 weeks ended February 3,2007, same store sales for 2007 decreased 0.7%. For Restated 2007, sales in home and hardlines categoriesincreased 9.4% relative to Fiscal 2006. On a Comparable Year basis, sales in home and hardlines increased0.8%. Sales in Craftsman�, electronics and home furnishings categories were the strongest in 2007. TheCompany’s recharge initiatives to improve product relevance and assortment in mattresses and electronicsresulted in sales increases in these divisions. The arrival of snow in the fourth quarter of Restated 2007 helpedsales of snow blowers, which had been an underperforming product line in Fiscal 2006 due to a lack of snow.Relative to Fiscal 2006, major appliance sales were flat in 2007. Increased competition and aggressive pricingwas a constant factor impacting major appliances throughout 2007 and these pressures intensified following theCanadian dollar reaching parity with the U.S. dollar on September 20, 2007. During Restated 2007, theCompany increased its focus on select leisure and seasonal product offerings, including an expansion of outdoorliving furniture. Toy sales were adversely impacted by industry recalls, which resulted in shortages and product
2008 Annual Report 29

replacement challenges in the important holiday season, and competitive pricing. Results in home decor inRestated 2007 were negatively impacted by the reduction of floor space in favour of the electronics rechargeinitiative and increased cross-border shopping activity in the fourth quarter of Restated 2007.
Sales in apparel and accessories categories increased 1.8% in 2007 compared to Fiscal 2006. On a ComparableYear basis, sales for apparel and accessories categories declined 4.5% relative to Fiscal 2006. Sales across mostcategories were negatively impacted by cross-border shopping and aggressive pricing in the marketplace inresponse to the higher Canadian dollar. As a result of early snow in the fourth quarter of 2007 in many majormarkets, large sales increases occurred in certain seasonal categories relative to the fourth quarter of Fiscal2006 which experienced unseasonably warm weather. In response to challenges experienced with the Company’s2007 spring and summer apparel product selection and unseasonably warm weather, strategic sourcing andinventory management initiatives were undertaken in the latter half of 2007.
Compared to Fiscal 2006, the cost of merchandise sold, operating, administrative and selling expenses were5.9% higher in Restated 2007. Relative to Fiscal 2006, the cost of merchandise sold, operating, administrativeand selling expenses were 2.4% lower in the Comparable Year due to improvements in controlling costs. Basedon a similar 52-week period, payroll expenses in 2007 were flat to Fiscal 2006. Benefits expenses declined dueto the pension plan and post-retirement benefits program changes announced in February 2007. Advertisingexpenses increased modestly in 2007 relative to Fiscal 2006 to support initiatives including the ‘‘StrongerDollar – Lower Prices’’ program, additional flyers to support the Company’s merchandising initiatives and Homestores, the higher number of Specialogues produced in 2007 and initiatives undertaken with respect to the SearsCard and Sears MasterCard.
The gross margin rate for Restated 2007 was 73 basis points higher than for Fiscal 2006. On a ComparableYear basis, the gross margin rate in 2007 was 65 basis points higher than in Fiscal 2006. For both 2007 andFiscal 2006 periods, the improvement in gross margin rate largely results from higher advertising and markdownsubsidies received from suppliers, improvements in the management of receipts, returns and promotional offersand benefits derived from the appreciation of the Canadian dollar on imported products and relatedimprovements in pricing from vendors.
b. Real Estate Joint Venture Operations
i. Overview
As at January 31, 2009, Sears had joint venture interests in 12 shopping centres across Canada. The Companycarries the proportionate share of these interests in its consolidated financial statements. Joint venture interestsrange from 15% to 50% and are co-owned with major shopping centre owners. Sears is not involved in theday-to-day management of the shopping centres but is actively involved in all major decisions.
ii. Strategic Initiatives
The primary objective of the Company’s real estate joint venture operations is to maximize the returns on itsinvestments in shopping centre real estate. Sears reviews the performance of these joint ventures on a regularbasis. Shopping centre investments are non-core assets that the Company sells when it is financially advantageousto do so. Similarly, the Company may also develop excess land within these real estate holdings and shoppingcentre joint venture investments when it is advantageous to do so.
Sears Canada Inc.30

iii. Results from Real Estate Joint Venture Operations
% Change % ChangeFiscal 2008 vs Fiscal 2008 vs % Chg 2007
Fiscal 2007 2007 Comparable Restated Restated vs Fiscal(in millions) 2008 Comparable Restated 2007* 2007** 2006 2006
Revenues $ 45.9 (6.7%) (14.7%) $ 49.2 $ 53.8 2.1% $ 52.7
Operating EBITDA*** $ 24.4 (11.9%) (18.9%) $ 27.7 $ 30.1 3.4% $ 29.1
* Comparable 2007 represents the 52- week period ended February 2, 2008, adjusted to reflect the change in fiscal year end; the adoption of the newaccounting standard for inventory; and the reversal of the impact of the restatement resulting from the change to the Company’s financial instrumentsaccounting policy choice regarding recognition of embedded derivatives.
** Restated 2007 represents the 57- week period ended February 2, 2008, restated to reflect the retrospective application of the change to theCompany’s financial instruments accounting policy choice and adoption of new accounting standards for financial instruments.
***Please see Section 1f ‘‘Use of Non-GAAP Measures and Reconciliation of Net Earnings to Operating EBITDA’’ regarding use of non-GAAP measures.
2008 Compared to 2007 – For Fiscal 2008, revenues for real estate joint venture operations decreased by 6.7%and operating EBITDA decreased by 11.9% in relation to the Comparable 2007 period as a result of theCompany’s disposition of its interests in the Place Vertu shopping centre in Montreal, Quebec in the first quarterof Restated 2007 and the Heritage Place shopping centre in Owen Sound in the third quarter of Restated 2007.
In 2005 and prior years, it was the Company’s practice to have one-third of the properties independentlyappraised each year, with the appraisals of the remaining two-thirds being reviewed and updated by management.In Fiscal 2008 and Restated 2007, no independent appraisals were conducted. According to the last appraisalundertaken in 2005, the market value of the Company’s interest in its real estate joint venture properties wasestimated to be approximately $293.4 million, giving consideration to the sale of the Heritage Place and PlaceVertu joint venture interests in Restated 2007. The Company’s portion of the debt of these properties was$61.6 million at the end of Fiscal 2008 (Restated 2007: $67 million, Fiscal 2006: $109 million).
Of the 12 shopping centres, 10 contain a Sears Full-line department store. Revenues for Fiscal 2008 in the tableabove exclude $2.2 million which represents the Company’s proportionate share of revenues earned from theSears Full-line department stores.
2007 Compared to 2006 – For Restated 2007, revenues for real estate joint venture operations increased 2.1%and Operating EBITDA increased 3.4% compared to Fiscal 2006. On a Comparable Year basis relative to Fiscal2006, revenues from real estate joint venture operations decreased 5.3% and earnings before interest, unusualitems and income taxes decreased 5.7% due primarily to the disposition of the Place Vertu and Heritage Placeshopping centre interests in the first and third quarters of 2007, respectively.
Of the 12 shopping centres, 10 contain a Sears Full-line department store. Revenues for Restated 2007 in thetable above exclude $2.3 million (Fiscal 2006: $2.5 million) which represent the Company’s proportionate shareof revenues earned from the Sears Full-line department stores. The Company’s proportionate share of revenuesfor the Comparable Year is $2.2 million.
In the third quarter of Fiscal 2007, the Company sold its proportionate interest in the Heritage Place shoppingcentre joint venture in Owen Sound, Ontario. In the first quarter of Fiscal 2007, the Company disposed of itsproportionate interest in the Place Vertu shopping centre in Montreal, Quebec. See Section 1f ‘‘Use ofNon-GAAP Measures and Reconciliation of Net Earnings to Operating EBITDA’’ for full details about thesetransactions.
2008 Annual Report 31

3. Liquidity and Financial Position
Current assets as at January 31, 2009 were $275.4 million greater than at February 2, 2008 due largely to thenet effect of higher cash, restricted cash and investment balances, accounts receivable, income taxes recoverable,inventories, prepaid expenses and other assets. The increase in restricted cash and investment balances representsassets pledged as collateral relating to the Company’s U.S. $120 million letter of credit facility issued under theCompany’s offshore merchandise purchase program, cash deposits pledged as collateral with counterpartiesrelated to outstanding derivative contracts and funds held in trust in accordance with regulatory requirementsgoverning advance ticket sales related to Sears Travel.
As at January 31, 2009, inventory was $968.3 million, compared to $879.7 million at February 2, 2008. Thehigher inventory balance at the end of Fiscal 2008 is a direct result of the retrospective adoption of CICAHandbook Section 3031 ‘‘Inventories’’ (‘‘Section 3031’’), without restatement of prior period amounts. Theimpact of measuring inventories under the new standard is an increase to the carrying amount of openinginventories as at February 3, 2008 of $85.4 million to $965.1 million. Refer to Section 9 ‘‘Accounting Policiesand Estimates’’ for further details on this change in accounting policy.
Prepaid expenses and other assets include the market value adjustment of the Company’s foreign exchangecontracts. See Section 5 ‘‘Financial Instruments and Off-Balance Sheet Arrangements’’ for further details on theCompany’s foreign exchange contracts.
As at January 31, 2009, the ratio of current assets to current liabilities was 2.1:1 compared to 1.6:1 atFebruary 2, 2008 and 1.2:1 at December 30, 2006. At January 31, 2009, the Company’s net working capitalwas $1,172.5 million compared to the $777.1 million for the restated February 2, 2008 period and$373.2 million at December 31, 2006. See Section 4 ‘‘Capital Resources’’, Section 5 ‘‘Financial Instrumentsand Off-Balance Sheet Arrangements’’, and Section 6 ‘‘Funding Costs’’ of this MD&A, as well as the Notes tothe Consolidated Financial Statements, for information about the Company’s long-term financing obligations andits ability to access funds.
Total assets as at the end of the Fiscal 2008, Fiscal 2007 and Fiscal 2006 years are as follows:
Fiscal Restated Fiscal(in millions, as at fiscal year end) 2008* 2007** 2006*
Total assets $3,264.7 $3,001.7 $3,060.3
* Fiscal 2008 represents the 52-week period ended January 31, 2009. Fiscal 2006 represents the 52-week period ended December 30, 2006.** Restated 2007 represents the 57-week period ended February 2, 2008, restated to reflect the retrospective application of the change to the Company’s
financial instruments accounting policy choice and adoption of new accounting standards for financial instruments.
Relative to February 2, 2008, the $263 million increase in total assets as at January 31, 2009 is primarily dueto higher current assets noted above partially offset by lower capital assets.
Relative to December 30, 2006, the decrease in total assets as at February 2, 2008 is primarily due to lowercapital assets and the utilization of the future income tax assets. In addition, the cash balance at February 2,2008 is lower than that at December 29, 2007 due to the seasonal use of cash to extinguish trade payables andincome taxes. The change in year end date results in certain differences to non-cash balances and seasonalaccrued liabilities, such as gift card obligations. Had the Company maintained a comparable December 2007 yearend, total assets would have been higher than as at December 30, 2006 as a result of higher inventory and cashand short-term investments balances offsetting lower prepaid expenses, deferred charges and lower capital assets.
Cash Flow from Operating Activities – Cash flow generated from operations was $165.9 million, $59.4 millionlower in Fiscal 2008 compared to $225.3 million in Restated 2007. This decline in cash flow from operatingactivities is primarily driven by lower net earnings excluding non-cash items partially offset by favourable changesin working capital balances due in part to the Company’s efforts in improving inventory management as well as
Sears Canada Inc.32

timing of payments. See Note 11 ‘‘Changes in Non-cash Working Capital Balances’’ of the Notes to theConsolidated Financial Statements’’ for further details on non-cash working capital balances.
Cash flow generated from operations was $31.1 million lower in Restated 2007 compared to Fiscal 2006 due tothe seasonal working capital differences resulting from the change in year end and lower pension contributions inRestated 2007 offsetting higher operating earnings, excluding the non-cash gains from the disposition of certainreal estate and joint venture interests.
Cash Flow used for Investing Activities – Cash flow used for investing activities was $210.2 million in Fiscal2008 compared to $56.2 million of cash flow generated from investing activities in Restated 2007. During Fiscal2008, the Company received approximately $40 million in proceeds from the sale of the Calgary, Albertaproperty, used $7 million to acquire the assets of Excell and used $96.6 million for capital expenditures. DuringRestated 2007, the Company received proceeds of $108.9 million from the sale of corporate assets and theCompany’s interest in the Place Vertu shopping centre, offset by capital expenditures of $54.6 million.
During Restated 2007, the Company classified $3 million of Canadian third party asset backed commercial paper(‘‘ABCP’’) as a long-term investment. The ABCP was replaced by long-term notes in January 2009 which arevalued at $1.6 million at January 31, 2009. A $1.0 million non-cash impairment charge was recorded in Fiscal2008 in addition to the $0.4 million charge recorded in Restated 2007. Any subsequent change in value mayresult in a charge to earnings.
Cash paid for capital expenditures was $96.6 million in Fiscal 2008, versus $54.6 million in Restated 2007 and$3.4 million below the $100 million program anticipated by the Company at the end of Fiscal 2007. Capitalexpenditures in Fiscal 2008 included $33.5 million for expansions, relocations and other store-based initiatives,of which approximately $17 million was for the relocation of the Company’s head quarters to the Toronto EatonCentre, $31.1 million for corporate development initiatives, $11.6 million for information technology upgrades,$10.4 million for logistics services and $10 million for other varied projects. The Company regularly reviewsanticipated capital expenditures to ensure that acceptable returns will be generated from the invested funds andwill increase or decrease the program accordingly.
The change in restricted cash represents cash and investments pledged as collateral for letter of credit obligationsissued under the Company’s offshore merchandise purchase program, cash deposits pledged as collateral withcounterparties related to outstanding derivative contracts and funds held in trust in accordance with regulatoryrequirements governing advance ticket sales related to Sears Travel.
Cash Flow used for Financing Activities – Cash flow used for financing activities in Fiscal 2008 was $7.5 milliondue to the regular repayment of capital lease obligations and refinancing of joint venture long-term debt.
Cash flow used for financing activities in Restated 2007 was $132.8 million due to the repayment of the$125 million secured 6.55% debentures in November 2007 and the regular repayment of capital leaseobligations.
Share Data – The only shares of the Company outstanding are common shares. The number of outstandingcommon shares at the end of the Fiscal 2008, Fiscal 2007 and Fiscal 2006 years is as follows:
Restated(as at fiscal year-end) Fiscal 2008* 2007** Fiscal 2006*
Outstanding shares 107,620,995 107,620,995 107,620,995
* Fiscal 2008 represents the 52-week period ended January 31, 2009. Fiscal 2006 represents the 52-week period ended December 30, 2006.** Restated 2007 represents the 57-week period ended February 2, 2008, restated to reflect the retrospective application of the change to the Company’s
financial instruments accounting policy and adoption of new accounting standards for financial instruments.
In Fiscal 2008 and Restated 2007, there were no common shares issued upon the exercise of options pursuant tothe Employees Stock Plan.
As at March 24, 2009, there are 107,620,995 common shares outstanding and 149,285 tandem award optionsoutstanding under the Employees Stock Plan.
2008 Annual Report 33

Contractual Obligations – Contractual obligations, including payments due over the next five years and thereafter,are shown in the following table:
Payments Due by Period
2010 to 2012 to 2014 &(in millions, as at year-end) Total 2009 2011 2013 beyond
Long-term debt (excluding capital lease obligations) $ 362 $ 31 $ 314 $ 6 $ 11
Capital lease obligations 3 1 1 1 0
Operating leases 712 110 183 142 277
Royalty license fees1 14 6 8 – –1 The Company pays royalties under various merchandise license agreements, which are generally based on sales of products covered under these
agreements. The Company currently has license agreements for which it pays royalties, including those to use the Arnold Palmer, Nygard, Roots andPierre Cardin trademarks. Royalty license fees represent the minimum Sears Canada is obligated to pay, regardless of sales, as guaranteed royaltiesunder these license agreements.
Future Benefit Plans – In Fiscal 2008, the net expense incurred relating to the Company’s obligations forpensions and post-retirement benefits was $24.2 million, a decrease of approximately $4.7 million from$28.9 million in Restated 2007.
See Note 1 ‘‘Summary of Accounting Policies and Estimates’’ and Note 6 ‘‘Associate Future Benefits’’ in theNotes to the Consolidated Financial Statements for a description of the Company’s benefit plans.
The last actuarial funding valuation report of the Sears Registered Retirement Plan (‘‘SRRP’’) is as ofDecember 31, 2007 filed with the Financial Services Commission of Ontario. The next required valuation reportto be filed is as of December 31, 2010. These reports determine the amount of cash contributions that theCompany is required to contribute into the SRRP. The December 31, 2007 funding report showed the SRRP tobe in a surplus position. As the SRRP pension fund assets consist of a mix of bonds and equities, recent marketconditions have reduced the market value of the pension fund assets from a surplus as at December 31, 2007into a solvency deficit position. If this reduced level of pension fund assets persists to the date of the nextfunding valuation report of the SRRP, to be filed as of December 31, 2010, then the Company would likely berequired to begin making cash funding contributions to the SRRP in 2011.
The asset allocation for the Company’s pension fund assets may be changed from time to time in terms ofweighting between fixed income, alternative investments, equity and other asset classes as well as within the assetclasses themselves. The plan’s target allocation is determined taking into consideration the amounts and timing ofprojected liabilities, the Company’s funding policies and expected returns on various asset classes. To develop theexpected long-term rate of return on assets assumption, the Company considered the historical returns and thefuture expectations for returns for each asset class, as well as the target asset allocation of the pension portfolio.In Fiscal 2008, the Company’s revised asset allocation for the pension fund contributed to the assets performingbetter than comparable market indices and assisted in mitigating the decline in the broad financial marketsin 2009.
4. Capital Resources
The Company’s capital expenditures, working capital needs, debt repayment and other financing needs are fundedprimarily through cash generated from operations. In selecting appropriate funding choices, the Company’sobjective is to manage its capital structure in such a way as to diversify its funding sources while minimizing itsfunding costs and risks. Sears expects to be able to satisfy all of its financing requirements through cash onhand, cash generated by operations and available credit facilities. The Company’s cost of funds is affected by avariety of general economic conditions, including the overall interest rate environment, as well as the Company’sfinancial performance, credit ratings and fluctuations of its credit spread over applicable reference rates.
Sears Canada Inc.34

The Company regularly monitors its sources and uses of cash and its level of cash on hand, and considers themost effective use of cash on hand including, for the repayment of obligations, potential acquisitions, stockpurchases and dividends.
During Fiscal 2008, the Company’s secured $200 million revolving credit facility expired, resulting in the release ofthe assets which had been pledged as security. The revolving facility had been solely used to support the Company’soffshore merchandise purchasing program and was replaced by a U.S. $120 million letter of credit facility.
As at January 31, 2009, outstanding letters of credit of $92.0 million were issued under the Company’s offshoremerchandise purchasing program, as compared to $65.3 million as at February 2, 2008.
In September 2006, Moody’s Investors Service, Inc. (‘‘Moody’s’’) issued a corporate family rating for SearsCanada of Ba1 as a result of Moody’s implementation of a new rating methodology. In December 2007,Standards & Poor’s (‘‘S&P’’) reduced the Sears Canada rating to BB from BB+ and again in December 2008 toBB�. There were no changes to the Dominion Bond Rating Service (‘‘DBRS’’) or Moody’s ratings in Fiscal 2007.The Company’s corporate credit rating is influenced by the financial position of Sears Holdings, the Company’smajority shareholder, and may not reflect the independent credit risk profile of Sears Canada. These non-investmentgrade credit ratings may limit future access to capital markets or adversely affect the cost of borrowing.
5. Financial Instruments and Off-Balance Sheet Arrangements
Interest Rate and Currency Instruments – The Company mitigates the risk of currency fluctuations on offshoremerchandise purchases made in U.S. currency by purchasing U.S. dollar denominated derivative contracts for aportion of its expected requirements. The Company’s forecast for its total requirement of U.S. currency in 2009is in the range of $400 to $500 million. As at January 31, 2009, there were U.S. dollar denominated foreignexchange contracts with a total notional value of U.S. $457.4 million (Restated 2007: U.S. $20 million) withsettlement dates over the next 19 months. In addition, the Company is subject to foreign exchange risk onU.S. dollar denominated short-term investments pledged as collateral for U.S. dollar denominated letter of creditobligations issued under the Company’s offshore merchandise purchasing program. As at January 31, 2009, therewere swap contracts outstanding with a notional value of U.S. $90.0 million with settlement dates matching theexpected term of the outstanding obligations.
6. Funding Costs
The funding costs for both the Company and off-balance sheet borrowings in Fiscal 2008, Fiscal 2007 and Fiscal2006 years are outlined in the table below:
Restated(in millions) Fiscal 2008* 2007** Fiscal 2006*
Interest costsTotal long-term obligations at end of fiscal year1 $ 364.6 $ 372.1 $ 542.3Average long-term obligations for fiscal year 369.5 489.3 728.5Long-term funding cost2 28.5 41.0 65.5Average rate of long-term funding3 7.7% 7.7% 7.6%
* Fiscal 2008 represents the 52-week period ended January 31, 2009. Fiscal 2006 represents the 52-week period ended December 30, 2006.** Restated 2007 represents the 57-week period ended February 2, 2008, restated to reflect the retrospective application of the change to the Company’s
financial instruments accounting policy choice and adoption of new accounting standards for financial instruments.1 Includes principal payments due within one year.2 Amount for 2006 includes $8.9 million to settle cross-currency interest rate swaps and $0.9 million to write-off previously capitalized debt issue costs.3 For Fiscal 2006, the average rate of long-term funding excludes the $8.9 million to settle the cross-currency interest rate swaps and the $0.9 million
to write-off previously capitalized debt issue costs. Including these amounts in the Fiscal 2006 figures results in an average rate of long-term fundingof 8.9%.
2008 Annual Report 35

The fixed-to-floating funding ratio as at January 31, 2009 was 91/9 (Restated 2007: 96/4 and Fiscal 2006:73/27). Fixed rate debt maturing in the next 12 months is considered floating rate funding for the purposes ofthis calculation, resulting in an unusually high level of floating rate funding at the end of Fiscal 2006.
Funding costs decreased in Fiscal 2008 compared to Restated 2007 due to a lower average debt balance beingmaintained throughout the year resulting from the repayment on maturity of the $125 million debenture inNovember 2007.
Funding costs decreased in Restated 2007 compared to Fiscal 2006 due to a lower average debt balance beingmaintained throughout the year resulting from the repayment of the US $260 million term loan inSeptember 2006, the repayment on maturity of the $125 million debenture in November 2007 and theassumption of long-term debt by the purchasers of interests in the two real estate joint ventures sold duringFiscal 2007.
See Section 4 ‘‘Capital Resources’’ for a description of the Company’s funding sources and credit ratings.
7. Related Party Transactions
As at March 24, 2009, Sears Holdings and its affiliates are the beneficial holders of 78,488,690 common sharesof the Company, representing approximately 73% of the outstanding common shares of the Company.
In the ordinary course of business, the Company and Sears Holdings periodically share selected services,associates, and tangible and intangible assets. Transactions between the Company and Sears Holdings arerecorded either at fair market value or an appropriate allocation method that reflects the relative benefits derivedfrom the shared service.
Intangible Properties
The Company has a license from Sears Roebuck to use the name ‘‘Sears’’ as part of its corporate name. TheCompany also has licenses from Sears Roebuck to use other brand names, including Lands’ End�, Kenmore�,Craftsman�, and DieHard�. Sears Canada pays Sears Holdings a stipulated royalty for the use of the Lands’ Endtrademark. The Company has established procedures to register and otherwise vigorously protect its intellectualproperty, including the protection of the Sears Roebuck trademarks used by the Company in Canada.
Import Services
Pursuant to an agreement between Sears Roebuck and the Company dated January 1, 1995, Sears Canadautilizes the international merchandise purchasing services of Sears Holdings. Sears Holdings may provideassistance to the Company with respect to monitoring and facilitating the production, inspection and delivery ofimported merchandise and the payment to vendors. Sears Canada pays Sears Holdings a stipulated percentage ofthe value of the imported merchandise. In Fiscal 2008, Sears Canada paid $7.3 million to Sears Holdings inconnection with this agreement, as compared to $7.6 million in Fiscal 2007.
Review and Approval
All related party transactions are reviewed by the Corporation’s Audit Committee. The Audit Committee isresponsible for pre-approving all related party transactions that have a value greater than $1 million.
8. Company Initiated Purchases and Sales of Shares
a. Employee Profit Sharing Plan
The Sears Plan for Sharing Profits with Employees (‘‘Employee Profit Sharing Plan’’), established in 1976, wasdiscontinued on January 1, 2005. Upon the announcement of the discontinuance of the plan, members had theoption to retain or sell their common shares of the Company held in the plan. As at January 31, 2009, there
Sears Canada Inc.36

were 9,167 (Restated 2007: 11,055) outstanding common shares in the tax deferred portion of the EmployeeProfit Sharing Plan.
b. Stock Option and Share Purchase Plans for Employees and Directors
The Company has three stock-based compensation plans: the Employees Stock Plan, the Stock Option Plan forDirectors and the Directors’ Share Purchase Plan.
The Employees Stock Plan, which expired on April 19, 2008, provided for the granting of options and SpecialIncentive Shares and Options, which vested over three years and expired ten years from the grant date. TheEmployee Stock Plan permits the issuance of tandem awards. Following the last grant in 2004, the Companydiscontinued the granting of options and Special Incentive Shares and Options under the Employees Stock Plan.
The Stock Option Plan for Directors provides for the granting of stock options to Directors who are notemployees of the Company or Sears Holdings. Options granted under the Stock Option Plan for Directorsgenerally vest over three years and are exercisable within ten years from the grant date. No stock options havebeen granted under the Stock Option Plan for Directors since the last grant in 2003.
The Directors’ Share Purchase Plan provides for the granting of common shares to Directors, to be purchased bythe Company on the TSX, as part of their annual remuneration for services rendered on the Board. Following thelast grant in 2005, the Company has discontinued the granting of shares under the Directors’ SharePurchase Plan.
9. Accounting Policies and Estimates
a. Critical Accounting Estimates
The preparation of financial statements requires the Company to estimate the effect of various matters that areinherently uncertain as of the date of the financial statements. Each of these required estimates vary in regard tothe level of judgment involved and its potential impact on the Company’s reported financial results. Estimatesare deemed critical when a different estimate could have reasonably been used or where changes in the estimateare reasonably likely to occur from period to period, and would materially impact the Company’s financialcondition, changes in financial condition or results of operations. The Company’s significant accounting policiesare discussed in the Notes to the Consolidated Financial Statements and critical estimates inherent in theseaccounting policies are discussed in the following paragraphs.
Inventory Valuation – In Fiscal 2008, the Company implemented the new Canadian Institute of CharteredAccountants (‘‘CICA’’) Handbook Section 3031 ‘‘Inventories’’ and changed its inventory measurement policy(Note 1: Changes in Accounting Policies). Beginning in Fiscal 2008, inventories are valued at the lower of costand net realizable value. Net realizable value is the estimated selling price in the ordinary course of business lessthe estimated costs necessary to make the sale. Cost is determined using the weighted average cost method,based on individual items. Prior to Fiscal 2008 inventories were valued at the lower of cost and net realizablevalue less normal profit margin. The determination of cost has not changed after the implementation of the newstandard. A provision for shrinkage and obsolescence is calculated based on historical experience. Managementreviews the entire provision to assess whether, based on economic conditions, it is adequate.
The Company classifies rebates and other consideration received from a vendor as a reduction to the cost ofinventory unless the rebate clearly relates to the reimbursement of a specific expense.
Revenue Recognition – Revenues from merchandise sales and services are reported net of estimated futurereturns and allowances, exclude sales taxes and are recorded upon delivery to the customer and when allsignificant obligations of the Company have been satisfied. The reserve for returns and allowances is calculatedas a percentage of sales based on historical return percentages. Commissions earned on sales made by licensed
2008 Annual Report 37

businesses are also included as a component of merchandise sales and services. Revenues relating to the travelbusiness and licensed department businesses are recorded as revenue net of cost of sales.
The Company sells extended service contracts with terms of coverage between 12 and 60 months. Revenues fromthe sale of these contracts are deferred and amortized on a straight-line basis over the term of the relatedcontract.
Income from JPMorgan Chase, which is based on a percentage of sales charged on the Sears Card or SearsMasterCard and a percentage of the sales of financial products, is included in revenue when the sale occurs.Payments from JPMorgan Chase to reimburse the Company for the cost to generate new accounts and processaccount payments are recorded as an offset to operating, administrative and selling expenses when thetransaction occurs.
Joint venture revenues are recorded based on monthly rentals.
Vendor Allowances – The Company receives allowances from its vendors through a variety of programs andarrangements, including co-operative advertising and markdown reimbursement programs. Given the promotionalnature of the Company’s business, the allowances are generally intended to offset the Company’s costs ofpromoting, advertising and selling the vendors’ products in its stores. Vendor allowances are recognized as anincrease in gross margin when the purpose for which the vendor funds were intended to be used has beenfulfilled. Co-operative advertising allowances are reported in the period in which the advertising occurred.Markdown reimbursements are reported in the period in which the related promotional markdown was taken, andall other allowances are reported when the related inventory is sold.
Self-Insurance Reserves – The Company purchases third-party insurance for automobile, product and generalliability claims that exceed a certain dollar level. However, the Company is responsible for the payment of claimsunder these insured limits. In estimating the obligation associated with incurred losses, the Company utilizes lossdevelopment factors validated by an independent third party. These development factors utilize historical data toproject the future development of incurred losses. Loss estimates are adjusted based upon actual claimssettlements and reported claims. During Fiscal 2006, the Company revised certain assumptions used to calculatethe insurance reserve based on claims experience. The net impact was a reduction to pre-tax earnings for Fiscal2006 due to an increase in the insurance reserve. During the Fiscal 2008 and Fiscal 2007 years, there were nochanges in assumptions which materially impacted the reserve.
Defined Benefit Retirement Plans – The plan obligations and related assets of defined benefit retirement plansare presented in the Notes to the Consolidated Financial Statements. Plan assets consist primarily of cash,alternative investments and marketable equity and debt instruments. Marketable equity and debt instruments arevalued using market quotations. Alternative investments are valued based on the market quotations of theunderlying assets. For more details about the plan, see Section 3 ‘‘Liquidity and Financial Position – FutureBenefit Plans’’. For details about the variability of the plan, see Section 10 ‘‘Risks and Uncertainties’’.
Loyalty Program Reserves – The Sears Club and Colours loyalty card programs (the ‘‘Program’’) allow membersto earn points from eligible purchases made on the Sears Card and Sears MasterCard. Members can then redeempoints, in accordance with the Program rewards schedule. When points are earned by Program members, theCompany records an expense and establishes a liability for future redemptions by multiplying the number ofpoints outstanding by the estimated cost per point. The Program liability is included in accrued liabilities on theCompany’s consolidated balance sheets. The cost of Program redemptions is charged against the liability account.The estimated cost per point is determined based on many factors, including the historical redemption behavior ofProgram members, expected future redemption patterns and associated costs. The Company continues to evaluateand revise certain assumptions used to calculate the Program reserves based on redemption experience andexpected future activity. To the extent that estimates differ from actual experience, the Program costs could behigher or lower. During Fiscal 2006, a decrease in the Program reserve resulted in a net increase to pre-tax
Sears Canada Inc.38

earnings. During Fiscal 2007 and Fiscal 2008, there were no changes in assumptions which materially impactedthe reserve.
Other Estimates – The Company has made certain other estimates that, while not involving the same degree ofjudgment, are important to understanding the Company’s financial statements. These estimates are in the areasof assessing recoverability of long-lived assets (including intangible assets) and in establishing reserves inconnection with restructuring initiatives, taxes, environmental remediation and other unusual items. On anongoing basis, management evaluates its estimates and judgments in these areas based on its substantialhistorical experience and other relevant factors. Management’s estimates as of the date of the financialstatements reflect its best judgment giving consideration to all currently available facts and circumstances. Assuch, these estimates may require adjustment in the future, as additional facts become known or ascircumstances change.
b. Accounting Standards Implemented in Fiscal 2008
During Fiscal 2008, Sears adopted several new accounting pronouncements from the CICA. These new standardsare discussed in the Notes to the Consolidated Financial Statements and the highlights of the impact of the newpronouncements are as follows:
Inventories
On February 3, 2008, the Company adopted CICA Handbook Section 3031 ‘‘Inventories’’ (‘‘Section 3031’’),which replaced Section 3030 ‘‘Inventories’’. The new standard applies to interim and annual financial statementsrelating to fiscal years beginning on or after January 1, 2008 and provides guidance on the determination of costand requires inventories to be measured at the lower of cost and net realizable value. The new standard alsorequires additional disclosures, including the accounting policies adopted in measuring inventories, amount ofinventories recognized as an expense during the period, the amount of any write-downs and reversal of any write-downs during the period and the carrying amount of inventories pledged as security for liabilities.
According to the new standard, the cost of inventories should be determined using the first-in, first-out orweighted average cost method. Techniques for the measurement of the costs of inventories, such as the retailmethod or the standard cost method, are permitted if the results approximate cost. Reversal of previous write-downs to net realizable value is now required when there is a subsequent increase in the value of inventories.
Transitional provisions in Section 3031 allow companies to either report opening inventory in accordance withthe new standard, with the difference in inventory measurement treated as a retrospective adjustment to openingretained earnings without restatement of prior periods, or report opening inventory in accordance with the newstandard and apply the change in measurement retrospectively with a restatement of prior periods. The Companyhas adopted this new standard retrospectively, without restatement of prior period amounts. The initial impact ofmeasuring inventories under the new standard is an increase to the carrying amount of opening inventories as atFebruary 3, 2008 of $85.4 million. Opening retained earnings has been adjusted by $57.7 million, equal to thechange in opening inventories net of taxes of $27.7 million.
Following adoption of Section 3031, the Company values its inventories at the lower of cost and net realizablevalue. Cost is determined using the weighted average cost method, based on individual items. The cost ofinventories is comprised of the purchase price plus other costs incurred in bringing inventories to their presentlocation and condition, and is reduced by the value of rebates and allowances received from vendors. Costs thatdo not contribute to bringing inventories to their present location and condition, such as storage andadministrative overheads, are specifically excluded from the cost of inventories and are expensed in the periodincurred.
2008 Annual Report 39

Financial Instruments
As explained in Note 17 to the Consolidated Financial Statements, the Company discontinued the recognition ofcertain embedded derivatives on February 3, 2008, as a result of a change in accounting policy made inaccordance with Section 1506.
On February 3, 2008, the Company adopted CICA Handbook Section 3862 ‘‘Financial Instruments –Disclosures’’ (‘‘Section 3862’’) and Section 3863 ‘‘Financial Instruments – Presentation’’ (‘‘Section 3863’’).These two new sections replaced Section 3861 ‘‘Financial Instruments – Disclosure and Presentation’’(‘‘Section 3861’’). The disclosure requirements in Section 3862 revise and enhance the disclosure requirementswith particular focus on additional disclosure surrounding risk and risk management of financial instruments.Section 3863 contains the standards for presentation of financial instruments and non-financial derivatives and isessentially consistent with the presentation requirements previously found in Section 3861. These two newsections apply to interim and annual financial statements relating to fiscal years beginning on or after October 1,2007. New disclosure required under Section 3862 has been included in Note 17 Financial Instruments,contained herein. The adoption of Section 3863 has had no significant impact on the Company’s FinancialStatements.
Capital Disclosures
On February 3, 2008, the Company adopted CICA Handbook Section 1535 ‘‘Capital Disclosures’’(‘‘Section 1535’’). Section 1535 applies to interim and annual financial statements relating to fiscal yearsbeginning on or after October 1, 2007. This new guidance establishes standards for disclosing information aboutan entity’s capital and how it is managed. This section requires the disclosure of an entity’s objectives, policiesand processes for managing capital and information regarding an entity’s compliance or non-compliance with anycapital requirements. The new disclosure required under Section 1535 has been included in Note 16 ‘‘CapitalDisclosures’’ of the Notes to the Consolidated Financial Statements.
c. Recently Issued Accounting Standards
Goodwill & Intangible Assets
In February 2008, the CICA issued CICA Handbook Section 3064 ‘‘Goodwill and Intangible Assets’’(‘‘Section 3064’’), which is effective for interim and annual financial statements issued for fiscal years beginningon or after October 1, 2008. This new standard replaces Section 3062 ‘‘Goodwill and Other Intangible Assets’’and Section 3450 ‘‘Research and Development Costs’’. The primary reason for the issuance of this new standardis to provide clarity on the recognition and measurement of internally developed intangibles. Section 3064reinforces a principle-based approach to the recognition of costs as assets in accordance with the definition of anasset and criteria for the recognition of an asset in CICA Handbook Section 1000 ‘‘Financial StatementConcepts’’. The Company is currently evaluating the effect this standard will have on financial statementdisclosure and presentation in future periods.
The Company will adopt the new accounting standard effective for fiscal 2009 with a retrospective restatementof prior periods. Implementation of this standard will result in a change in accounting policy for CatalogueProduction Costs (‘‘CPC’’). CPC in fiscal 2009 will be expensed once the catalogue has been mailed tocustomers and will no longer be capitalized and amortized over the life of the catalogue. The restatement willresult in a pre-tax reduction to the opening retained earnings in Fiscal 2008 of approximately $31.0 million. Theretrospective restatement will also impact the Company’s results of operations for each quarter and full year forFiscal 2008. The Company is continuing to assess the impact of the new accounting standard Section 3064 onthe Company’s results of operations and financial position.
Sears Canada Inc.40

d. Future Accounting Standards
The Company monitors the standard setting process for new standards issued by the CICA that the Company maybe required to adopt in the future. Since the impact of a proposed standard may change during the reviewperiod, the Company does not comment publicly until the standard has been finalized and the effects have beendetermined.
International Financial Reporting Standards (‘‘IFRS’’)
The Canadian Accounting Standards Board confirmed, in February 2008, that it will require all publiclyaccountable enterprises to adopt IFRS for interim and annual financial statements relating to fiscal yearsbeginning on or after January 1, 2011. The transition from Canadian GAAP to IFRS will be applicable for theCompany in its first quarter of operations in fiscal 2011, at which time the Company will prepare both its fiscal2011 and fiscal 2010 comparative financial information using IFRS.
In order to meet IFRS transition requirements, the Company has established an enterprise-wide project team andformed an executive steering committee. The Company has completed the planning activities for the initialassessment phase of the IFRS adoption project including the initial diagnostic impact assessment, which involveda high level review of the major differences between current Canadian GAAP and IFRS. The Company iscurrently in the process of performing a detailed impact analysis and implementation plan for individualstandards. At this preliminary stage, the Company has identified those areas with the highest potential of impactto be fixed assets, financial instruments, leases, customer loyalty program, employee future benefits, jointventures, as well as the transition rules and practices included in IFRS 1, First-Time Adoption of IFRS. Foreach area, the Company will determine the quantitative impacts to the financial statements, system requirements,accounting policy decisions, and changes to internal controls and business policies. The Company will continue toinvest in training and resources throughout the transition period to facilitate a timely conversion.
e. Disclosure Controls and Procedure
Disclosure Controls and Procedures
Management of the Company is responsible for establishing and maintaining a system of disclosure controls andprocedures that are designed to provide reasonable assurance that information required to be disclosed by theCompany in its public disclosure documents, including its Annual and Interim MD&A, Annual and InterimFinancial Statements, and Annual Information Form is recorded, processed, summarized and reported withinrequired time periods and includes controls and procedures designed to ensure that the information required to bedisclosed by the Company in its public disclosure documents is accumulated and communicated to the Company’smanagement, including the Chief Executive Officer (‘‘CEO’’) and Chief Financial Officer (‘‘CFO’’), to allow timelydecisions regarding required disclosure (‘‘DC&P’’).
Management of the Company, including the CEO and CFO, has caused to be evaluated under their supervision,the Company’s DC&P and has concluded that the Company’s DC&P was effective as at the financial year-end,being January 31, 2009.
Internal Control over Financial Reporting
Management, including the CEO and CFO, have designed a process to provide reasonable assurance regarding thereliability of financial reporting and the preparation of financial statements for external purposes in accordancewith GAAP. This process (‘‘ICFR’’) includes those policies and procedures that: (i) pertain to the maintenance ofrecords that in reasonable detail accurately and fairly reflect the transactions and dispositions of the assets of theissuer; (ii) are designed to provide reasonable assurance that transactions are recorded as necessary to permitpreparation of financial statements in accordance with GAAP, and that receipts and expenditures of the issuerare being made only in accordance with authorizations of management and directors of the Company; and(iii) are designed to provide reasonable assurance regarding prevention or timely detection of unauthorizedacquisition, use or disposition of the issuer’s assets that could have a material effect on the annual or interim
2008 Annual Report 41

financial statements. Internal control systems, regardless of superiority in design, have inherent limitations.Therefore, even those systems that have been determined to have been designed effectively can only providereasonable assurance with respect to financial reporting and financial statement preparation.
Management, including the CEO and CFO, has caused to be evaluated under their supervision, the effectivenessof ICFR and has concluded that the Company’s ICFR was effective as at the financial year-end, beingJanuary 31, 2009.
10. Risks and Uncertainties
Sears attempts to mitigate and manage risks wherever possible through various tactics including transferring therisk to a third party (outsourcing), protecting against the risk (insurance), planning for the risk (contingencyplanning) and by continuously monitoring its internal and external environment for threats and opportunities. Thissection highlights risks and uncertainties that are inherent in the Company’s normal course of business and havethe potential to impact the financial performance of the Company. The risks and uncertainties described beloware not the only risks the Company may encounter. Additional risks and uncertainties not presently known to theCompany may also negatively impact financial performance.
Business and Operating Risks
Retail Competition – The Canadian retail market remains highly competitive as key players and new entrantscompete for market share. International retailers continue to expand into Canada while existing competitorsenhance their product offerings and become direct competitors. The Company’s competitors include traditionalFull-line department stores, discount department stores, wholesale clubs, ‘‘big-box’’ retailers, internet retailersand specialty stores offering alternative retail formats. Failure to develop and implement appropriate competitivestrategies could have an adverse effect on the Company’s performance.
The majority of the performance payments earned pursuant to the credit card marketing and servicing alliancewith JPMorgan Chase are related to customers’ purchases using the Sears Card and Sears MasterCard. Thecredit card industry is highly competitive as credit card issuers continue to expand their product offerings todistinguish their cards. As competition increases, there is a risk that a reduction in the percentage of purchasescharged to the Sears Card and Sears MasterCard may negatively impact the Company’s performance.
Additional risk may arise when foreign retailers carrying on business in Canada in competition with the Companyengage in marketing activities which are not in full compliance with Canadian legal requirements regardingadvertising and labelling rules and product quality standards. Such retailers gain an unfair advantage and theiractivities may negatively affect the Company’s performance.
Seasonality – The Company’s operations are seasonal in nature with respect to operating results and in productsand services offered. Merchandise and service revenues, as well as performance payments received fromJPMorgan Chase, will vary by quarter based upon consumer spending behaviour. Historically, the Company’srevenues and earnings are higher in the fourth quarter than in any of the other three quarters due to the holidayseason. The Company is able to adjust certain variable costs in response to seasonal revenue patterns; however,costs such as occupancy are fixed, causing the Company to report a disproportionate level of earnings in thefourth quarter. This business seasonality results in quarterly performance that is not necessarily indicative ofannual performance.
In addition, Sears offers many seasonal goods and services. The Company sets budgeted inventory levels andpromotional activity to be in accord with its strategic initiatives and expected consumer demand. Businesses thatgenerate revenue from the sale of seasonal merchandise and services are subject to the risk of changes inconsumer spending behaviour as a result of unseasonable weather patterns.
Merchandise Selection and Services Offered – To be successful, the Company must identify, obtain supplies ofand offer its customers attractive, relevant and high-quality merchandise and services on a continuous basis.
Sears Canada Inc.42

Customers’ preferences may change over time. Failure by the Company to effectively anticipate customers’purchasing habits, tastes or the demand for products and services offered may result in the Company missingopportunities for products or services not offered.
Inventory Management – The Company must maintain sufficient in-stock inventory levels to operate the businesssuccessfully while minimizing out-of-stock levels. A significant portion of inventory is sourced from vendorsrequiring advance notice periods in order to supply the quantities that the Company requires. Lead times mayadversely impact the Company’s ability to respond to changing consumer preferences, resulting in inventory levelsthat are insufficient to meet demand or in merchandise that may have to be sold at lower prices. Inappropriateinventory levels may negatively impact the Company’s performance.
International Trade – The Company is dependent upon a significant amount of products that originate fromnon-Canadian markets. The Company’s performance may be adversely impacted by the additional risks that areassociated with the sourcing and delivery of this merchandise including potential economic, social and politicalinstability in jurisdictions where suppliers are located, increased shipping costs, potential transportation delaysand interruptions, adverse foreign currency fluctuations, changes in international laws, rules and regulationspertaining to the importation of products, quotas, and the imposition and collection of taxes and duties.
Supplier and Brand Reputations – As a diverse and multi-channel retailer, Sears promotes many brands as partof its normal course of business. These brands include the Sears brand, its private label brands for product linessuch as Jessica�, and non-proprietary brands exclusive to Sears. Damage to the reputation of these brands or thereputation of the suppliers of these brands could negatively impact consumer opinions of Sears or its relatedproducts and have an adverse effect on the Company’s performance.
Supplier Relationships – Although the Company’s business is not substantially dependent on any one supplier, itsrelationship with certain suppliers is of significance to the Company’s merchandising strategy, including attractingcustomers to its locations, cross-segment sales and image. The loss of a significant supplier relationship couldnegatively impact the Company’s performance.
Reliance on Technology – Given the number of individual transactions that the Company processes each year, it iscritical that the Company maintains uninterrupted operation of its computer and communications hardware andsoftware systems. These systems are subject to damage or interruption from power outages, computer andtelecommunications failures, computer viruses, security breaches, catastrophic events such as fires, naturaldisasters and adverse weather occurrences, and usage errors by the Company’s employees. If the systems aredamaged or cease to function properly, the Company may have to make a significant investment to fix or replacethem and it may suffer interruptions in its operations in the interim. In addition, the Company is pursuingcomplex initiatives to improve and transform its information technology processes and systems. The risk ofdisruption is increased in periods where such complex and significant systems changes are undertaken. Anymaterial interruption in the Company’s computer operations may have a material adverse effect on theCompany’s performance.
Product Liability Claims – The Company sells products produced by third party manufacturers. Some of theseproducts may expose the Company to product liability claims relating to personal injury, death or propertydamage caused by such products, and may require the Company to take actions, such as product recalls. Inaddition, the Company also provides various services which could give rise to such claims. Although the Companymaintains liability insurance to mitigate these potential claims, the Company cannot be certain that its coveragewill be adequate for liabilities actually incurred or that insurance will continue to be available on economicallyreasonable terms or at all. Product liability claims could negatively impact the Company’s performance.
Real Estate – The primary objective of the Company’s real estate joint venture operations is to maximize thereturns on its investments in shopping centre real estate. Sears reviews the performance of these joint ventureson a regular basis. Shopping centre investments are non-core assets that the Company sells when it is financiallyadvantageous to do so. Similarly, the Company may also develop excess land within these real estate holdings and
2008 Annual Report 43

shopping centre joint venture investments when it is advantageous to do so. The return on such transactions iscontingent on the state of the economic environment and other factors. In addition, the credit worthiness andfinancial stability of tenants and partners could negatively impact the Company’s financial performance.
Lease Obligations – Sears operates a total of 187 stores, 16 of which are Company-owned with the majority ofthe remainder held under long-term leases. Company-owned stores consist of 14 Full-line department stores andtwo Sears Home stores. While the Company is able to change its merchandise mix and relocate stores in order tomaintain its competitiveness, it is restricted from vacating a current site without breaching its contractualobligations and incurring lease-related expenses for the remaining portion of the lease-term. The long-term natureof the leases limits the Company’s ability to respond in a timely manner to changes in the demographic or retailenvironment at any location.
Operating Covenants – Sears has operating covenants with landlords for approximately 100 of its corporatestores. Corbeil has operating covenants for 13 of its stores. An operating covenant generally requires Sears orCorbeil, as the case may be, during normal operating hours, to operate a store continuously as per the identifiedformat in the lease agreement. As at January 31, 2009, the remaining term of the various Sears operatingcovenants range from less than one year to 26 years, with the average remaining term being approximately sevenyears. Corbeil operates ten leased corporate stores and one leased outlet, with the average remaining term of theCorbeil leases being approximately six years. Failure to observe its operating covenants may result in legalproceedings against the Company.
Changes in Laws and Regulations – Laws and regulations are in place to protect the interests and well-being ofour customers and communities, business partners, suppliers, employees, shareholders and creditors. Changes tostatutes, laws, regulations or regulatory policies, including changes in the interpretation, implementation orenforcement of statutes, laws, regulations and regulatory policies, could adversely affect the Company’soperations and performance. In addition, Sears may incur significant costs in the course of complying with anychanges to applicable statutes, laws, regulations and regulatory policies. The Company’s failure to comply withapplicable statutes, laws, regulations or regulatory policies could result in a judicial or regulatory judgment orsanctions and financial penalties that could adversely impact the Company’s reputation and earnings. Althoughthe Company believes that it has taken reasonable measures designed to ensure compliance with governingstatutes, laws, regulations and regulatory policies in the jurisdictions in which the Company conducts business,there is no assurance that the Company will always be in compliance or deemed to be in compliance.
Environmental – Sears is exposed to environmental risk as an owner, lessor and lessee of property. Under federaland provincial laws, the owner, lessor or lessee could be liable for the costs of removal and remediation of certainhazardous substances on its properties or disposed of at other locations. The failure to remove or remediate suchsubstances, if any, could lead to claims against the Company.
The Company is currently remediating various locations across Canada where it operated auto centres, gas barsand a logistics facility. The extent of the remediation and the costs thereof have not yet been determined. TheCompany continues to monitor the costs of remediation and appropriately provide for these costs in its reserves.
If the Company commits to renovating a leased or owned building that contains or may contain asbestos, or ifasbestos is inadvertently disturbed, the Company is legally obligated to comply with asbestos removal standards.The extent of this liability has not yet been determined because the costs to remove asbestos depend upon factorsincluding the location and extent of any renovations undertaken. Inadvertent disturbance of asbestos cannot beforeseen. The costs incurred by the Company could be significant and may negatively impact the Company’sperformance.
Proceedings – The Company is involved in various legal proceedings incidental to the normal course of business.Sears is of the view that although the outcome of such litigation cannot be predicted with certainty, the finaldisposition is not expected to have a material adverse effect on the Company’s consolidated financial position orresults of operations.
Sears Canada Inc.44

In the ordinary course of business, the Company is subject to ongoing audits by tax authorities. While theCompany believes that its tax filing positions are appropriate and supportable, periodically, certain matters arereviewed and challenged by the tax authorities. As the Company routinely evaluates and provides for potentiallyunfavourable outcomes with respect to any tax audits, the Company believes that the final disposition of taxaudits will not have a material adverse effect on its liquidity, consolidated financial position or results ofoperations. If the result of a tax audit materially differs from the existing provisions, the Company’s effective taxrate and its net earnings could be affected positively or negatively in the period in which the tax auditsare completed.
Three class actions in the provinces of Quebec, Saskatchewan and Ontario were commenced against the Companyin 2005 arising out of the Company’s pricing of tires. The plaintiffs allege that Sears inflated the regular retailprice of certain brands of tires sold by Sears in order to then claim that the same brands were on sale for up to45% off the regular retail price so as to induce potential customers into believing that substantial savings werebeing offered. The plaintiffs seek general damages, special damages, and punitive damages, as well as costs andpre- and post-judgment interest. No dollar amounts are specified. The plaintiffs intend to proceed with theQuebec action and seek certification as a class action on a national basis. The outcome of this action isindeterminable, and the monetary damages, if any, cannot be reliably estimated. Therefore, the Company has notmade a provision for any potential liability.
Unusual Events – Events such as social or political unrest, natural disasters, disease outbreaks or acts ofterrorism could have a material adverse effect on the Company’s performance, particularly during a peak seasonsuch as the month of December, which may account for up to 40% of a year’s earnings.
Financial Risks
The Company plans its operations giving regard to economic and financial variables that are beyond the controlof the Company. Changes to these variables may adversely impact the performance of the Company.
Economic Environment – Should the current economic conditions persist, heightened competition, a furtherdecline in consumer confidence, lower disposable income, higher unemployment and personal debt levels mayresult. As indicated in Section 1 ‘‘Company Performance’’, the Company’s financial performance has beennegatively impacted as a result of the worsening economic environment. Given the volatility in the Canadian andglobal economy, it is difficult to accurately assess the potential impact on the Company’s business. If theeconomy continues to worsen, however, the Company could experience a decline in same store sales, erosion ofgross margins and profitability.
Liquidity – The Company faces a liquidity risk due to various factors, including and not limited to, theunpredictability of the current economic climate, failure to secure appropriate funding vehicles and cash flowissues relating to the operation and management of the business. Failure to fulfill financial obligations due andowing from the Company as a result of this liquidity risk can have undesirable consequences on the Company.The Company takes several precautions in order to protect its interests, such as maintaining a suitable financingsource to support the Company’s operations and by ensuring that it has appropriate cash reserves to fulfill itsfinancial obligations.
Foreign Exchange – The Company’s foreign exchange risk is limited to currency fluctuations between theCanadian and U.S. dollar. The Company uses foreign currency forward and option contracts to hedge theexchange rate risk on the majority of its expected requirement for U.S. dollars.
Credit Risk – Credit risk refers to the possibility that the Company can suffer financial losses due to failure ofthe Company’s counterparties to meet their payment obligations. Exposure to credit risk exists for derivativeinstruments, cash and short-term investments, restricted cash and investments and accounts receivable.
2008 Annual Report 45

The Company’s only exposure to counterparty risk as it relates to derivative instruments is represented by the fairvalue of the derivative contracts. Minimal risk exists as these contracts are placed with approved financialinstitutions with secure credit ratings.
The Company’s cash and short-term investments and restricted cash and investments also expose the Company tocredit risk should the borrower default on maturity of the investment. The Company manages this exposurethrough policies that require borrowers to have a minimum credit rating of A and limiting investments withindividual borrowers at maximum levels based on credit rating.
The Company is exposed to minimal credit risk from customers as a result of ongoing credit evaluations andreview of accounts receivable collectability. As at January 31, 2009, approximately 43% of the Company’saccounts receivable are due from two customers and both are in good standing.
Investment Returns – The Company invests its surplus cash in investment grade, short-term money marketinstruments, the return on which depends upon interest rates and the credit worthiness of the issuer. Any creditrisk resulting from the possibility that an issuer may default on repayment is mitigated by policies requiring thatissuers have a minimum credit rating and limiting exposures to individual issuers.
Future Benefit Plans – There is no assurance that the Company’s future benefit plans will be able to earn theassumed rate of return. New regulations and market driven changes may result in changes in the discount ratesand other variables which would result in the Company being required to make contributions in the future thatdiffer significantly from the estimates. Management is required to use assumptions to account for the plans inconformity with GAAP. However, actual future experience will differ from these assumptions giving rise toactuarial gains or losses. In any year, actual experience differing from the assumptions may be material. Therelevant accounting standard contemplates such differences and allows these actuarial gains or losses to berecognized over the expected average service life of the employee group covered.
Plan assets consist primarily of cash, alternative investments and marketable equity and debt instruments. Thevalue of the marketable equity and debt investments will fluctuate due to changes in market prices. Planobligations and annual pension expense are determined by independent actuaries and through the use of a numberof assumptions. Key assumptions in measuring the benefit obligations and pension plan costs include the discountrate, the rate of compensation increase, and the expected return on plan assets. The discount rate is based on theyield of high-quality, fixed-income investments, at the year-end date, with maturities corresponding to theanticipated timing of future benefit payments. The compensation increase assumption is based upon historicalexperience and anticipated future management actions. The expected return on plan assets reflects the investmentstrategy and asset allocations of the invested assets. Refer to the Notes to the Consolidated Financial Statementsfor more information on the weighted-average actuarial assumptions for the plans.
Sears Canada Inc.46

2008 Annual Report 47
This page has been intentionally left blank.

25MAR20091426102915MAR200802293395
MANAGEMENT’S RESPONSIBILITYFOR FINANCIAL STATEMENTSThe preparation and presentation of the Company’s consolidated financial statements and the overall accuracyand integrity of the Company’s financial reporting are the responsibility of management. The accompanyingconsolidated financial statements have been prepared in accordance with Canadian generally accepted accountingprinciples and include certain amounts that are based on management’s best estimates and judgments. Financialinformation contained elsewhere in this Annual Report is consistent with the information set out in theconsolidated financial statements.
In fulfilling its responsibilities, management has developed and maintains an extensive system of disclosurecontrols and procedures and internal control over financial reporting processes that are designed to providereasonable assurance that assets are safeguarded, transactions are properly recorded and reported within therequired time periods, and financial records are reliable for the preparation of the financial statements. TheCompany’s auditors, who are employees of the Company, also review and evaluate internal controls on behalfof management.
The Board of Directors monitors management’s fulfillment of its responsibilities for financial reporting andinternal controls principally through the Audit Committee. The Audit Committee, which is comprised solely ofindependent directors, meets regularly with management, the internal audit department and the Company’sexternal auditors to review and discuss audit activity and results, internal accounting controls and financialreporting matters. The external auditors and the internal audit department have unrestricted access to the AuditCommittee, management and the Company’s records. The Audit Committee is also responsible for recommendingto the Board of Directors the proposed nomination of the external auditors for appointment by the shareholders.Based upon the review and recommendation of the Audit Committee, the consolidated financial statements andManagement’s Discussion and Analysis have been approved by the Board of Directors.
The Company’s external auditors, Deloitte & Touche LLP, have audited the consolidated financial statements inaccordance with Canadian generally accepted auditing standards.
savaR .R nellAsregoR .L eneDPresident and Chief Executive Officer Senior Vice-President and Chief Financial Officer
Toronto, OntarioMarch 23, 2009
Sears Canada Inc.48

17MAR200811251988
AUDITORS’ REPORT TO THE SHAREHOLDERS OFSEARS CANADA INC.
Deloitte & Touche LLP5140 Yonge StreetSuite 1700Toronto ON M2N 6L7Canada
Tel: 416-601-6150Fax: 416-601-6151www.deloitte.ca
To the Shareholders ofSears Canada Inc.
We have audited the consolidated statements of financial position of Sears Canada Inc. as at January 31, 2009and February 2, 2008 and the consolidated statements of earnings and comprehensive income, retained earningsand accumulated other comprehensive income and cash flows for the 52-week period ended January 31, 2009and the 57-week period ended February 2, 2008. These financial statements are the responsibility of theCompany’s management. Our responsibility is to express an opinion on these financial statements based onour audits.
We conducted our audits in accordance with Canadian generally accepted auditing standards. Those standardsrequire that we plan and perform an audit to obtain reasonable assurance whether the financial statements arefree of material misstatement. An audit includes examining, on a test basis, evidence supporting the amounts anddisclosures in the financial statements. An audit also includes assessing the accounting principles used andsignificant estimates made by management, as well as evaluating the overall financial statement presentation.
In our opinion, these consolidated financial statements present fairly, in all material respects, the financialposition of the Company as at January 31, 2009 and February 2, 2008 and the results of its operations and itscash flows for the 52-week period ended January 31, 2009 and the 57-week period ended February 2, 2008 inaccordance with Canadian generally accepted accounting principles.
Chartered AccountantsLicensed Public Accountants
Toronto, OntarioMarch 23, 2009
2008 Annual Report 49

24MAR20080942384624MAR200809425513
CONSOLIDATED STATEMENTS OF FINANCIAL POSITION
As atAs at February 2, 2008
(in millions) January 31, 2009 (Restated – Note 1)
ASSETSCurrent AssetsCash and short-term investments $ 819.8 $ 871.6Restricted cash and investments (Note 12) 144.8 5.2Accounts receivable 138.7 118.4Income taxes recoverable 16.6 0.4Inventories 968.3 879.7Prepaid expenses and other assets 182.5 91.1Current portion of future income tax assets (Note 3) 0.3 29.2
2,271.0 1,995.6
Capital assets (Note 4) 712.8 742.0Deferred charges (Note 5) 198.1 205.0Future income tax assets (Note 3) 27.9 24.9Other long-term assets 54.9 34.2
$ 3,264.7 $ 3,001.7
LIABILITIESCurrent LiabilitiesAccounts payable $ 640.9 $ 683.6Accrued liabilities 383.6 438.6Income and other taxes payable 39.4 80.2Principal payments on long-term obligations due within one year (Note 7) 32.1 16.1Future income tax liabilities (Note 3) 2.5 –
1,098.5 1,218.5
Long-term obligations (Note 7) 332.5 356.0Accrued benefit liability (Note 6) 158.5 164.1Other long-term liabilities 167.1 169.7
1,756.6 1,908.3
SHAREHOLDERS’ EQUITYCapital stock (Note 8) 15.7 15.7Retained earnings 1,424.0 1,077.7Accumulated other comprehensive income 68.4 –
1,508.1 1,093.4
$ 3,264.7 $ 3,001.7
On Behalf of the Board of Directors,
W. C. CrowleyE. J. Bird
Chairman of the BoardDirector
Sears Canada Inc.50

CONSOLIDATED STATEMENTS OF EARNINGSAND COMPREHENSIVE INCOME
2007For the 52-week period ended January 31, 2009 and the 57-week period ended February 2, 2008 (Restated –(in millions, except per share amounts) 2008 Note 1)
Total revenues $ 5,733.2 $ 6,326.4
Cost of merchandise sold, operating, administrative and selling expenses (Note 1) 5,216.2 5,787.6Depreciation and amortization 126.9 150.1Interest expense, net (Note 7) 10.0 12.7Unusual items – (gain) (Note 10) (38.8) (82.2)
Earnings before income taxes 418.9 458.2
Income taxes expense (recovery) (Note 3)Current 161.3 74.4Future (31.0) 77.8
130.3 152.2
Net earnings $ 288.6 $ 306.0
Net earnings per share (Note 18) $ 2.68 $ 2.84
Diluted net earnings per share (Note 18) $ 2.68 $ 2.84
Net earnings $ 288.6 $ 306.0Other comprehensive income (loss):
Mark-to-market adjustment related to short-term investments, net of income taxes expense of $0.1 (2007: Nil) 0.1 –Gain on derivatives designated as cash flow hedges, net of income taxes expense of $35.4 76.6 –Reclassification to net earnings of gain on derivatives designated as cash flow hedges, net of income taxes
expense of $3.8 (8.3) –
Other comprehensive income (Note 17) 68.4 –
Comprehensive income $ 357.0 $ 306.0
CONSOLIDATED STATEMENTS OF RETAINED EARNINGSAND ACCUMULATED OTHER COMPREHENSIVE INCOME
2007For the 52-week period ended January 31, 2009 and the 57-week period ended February 2, 2008 (Restated –(in millions) 2008 Note 1)
Retained earningsOpening balance $ 1,077.7 $ 769.3Adjustment to opening retained earnings resulting from adoption of new accounting standard for inventories, net of
income taxes of $27.7 (Note 1) 57.7 –Adjustment to opening retained earnings resulting from restatement due to change in accounting policy for financial
instruments, net of income taxes of $1.4 (Note 1) – 2.8Adjustment to opening retained earnings resulting from adoption of new accounting standards for financial instruments,
net of income tax recovery of $0.2 (Note 1) – (0.4)Net earnings 288.6 306.0
Closing balance $ 1,424.0 $ 1,077.7
Accumulated other comprehensive incomeOpening balance $ – $ –Other comprehensive income 68.4 –
Closing balance $ 68.4 $ –
Retained earnings and accumulated other comprehensive income $ 1,492.4 $ 1,077.7
2008 Annual Report 51

CONSOLIDATED STATEMENTS OF CASH FLOWS
2007For the 52-week period ended January 31, 2009 and the 57-week period ended February 2, 2008 (Restated –(in millions) 2008 Note 1)
Cash flow generated from (used for) operating activitiesNet earnings $ 288.6 $ 306.0Non-cash items included in net earnings, principally depreciation, pension expense, future income taxes and gain
on sale of real estate and real estate joint ventures 89.9 172.7Changes in non-cash working capital balances related to operations (Note 11) (194.8) (236.2)Other, principally pension contributions and changes to long-term assets and liabilities (17.8) (17.2)
165.9 225.3
Cash flow generated from (used for) investing activitiesPurchases of capital assets (96.6) (54.6)Proceeds from sale of capital assets 40.4 104.4Deferred charges (0.5) (0.7)Changes in restricted cash and investments(Current and Long-term) (Note 12) (146.5) 4.9Acquisition, net of cash acquired (7.0) –Purchases of investments (Note 17) – (3.0)Proceeds on sale of real estate joint ventures, net of cash sold (Note 10) – 5.2
(210.2) 56.2
Cash flow used for financing activitiesRepayment of long-term obligations (7.5) (132.8)
Increase (decrease) in cash and short-term investments (51.8) 148.7Cash and short-term investments at beginning of period 871.6 722.9
Cash and short-term investments at end of period $ 819.8 $ 871.6
Cash at end of period $ 66.4 $ 64.7Short-term investments at end of period 753.4 806.9
Total cash and short-term investments at end of period $ 819.8 $ 871.6
Sears Canada Inc.52

NOTES TO CONSOLIDATED FINANCIAL STATEMENTS
1. SUMMARY OF ACCOUNTING POLICIES AND ESTIMATESPrinciples of ConsolidationThe consolidated financial statements include the accounts of Sears Canada Inc. and its subsidiaries togetherwith its proportionate share of the assets, liabilities, revenues and expenses of real estate joint ventures(the ‘‘Company’’ or ‘‘Sears Canada Inc.’’). The results and balances of the real estate joint ventures areproportionately consolidated based on their interim or annual 12 month period ending closest to January 31.
Fiscal YearIn 2007, the Company changed its fiscal year end to the Saturday closest to January 31. Prior to the change,the Company’s fiscal year consisted of a 52 or 53-week period ending on the Saturday closest to December 31.The 2008 fiscal year is comprised of 52 weeks, with the first, second, third and fourth quarters ending onMay 3, 2008, August 2, 2008, November 1, 2008 and January 31, 2009, respectively (‘‘2008’’). TheCompany’s 2007 fiscal year, presented as comparatives herein, was a transition year comprised of 57 weeksended February 2, 2008, with the first, second, third and fourth quarters ended on March 31, 2007, June 30,2007, September 29, 2007 and February 2, 2008, respectively (‘‘2007’’).
RestatementsAs explained in Financial Instruments (Note 17), certain figures from the prior year have been restated as aresult of the retrospective application of a change in accounting policy, as required under the Canadian Instituteof Chartered Accountants (‘‘CICA’’) Handbook Section 1506 ‘‘Accounting Changes’’ (‘‘Section 1506’’). As aresult of this retrospective restatement, the fiscal 2007 opening retained earnings adjustment, related to theadoption of CICA Handbook Section 3855 ‘‘Financial Instruments – Recognition and Measurement’’(‘‘Section 3855’’), has been restated to reflect a credit of $2.8 million, net of taxes of $1.4 million. Thefollowing table summarizes the increase (decrease) to the 2007 comparative figures for the year endedFebruary 2, 2008:
(increase (decrease) in millions) 2007
Current portion of future income tax assets $ (1.4)Accrued liabilities (0.4)Income and other taxes payable (1.3)Net earnings (2.5)Opening retained earnings 2.8Closing retained earnings 0.3
EstimatesThe preparation of the Company’s consolidated financial statements, in accordance with Canadian generallyaccepted accounting principles, requires management to make estimates and assumptions that affect the reportedamounts of assets and liabilities and disclosure of contingent assets and liabilities at the date of the financialstatements and the reported amounts of revenue and expenses during the reporting period. Actual results coulddiffer from those estimates. Estimates are used when accounting for items such as inventory valuation provisions,useful lives of asset for amortization, tax provisions, future cash flow to assess asset impairment, estimatedreturns and allowances, estimated vendor rebates, self-insurance reserves, associate benefit obligations,environmental remediation reserves, warranty-related provisions, loyalty program reserves and others.
Cash and Short-Term InvestmentsCash and short-term investments include all highly liquid investments with maturities of three months or less atthe date of purchase.
InventoriesIn fiscal 2008, the Company implemented the new Canadian Institute of Chartered Accountants (‘‘CICA’’)Handbook Section 3031 ‘‘Inventories’’ and changed its inventory measurement policy (Note 1: Changes in
2008 Annual Report 53
Accounting Policies). Beginning in 2008 inventories are valued at the lower of cost and net realizable value. Netrealizable value is the estimated selling price in the ordinary course of business less the estimated costs necessaryto make the sale. Cost is determined using the weighted average cost method, based on individual items. Prior to2008 inventories were valued at the lower of cost and net realizable value less normal profit margin. Thedetermination of cost has not changed after the implementation of the new standard. A provision for shrinkageand obsolescence is calculated based on historical experience. Management reviews the entire provision to assesswhether, based on economic conditions, it is adequate.
The Company classifies rebates and other consideration received from a vendor as a reduction to the cost ofinventory unless the rebate clearly relates to the reimbursement of a specific expense.
Prepaid Catalogue Production ExpenseCatalogue production costs are deferred and amortized over the life of each catalogue on the basis of theestimated sales from that catalogue. See Future Accounting Policies (Note 1) for future treatment of catalogueproduction costs. Costs incurred to advertise the catalogue are expensed, consistent with the Company’sadvertising expense policy. Prepaid catalogue production expenses are included in prepaid expenses and otherassets on the consolidated statements of financial position.
Advertising ExpenseAdvertising costs for newspaper, television, radio and other media advertising are expensed the first time theadvertising occurs.
Capital AssetsCapital assets are stated at cost. Depreciation and amortization provisions are generally computed using thestraight-line method based on estimated useful lives of 2 to 13 years for equipment and fixtures, and 10 to50 years for buildings and improvements.
The Company’s proportionate share of the cost of buildings held in joint ventures is generally depreciated usingthe straight-line method over 10 to 40 years.
The Company capitalizes specific incremental interest charges for major construction projects and depreciatesthese charges over the life of the related assets. No interest charges were capitalized in fiscal 2008 or 2007.
Capital assets acquired through the incurrence of a liability do not result in a cash outflow for the Company untilthe liability is paid. In the period the related liability is incurred, the change in accounts payable on theconsolidated statement of cash flows is reduced by such amount. When the liability is paid, the amount isreflected as a cash outflow for investing activities on the consolidated statement of cash flows.
The Company evaluates the carrying value of long-lived assets whenever events or changes in circumstancesindicate that a potential impairment has occurred. Impairment has occurred if the projected undiscounted cashflows resulting from the use and eventual disposition of the assets are less than the carrying value of the assets.When impairment has occurred, a write-down is recorded if the carrying value of the long-lived asset exceeds itsfair value. If market valuations are not available, fair value is measured based on the projected discounted cashflow from the asset or group of assets. The Company performed a review of long-lived assets in the fourthquarter of fiscal 2008 due to changes in the marketplace and determined that impairment had occurred(Note 4).
The Company recognizes legal obligations associated with the retirement of capital assets when those obligationsresult from the acquisition, construction, development or normal operation of the asset (‘‘Asset RetirementObligation’’ or ‘‘ARO’’), at the time the asset is purchased or at the time the obligation becomes legallymandated. For AROs for which the timing and/or method of settlement are conditional on a future event thatmay or may not be within the control of the entity (‘‘conditional ARO’’), a liability will be recognized by theCompany if the fair value of the obligation can be reasonably estimated. Otherwise, the Company discloses thefact that a conditional ARO exists, including the reasons why fair value cannot be estimated.
Sears Canada Inc.54

The legal obligation to remove asbestos is a conditional ARO. If the Company commits to renovating a leased orowned building that contains or may contain asbestos, or if asbestos is inadvertently disturbed, for example,through normal wear and tear, the Company will be legally obligated to comply with asbestos removal standards.As at January 31, 2009, the Company has included in accrued liabilities an ARO totalling $1.1 million related tothe removal of asbestos. The Company has not recorded any additional liability related to asbestos removalbecause neither the timing nor the cost of such removal can be reasonably estimated at this time. The cost toremove asbestos would vary significantly depending on the extent of renovation and the location of the asbestos,among other factors. The timing of asbestos removal is often indeterminable as it is dependant on plans for thenature of future renovations, which are revised regularly, or on the inadvertent disturbance of asbestos, whichcannot be foreseen.
Deferred ChargesThe cumulative excess of contributions to the Company’s pension plan over the amounts expensed is included indeferred charges.
Beginning 2007, the Company has adopted a policy of expensing as incurred all debt issuance costs. No debtissuance costs have been incurred in the period.
Goodwill represents the excess of the cost of acquisition over the fair value of the identifiable assets acquired,resulting from the acquisition of a duct cleaning business (Note 2) in 2008, Cantrex Group Inc. (‘‘Cantrex’’) in2005 and a home services operation in 2001. Goodwill is tested for impairment annually or more frequently ifchanges in circumstances indicate a potential impairment. Impairment is recognized in net earnings and ismeasured as the amount by which the carrying amount of the goodwill exceeds its fair value. No impairment hasbeen recognized on the Company’s goodwill since acquisition.
Other costs are deferred and amortized using the straight-line method over the remaining life of the related asset.
Loyalty Program ReservesThe Sears Club and Colours loyalty card programs (the ‘‘Program’’) allow members to earn points from eligiblepurchases made on the Sears Card and Sears MasterCard. Members can then redeem points, in accordance withthe Program rewards schedule. When points are earned by Program members, the Company records an expenseand establishes a liability for future redemptions by multiplying the number of points outstanding by theestimated cost per point. The Program liability is included in accrued liabilities on the Company’s consolidatedstatements of financial position. The cost of Program redemptions is charged against the liability account. Theestimated cost per point is determined based on many factors, including the historical redemption behaviour ofProgram members, expected future redemption patterns and associated costs. The Company monitors, on anongoing basis, trends in redemption rates (points redeemed as a percentage of points issued) and net redemptionvalues. To the extent that estimates differ from actual experience, the Program costs could be higher or lower.The Company continues to evaluate and revise certain assumptions used to calculate the loyalty program reserve,based on redemption experience and expected future activity.
Associate Future BenefitsThe Company currently maintains a defined contribution and a defined benefit registered pension plan whichcovers some of its regular full-time associates as well as some of its part-time associates, a non-registeredsupplemental savings arrangement and a defined benefit non-pension post retirement plan which provides lifeinsurance, medical and dental benefits to eligible retired associates through a funded health and welfare trust(Note 6). The Company has adopted the following accounting policies:
• The cost of pensions and other retirement benefits earned by associates is actuarially determined using theprojected benefit method pro-rated on service and management’s best estimate of expected plan investmentperformance, salary escalation, retirement ages of associates, expected health care costs and other actuarialfactors.
2008 Annual Report 55

• For the purpose of calculating the expected return on plan assets, those assets are valued at fair value. Thefair value of plan assets is market value.
• Past service costs from plan amendments are amortized on a straight-line basis over the average remainingservice period of associates active at the date of amendment.
• Actuarial gains/losses arise from the difference between the actual long-term rate of return on plan assets fora period and the expected long-term rate of return on plan assets for that period or from changes in actuarialassumptions used to determine the accrued benefit obligation. The excess of the net actuarial gain/loss over10% of the greater of the accrued benefit obligation and the fair value of plan assets is amortized over theaverage remaining service period of active associates. The average remaining service period of the activeassociates covered by the pension plan is 8 years. The average remaining service period of the active associatescovered by the non-pension benefits plan is 12 years.
• When the restructuring of a benefit plan gives rise to both a curtailment and a settlement of obligations, thecurtailment is accounted for prior to the settlement.
Self-Insurance ReservesThe Company purchases third-party insurance for automobile, product and general liability claims that exceed acertain dollar level. However, the Company is responsible for the payment of claims under these insured limits. Inestimating the obligation associated with incurred losses, the Company utilizes loss development factors validatedby an independent third party. These development factors utilize historical data to project the future developmentof incurred losses. Loss estimates are adjusted based on actual claims settlements and reported claims. Duringfiscal 2008 there were no changes in assumptions which materially impacted the reserve.
Foreign Currency TranslationObligations payable and receivable in foreign currencies are translated at the exchange rate in effect at thebalance sheet date. Transactions in foreign currencies are translated into Canadian dollars at the rate in effect onthe date of the transaction.
Transaction CostsThe Company has a policy of recognizing all transaction costs related to financial assets and liabilities as areduction to net earnings in the period in which the costs were incurred.
Hedge AccountingThe Company formally identifies, designates and documents all relationships between hedging instruments andhedged items, as well as its risk assessment objective and strategy for undertaking various hedge transactions.The Company assesses, both at the hedge’s inception and on an ongoing basis, whether the derivatives that areused in hedging transactions are highly effective in offsetting changes in fair values or cash flows of hedgeditems. When such derivative instruments cease to exist or be effective as hedges, or when designation of ahedging relationship is terminated, any associated deferred gains or losses are recognized in net earnings in thesame period as the corresponding gains or losses associated with the hedged item. When a hedged item ceases toexist, any associated deferred gains or losses are recognized in net earnings in the period the hedged item ceasesto exist. Changes in the fair value of the Company’s derivatives are non-cash transactions and are therefore notrecognized in the consolidated statement of cash flows.
Net Earnings per ShareNet earnings per share is calculated using the weighted average number of shares outstanding during the period.Diluted net earnings per share is determined using the treasury stock method, the application of which increasesthe number of shares used in the calculation.
Sears Canada Inc.56

Revenue RecognitionRevenues from merchandise sales and services are net of estimated returns and allowances, exclude sales taxesand are recorded upon delivery to the customer and when all significant obligations of the Company have beensatisfied. Revenues relating to the travel business and licensed department businesses are recorded in revenuesnet of cost of sales.
The Company sells extended service contracts with terms of coverage generally between 12 and 60 months.Revenues from the sale of each contract are deferred and amortized on a straight-line basis over the term of therelated contract.
Income from JPMorgan Chase & Co, N.A. (Toronto Branch) (‘‘JPMorgan Chase’’), which is based on apercentage of sales charged on the Sears Card or Sears MasterCard and a percentage of the sales of financialproducts, is included in revenue when the sale occurs. Payments from JPMorgan Chase to reimburse theCompany for the cost to generate new accounts and process account payments are recorded as an offset tooperating, administrative, and selling expenses when the transaction occurs.
Joint venture revenues are recorded based on monthly rentals.
Accounting for Consideration from a VendorThe Company has arrangements with its vendors that provide for discretionary rebates and rebates subject tobinding agreements. Discretionary rebates are recognized when paid by the vendor or when the vendor becomesobligated to pay. Rebates subject to binding agreements are recognized as a reduction of purchases for theperiod, provided the rebate is probable and reasonably estimable.
The Company has recognized less than $0.1 million, as an increase to net income for fiscal 2008 related tobinding agreements for which full entitlement has not yet been met but is probable.
Changes in Accounting PoliciesInventoriesOn February 3, 2008, the Company adopted CICA Handbook Section 3031 ‘‘Inventories’’ (‘‘Section 3031’’),which replaced Section 3030 ‘‘Inventories’’. The new standard applies to interim and annual financial statementsrelating to fiscal years beginning on or after January 1, 2008 and provides guidance on the determination of costand requires inventories to be measured at the lower of cost and net realizable value. The new standard alsorequires additional disclosures, including the accounting policies adopted in measuring inventories, amount ofinventories recognized as an expense during the period, the amount of any write-downs and reversal of any write-downs during the period and the carrying amount of inventories pledged as security for liabilities.
According to the new standard, the cost of inventories should be determined using the first-in, first-out orweighted average cost method. Techniques for the measurement of the costs of inventories, such as the retailmethod or the standard cost method, are permitted if the results approximate cost. Reversal of previous write-downs to net realizable value is now required when there is a subsequent increase in the value of inventories.
Transitional provisions in Section 3031 allow companies to either report opening inventory in accordance withthe new standard, with the difference in inventory measurement treated as a retrospective adjustment to openingretained earnings without restatement of prior periods, or report opening inventory in accordance with the newstandard and apply the change in measurement retrospectively with a restatement of prior periods. The Companyhas adopted this new standard retrospectively, without restatement of prior period amounts. The initial impact ofmeasuring inventories under the new standard is an increase to the carrying amount of opening inventories as atFebruary 3, 2008 of $85.4 million. Opening retained earnings has been adjusted by $57.7 million, equal to thechange in opening inventories net of taxes of $27.7 million.
Following adoption of Section 3031, the Company values its inventories at the lower of cost and net realizablevalue. Cost is determined using the weighted average cost method, based on individual items. The cost ofinventories is comprised of the purchase price plus other costs incurred in bringing the inventories to their present
2008 Annual Report 57

location and condition, such as freight and is reduced by the value of rebates and allowances received fromvendors. Costs that do not contribute to bringing inventories to their present location and condition, such asstorage and administrative overheads, are specifically excluded from the cost of inventories and are expensed inthe period incurred.
The amount of inventories recognized as an expense during the 52-week periods ended January 31, 2009, totals$2,931.8 million, including $87.7 million related to write-downs. A negligible amount of write-downs werereversed during this period ended January 31, 2009.
With the exception of $32.1 million of inventories from the Company’s parts and service and home improvementbusinesses, the Company’s entire inventories balance consists of merchandise finished goods. As a result of theCompany’s change in accounting policy for inventories, the inventories balances on the consolidated statements offinancial position as at January 31, 2009 and February 2, 2008, are not comparable.
Financial InstrumentsOn February 3, 2008, the Company adopted CICA Handbook Section 3862 ‘‘Financial Instruments –Disclosures’’ (‘‘Section 3862’’) and Section 3863 ‘‘Financial Instruments – Presentation’’ (‘‘Section 3863’’).These two new sections replaced Section 3861 ‘‘Financial Instruments – Disclosure and Presentation’’(‘‘Section 3861’’). The disclosure requirements in Section 3862 revise and enhance the disclosure requirementswith particular focus on additional disclosure surrounding risk and risk management of financial instruments.Section 3863 contains the standards for presentation of financial instruments and non-financial derivatives and isessentially consistent with the presentation requirements previously found in Section 3861. These two newsections apply to interim and annual financial statements relating to fiscal years beginning on or after October 1,2007. New disclosure required under Section 3862 has been included in Financial Instruments (Note 17),contained herein. The adoption of Section 3863 has had no significant impact on the Company’sFinancial Statements.
Capital DisclosuresOn February 3, 2008, the Company adopted CICA Handbook Section 1535 ‘‘Capital Disclosures’’(‘‘Section 1535’’). Section 1535 applies to interim and annual financial statements relating to fiscal yearsbeginning on or after October 1, 2007. This new guidance establishes standards for disclosing information aboutan entity’s capital and how it is managed. This section requires the disclosure of an entity’s objectives, policiesand processes for managing capital and information regarding an entity’s compliance or non-compliance with anycapital requirements. The new disclosure required under Section 1535 has been included in Capital Disclosures(Note 16), contained herein. The adoption of Section 1535 has had no significant impact on the Company’sFinancial Statements.
Financial Instruments, Hedges and Comprehensive IncomeOn December 31, 2006, the Company adopted CICA Handbook Section 1530 ‘‘Comprehensive Income’’,Section 3251 ‘‘Equity’’, Section 3855 ‘‘Financial Instruments – Recognition and Measurement’’, Section 3861‘‘Financial Instruments – Disclosure and Presentation’’ and Section 3865 ‘‘Hedges’’. These sections apply tofiscal years beginning on or after October 1, 2006 and provide guidance for recognition, measurement anddisclosure of financial assets, financial liabilities and non-financial derivatives, and describe when and how hedgeaccounting may be applied. Section 1530 provides for the reporting and presentation of comprehensive income,which represents the change in equity from transactions and other events and circumstances from non-ownersources. It includes all changes in equity during a period except those resulting from investments by owners anddistributions to owners. Other comprehensive income (‘‘OCI’’) comprises revenues, expenses, gains and losses thatare recognized in comprehensive income, but which are excluded from net earnings, in conformity with generallyaccepted accounting principles. Section 3251, which replaces Section 3250 ‘‘Surplus’’, requires the Company toreport a new component in shareholders’ equity called accumulated other comprehensive income (‘‘AOCI’’),which comprises the accumulated balance of all components of OCI.
Under the new standards, all financial assets must be classified as held for trading, held to maturity, loans andreceivables or available for sale investments. All financial liabilities are classified as held for trading or other
Sears Canada Inc.58

financial liabilities. Initially, all financial instruments are recorded on the consolidated balance sheet at fairvalue. After initial recognition, at each period end, all financial instruments are re-measured to their fair value,except for held to maturity investments, loans and receivables and other financial liabilities, which are measuredat amortized cost. Any gain or loss arising from a change in the fair value of a financial asset or financialliability classified as held for trading is included in net earnings for the period in which it arises. The gain or lossresulting from a change in fair value of a financial asset classified as available for sale is recognized in OCI untilthe financial asset is derecognized through disposal or becomes impaired.
When advantageous to do so, the Company mitigates the risk of foreign currency fluctuations by entering intoforeign exchange contracts and, since January 4, 2004, had designated such contracts as hedges under CICAAccounting Guideline 13 (‘‘AcG-13’’) ‘‘Hedging Relationships’’. Upon adoption of Section 3855, any outstandingcontracts were de-designated as hedges and were recorded at fair value. The Company also recorded at fair valueembedded derivatives in foreign currencies if certain criteria were met and recorded at fair value fixed priceenergy contracts, which were identified as non-financial derivatives. Any changes in fair value of these derivativesare reported in net earnings. The initial impact of measuring the above derivatives at fair value was a netunrealized loss of $0.4 million, net of tax recovery of $0.2 million, which was recorded in opening retainedearnings for 2007.
Future Accounting Policies:Goodwill and Intangible AssetsIn February 2008, the CICA issued CICA Handbook Section 3064 ‘‘Goodwill and Intangible Assets’’(‘‘Section 3064’’), which replaced Section 3062 ‘‘Goodwill and Other Intangible Assets’’ and Section 3450‘‘Research and Development Costs’’. The new standard is effective for interim and annual financial statementsissued for fiscal years beginning on or after October 1, 2008. The primary reason for the issuance of this newstandard is to provide clarity on the recognition and treatment of internally developed intangibles. Section 3064reinforces a principle-based approach to the recognition of costs as assets in accordance with the definition of anasset and criteria for the recognition of an asset in CICA Handbook Section 1000 ‘‘Financial StatementConcepts’’.
The Company will adopt the new accounting standard effective for fiscal 2009 with a retrospective restatementof prior periods. Implementation of this standard will result in a change in accounting policy for CatalogueProduction Costs (‘‘CPC’’). CPC in fiscal 2009 will be expensed once the catalogue has been mailed tocustomers and will no longer be capitalized and amortized over the life of the catalogue. The restatement willresult in a pre-tax reduction to the opening retained earnings in fiscal 2008 of approximately $31.0 million. Theretrospective restatement will also impact the Company’s results of operations for each quarter and full year forfiscal 2008. The Company is continuing to assess the impact of the new accounting standard Section 3064 onthe Company’s results of operations and financial position.
International Financial Reporting Standards (‘‘IFRS’’)The Canadian Accounting Standards Board confirmed, in February 2008, that it will require all public companiesto adopt IFRS for interim and annual financial statements relating to fiscal years beginning on or afterJanuary 1, 2011. In the year of adoption, companies will be required to provide comparative information as ifIFRS had been used in the preceding fiscal year. The transition from Canadian GAAP to IFRS will be applicableto the Company’s first quarter of operations for fiscal 2011, at which time the Company will prepare both itsfiscal 2011 and fiscal 2010 comparative financial information using IFRS. The Company expects the transitionto IFRS to impact financial reporting, business processes, internal controls and information systems. TheCompany is currently assessing the impact of the transition to IFRS on these areas and will continue to invest intraining and resources throughout the transition period to facilitate a timely conversion.
Comparative FiguresCertain comparative figures from the prior fiscal year have been reclassified to conform to the current fiscalyear’s presentation.
2008 Annual Report 59

2. ACQUISITIONOn February 24, 2008, the Company acquired the assets of Excell Duct Cleaning Inc. and a related company,both based in Ontario. As a result of this $7.0 million acquisition, net of cash acquired of Nil, assets with a fairvalue of $0.4 million and goodwill in the amount of $6.6 million were recorded on the Company’s statement offinancial position during the first quarter of 2008.
3. INCOME TAXESThe average combined federal and provincial statutory income tax rate applicable to the Company was 31.9%for fiscal 2008 (2007: 34.5%). A reconciliation of income taxes at the average statutory tax rate to the actualincome taxes is as follows:
2007(Restated –
(in millions) 2008 Note 1)
Earnings before income taxes $ 418.9 $ 458.2
Income taxes at average statutory tax rate $ 133.5 $ 157.9Increase (decrease) in income taxes resulting from:
Non-taxable portion of capital gains (3.3) (11.1)Non-deductible items 0.5 2.2
130.7 149.0
Effective tax rate before the following adjustments 31.2% 32.5%Future income tax assets revaluation for tax rate changes 1.3 2.9Prior year assessment (recovery) (1.7) 0.3
Income taxes $ 130.3 $ 152.2
Effective tax rate 31.1% 33.2%
The Company’s total net cash payments of income taxes in fiscal 2008 were $231.4 million (2007:$52.1 million).
In the ordinary course of business, the Company is subject to ongoing audits by tax authorities. While theCompany believes that its tax filing positions are appropriate and supportable, periodically, certain matters arechallenged by tax authorities. As the Company routinely evaluates and provides for potentially unfavourableoutcomes with respect to any tax audits, the Company believes that the final disposition of tax audits will nothave a material adverse effect on its liquidity, consolidated financial position or results of operations. If the resultof a tax audit materially differs from the existing provisions, the Company’s effective tax rate and its netearnings may be affected positively or negatively in the period in which the tax audits are completed. Included inother long term assets is a receivable of $17.7 million in respect of payment on a disputed tax assessment.
Sears Canada Inc.60

The tax effects of the significant components of temporary differences giving rise to the Company’s net futureincome tax assets and liabilities are as follows:
2007(in millions) 2008 (Restated – Note 1)
Current Long-Term Current Long-Term
Items not deducted for tax purposes $ 29.8 $ 15.4 $ 30.6 $ 15.1Amounts related to tax losses carried forward – 1.4 0.1 1.1Depreciable capital assets – 12.8 – 12.1Deferred charges – (5.9) – (7.7)Other (0.4) 0.1 (1.5) 0.1
Subtotal 29.4 23.8 29.2 20.7
Amounts related to OCI (31.6) –
Total $ (2.2) $ 23.8 $ 29.2 $ 20.7
The long-term portion of future income tax liabilities in the amount of $4.1 million (2007: $4.2 million) isincluded in other long-term liabilities on the consolidated statements of financial position.
4. CAPITAL ASSETS(in millions) 2008 2007
CostLand $ 56.0 $ 55.9Buildings and improvements 1,143.3 1,136.8Equipment and fixtures 1,239.8 1,281.0
Gross capital assets 2,439.1 2,473.7
Accumulated depreciationBuildings and improvements 716.8 691.6Equipment and fixtures 1,009.5 1,040.1
Total accumulated depreciation 1,726.3 1,731.7
Capital assets $ 712.8 $ 742.0
The above amounts include $12.7 million (2007: $27.2 million) of assets under capital lease, and accumulatedamortization of $10.7 million (2007: $24.2 million) related thereto, as well as gross capital assets andaccumulated depreciation relating to the Real Estate Joint Venture segment in the amount of $153.6 million(2007: $146.7 million) and $56.7 million (2007: $51.5 million).
As at January 31, 2009, gross capital assets include $1.0 million of construction-in-progress costs not beingamortized (2007: $10.5 million).
During the fiscal year, the Company sold capital assets with a net book value of $1.6 million (2007:$23.0 million) resulting in a gain of $38.8 million (2007: gain of $80.2 million), of which, $37.2 million (2007:$77.5 million) was recognized as an unusual gain (Note 10). The remaining gain of $1.6 million (2007:$2.7 million) was included in cost of merchandise sold, operating, administrative and selling expenses. Alsoincluded in cost of merchandise sold, operating, administrative and selling expenses is a loss on disposal of$1.6 million (2007: $2.2 million) relating to capital assets retired during the fiscal year.
As a liability of $27.1 million (2007: $28.0 million) was outstanding at January 31, 2009 for capital assetsacquired during the year, this amount is not reflected as a cash outflow in the purchases of capital assets line ofthe consolidated statement of cash flows.
2008 Annual Report 61

In the fourth quarter of fiscal 2008 an impairment review was performed on long lived assets. The overallslowdown in the economy and the potential impact on consumer spending were factors that led to the review. Thereview indicated that impairment had occurred on four underperforming stores.
To determine the value of the impairment the Company assessed the recoverability of the carrying amount of theassets against the fair value. The fair value was determined based on a discounted future cash model. Followingthe review of the assets the Company recorded a non-cash charge of $1.2 million to accumulated depreciation.The affected assets were primarily comprised of building and equipment.
5. DEFERRED CHARGES(in millions) 2008 2007
Accrued benefit asset (Note 6) $ 176.0 $ 187.4Tenant allowances in joint ventures 5.9 5.5Debt issuance costs – 0.8Goodwill 11.2 4.6Other deferred charges 5.0 6.7
Total deferred charges $ 198.1 $ 205.0
Amortization of other deferred charges of $2.0 million (2007: $2.1 million) is included in cost of merchandisesold, operating, administrative and selling expenses on the Company’s consolidated statements of earnings.
6. ASSOCIATE FUTURE BENEFITSEffective July 1, 2008, the Company amended its pension plan by introducing a defined contribution component.The defined benefit component will continue to accrue benefits related to future compensation increases althoughno further service credit will be earned. In addition, the Company no longer provides medical, dental and lifeinsurance benefits at retirement for associates who have not achieved the eligibility criteria for these non-pensionpost-retirement benefits as at December 31, 2008. These changes did not impact current retirees of theCompany. The amendments to the post retirement medical, dental and life insurance benefits were included in thecalculation of the accrued benefit obligation dated January 31, 2008 and generated a one-time curtailment to thebenefit plan obligation of $87.5 million. There were no immediate recognition of the curtailment in the fiscal2007 consolidated statement of earnings, as the decrease in the accrued benefit obligation was fully offset byunamortized net actuarial losses.
The Company currently maintains a defined benefit registered pension plan and a defined contribution registeredpension plan which covers some of its regular full-time associates as well as some of its part-time associates. Thedefined benefit plan provides pensions based on length of service and final average earnings. In addition to aregistered retirement savings plan, the pension plan includes a non-registered supplemental savings arrangement.The non-registered portion of the plan is maintained to enable certain associates to continue saving forretirement in addition to the registered limit as prescribed by the Canada Revenue Agency. The Company alsomaintains a defined benefit non-pension post retirement plan which provides life insurance, medical and dentalbenefits to eligible retired associates through a funded health and welfare trust (‘‘other benefits plan’’). TheCompany’s accounting policies are described in Note 1, Summary of Accounting Policies and Estimates.
Prior to the change in the date of the Company’s fiscal year end (Note 1: Summary of Accounting Policies andEstimates), the Company measured its accrued benefit obligations and the fair value of plan assets for accountingpurposes as at December 31. Beginning fiscal 2007, the Company measures its accrued benefit obligations andthe fair value of plan assets for accounting purposes as at January 31. The most recent actuarial valuation ofthe pension plan for funding purposes is dated December 31, 2007. The next valuation is required to becompleted no later than December 31, 2010. The most recent actuarial valuation of the health and welfare trustfor purposes of funding the other benefits plan was on December 31, 2007. A valuation of the health and welfaretrust is required annually.
Total cash payments for associate future benefits for fiscal 2008, consisting of cash contributed by the Companyto its defined contribution pension plan, defined benefit pension plan and other benefits plan, was $18.7 million(2007: $21.3 million).
Sears Canada Inc.62

Information about the Company’s defined benefit plans as at January 31, 2009 and February 2, 2008, isas follows:
2008 2007
Sears Non- Sears Non-Registered Registered Other Registered Registered OtherRetirement Pension Benefits Retirement Pension Benefits
(in millions) Plan Plan 1 Plan 1 Total Plan Plan 1 Plan 1 Total
Defined benefit plan assetsFair value at beginning of fiscal year $ 1,496.0 $ 42.3 $ 109.7 $ 1,648.0 $ 1,516.5 $ 41.3 $ 117.2 $ 1,675.0Actual return on plan assets (99.0) 0.3 5.9 (92.8) 55.7 (0.2) (5.4) 50.1Employer contributions (13.6) 2.7 16.0 5.1 – 5.1 16.2 21.3Associate contributions 6.4 – – 6.4 17.7 – – 17.7Benefits paid2,4 (139.5) (3.0) (17.2) (159.7) (93.9) (3.9) (18.3) (116.1)
Fair value of plan assets at end of fiscal year 1,250.3 42.3 114.4 1,407.0 1,496.0 42.3 109.7 1,648.0
Defined benefit plan obligationsAccrued benefit obligations at beginning of
fiscal year 3 $ 1,359.2 $ 44.1 $ 285.5 $ 1,688.8 $ 1,443.8 $ 45.4 $ 405.9 $ 1,895.1Total current service cost 19.6 0.2 1.3 21.1 54.2 0.5 2.6 57.3Interest cost 79.5 2.6 17.0 99.1 81.9 2.5 18.2 102.6Benefits paid 4 (139.5) (3.0) (17.2) (159.7) (93.9) (3.9) (18.3) (116.1)Decrease in obligation due to curtailment – – – – – – (87.5) (87.5)Actuarial (gains) (287.9) (8.0) (53.6) (349.5) (126.8) (0.4) (35.4) (162.6)
Accrued benefit obligation at end of fiscal year 1,030.9 35.9 233.0 1,299.8 1,359.2 44.1 285.5 1,688.8
Funded status of plan – surplus (deficit) $ 219.4 $ 6.4 $ (118.6) $ 107.2 $ 136.8 $ (1.8) $ (175.8) $ (40.8)Unamortized net actuarial loss (gain) (50.9) 1.1 (39.9) (89.7) 43.9 8.5 11.7 64.1
Accrued benefit asset (liability) at end of fiscal year $ 168.5 $ 7.5 $ (158.5) $ 17.5 $ 180.7 $ 6.7 $ (164.1) $ 23.3
The accrued benefit asset (liability) is included in the Company’s statements of financial position as follows:
Deferred charges (Note 5) $ 168.5 $ 7.5 $ – $ 176.0 $ 180.7 $ 6.7 $ – $ 187.4Accrued benefit liability – – (158.5) (158.5) – – (164.1) (164.1)
Accrued benefit asset (liability) at end of year $ 168.5 $ 7.5 $ (158.5) $ 17.5 $ 180.7 $ 6.7 $ (164.1) $ 23.31 Neither the non-registered portion of the pension plan nor the other benefits plan are fully funded.2 Benefits paid include amounts paid from funded assets. Other benefits are paid directly by the Company.3 Accrued benefit obligation represents the actuarial present value of benefits attributed to associate service rendered to a particular date.4 Includes $38.9 million of payments made to associates who, where permitted by law, elected to withdraw their commuted pension values upon
transition to the defined contribution plan.
In 2007, the Company completed an asset/liability study to determine a strategic asset allocation for the pensionfund assets and adopted a policy for asset allocation comprised of 50% fixed income, 30% alternativeinvestments and 20% equity. This change resulted in a reduction in the Company’s pension expense for the fiscalyear ended February 2, 2008. The asset allocation may be changed from time to time in terms of weightingbetween fixed income, alternative investments, equity and other asset classes as well as within the asset classesthemselves.
The plan’s target allocation is determined taking into consideration the amounts and timing of projectedliabilities, the Company’s funding policies and expected returns on various asset classes. To develop the expectedlong-term rate of return on assets assumption, the Company considered the historical returns and the futureexpectations for returns for each asset class, as well as the target asset allocation of the pension portfolio.
2008 Annual Report 63

At the end of the fiscal year, plan assets were invested in the following classes of securities:
2008 2007
Sears Non- Sears Non-Registered Registered Other Registered Registered OtherRetirement Pension Benefits Retirement Pension Benefits
Plan Plan Plan Plan Plan Plan
Fixed income securities 50.2% 30.2% 51.4% 81.2% 70.5% 27.8%Alternative investments 33.6% 45.4% 30.9% – – –Equity securities 16.2% 24.4% 17.7% 18.8% 29.5% 72.2%
Total 100.0% 100.0% 100.0% 100.0% 100.0% 100.0%
The net expense for the defined benefit plans for fiscal 2008 and 2007 is as follows:
2008 2007
Sears Non- Sears Non-Registered Registered Other Registered Registered OtherRetirement Pension Benefits Retirement Pension Benefits
(in millions) Plan Plan Plan Plan Plan Plan
Current service cost, net of associate contributions $ 13.2 $ 0.2 $ 1.3 $ 36.4 $ 0.5 $ 2.7Interest cost 79.5 2.6 17.0 81.9 2.5 18.2Actual return on plan assets 99.0 (0.3) (5.9) (55.7) 0.2 5.4Curtailment gain – – – – – (87.5)Actuarial (gain) loss (287.9) (8.0) (53.6) (126.8) (0.4) (35.4)
Benefit plan (recovery) expense, before adjustments below $ (96.2) $ (5.5) $ (41.2) $ (64.2) $ 2.8 $ (96.6)
Difference between –Actual return on plan assets and expected return (193.1) (1.1) (2.1) (48.3) (1.7) (14.2)Actuarial (gain) loss arising in the year and actuarial (gain) loss amortized 287.9 8.3 53.6 126.8 0.8 36.0
Curtailment gain – – – – – 87.5
Net defined benefit plan expense recognized $ (1.4) $ 1.7 $ 10.3 $ 14.3 $ 1.9 $ 12.7
Net defined contribution expense $ 13.6 $ – $ – $ – $ – $ –
Total pension expense recognized $ 12.2 $ 1.7 $ 10.3 $ 14.3 $ 1.9 $ 12.7
Sears Canada Inc.64

The significant actuarial assumptions are as follows (weighted average assumptions):
2008 2007
Sears Non- Sears Non-Registered Registered Other Registered Registered OtherRetirement Pension Benefits Retirement Pension Benefits
Plan Plan Plan Plan Plan Plan
Discount rate used in calculation of:Accrued benefit obligation 7.90% 7.90% 7.80% 6.00% 6.00% 6.10%Benefit plan expense 6.00% 6.00% 6.10% 5.25% 5.25% 5.25%
Rate of compensation increase used in calculation of:Accrued benefit obligation 3.50% 3.50% 3.50% 4.00% 4.00% 4.00%Benefit plan expense 4.00% 4.00% 4.00% 4.00% 4.00% 4.00%
Expected long-term rate of return on plan assets used in calculation of:Benefit plan expense 6.50% 6.50% 7.00% 6.50% 7.00% 7.00%
Health care cost trend rates:Used in calculation of accrued benefit obligation 7.05% 7.50%Used in calculation of benefit plan expense 7.50% 7.90%Cost trend rate declines to 4.48% 4.40%Year that the rate reaches the rate at which it is assumed to remain constant 2023 2015
1% 1% 1% 1%Sensitivity analysis for future health care costs (in millions): Increase Decrease Increase Decrease
Total of service and interest cost $ 1.6 $ (1.5) $ 1.9 $ (1.7)Accrued benefit obligation $ 15.6 $ (15.4) $ 24.6 $ (21.3)
7. LONG-TERM OBLIGATIONS
The Company has a corporate credit rating of BB and BB� from Dominion Bond Ratings Service and Standardand Poor’s respectively and a corporate family rating of Ba1 from Moody’s Investors Service, Inc.
(in millions) 2008 2007
Unsecured medium term notes:7.45% due May 10, 2010 $ 200.0 $ 200.07.05% due September 20, 2010 100.0 100.0
Proportionate share of long-term debt of joint ventures with a weighted average interest rateof 8.2% due 2009 to 2016 61.6 66.8
Capital lease obligations:Interest rates from 7% to 11% 3.0 5.3
364.6 372.1Less: principal payments due within one year included in current liabilities 32.1 16.1
Total long-term obligations $ 332.5 $ 356.0
The secured three year revolving $200.0 million credit facility expired in December 2008. As a result, the assetsof the Company which had been pledged as security for the credit facility were released and the outstandingmedium term notes are unsecured. The Company is no longer subject to any financial covenants. The revolvingfacility had been solely used to support the Company’s offshore merchandise purchasing program and wasreplaced by a U.S. $120.0 million letter of credit facility. The restricted cash and investments have been pledgedas collateral for the letter of credit.
2008 Annual Report 65
Interest expense on long term debt including the Company’s proportionate share of interest on long-term debt ofjoint ventures and the write-off of debt issue cost for fiscal 2008 totaled $28.5 million (2007: $41.1 million).Interest expense on short term debt for fiscal 2008 totaled $0.7 million (2007: $1.0 million). Interest revenueprimarily related to cash and short-term investments for fiscal 2008 totaled $19.2 million (2007: $29.4 million).
The Company’s cash payments for interest on long-term debt in fiscal 2008 totaled $28.0 million(2007: $39.6 million). Cash payments for interest on short term debt in fiscal 2008 totaled $0.9 million(2007: $0.8 million). The Company received cash related to interest revenue for fiscal 2008 totaling$22.7 million (2007: $27.7 million).
The Company’s proportionate share of the long-term debt of joint ventures is secured by the shopping mallsowned by the joint ventures. The Company’s total principal payments due within one year include $31.2 million(2007: $13.8 million) of the Company’s proportionate share of the current debt obligations of joint ventures.During 2007, the Company disposed of interests in two real estate joint ventures (Note 10). As part of thesetransactions, the purchasers assumed the associated long-term debt totalling $37.4 million.
Principal payments
For fiscal years subsequent to the fiscal year ended January 31, 2009, principal payments required on theCompany’s total long-term obligations are as follows:
(in millions)
2009 $ 32.12010 310.62011 4.12012 3.22013 3.2Subsequent years 11.4
Total debt outstanding $ 364.6
8. CAPITAL STOCK
The Company is authorized to issue an unlimited number of common shares and an unlimited number ofnon-voting, redeemable and retractable Class 1 Preferred Shares in one or more series. As at January 31, 2009,the only shares outstanding were common shares of the Company. Sears Holdings Corporation(‘‘Sears Holdings’’), the controlling shareholder of the Company, is the beneficial holder of 78,193,390, or72.7%, of the common shares of the Company as at January 31, 2009.
The number of outstanding common shares as at January 31, 2009, was 107,620,995 with a stated value of$15.7 million. The number of outstanding common shares and stated value did not change from the end offiscal 2007.
9. STOCK-BASED COMPENSATION
The Company has outstanding options under its Employees Stock Plan that expired on April 19, 2008. This planprovides for the granting of options and Special Incentive Shares and Options, which generally vest over threeyears and are exercisable within 10 years from the grant date. Under the Employees Stock Plan, employees havethe right to elect to take their Special Incentive Shares, upon vesting, either on a current or deferred basis or acombination of both. Special Incentive Shares taken on a current basis are issued as common stock. SpecialIncentive Shares taken on a deferred basis are credited to a Deferred Share Unit (‘‘DSU’’) account. Since thelast grant in 2004, the Company discontinued the granting of options and Special Incentive Shares and Optionsunder the Employees Stock Plan (the ‘‘Plan’’). The Plan has expired, however the expiration of the Plan doesnot affect the rights of current option-holders under the Plan. Options expire ten years from the grant date. As
Sears Canada Inc.66

there have been no options granted since February 2004, options that are currently outstanding will expire beforeor in February 2014. As at January 31, 2009, there were 178,891 stock options, Nil Special Incentive Sharesand Options and Nil DSUs outstanding under the Employees Stock Plan.
The Employees Stock Plan permits the issuance of tandem awards in connection with the granting of options.Tandem awards provide option-holders with the choice of exercising their awards for either an option to purchasecommon shares of the Company or a Share Appreciation Right (‘‘SARs’’). The exercise price of an option isdetermined using the weighted average price at which the Company’s shares traded on the TSX on the fivetrading days preceding the grant date. SARs allow option-holders to receive cash payments equal to the amountby which the weighted average market price of the shares on the five trading days preceding the date of exerciseof the SARs exceeds the exercise price of the corresponding options. All stock options outstanding under theEmployees Stock Plan are tandem awards.
At the end of each fiscal period, the Company records a liability for previously issued tandem awards equal to theamount by which the market price of its shares at the end of the period exceeds the exercise price of the vestedtandem awards. Stock compensation expense is recorded to adjust this liability for changes in the market price ofthe Company’s shares and for awards exercised in the period. Total stock-based compensation expense related totandem awards issued from the Employees Stock Plan was a credit of $0.2 million for the fiscal year endedJanuary 31, 2009 (2007: credit of $0.5 million).
During fiscal 2008, 3,504 options (2007: 20,890 options) were exercised for SARs resulting in cash payments ofless than $0.1 million (2007: $0.2 million).
Details of the stock option transactions for the Employees Stock Plan during the fiscal year ended January 31,2009 is presented below:
WeightedNumber Average
of Options Exercise price
Outstanding and exercisable as at December 30, 2006 306,310 $ 32.67Exercised (20,890) 19.74Cancelled/forfeited (33,680) 30.94
Outstanding and exercisable as at February 2, 2008 251,740 $ 33.98Exercised (3,504) 18.95Cancelled/forfeited (69,345) 33.48
Outstanding and exercisable as at January 31, 2009 178,891 $ 34.47
The following stock options were outstanding and exercisable as at January 31, 2009:
Options WeightedOutstanding Average
Exercise and RemainingPlan Price Exercisable Life
Employees Stock Plan $ 40.68 128,591 1.021.72 8,160 2.018.37 14,450 3.018.23 8,760 4.017.59 18,930 5.0
Total 178,891
2008 Annual Report 67

10. UNUSUAL ITEMS
The Company recorded a pre-tax gain of $38.8 million in 2008 (2007: pre-tax gain of $82.2 million) comprisedof the following unusual items:
(in millions) 2008 2007
Sale of real estate $ 37.2 $ 74.0Sale of real estate joint ventures – 12.5Sale of corporate airplane – 3.5Settlement of lawsuit – (3.6)Environmental remediation – (4.5)Restructuring activities 1.6 0.3
Unusual items – gain (expense) $ 38.8 $ 82.2
Sale of real estate
In February 2008, the Company completed the sale of property in Calgary, Alberta, where it operated a full-linestore, receiving proceeds of approximately $40.0 million. A pre-tax gain of $37.2 million, net of transactioncosts, was recorded in the first quarter of 2008.
During fiscal 2007, the Company sold the property where its Hamilton, Ontario Full-line is located and its headoffice property in Toronto, Ontario for total combined proceeds of $88.0 million, net of transaction costs,resulting in a pre-tax gain of $74.0 million.
Sale of real estate joint ventures
During fiscal 2007, the Company sold interests in real estate joint ventures for proceeds of $5.2 million, net ofcash sold of $0.9 million, resulting in a pre-tax gain of $12.5 million. As part of these transactions, theCompany disposed of total assets and liabilities in the amount of $35.2 million and $41.6 million, respectively,including long-term debt assumed by the purchasers of $37.4 million.
Sale of corporate airplane
During fiscal 2007, the Company recorded a pre-tax gain of $3.5 million on the sale of its corporate airplane.
Settlement of lawsuit
During fiscal 2007, the Company expended $5.0 million to settle a lawsuit relating to a commercial dispute. Ofthe total settlement, a pre-tax expense of $3.6 million is included in unusual items as $1.4 million was accruedin prior years.
Environmental remediation
During fiscal 2007, the Company recorded a reserve of $4.5 million for environmental remediation, primarily forproperties affected by former gas bar and logistics operations. The Company continues to monitor its obligationsand will increase or decrease the reserve as required.
Restructuring activities
During fiscal 2008, the Company reversed $1.6 million of severance expense which had been accrued in a prioryear. As at January 31, 2009, the restructuring accrual has a balance of Nil.
Sears Canada Inc.68

A summary of the changes in the accrued liability related to these activities are outlined below:
Restructuring(in millions) Liability
Accrued liability December 30, 2006 $ 4.6Cash payments (2.7)Adjustment to prior period accrued liability (0.3)
Accrued liability February 2, 2008 1.6Adjustment to prior period accrued liability (1.6)
Accrued liability January 31, 2009 $ –
11. CHANGES IN NON-CASH WORKING CAPITAL BALANCES
Cash generated from (used for) non-cash working capital balances are comprised of the following:
2007(Restated –
(in millions) 2008 Note 1)
Accounts receivable $ (20.4) $ 17.1Inventories (3.1) (50.9)Prepaid expenses and other assets (0.3) 4.0Accounts payable (41.8) (142.9)Accrued liabilities (54.4) (38.8)Income and other taxes payable (74.8) (24.7)
Cash (used for) generated from non-cash working capital balances $ (194.8) $ (236.2)
12. COMMITMENTS AND CONTINGENCIES
Minimum capital and operating lease payments, exclusive of property taxes, insurance and other expenses payabledirectly by the Company, having an initial term of more than one year as at January 31, 2009 are as follows:
(in millions) Capital Leases Operating Leases
2009 $ 1.1 $ 109.72010 0.8 97.42011 0.6 85.32012 0.6 77.52013 0.4 64.4Subsequent years – 277.2
Minimum lease payments $ 3.5 $ 711.5
Less: imputed weighted average interest of 7.6% 0.5
Total capital lease obligations (Note 7) $ 3.0
Total rentals charged to earnings under all operating leases for the fiscal year ended January 31, 2009 amountedto $117.4 million (2007: $125.3 million).
Three class actions in the provinces of Quebec, Saskatchewan and Ontario were commenced against the Companyin 2005 arising out of the Company’s pricing of tires. The plaintiffs allege that the Company inflated the regularretail price of certain brands of tires sold by the Company in order to then claim that the same brands were onsale for up to 45% off the regular retail price so as to induce potential customers into believing that substantial
2008 Annual Report 69

savings were being offered. The plaintiffs seek general damages, special damages, and punitive damages, as wellas costs and pre- and post-judgment interest. No dollar amounts are specified. The plaintiffs intend to proceedwith the Quebec action and seek certification as a class action on a national basis. The outcome of this action isindeterminable, and the monetary damages, if any, cannot be reliably estimated. Therefore, the Company has notmade a provision for any potential liability.
In addition, the Company is involved in various legal proceedings incidental to the normal course of business. TheCompany is of the view that although the outcome of such litigation cannot be predicted with certainty, the finaldisposition is not expected to have a material adverse effect on the Company’s consolidated financial position orresults of operations.
Restricted cash and investments
Cash and investments are considered to be restricted when it is subject to contingent rights of a third partycustomer, vendor, or government agency. As at January 31, 2009, the Company recorded $144.8 million (2007:$5.2 million) of restricted cash and investments recorded as current assets and $6.9 million of restricted cashdeposits recorded in other long-term assets. These balances represent cash and investments pledged as collateralfor letter of credit obligations issued under the Company’s offshore merchandise purchasing program of$110.4 million the Canadian equivalent of US $90.0 million (2007: Nil), current and long-term cash depositspledged as collateral with counterparties related to outstanding derivative contracts of $28.8 million (2007: Nil)and $6.9 million (2007: Nil) respectively, and funds held in trust in accordance with regulatory requirementsgoverning advance ticket sales related to Sears Travel of $5.6 million (2007: $5.2 million).
13. GUARANTEES
The Company has provided the following significant guarantees to third parties:
Sub-lease agreements
The Company has entered into a number of agreements to sub-lease premises to third parties. The Companyretains ultimate responsibility to the landlord for payment of amounts under the lease agreements should thesub-lessee fail to pay. The total future lease payments under such agreements, included in Commitments andContingencies (Note 12), are $18.4 million.
Other indemnification agreements
In the ordinary course of business the Company has provided indemnification commitments to counterparties intransactions such as leasing transactions, royalty agreements, service arrangements, investment bankingagreements, director and officer indemnification agreements and indemnification of trustees under indentures foroutstanding public debt. The Company has also provided certain indemnification agreements in connection withthe sale of the Credit and Financial Services operations in November 2005. The foregoing indemnificationagreements require the Company to compensate the counterparties for costs incurred as a result of changes inlaws and regulations or as a result of litigation claims or statutory claims or statutory sanctions that may besuffered by a counterparty as a consequence of the transaction. The terms of these indemnification agreementswill vary based on the contract and typically do not provide for any limit on the maximum potential liability.Historically, the Company has not made any significant payments under such indemnifications and no amount hasbeen accrued in the financial statements with respect to these indemnification commitments.
14. SEGMENTED INFORMATION
The Company has two reportable operating segments: Merchandising and Real Estate Joint Venture operations.
• The Merchandising segment includes the sale of goods and services through the Company’s Retail and Directchannels. The Retail channel includes Full-line, Sears Home, Dealer, Outlet, Appliances and Mattresses stores,Cantrex and its wholly-owned subsidiary, Corbeil Electrique Inc. The Direct channel includes catalogue and
Sears Canada Inc.70

internet operations. Merchandising operations also include service revenues related to the Company’s productrepair, home improvement, travel and logistics services, and performance payments received pursuant to thelong-term credit card marketing and servicing alliance with JPMorgan Chase.
• The Real Estate Joint Venture segment includes income from the Company’s joint venture interests in shoppingcentres across Canada, most of which contain a Sears store.
The reportable segments reflect the basis on which management measures performance and makes decisionsregarding the allocation of resources. The accounting policies of the segments are the same as those described inSummary of Accounting Policies and Estimates (Note 1). During the preparation of the consolidated financialstatements, the revenues and expenses between segments are eliminated. The Company evaluates the performanceof each segment based on earnings before interest expense and income taxes, as well as capital employed. TheCompany does not allocate interest expense or income taxes to each segment.
Segmented Statements of Earnings for the fiscal years ended January 31, 2009 and February 2, 2008 areas follows:
20072008 (Restated – Note 1)
Real Estate Real Estate(in millions) Mdse. 5 Joint Ventures 6 Total Mdse. 5 Joint Ventures 6 Total
Total revenues $ 5,687.3 $ 45.9 $ 5,733.2 $ 6,272.6 $ 53.8 $ 6,326.4
Segment operating profit $ 369.7 $ 20.4 $ 390.1 $ 363.7 $ 25.0 $ 388.7Interest expense, net 10.0 12.7Unusual items – (gain) (38.8) (82.2)Income taxes 130.3 152.2
Net earnings $ 288.6 $ 306.05 In 2008, merchandising includes revenue and earnings from the alliance with JPMorgan Chase of $83.0 million (2007: $87.8 million) and
$65.7 million (2007: $59.9 million), respectively.6 The real estate joint venture revenues are net of $2.2 million (2007: $2.3 million), representing the elimination of rental revenues earned from Sears
department stores. Rental expense of the real estate joint venture segment has been decreased by the same amount, resulting in no effect on the totalsegment operating profit.
2008 Annual Report 71

Segmented Statements of Financial Position as at January 31, 2009 and February 2, 2008 are as follows:
20072008 (Restated – Note 1)
Real Estate Real Estate(in millions) Mdse. Joint Ventures Total Mdse. Joint Ventures Total
Total assets $ 3,148.3 $ 116.4 $ 3,264.7 $ 2,893.2 $ 108.5 $ 3,001.7Capital employed 1,768.4 104.3 1,872.7 1,366.7 98.8 1,465.5Average capital employed 1,569.1 101.7 1,670.8 1,272.7 112.7 1,385.4Capital expenditures 7 89.1 6.9 96.0 72.2 0.2 72.4Depreciation and amortization 8 121.6 5.3 126.9 144.2 5.9 150.17 Capital expenditures do not correspond to figures presented in the Company’s consolidated statements of cash flows, as a portion of the expenditures
above have not yet been settled in cash but are included in accounts payable on the consolidated statements of financial position at the end of theperiod (Note 4: Capital Assets). There were no capital lease additions for fiscal 2008 and 2007.
8 Included in Depreciation and amortization is the impairment charge of $1.2 million for fiscal 2008 (2007: Nil) related to the Merchandise segment.
In addition to the information above, the following amounts with respect to joint ventures are recorded in theCompany’s consolidated financial statements:
(in millions) 2008 2007
Current assets $ 12.1 $ 6.4Long-term assets 104.3 102.1Total liabilities excluding debt 12.0 9.7
Cash flow generated from (used for) – operating 19.0 15.9– investing (7.4) (0.2)– financing (7.8) (17.4)
15. RELATED PARTY TRANSACTIONS
Sears Holdings, the controlling shareholder of the Company, is the beneficial holder of 72.7% of the outstandingcommon shares of Sears Canada Inc as at January 31, 2009.
During the fiscal year, Sears Holdings charged the Company $8.8 million (2007: $9.9 million), and the Companycharged Sears Holdings $3.0 million (2007: $1.8 million), in the ordinary course of business for sharedmerchandise purchasing services, employee expenses, software support, inventory purchases. Of the above amountcharged by Sears Holdings, less than $0.1 million (2007: $0.2 million) is included in inventory at year end andthe remaining charges are included in cost of merchandise sold, operating, administrative, and selling expenses.
These transactions were recorded either at fair market value or the exchange amount, which was established andagreed to by the related parties.
As at January 31, 2009, the following related party balances existed with respect to the above transactions andare expected to be received or paid in 2009: amounts payable to Sears Holdings totaling $0.7 million (2007:$0.8 million) and amounts receivable from Sears Holdings totaling $0.8 million (2007: $0.3 million).
All related party transactions are currently reviewed by the Corporation’s Audit Committee. The Audit Committeeis responsible for pre-approving all related party transactions that have a value greater than $1.0 million.
Sears Canada Inc.72

16. CAPITAL DISCLOSURES
The Company’s objectives when managing capital are:
• Maintain financial flexibility thus allowing the Company to preserve its ability to meet financial objectives andcontinue as a going concern;
• Provide an appropriate return to shareholders; and• Maintain a capital structure that allows the Company to obtain financing should the need arise.
The Company manages and makes adjustments to its capital structure, when necessary, in light of changes ineconomic conditions, the objectives of its shareholders, the cash requirements of the business and the condition ofcapital markets. In order to maintain or adjust the capital structure the Company may pay a dividend or returncapital to shareholders, increase/decrease debt or sell assets.
The Company defines capital as follows:
• Long-term obligations, including the current portion (‘‘Long-term obligations’’); and• Shareholders’ equity.
The following table presents summary quantitative data with respect to the Company’s capital:
2007(in millions) 2008 (Restated – Note 1)
Long-term obligations $ 364.6 $ 372.1Shareholders’ equity 1,508.1 1,093.4
$ 1,872.7 $ 1,465.5
The secured $200.0 million credit facility expired in December 2008. As at January 31, 2009 the Company isnot subject to any financial covenants or ratios and the outstanding notes are unsecured. The $200.0 millionfacility was replaced with a U.S. $120.0 million letter of credit. The restricted cash and investments have beenpledged as collateral for the letter of credit.
17. FINANCIAL INSTRUMENTS
In the ordinary course of business, the Company enters into financial agreements with banks and other financialinstitutions to reduce underlying risks associated with interest rates and foreign currency. The Company does nothold or issue derivative financial instruments for trading or speculative purposes.
Financial instrument risk management
The Company’s adoption of Section 3862 and Section 3863 on February 3, 2008 has resulted in additionaldisclosure relating to the Company’s exposure to risks arising from financial instruments. The Company isexposed to credit, liquidity and market risk as a result of holding financial instruments. Market risk consists offoreign exchange and interest rate risk.
Credit risk
Credit risk refers to the possibility that the Company can suffer financial losses due to failure of the Company’scounterparties to meet their payment obligations. Exposure to credit risk exists for derivative instruments, cashand short-term investments, restricted cash and investments and accounts receivable.
As at January 31, 2009, the Company’s only exposure to counterparty risk as it relates to derivative instrumentsis represented by the fair value of the derivative contracts of $91.0 million. These contracts are placed withapproved financial institutions with secure credit ratings.
2008 Annual Report 73
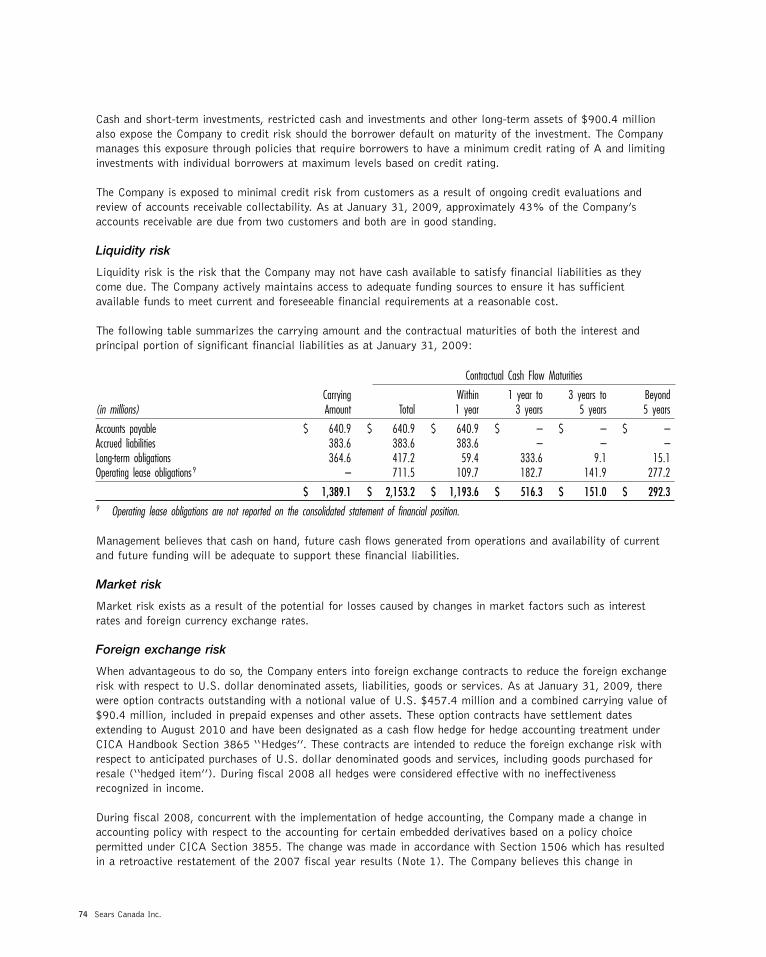
Cash and short-term investments, restricted cash and investments and other long-term assets of $900.4 millionalso expose the Company to credit risk should the borrower default on maturity of the investment. The Companymanages this exposure through policies that require borrowers to have a minimum credit rating of A and limitinginvestments with individual borrowers at maximum levels based on credit rating.
The Company is exposed to minimal credit risk from customers as a result of ongoing credit evaluations andreview of accounts receivable collectability. As at January 31, 2009, approximately 43% of the Company’saccounts receivable are due from two customers and both are in good standing.
Liquidity risk
Liquidity risk is the risk that the Company may not have cash available to satisfy financial liabilities as theycome due. The Company actively maintains access to adequate funding sources to ensure it has sufficientavailable funds to meet current and foreseeable financial requirements at a reasonable cost.
The following table summarizes the carrying amount and the contractual maturities of both the interest andprincipal portion of significant financial liabilities as at January 31, 2009:
Contractual Cash Flow Maturities
Carrying Within 1 year to 3 years to Beyond(in millions) Amount Total 1 year 3 years 5 years 5 years
Accounts payable $ 640.9 $ 640.9 $ 640.9 $ – $ – $ –Accrued liabilities 383.6 383.6 383.6 – – –Long-term obligations 364.6 417.2 59.4 333.6 9.1 15.1Operating lease obligations 9 – 711.5 109.7 182.7 141.9 277.2
$ 1,389.1 $ 2,153.2 $ 1,193.6 $ 516.3 $ 151.0 $ 292.39 Operating lease obligations are not reported on the consolidated statement of financial position.
Management believes that cash on hand, future cash flows generated from operations and availability of currentand future funding will be adequate to support these financial liabilities.
Market risk
Market risk exists as a result of the potential for losses caused by changes in market factors such as interestrates and foreign currency exchange rates.
Foreign exchange risk
When advantageous to do so, the Company enters into foreign exchange contracts to reduce the foreign exchangerisk with respect to U.S. dollar denominated assets, liabilities, goods or services. As at January 31, 2009, therewere option contracts outstanding with a notional value of U.S. $457.4 million and a combined carrying value of$90.4 million, included in prepaid expenses and other assets. These option contracts have settlement datesextending to August 2010 and have been designated as a cash flow hedge for hedge accounting treatment underCICA Handbook Section 3865 ‘‘Hedges’’. These contracts are intended to reduce the foreign exchange risk withrespect to anticipated purchases of U.S. dollar denominated goods and services, including goods purchased forresale (‘‘hedged item’’). During fiscal 2008 all hedges were considered effective with no ineffectivenessrecognized in income.
During fiscal 2008, concurrent with the implementation of hedge accounting, the Company made a change inaccounting policy with respect to the accounting for certain embedded derivatives based on a policy choicepermitted under CICA Section 3855. The change was made in accordance with Section 1506 which has resultedin a retroactive restatement of the 2007 fiscal year results (Note 1). The Company believes this change in
Sears Canada Inc.74

accounting policy results in more relevant net earnings and OCI, as the change in market value of the hedgeditem is now recognized consistent with the change in market value of the hedging item.
The Company is also subject to foreign exchange risk on U.S. dollar denominated short-term investments pledgedas collateral for letter of credit obligations issued under the Company’s offshore merchandise purchasingprogram. As at January 31, 2009, there were swap contracts outstanding with a notional value ofU.S. $90.0 million and a carrying value of $0.7 million, included in prepaid expenses and other assets. Thesecontracts mature within six months to match the term of the outstanding obligations.
While the notional principal amounts of these outstanding financial instruments are not recorded on theconsolidated statements of financial position, the fair value of the contracts is included on the consolidatedstatements of financial position in one of the following categories, depending on the derivative’s maturity andvalue: prepaid expenses and other assets, other long-term assets, accrued liabilities or other long-term liabilities.Changes in fair value of those contracts designated as hedges are included in OCI for cash flow hedges to theextent the hedges continue to be effective. Amounts previously included in OCI are reclassified to net earnings inthe same period in which the hedged item impacts net earnings.
For the fiscal year ended January 31, 2009, the Company recorded a loss of $5.7 million (2007: loss of$1.3 million), relating to the translation or settlement of U.S. dollar denominated monetary items.
Based on historic movements, volatilities in foreign exchange and management’s current assessment of thefinancial markets, the Company believes a variation of +10% (appreciation of the Canadian dollar) and �10%(depreciation of the Canadian dollar) in foreign exchange rate against the US dollar is reasonably possible over a12 month period. The period end rate was 0.8153 U.S. dollar to Canadian dollar.
Cash and short-term investments (other than those discussed above), accounts receivable and accounts payableinclude U.S. dollar denominated balances which net to an insignificant balance, therefore, any changes in theU.S./Canadian dollar exchange rates would have an immaterial impact on net earnings.
Interest rate risk
From time to time the Company enters into interest rate swap contracts with Schedule I banks to manageexposure to interest rate risks. As at January 31, 2009 and February 2, 2008, the Company had no interest rateswap contracts in place.
Interest rate risk reflects the sensitivity of the Company’s financial condition to movements in interest rates.Financial assets and liabilities which do not bear interest or bear interest at fixed rates are classified asnon-interest rate sensitive. Based on historic movements, volatilities in interest rates and management’s currentassessment of the financial markets, the Company believes a variation of +1%/�1% in the interest ratesapplicable to the Company’s cash and short-term investments and restricted cash and investments are reasonablypossible over a 12 month period.
Cash and short-term investments and restricted cash and investments are subject to interest rate risk. The totalsubject to interest rate risk at year end was $965.8 million. A movement in interest rate of +/�1% would causea variance in net earnings in the amount of $6.6 million.
2008 Annual Report 75

Classification and fair value of financial instruments
The estimated fair values of financial instruments as at January 31, 2009 and February 2, 2008 are based onrelevant market prices and information available at those dates. The following tables summarize the classificationand fair value (‘‘FV’’) of certain financial instruments as at the 2008 and 2007 fiscal year ends and the pre-taxchange in fair value of those instrument during fiscal 2008 and 2007 with the offset included in either othercomprehensive income (‘‘OCI’’) or net earnings. The Company determines the classification of a financialinstrument when it is originally recorded, based on the underlying purpose of the instrument. As a significantnumber of the Company’s assets and liabilities, including inventories and capital assets, do not meet the definitionof financial instruments, values in the tables below do not reflect the fair value of the Company as a whole.
2008 Pre-tax change(in millions) in FV included in
NetClassification Balance Sheet Category 2008 2007 OCI earnings
Available for saleShort-term investments Cash and short-term investments 10 $ 753.4 $ 806.9 $ (0.2) $ –Long-term investments Other long-term assets 1.6 2.6 – 1.0
Held for tradingCash Cash and short-term investments 66.4 64.7 – –Cash and investments Restricted cash and investments 10 144.8 5.2 – –U.S. $ derivative contracts Prepaid expenses &
other assets (Accrued liabilities) 91.1 (0.2) (99.9) 8.6Cash Other long-term assets 6.9 – – –Fixed price energy contracts Accrued liabilities – (0.1) – (0.1)Commodity derivative contracts Accrued liabilities (0.1) – – 0.1
$ (100.1) $ 9.6
2007 Pre-tax change in(in millions) FV included in
NetClassification Balance Sheet Category 2007 2006 OCI earnings
Available for saleShort-term investments Cash and short-term investments 10 $ 806.9 $ 629.1 $ 0.1 $ –Long – term investments Other long-term assets 2.6 – – 0.4
Held for tradingCash Cash and short-term investments 64.7 95.0 – –Cash and investments Restricted cash and investments 10 5.2 10.1 – –U.S. $ derivative contracts Prepaid expenses &
other assets (Accrued liabilities) (0.2) 4.2 – 4.4Fixed price energy contracts Accrued liabilities (0.1) (0.6) – (0.5)
$ 0.1 $ 4.310 Interest revenue related to short-term investments is disclosed in Long-term Obligations (Note 7).
Sears Canada Inc.76

All other assets that are financial instruments, excluding long-term notes discussed below, have been classified as‘‘loans and receivables’’ and all other financial instrument liabilities have been classified as ‘‘other liabilities’’ andare measured at amortized cost on the consolidated statements of financial position. The carrying value of thesefinancial instruments, with the exception of long-term obligations, approximates fair value. Long-term obligationswith a carrying value of $361.6 million, including the portion due within one year, but excluding all capital leaseobligations, have a fair value at January 31, 2009 of $356.3 million. The fair value of the Company’sproportionate share of long-term debt of joint ventures, with a carrying value of $61.6 million at January 31,2009, was calculated using a valuation technique based on assumptions that are not supported by observablemarket prices or rates. The term and interest rate applicable to each joint venture’s debt together withmanagement’s estimate of a risk-adjusted discount rate were used to determine the fair value of $62.0 million.The fair value of the Company’s medium term notes, with a carrying value of $300.0 million at January 31,2009, is $294.3 million and was determined with reference to observable market prices and rates.
Included in other long-term assets on the consolidated statement of financial position is an investment inlong-term notes, with an original cost of $3.0 million and a fair value as at January 31, 2009 of $1.6 million,which have been classified as available for sale. The January 31, 2009 fair value has been calculated using avaluation technique based on assumptions that are not supported by observable market prices or rates.Information disclosed in the Master Asset Vehicle 2 (MAV2) trust indenture together with management’sestimates based thereon regarding interest rate, risk-adjusted discount rate and expected term of the variousclasses of restructured notes, resulted in a $1.0 million reduction in the investment’s fair value during fiscal2008. The Company does not intend to dispose of the investment within the next year.
18. NET EARNINGS PER SHARE
A reconciliation of the number of shares used in the net earnings per share calculations is as follows:
(Number of shares) 2008 2007
Average number of shares per basicnet earnings per share calculation 107,620,995 107,620,995
Effect of dilutive instruments outstanding 5,124 24,343
Average number of shares per dilutednet earnings per share calculation 107,626,119 107,645,338
For the fiscal year ended January 31, 2009, 136,751 options (2007: 174,791 options) were excluded from thecalculation of diluted net earnings per share as they were anti-dilutive.
19. SUBSEQUENT EVENTS
Subsequent to year end, the Company announced certain staff reductions and has recorded a charge of$9.3 million in the first quarter on account thereof.
2008 Annual Report 77

Board of Directors
E. J. Bird un5 President Overflow Ministries
William C. Crowley n Executive Vice President and Chief Administrative Officer Sears Holdings Corporation
Deidra D. Cheeks Merriwether 5l Senior Vice President, Procurement and Finance Sears Holdings Corporation
William R. Harker n5 Senior Vice President, Human Resources, General Counsel and Corporate Secretary Sears Holdings Corporation
R. Raja Khanna ul Co-Chief Executive Officer GlassBOX Television
Jon Lukomnik u5l Managing Partner Sinclair Capital LLC
Dene L. Rogers President and Chief Executive Officer of the Corporation
Debi E. Rosati un l President RosatiNet, Inc.
Committees
u Audit Committee n Human Resources and Compensation Committee
5 Investment Committee
l Nominating and Corporate Governance Committee
Officers
Dene L. Rogers President and Chief Executive Officer
Timothy E. Flemming Senior Vice-President, Corporate Procurement and Supply Chain
Allen R. Ravas Senior Vice-President and Chief Financial Officer
Dennis Singh Senior Vice-President, Retail Sales
Sears Canada Inc.78

Head Office
Sears Canada Inc. 290 Yonge Street Suite 700 Toronto, Ontario M5B 2C3
Website: www.sears.ca E-mail: [email protected]
For more information about the Company, or for additional copies of the Annual Report, write to the Corporate Communications Department at the Head Office of Sears Canada Inc., or call 416-941-4425.
The Company’s regulatory filings can be found on the SEDAR website at www.sedar.com.
Stock Exchange Listing
Toronto Stock Exchange Trading symbol: SCC
Transfer Agent and Registrar
CIBC Mellon Trust Company Toronto, Ontario Montréal, Québec
Answerline: 416-643-5500 1-800-387-0825
Website: www.cibcmellon.com
E-Mail: [email protected]
Annual Meeting
The Annual Meeting of Shareholders of Sears Canada Inc. will be held on Thursday, April 23, 2009 at 8:00 a.m. in Room 551, Fifth floor, 290 Yonge Street, Suite 700, Toronto, Ontario, Canada.
Édition française du Rapport annuel
On peut se procurer l’édition française de ce rapport en écrivant au:
Service national de communication Sears Canada Inc. 290 Yonge Street Suite 700 Toronto, Ontario M5B 2C3
Pour de plus amples renseignements au sujet de la Société, veuillez écrire au Service national de communication, ou composez le 416-941-4425.
Les dépôts réglementaires de la Société figurent sur le site Web de SEDAR à l`adresse www.sedar.com.
CORPORATE INFORMATION
2008 Annual Report 79

This page has been intentionally left blank.
Sears Canada Inc.80

Produced by Sears Canada Inc. Corporate CommunicationsTypesetting by Merrill Corporation CanadaPrinted in Canada by Kempenfelt Graphics Group
Certain brands mentioned in this report are the trademarks of Sears Canada Inc., Sears, Roebuck and Co., or used under license. Others are the property of their respective owners.
