re : tax review in south australia - yoursayassets.yoursay.sa.gov.au/static/tax_review/financial...
TRANSCRIPT

8 April 2015 Department of Treasury and Finance State Tax Review GPO Box 1045 ADELAIDE SA 5001 Dear Sir/Madam RE : TAX REVIEW IN SOUTH AUSTRALIA The Financial Services Council (FSC) thanks the South Australian Government for the opportunity to provide input into the Tax Review. This is a landmark review for which the South Australian Government should be congratulated. Tax issues for state governments are particularly sensitive given the vertical fiscal imbalance and we applaud the leadership shown by initiating this process. We strongly encourage all states and territories to engage in the Commonwealth Government’s Tax White Paper process. Without complete participation from all members of the Australian Federation, meaningful tax reform in Australia will not be possible. The FSC represents Australia's retail and wholesale funds management businesses, superannuation funds, life insurers, financial advisory networks, licensed trustee companies and public trustees. The FSC has over 125 members who are responsible for investing more than $2.5 trillion on behalf of 11 million Australians. The pool of funds under management is larger than Australia’s GDP and the capitalisation of the Australian Securities Exchange and is the third largest pool of managed funds in the world. The Financial Services Council promotes best practice for the financial services industry by setting mandatory Standards for its members and providing Guidance Notes to assist in operational efficiency. Abolition of Inefficient State Taxes The FSC supports abolition of inefficient state taxes and will also be making submissions on this point to the Commonwealth’s Tax Whitepaper process. Modelling conducted for the Henry Review showed that six of the 10 taxes that have the highest marginal cost on society are state taxes. Taxes on insurance, payroll, motor vehicles, real estate and stamp duties are among the most distortionary and inefficient in the economy. Further, the FSC’s 2012 CEO Survey supported the need for tax reform, with 78 per cent of CEOs stating that the current tax system was impeding productivity growth.
1 CEOs specifically argued that
Governments should remove transactional state-based taxes and broaden the consumption tax base. In June 2010 the FSC called on the federal Government to finish the job of abolishing the remaining inefficient state taxes. Since then the need for reform has become urgent. The revenue impact of excluding fresh food, education and health from the GST have been exacerbated by changes in consumption patterns, including:
1 FSC, 2012 CEO Survey, page 14
<http://www.fsc.org.au/downloads/file/MediaReleaseFile/FSCDSTCEOSurveyFinal_MediaReleaseReport.pdf>

Page 2 of 4
slower growth in spending on clothing and household furnishings, that drove GST
revenue in the early and mid-2000s, and
faster growth in consumption over the past decade being in two areas of the economy
excluded from the GST – education and health.
As a result, a 40 per cent of all spending falls outside of the GST. The FSC recognises that GST reform is a difficult issue that poses significant political challenges for the States and that South Australia cannot drive these changes in isolation. National tax reform, including the abolition of state taxes, does however have a number benefits for the economy, consumers and the Financial Services industry of South Australia. Included with this submission is a copy of modelling commissioned by the Finance Industry Council of Australia (FICA) in 2010 and conducted by Deloitte (see Appendix 1). This modelling includes several scenarios involving abolishing state taxes and replacing them with other sources of revenue, and shows that an increase in the GST of 3.2 percentage points (to 13.2 per cent) would generate sufficient revenue to compensate the states. Stamp duty on life insurance contracts Commonwealth Grants Commission data shows South Australia relies more heavily on insurance stamp duties than many other States. It is currently the second most reliant on insurance stamp duties, is 40 percent higher than New South Wales and has a 30 percent higher contribution from insurance stamp duties than Queensland (South Australian Government, FSC Analysis, 2015)
2.
It is recognised government policy, world-wide, that concessional tax and stamp duty treatment should be afforded to policy owners who provide for themselves and their families by securing long term capital benefits by way of life insurance policies. We advocate that the concessional stamp duty treatment afforded to premiums for life insurance death benefits should also be afforded to premiums for Total and Permanent Disablement insurance, Trauma insurance and Disability Income insurance, issued by life insurance companies, for exactly the same reasons. These kinds of insurance benefits can serve as a substitute for government social security programs, provide a layer of protection against financial pressures, can prevent the liquidation of savings and assets during hard times and reduce the financial stress which often leads to significant health issues. We believe it is inappropriate for State and Territory governments to impose stamp duty on life insurance or disability insurance within Australia’s compulsory contribution superannuation system, as this cost is funded from the Members’ superannuation accounts. This is compounded in South Australia where the highest stamp duty rates in Australia are applied to premiums for life insurance and disability insurance. Not only does South Australia impose the highest rate of stamp duty on insurance premiums but also South Australia employs a different method to other States when calculating the duty applicable to life insurance contracts. This causes considerable difficulty and administrative burdens for life insurance providers operating in multiple States and the FSC is aware of at least one example where a provider has withdrawn from the South Australian market as a direct result. This creates a productivity drag on life insurers because it necessitates complex assessment processes, legal fees and systems reconfiguration all of which would be simplified under a harmonised system, or not necessary at all if stamp duty was abolished.
2 FSC Analysis of South Australian Government Data, State Tax Review Discussion Paper, 2015

Page 3 of 4
The FSC recommends the abolition of stamp duty on life insurance and long term disability insurance premiums. If that recommendation is not able to be achieved in the near term, than until abolition can be achieved, South Australia should focus on aligning its methodology to that of some of the other States. In advocating an alignment of methodology, FSC distinguishes the NSW and ACT regimes in particular as being meritorious. The FSC does not advocate the piecemeal approach to ‘life insurance’ exemption taken by Western Australia and Victoria. Those states, like the current South Australian system, expose long term disability insurance premiums to the highest stamp duty charge and by applying different stamp duty outcomes to different insurance events for the same sum insured within a single life insurance policy, result in a dislocated and expensive policy administration system. The NSW regime is the preferred model pending abolition and the ACT model has taken great strides forward by introducing a total stamp duty exemption for all insurances over the 5 years commencing in 2012. The mechanism currently used in South Australia to levy transfer (“stamp”) duty on insurance contracts is a specific example of where an inefficient State tax particularly impacts on the financial services industry.
The FSC recommends that South Australia:
1. abolish all duties (life insurance and general insurance duty) applicable to life insurance
contracts as defined in the Life Insurance Act (Cth) that are issued by life insurance
companies. This will assist in improving the substantial issue of underinsurance, the
costs for which all levels of Government ultimately bear;
2. in the absence of 1, abolish general insurance duty as referred to above;
3. in the absence of 1 and 2, adopt NSW’s law and treatment of life insurance and riders to
life insurance policies (first year’s premium only for both).
Stamp duty on marketable securities Section 86 of the Duties Act 1923 (SA) imposes a stamp duty obligation on the transferee of shares in a company or units in a unit trust where the company is registered in South Australia or, generally, where the unit trust register is kept in South Australia. An exemption applies to listed securities under s 83. The following table confirms all other States and Territories of Australia have abolished this type of duty with the exception of New South Wales, which is ear-marked for removal within the legislation in 2016.
Victoria Abolished from 1 July 2002
Queensland Abolished from 1 January 2007
Western Australia Abolished from 1 January 2004
Tasmania Abolished from 1 July 2010
Australian Capital Territory Abolished from 1 July 2010
Northern Territory Abolished from 1 July 2006
New South Wales To be abolished from 1 July 2016
The funds management industry is a significant sector in the Australian economy with $2.5 trillion of funds under management and contributing 9% of GDP. South Australia remains one of the last two States with this prohibitive and anti-competitive duty and as a consequence, has a negligible funds management industry. Because of the portability of funds under management, unit trust registers can be kept in other States, meaning that South Australia is at a competitive disadvantage in offering funds management services.

Page 4 of 4
Further, stamp duty from transfers of units can be avoided through bypassing the sale process where the fund manager redeems a unit for the “transferor” and allows a new application of units for the “transferee”. As a result, of the few unit trust registers kept in South Australia, we expect the duty collected to be nominal. Therefore, the FSC proposes a total abolishment of duty on marketable securities, other than a transfer of securities that constitute a prescribed interest in a landholding entity under Part 4 of the Duties Act 1923 (SA). Payroll tax and financial advisers Under requirements in the Corporations law, financial planners are not authorised to receive fees directly from their clients. Instead, the fees owed to financial planners by their clients must be paid to the financial planner’s dealer group (as the dealer group is the holder of the Australian Financial Services Licence). This has lead to confusion and uncertainty for both the Revenue and planners in relation to the application of the Payroll Tax Act 2007 (SA) (“the Act”), which is harmonised Australia-wide, in that independent financial planners appear to receive payments from only one source (the dealer group) when in reality these payments originate from the client under a ‘fee for service’ arrangement. Further, it has meant that planners are often required by the Revenue to prove the application of an exemption (when in reality there is no primary duty in any case). Despite industry’s expectation that the existing exemptions in the Act will apply to 100% of cases small businesses in South Australia face significant and unnecessary compliance burdens to prove their eligibility under these exemptions. Attached is a copy of representations made to the South Australian Treasurer, the Hon Jack Snelling, in July 2012 which includes further detail on this issue (see Appendix 2). We ask that the Government introduce a specific exemption for financial planners be discussed with other States (including NSW, Queensland and Victoria) for inclusion in the harmonised Payroll Tax legislation. We note that a previous exemption in the NSW Act provided clarity and confirmed the policy that planners should not be caught by the provisions merely because of the way the industry treats client payments. Should you wish to discuss this submission further please do not hesitate to contact me on (02) 9299 3022. Yours sincerely
ANDREW BRAGG Director of Policy
2011 Analysis of State Tax Report Finance Industry Council of Australia

Liability limited by a scheme approved under Professional Standards Legislation. Deloitte refers to one or more of Deloitte Touche Tohmatsu Limited, a UK private company limited by guarantee, and its network of member firms, each of which is a legally separate and independent entity. Please see www.deloitte.com/au/about for a detailed description of the legal structure of Deloitte Touche Tohmatsu Limited and its member firms. © 2011 Deloitte Access Economics Pty Ltd
19 May 2011
Analysis of State tax reform
It is my pleasure to present you with this report on the both the efficiency of existing State and Federal taxation arrangements and results of selected revenue neutral taxation reform scenarios.
Economic modelling of taxation efficiency is invaluable in building the case for taxation reform, providing quantitative evidence for the contribution such reform can make to the Australian economy. We believe the results of this report make an important contribution to the existing conversation on Australian taxation reform, and can help to position FICA and its members as intellectual leaders in the debate.
Yours sincerely,
Steve Brown Partner Deloitte Access Economics
Deloitte Access Economics Pty Ltd ACN: 149 633 116
Level 1, 9 Sydney Ave
Barton ACT 2600
PO Box 6334
Kingston ACT 2604
Tel: +61 2 6175 2000
Fax: +61 2 6175 2001
www.deloitte.com.au
2011 Analysis of State Tax Report
i Deloitte Access Economics Commercial-in-confidence
Contents 1 Background .......................................................................................................................... 5
1.1 Sources of State tax revenue ................................................................................................. 7
2 Assessing the efficiency of taxes ......................................................................................... 8
3 Ranking State and Federal taxes ......................................................................................... 9
3.1 General rankings of State and Federal taxes ....................................................................... 10
3.2 Detailed rankings of State and Federal taxes ....................................................................... 11
3.3 Limitations of quantitative ranking ...................................................................................... 12
4 Developing options for State tax reform ........................................................................... 15
4.1 Modelling scenarios ............................................................................................................. 15
4.2 Results: Impact on revenue bases........................................................................................ 16
Conclusions .................................................................................................................................. 21
References ................................................................................................................................... 22
Appendix A ................................................................................................................................... 23
Limitation of our work ..................................................................................................................... 25
Charts Chart 3.1 : General efficiency rankings of State and Federal taxes ............................................. 10
Chart 3.2 : Detailed efficiency rankings of State and Federal taxes ............................................ 12
Tables Table 1.1 : Distribution of State/Territory tax revenue 2008-09 (%) ............................................. 7
Table 4.1 : Removal of taxes by scenario - first round revenue effects ...................................... 17
Table 4.2 : Removal of taxes by scenario - second round revenue effects ................................. 17
Table 4.3 : Revenue shortfall to make reform revenue-neutral .................................................. 18
Table 4.4 : Economic welfare gain by scenario - revenue neutral ............................................... 19
Table 4.5 : Tax increases by scenario and state ........................................................................... 20
Table 4.6 : Sectors and occupations in MMRF-NRA .................................................................... 24
Deloitte Access Economics
2011 Analysis of State Tax Report
2 Deloitte Access Economics Commercial-in-confidence
Executive Summary There is general consensus on the need for State taxation reform and the notion that large potential gains may be achieved, particularly from the abolition of inefficient State transaction taxes. For example, the comprehensive study of taxes in Australia undertaken in the Henry Review concludes that ideally all stamp duties and insurance taxes would be replaced by more efficient taxes. Reviews undertaken by States into their own tax systems – such as the IPART review of the NSW State taxation – have made similar recommendations. The need for State tax reform is also reiterated by the Treasury in their brief provided to the incoming Federal Government in 2010.
The relative efficiency of State taxes
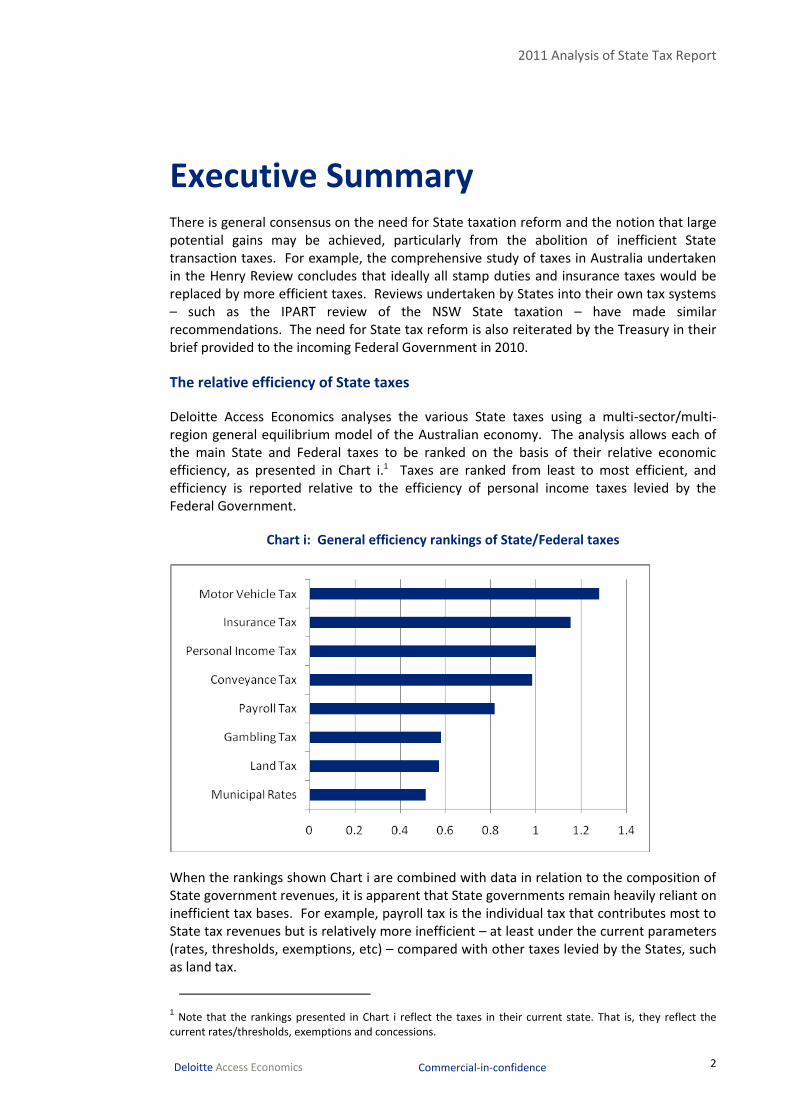
Deloitte Access Economics analyses the various State taxes using a multi-sector/multi-region general equilibrium model of the Australian economy. The analysis allows each of the main State and Federal taxes to be ranked on the basis of their relative economic efficiency, as presented in Chart i.1 Taxes are ranked from least to most efficient, and efficiency is reported relative to the efficiency of personal income taxes levied by the Federal Government.
Chart i: General efficiency rankings of State/Federal taxes
When the rankings shown Chart i are combined with data in relation to the composition of State government revenues, it is apparent that State governments remain heavily reliant on inefficient tax bases. For example, payroll tax is the individual tax that contributes most to State tax revenues but is relatively more inefficient – at least under the current parameters (rates, thresholds, exemptions, etc) – compared with other taxes levied by the States, such as land tax.
1 Note that the rankings presented in Chart i reflect the taxes in their current state. That is, they reflect the
current rates/thresholds, exemptions and concessions.

2011 Analysis of State Tax Report
3 Deloitte Access Economics Commercial-in-confidence
Modelled reform scenarios
The efficiency rankings provide a basis for considering various options for the reform of State taxes. Six different reform scenarios in relation to the abolition of State transaction taxes are modelled in this report. The scenarios have been designed within a revenue-neutral framework based on increased reliance on efficient taxes and reduced reliance on inefficient taxes – and hence, an overall improvement in the efficiency of the tax system. and the potential benefits of redesigning State tax systems to reduce reliance on inefficient taxes.
In each of the scenarios the revenue gap generated2 from abolishing State transaction taxes (property transaction taxes and/or non-property transaction taxes) is offset by an increase in more efficient broad-based taxes (land taxes, payroll taxes, combination of the two, or the GST), and the resulting impact on economic welfare is derived.
The six scenarios are:
Scenario A: All State transaction taxes are abolished for an increase in the current GST, with no change in the current GST exemptions.
Scenario B1: All State property transaction taxes are abolished for an increase in land tax. Land taxes are increased with all current exemptions in place, such as for the principal place of residence; and
Scenario B2: All State property transaction taxes are abolished for an increase in land tax. Land taxes are increased without any exemptions, which is essentially a municipal tax.
Scenario C1: All State non-property transaction taxes abolished for an increase in payroll tax. Payroll taxes are increased with current exemptions and thresholds in place; and
Scenario C2: All State non-property transaction taxes abolished for an increase in payroll tax. Payroll taxes are increase without exemptions, that is, a broad-based payroll tax.
Scenario D: ‘Henry/Tax Summit’ tax reform package with State transaction tax reform designed to be revenue-neutral where property transaction taxes are replaced by broad-based land taxes and other transaction taxes are replaced with a broad-based payroll tax. (This scenario is thus a combination of Scenarios B2 and C2.)
Table i: Economic welfare gain by scenario - revenue neutral
Scenario Revenue gap, $mil Welfare gain, % Welfare gain, $mil
Scenario A 10,393 1.74% 11,876
Scenario B1 7,453 0.72% 4,914
Scenario B2 7,453 0.78% 5,323
Scenario C1 3,202 0.49% 3,344
Scenario C2 3,202 0.52% 3,549
Scenario D 10,393 1.31% 8,941
Source: Deloitte Access Economics estimates. All dollars are $AU2008-09
2 The revenue gap is defined here as the direct impact on government revenue due to the abolition of a tax –
that is, the first round effect before behavioral effects are taken into account.

2011 Analysis of State Tax Report
4 Deloitte Access Economics Commercial-in-confidence
The analysis suggests that the potential gains from the reform of State taxation are large. The abolition of inefficient State transaction taxes with a corresponding increase in other more efficient taxes can yield economic welfare gains in the order of 1.3% to 1.7% increase in Australian household consumption – approximately $2.3 billion to $3.1 billion.
While the largest net economic benefit is where the abolition of State taxes is offset by an increase in the GST (driven in large part by the high efficiency of the GST), and therefore requiring involvement of the Federal Government, there are nonetheless significant gains to be realised by States acting unilaterally and shifting their tax base away from reliance on less efficient taxes. For example, the replacement of property transaction taxes by broad-based land taxes along with the replacement of other transaction taxes with broad-based payroll taxes (Scenario D) is estimated to yield economic welfare gains of around 1.3% (measured in terms of household consumption).
In any such reforms of the tax system, a range of policy objectives will need to be considered including impacts on equity and the simplicity of the system both from the perspective of administration and compliance. Nevertheless, the potential gains to economic efficiency indicate that there is scope for substantial benefits to be achieved through State tax reform.
Deloitte Access Economics

2011 Analysis of State Tax Report
5 Deloitte Access Economics Commercial-in-confidence
1 Background In February 2008 Access Economics prepared a report for the Finance Industry Council of Australia (FICA) detailing a quantitative analysis of the efficiency of individual taxes and a number of revenue neutral tax reform scenarios. This report highlighted a number inefficiencies associated with the mix of taxes that States have traditionally relied on as a revenue base. Since then, there have been significant developments in relation to policies for State taxation reform, mainly the comprehensive review of Australia’s Future Tax System (the ‘Henry Review’). Furthermore, the Treasury has made publicly available the 2010 incoming government brief. There have also been discussions of a Federal Tax Summit to occur in mid-2011. With these developments in mind, it is valuable to review and update the findings of the 2008 report.
Access Economics’ 2008 report
The 2008 report to FICA presented the efficiency rankings of the various State taxes and modelled several revenue neutral scenarios to estimate the impact of replacing State transaction taxes with a number of more efficient taxes. The results provided strong evidence on the inefficiencies associated with transaction-based taxes, especially when imposed on business. Importantly, while the direct incidence of such taxes fall on business, the ultimate ‘economic incidence’ tends to fall on households, distorting prices and ultimately reducing consumption possibilities.
The efficiency rankings indicated the direction that future taxation reform could take in order to improve economic efficiency. In particular, the impact on economic welfare of abolishing some or all stamp duties and replacing the lost revenue through adjustments to either Commonwealth revenue (as represented by personal income taxes) or land taxes (as modelled by municipal rates) indicated that the potential gains from the reform of State taxation are large, with possible net benefits each year to economic welfare in the long term of between 1% and 2%, the equivalent of $6 to $10 billion in household consumption. While their revenue bases are relatively narrow, the States do have the scope to improve the overall efficiency of the taxation system through the replacement of transaction based taxes with less distortionary taxes such as taxes on immobile property.
The Henry Review
In 2010 the highly anticipated findings of the Review of Australia’s Future Tax System (or ‘Henry Review‘) were released. The analysis in the Henry Review was wide ranging (only the GST was explicitly ruled out of its Terms of Reference), and where there was overlap between the Henry Review and Access Economics’ 2008 analysis, the conclusions of the two were consistent. The Review found that many of the least efficient taxes are levied by the States, detracting from the overall efficiency of the broader tax system, and that the structure of the tax system could be improved by replacing inefficient taxes with a rationalised suite of taxes and streamlining the administrative requirements. The Review concluded that States will benefit from better access to sustainable tax revenues to fund their expenditures.

2011 Analysis of State Tax Report
6 Deloitte Access Economics Commercial-in-confidence
In relation to State taxes, the following recommendations were made:
Ideally, there would be no stamp duties, including conveyance duties, with the removal of stamp duties achieved through a switch to more efficient taxes, such as those levied on broad consumption or land bases (Recommendation 51).
The land tax base should be broadened in the long run to include all land, with low-value land (such as most agricultural land) falling below the lowest rate threshold (Recommendation 53).
Over time, a broad-based cash flow tax could be used to finance the abolition of other taxes, including payroll tax and inefficient State consumption taxes, such as insurance taxes, which would also provide a sustainable revenue base to finance future spending needs (Recommendation 55).
In relation to payroll taxes, the Review recommended that they should eventually be replaced with revenue from more efficient broad-based taxes that capture the value-add of labour (Recommendation 57).
The Review also recommended the abolition of all specific taxes on insurance products, including the fire services levy, with insurance products treated like most other services and subject only to one broad-based tax on consumption (Recommendation 79).
Finally the Review recommended that reforms to State taxes should be coordinated through intergovernmental agreements between the Federal Government and the States to provide the States with revenue stability and to facilitate good policy outcomes (Recommendation 119).
Treasury Brief – the ‘Red Book’
In September 2010, the Australian Treasury released under Freedom of Information the brief prepared for the returning Federal Labour Government (the Red Book). The brief highlighted the importance of State tax reform as a priority for reform to provide the greatest potential contributions to economic performance. It considered taxes levied by the States as some of the least efficient and worst designed taxes in Australia’s tax system. The key substantive State taxes that were identified as needing reforming include:
stamp duties on insurance, housing, commercial property and motor vehicles (the Treasury recommended their abolition);
payroll and land taxes (the Treasury recommended they be reformed or replaced with more efficient taxes); and
road pricing (the Treasury recommended its introduction).
The brief considered the Henry Review vision of a cash flow tax in replacement of various State taxes as a long-term option and that State tax reform would need to be a key focus of the COAG agenda for the next term.

2011 Analysis of State Tax Report
7 Deloitte Access Economics Commercial-in-confidence
Federal tax summit
A Federal tax summit is to be held in October 2011 following the promise by the Federal Government to hold a substantial discussion of tax reforms and the recommendations of the Henry Review. The Federal tax summit would provide an opportunity to consider the efficiency of various State taxes and the scope for reform. This report provides an important contribution to the Commonwealth Tax Forum.
1.1 Sources of State tax revenue
Table 1.1 lists the various State taxes and their contribution to State revenues in 2008-09. A number of inefficient State taxes, especially the financial services transactions taxes, were abolished once the goods and services tax (GST) was introduced in July 2000. The remaining State taxes include:
payroll taxes;
property taxes (including land tax, municipal rates and stamp duty on property conveyances);
gambling taxes;
insurance taxes (including the fire services levy and other insurance levies); and
motor vehicle taxes (including registration fees and stamp duty on motor vehicle conveyances).
Table 1.1: Distribution of State/Territory tax revenue 2008-09 (%)
Tax NSW VIC QLD SA WA TAS NT ACT
Payroll 31 26 25 20 33 23 32 28
Property 41 47 49 54 45 51 38 46
Land tax 11 8 8 11 8 8 0 9
Municipal rates 15 19 21 21 18 25 15 18
Other levies 0 1 3 3 3 3 0 2
Conveyance duty 15 18 18 18 15 15 23 17
Gambling 8 11 8 9 3 9 15 8
Insurance 9 8 4 7 6 5 6 7
Fire service levy 3 3 0 0 0 2 0 2
Other insurance 7 5 4 7 6 4 6 6
Motor vehicles 10 9 13 10 13 11 9 11
Conveyance duty 3 3 4 3 5 4 4 3
Registration fees 8 5 9 7 8 8 5 7
Total revenue 100 100 100 100 100 100 100 100
Source: Australian Bureau of Statistics cat 5506, Tables 11 to 18, 2008-09. Note that numbers may not sum because of rounding.
As shown, payroll tax makes the largest single contribution to tax revenues, accounting for between 23% and 33% of tax revenue. This is followed by the various taxes on property, namely land tax, municipal rates and stamp duty on property conveyances, with States relying on property taxes for around half of all tax revenue. The remaining quarter of tax

2011 Analysis of State Tax Report
8 Deloitte Access Economics Commercial-in-confidence
revenues are collected from gambling, insurance and taxes on motor vehicles. The distribution of tax revenues for States and Territories remains similar to the previous study, which used the most recent data at the time of 2005-06.
2 Assessing the efficiency of taxes The existing State taxes and potential reform options can be evaluated against the standard taxation principles of efficiency, equity, simplicity and sustainability. Efficient taxes minimise the distortion of economic decision making and the allocation of resources. Two characteristics of an efficient tax are:
broad bases with minimum concessions or exemptions
• broad bases will minimise efforts to evade or avoid tax; and
low, uniform tax rates.
The equity of taxes can be assessed in terms of:
Vertical equity which relates to the capacity to pay - taxes are paid in proportion to wealth, and those with a greater capacity to pay would pay a proportionately greater amount. This would mean that lower income taxpayers should not only pay relatively less tax but also a relatively lower proportion of tax; and
Horizontal equity which relates to equal treatment – that is, taxpayers in similar circumstances should bear a similar tax burden.
An ideal tax system is also simple, with the following characteristics:
A tax system should be simple to administer relative to the revenue raised. This can depend on the number of different taxes, which affects the costs of collecting taxes, monitoring compliance, educating and informing taxpayers, and enforcement;
A tax system should have low compliance costs relative to the revenue raised, which depends on the complexity of calculating tax liabilities which in turn is a function of the number of thresholds, concessions, exemptions, the clarity in the legislation, degree of interstate harmonisation in terms of tax bases and rates, and compliance requirements in terms of record keeping; and
A tax system should be transparent, in that there should be clarity in the purpose of the tax, what is being taxed, who is liable, and how liability is calculated so that taxpayers can understand the scope and applicability, and can have certainty in their individual tax liability.
Finally, taxes should be sustainable to maintain total tax revenue. The characteristics of a sustainable tax are:
taxes should generate revenue that grows in line with economic growth and population change to ensure that the changing costs of Government services are met automatically and with least risk;
taxation revenue should display stability so the tax revenues does not undergo wild fluctuations - in particular the bases should not be highly cyclical, volatile or unpredictable. Transaction taxes in particular depend on the level of activity in the

2011 Analysis of State Tax Report
9 Deloitte Access Economics Commercial-in-confidence
economy which can change substantially from year to year, while taxes with immobile tax bases, such as land taxes, are more stable; and
taxation revenue should be resilient to changes in market and industry structures, to minimise the requirement for taxation reform as the economy goes through periods of structural change.
Reform options by individual States will also need to consider the impact on interstate competitiveness, in that States need to maintain comparable tax rates to prevent individuals and businesses relocating to other States to take advantage of more favourable tax systems. However, the competitiveness also depends on other factors such as the quality of infrastructure, and where a State relies more heavily on more efficient taxes, it is likely to promote a stronger economy.
Quantitative assessment of taxation
It is clear that when considering the relative merits of different taxation schemes there are a number of criteria that might be considered, including the degree to which different taxes affect economic growth, issues of equity, compliance and administration costs, and the sustainability of the different taxes. Of the criteria given here, it is economic growth and consumption possibilities that are captured best in economic models, and it is this criteria that is used in this report to rank the efficiency of different taxes. Ideally, a tax should raise the money required to fund government expenditures with the lowest possible impact on utility, measured in the model as the value of consumption3.
To determine the relative efficiency of the various State and Federal taxes we measure the ratio between changes in household consumption and changes in state revenue due to a 1% increase in the effective rate of each tax – lower ratios indicate that there is greater capacity for governments to generate revenue while minimising the impact on households.
The general equilibrium model used in the analysis is outlined in Appendix A. Despite requiring some simplifying assumptions, the use of a general equilibrium model allows the various taxes to be assessed in a consistent and comprehensive manner, ensuring that economic identities remain satisfied at all times.
3 Ranking State and Federal taxes This section presents the general and detailed rankings of the efficiency of State and Federal taxes, and provides some discussion on the limitations of quantitative rankings.
3 Households in the model are assumed to maximise utility for a given level of consumption, thus maximisation
of consumption corresponds to maximisation of utility.

2011 Analysis of State Tax Report
10 Deloitte Access Economics Commercial-in-confidence
3.1 General rankings of State and Federal taxes
Chart 3.1 summarises the efficiency rankings of State and Federal taxes.4 The efficiency rankings are based on the ratio of the percentage change in real consumption to the percentage change in tax revenue as a result of changing each tax in turn, with the least efficient taxes causing the largest loss in terms of real consumption relative to the tax revenue raised. The ranking reflects a combination of:
the assumed differences in the elasticity of supply and demand in the relevant markets; and
whether the taxes fall on businesses or households. Those that directly affect business tend to be less efficient since:
they have a proportionally larger impact on export industries which face very elastic demand; and
they have second-round impacts through their effect on the cost of capital and, thus, investment decisions and the accumulation of capital.
Taxes are ranked from least to most efficient, and efficiency is reported relative to the efficiency of personal income taxes levied by the Federal Government. Taxes that are less efficient than personal income tax score an efficiency index greater than one while those that are more efficient score an efficiency index of less than one.
Chart 3.1: General efficiency rankings of State and Federal taxes
0 0.2 0.4 0.6 0.8 1 1.2 1.4
Municipal Rates
Land Tax
Gambling tax
Payroll
Conveyance Tax
Income
Insurance Tax
Motor Vehicle Tax
Source: Deloitte Access Economics estimates
As demonstrated in Chart 3.1, motor vehicle taxes (specifically, stamp duties on motor vehicles) and taxes on insurance are least efficient while municipal rates, land taxes and gambling taxes are most efficient. While there has been some small movement in the
4 Note that the rankings presented in Chart 3.1 reflect the taxes in their current state. That is, they reflect the
current rates/thresholds, exemptions and concessions.

2011 Analysis of State Tax Report
11 Deloitte Access Economics Commercial-in-confidence
efficiencies of individual taxes since the previous report to FICA these movements have had no impact on the order of efficiency rankings.
Land taxes (including municipal rates) are relatively more efficient as they, in effect, fall on the rental price of immovable land, and empirical studies of markets for land find very low elasticities of both demand and, especially, supply. Taxes in such markets create relatively small distortions and are therefore ideal from the perspective of efficient taxation arrangements. Nevertheless, the efficiency of land taxes is reduced by the various thresholds and exemptions, with rates differing between taxpayers according to, amongst other things, the use of the land. This in turn affects the incidence of the taxes, making it likely that the burden of the tax may be passed on from landowners to renters.
For similar reasons, activities such as gambling are also relatively efficient markets to tax. Empirical estimates indicate that the elasticity of demand for legal gambling tends to be low while the supply of legal gambling also has a low elasticity of supply due to regulatory arrangements controlling the number of gaming machines, casinos and other vendors.
On the other hand, taxes such as conveyance duties on motor vehicles are inefficient as mobile capital, such as motor vehicles, have extremely elastic supply in the long run. In the same way the high elasticity of supply on general and life insurance contributes to taxes on these products being relatively inefficient.
Conveyance duties apply to the combined value of land and buildings and as such as can be regarded as a weighted average of a relatively efficient tax base (land) and an inefficient base (buildings). On average, conveyance duties tend to be more efficient than most business taxes as they are heavily weighted toward residential property transfers which are roughly equally divided between land and non-land (buildings) capital, with the land based component of residential conveyance duties offsetting the relative inefficiency of the non-land based residential conveyance duty.
The relative rankings demonstrate that the tax base upon which State Governments rely is heavily skewed toward relatively inefficient taxes. For example, as shown in Table 1.1, payroll tax is the individual tax that contributes most to State tax revenues but it relatively more inefficient than other taxes levied by the States, such as land tax. The efficiency of payroll taxes is reduced as the structure of the tax means it is not necessarily broad-based - the States impose payroll taxes only to businesses with payrolls above a certain threshold and there are numerous exemptions for certain categories of employers and types of payments.
3.2 Detailed rankings of State and Federal taxes
In order to explore the efficiency ranking in more detail, Chart 3.25 separates conveyance duties, motor vehicle taxes and land taxes into those applying to household and business capital. In each case, taxes levied on business (non-residential property) are less efficient than the same tax levied on households (residential property).
5 Note that the rankings presented in Chart 3.2 reflect the taxes in their current state. That is, they reflect the
current rates/thresholds, exemptions and concessions.

2011 Analysis of State Tax Report
12 Deloitte Access Economics Commercial-in-confidence
Chart 3.2: Detailed efficiency rankings of State and Federal taxes
0 0.2 0.4 0.6 0.8 1 1.2 1.4 1.6
Municipal Rates (residential)
Land Tax (residential)
Gambling
Municipal Rates (non-residential)
Land Tax (non-residential)
Payroll
Conveyance Taxes (residential)
Income
Conveyance Taxes (non-residential)
Motor Vehicle Tax (household)
Insurance Tax
Motor Vehicle Tax (business)
Source: Deloitte Access Economics estimates
The differences between business and household taxes largely reflect differences in the responsiveness of demand and the impact of the different taxes on the cost of capital and hence investment decisions. Holding other things constant, business demand is more responsive than household demand, since businesses can substitute across different factors of production, while households have more limited substitution possibilities. This is most pronounced in the case of export industries. Consequently, similar tax rate changes cause a greater response in the after tax prices and quantities demanded by businesses.
Another feature of the rankings is that personal income taxes tend to be more inefficient than payroll taxes despite the two affecting labour demand decisions. While there are a number of factors at play, the main reason for the difference is the impact that each tax has on the cost of capital. While personal income tax has a direct impact on the cost of capital via capital rental returns, payroll taxes have only an indirect effect on capital through movements in the cost of labour. The direct effect on the cost of capital through personal income tax leads to greater distortions on investment.
3.3 Limitations of quantitative ranking
It is important to note the limitations of this quantitative analysis. The tax system is complex and inevitably numerous simplifying assumptions are needed to make any quantitative analysis tractable. The model that has been used here has been refined in numerous ways in order to better capture various features of the tax system, but it still does not capture all or the costs and benefits associated with some taxes. Factoring in these costs could affect the efficiency rankings reported in Chart 3.1 and Chart 3.2.
First, as emphasised above, the results relate to comparisons between different steady state (and therefore long-run) scenarios. As such, they provide an appropriate basis for

2011 Analysis of State Tax Report
13 Deloitte Access Economics Commercial-in-confidence
consideration of the long-term impact of different taxes but do not provide an indication of the nature and extent of any transitional costs.
Secondly, the focus in this report is on State taxes. The results presented for personal income taxes are for comparison purposes and only relate to average rates of taxes. Within the personal tax base there will be elements that are more (or less) efficient than the average.
Third, differences in structure, aggregation and assumptions between models will impact results, in this instance the relativities between different taxes. To illustrate the point consider the rankings in Chart 3.2 compared to those presented in Chart 1.5 of the Australia’s Future Tax Review final report, prepared using the MM900 model. Between the two analyses many of the results are comparable, including municipal rates and land taxes being highly efficient with municipal rates being the most efficient of the two, taxes on business being less efficient than those on households, and taxes on insurance products being among the least efficient.
The only notable difference in rankings between the two models is the relative ranking of labour income tax and payroll tax, with the Henry review finding payroll taxes relatively less efficient compared to labour income tax. It is noted in the Henry review that this relative inefficiency is a reflection of the tax-free threshold, with a broad based payroll tax estimated to be significantly more efficient than labour income taxes.
Finally, a number of simplifying assumptions have been needed to make the analysis of the State taxes tractable. For the most part these simplifying assumptions do not have a significant bearing on results; however, there are a few cases in which limitations of the quantitative model warrant further discussion.
Conveyance duties
An important limitation of the model relates to conveyance duties. Any tax on the transactions of assets, including conveyance duties, runs the risk of impairing the functioning of markets by harming price discovery - trades that would have otherwise taken place do not, and the ready transfer of assets to those businesses or individuals that place the highest value on the asset concerned is impaired. This can be a particularly severe problem in financial markets where transactions taxes can represent a material part of any margin involved in the trade.
Conveyance duties can also affect the efficient functioning of property markets by reducing turnover and leaving assets to the ownership of businesses and/or individuals who are not best placed to make effective use of the assets.
Neither of these features is captured directly by the model which, as outlined above, compares two static situations involving different tax rates. In particular, the model implicitly assumes that the rate of turnover of property is unaffected by changes in the conveyance duty rate. Allowing for some decline in the rate of property turnovers following an increase in the conveyance duty would lower the efficiency of all conveyance duties.

2011 Analysis of State Tax Report
14 Deloitte Access Economics Commercial-in-confidence
The extent to which conveyance duties result in less efficient outcomes through inhibiting transactions will depend on how large the duty is relative to the full costs involved in the transaction. For example, the inefficiencies associated with conveyance duties on various financial transactions could be significant. On the other hand, they may be less important for, say, conveyances on residential properties. In principle, conveyance duties could inhibit homeowners moving to a new region or State in pursuit of a higher standard of living.
Motor vehicle taxes
Another limitation of the modelling is that it does not fully capture the benefits of ‘use’ taxes such as motor vehicle levies. These levies potentially lower congestion, thereby raising welfare and the taxes’ economic efficiency, because they are used to improve roads and lower the number of vehicles on the road. Factoring in these benefits would raise the efficiency rankings of motor vehicle taxes over that estimated - that is, the efficiency ranking for motor vehicles may improve a little in Chart 3.1 and Chart 3.2.
As noted above, the quantitative modelling does not take into account equity or simplicity of taxes and so the rankings could change when the assessment includes these other tax design criteria. For example, the number of thresholds and exemptions in payroll taxes may reduce their relative efficiency but they may be warranted when considering other issues such as equity or compliance costs relative to revenue collected.

2011 Analysis of State Tax Report
15 Deloitte Access Economics Commercial-in-confidence
4 Developing options for State tax reform The efficiency rankings reported in Chart 3.1 and Chart 3.2 provide a basis for considering various options to reform State taxes. For example, State stamp duty on motor vehicles and insurance is amongst the least efficient of taxes, generating significant deadweight losses. Similarly, there are more efficient alternatives to property conveyance duty. Accordingly, the efficiency rankings provide prima facie evidence that shifting the mix of State taxes will yield economic benefits. This section examines the welfare and revenue effects of selected reforms to State taxes. The scenarios that have been selected involve shifting taxes away from State transaction taxes with compensating increases in other taxes on comparable bases sufficient to achieve a revenue neutral outcome.
4.1 Modelling scenarios
We first outline the six revenue neutral tax reform scenarios to be analysed.
Scenario A
All State transaction taxes are abolished for an increase in the current GST, with no change in the current GST exemptions.
Scenarios B1 and B2
All State property transaction taxes are abolished for an increase in land tax. Within this scenario, the increase in land tax will consider both:
Scenario B1: Land taxes are increased with all current exemptions in place, such as for the principal place of residence; and
Scenario B2: Land taxes are increased without any exemptions, which is essentially a municipal tax.
Scenarios C1 and C2
All State non-property transaction taxes abolished for an increase in payroll tax. Within this scenario, the increase in payroll tax will consider both:
Scenario C1: Payroll taxes are increased with current exemptions and thresholds in place; and
Scenario : Payroll taxes are increase without exemptions, that is, a broad-based payroll tax.
Scenario D
A ‘Henry/Tax Summit’ tax reform package with State transaction tax reform designed to be revenue-neutral where

2011 Analysis of State Tax Report
16 Deloitte Access Economics Commercial-in-confidence
Property transaction taxes are replaced by broad-based land taxes; and
Other transaction taxes are replaced with a broad-based payroll tax.
This scenario is thus a combination of Scenarios B2 and C2.
4.2 Results: Impact on revenue bases
For each scenario, estimates have been made for:
the first round change to revenue that results from removing the relevant tax (see Table 4.1). These changes do not include changes to revenue due to changes in the tax bases – for example, through increases in production and consumption;
the second round impact on government revenues that results from the higher level of economic activity that flows from the reduction in stamp duties (see Table 4.2). This captures the effects due to changes in tax bases mentioned above;
the change to revenue that is necessary to make the six reform scenarios revenue neutral (see Table 4.3). These changes are inclusive of changes in the tax base due to imposition of the replacement tax and other interaction effects;
the impact on economic welfare or efficiency as measured by the effect of each scenario on real household consumption (see Table 4.4).
As noted earlier, the scenarios are dependent on the assumptions incorporated in the general equilibrium model that has been used for this analysis. They do not capture all the inefficiencies associated with transactions taxes nor do they allow for transitional costs.
Table 4.1 shows the first round effects of removing the taxes outlined in each of the scenarios. For example, the abolition of all State transaction in Scenario A would reduce State revenues approximately $16 billion. The reduction in revenues varies between States reflecting differences in the sizes of different tax bases and their relative reliance on the various transaction taxes.
Notably, the first round impacts are shared between the pairs of scenarios A and D, B1 and B2, and C1 and C2 by virtue of common taxation reductions between scenarios. Also worth noting is that the first round impacts of Scenarios A and D are simply the sums of Scenarios B and C – as the taxes being abolished in Scenarios A and D are the combination of those in B and C.

2011 Analysis of State Tax Report
17 Deloitte Access Economics Commercial-in-confidence
Table 4.1: Removal of taxes by scenario - first round revenue effects
Revenue effect - $mil AU
State/Territory A B1, B2 C1, C2 D
NSW -5,192 -2,736 -2,456 -5,192
VIC -4,551 -2,801 -1,750 -4,551
QLD -2,730 -1,806 -924 -2,730
SA -1,187 -721 -466 -1,187
WA -1,723 -1,008 -715 -1,723
TAS -247 -151 -96 -247
NT -155 -108 -47 -155
ACT -280 -204 -76 -280
Total -16,065 -9,535 -6,530 -16,065
Source: Deloitte Access Economics estimates All dollars are $AU 2008-09
The first round revenue impacts presented in Table 4.1 show the impact of removing the inefficient taxes outlined in each scenario that one would expect in a partial equilibrium context – the impacts presented do not take into account behavioral changes as relative prices change. For example, if in an economy there was a 2% tax on pencils with $100 of pencils sold in total, a partial equilibrium analysis tells you that reducing this tax to 1% will reduce government revenue by $1. This ignores the response from consumers, who may increase their consumption of pencils by $10, partially offsetting the reduction in Government revenue. It is this effect that is shown in Table 4.2.
Table 4.2: Removal of taxes by scenario - second round revenue effects
Revenue effect – $mil AU
State/Territory A B1, B2 C1, C2 D
NSW 1,985 616 1,269 1,985
VIC 1,584 620 892 1,584
QLD 863 412 433 863
SA 429 155 250 429
WA 598 193 370 598
TAS 79 25 47 79
NT 46 17 26 46
ACT 89 45 39 89
Total 5,672 2,082 3,328 5,672
Source: Deloitte Access Economics estimates All dollars are $AU2008-09
Table 4.2 shows the second round impacts on Government revenue that occur as a result of changes in consumption patterns by industries and consumers. These second round impacts will not only occur in the tax base being directly affected by the taxation reductions, but also across other tax bases as the flow on effects of relative price changes work their way through the economy.

2011 Analysis of State Tax Report
18 Deloitte Access Economics Commercial-in-confidence
The second round impacts represent the increase in State revenues as a result of the various tax reform options. Across all scenarios, there is an increase in the size of taxation bases as inefficient taxes are abolished and economic activity increases. In comparison to Table 4.1 the second round effects for scenarios A and D are no longer the sum of the effects for B and C. This is due to interaction effects between the tax reductions – here the whole is greater than the sum of the parts.
The ratio between the second round impact and the first round impact is also not constant. Compare, for example, the first and second round impacts in scenarios B and C for NSW, showing that for comparably sized first round impacts the second round impact is approximately twice the size in scenario C than in B. Note that scenario C involves reducing taxes that are the least efficient in the economy, demonstrated in Chart 3.2, indicating that qualitatively this is indeed the result that one would expect.
The second round impacts on revenue means that increases in other more efficient taxes required to make each scenario revenue-neutral are less than that implied by the first round reductions. The revenue shortfall, that is, the amount of revenue that must be met by other more efficient taxes to achieve revenue neutrality, is presented in Table 4.3. For example, the first round impact of the abolition of all State transaction taxes under Scenarios A and D involves a reduction in revenues of around $16 billion, but the revenue dividends from the second round impact mean that compensating taxes only to be raised sufficiently to generate an increase of around $10 billion in revenue to deliver a revenue-neutral result.
Table 4.3: Revenue shortfall to make reform revenue-neutral
Revenue shortfall, $mil AU
State/Territory A B1, B2 C1, C2 D
NSW -3,207 -2,120 -1,187 -3,207
VIC -2,967 -2,181 -858 -2,967
QLD -1,867 -1,394 -491 -1,867
SA -758 -566 -216 -758
WA -1,125 -815 -345 -1,125
TAS -168 -126 -49 -168
NT -109 -91 -21 -109
ACT -191 -159 -37 -191
Total -10,393 -7,453 -3,202 -10,393
Source: Deloitte Access Economics estimates All dollars are $AU2008-09
Table 4.4 shows the total economic welfare gain once abolished taxes are replaced by more efficient taxes to make each scenario revenue-neutral. The economic welfare here is measured as the total increase in household consumption. The results indicate that the potential gains in economic welfare are quite large. Depending on the source of the revenue offsets, the abolition of all State transaction taxes could increase Australian household consumption by between 1.3% and 1.7%. The replacement of all State transaction taxes offset by an increase in the GST under Scenario A yields the largest efficiency gain, which is to be expected given the broad base and relatively high efficiency

2011 Analysis of State Tax Report
19 Deloitte Access Economics Commercial-in-confidence
of the GST compared to other taxes. The replacement of transaction taxes by corresponding increase in either land tax or payroll tax under Scenario D also yields high efficiency gains of around 1.3% increase in household consumption.
Finally, comparing the results of scenario B1 to B2 (likewise – C1 to C2) demonstrates that the application of tax without exemption is less distortionary and more efficient than application with exemptions, for both land tax and payroll tax. This is as expected since thresholds and exemptions narrow the base on which the tax is imposed and therefore reduces efficiency.
Table 4.4: Economic welfare gain by scenario - revenue neutral
Scenario Revenue gap, $mil Welfare gain
Scenario A 10393 1.74%
Scenario B1 7453 0.72%
Scenario B2 7453 0.78%
Scenario C1 3202 0.49%
Scenario C2 3202 0.52%
Scenario D 10393 1.31%
Source: Deloitte Access Economics estimates All dollars are $AU2008-09
We conclude by outlining the taxation increases implied by each of the six scenarios analysed, as shown in Table 4.5. Due to the structure of the taxes under analysis we present the increase in the effective rate6 rather than, for example, the headline rate – the exception being for the GST in Scenario A. By way of example consider land tax in NSW, which currently has a 2% headline rate, however due to existing exemption structures generates the revenue of an exemption free 1.15%. The presentation of effective rates rather than headline rates helps to abstract away from the complications of differing headline rates and both broadly applied and one-off exemption structures. Note in Table 4.5 that land tax in the Northern Territory and exemption free payroll tax in all states and territories are currently not levied.
We see that the increase in payroll taxes retaining existing exemptions is significantly larger than if the increase is levied across the entire taxation base, demonstrating the significant exemptions that are currently in place, and hinting at the distortionary impact of these exemptions and the possible efficiency gains available by reducing or eliminating the existing exemption structure.
Finally, we see that the new effective land tax rates in Scenario D are slightly lower than the rates in Scenario B2, demonstrating the extent to which the abolition of multiple relatively inefficient taxes has greater economic efficiency improvements than when measured individually. This effect does also change the payroll tax rate, however the effect is not apparent at the precision used in the table.
6 The effective rates being calculated from the base against which the tax is levied and the total revenue raised.

2011 Analysis of State Tax Report
20
Table 4.5: Comparison of taxes by scenario and state
NSW VIC QLD SA WA TAS NT ACT
Old New Old New Old New Old New Old New Old New Old New Old New
Scenario A
Increase in headline GST rate 10.0 13.2 10.0 13.2 10.0 13.2 10.0 13.2 10.0 13.2 10.0 13.2 10.0 13.2 10.0 13.2
Scenario B1
Increase in effective land tax with current exemptions 1.15 1.88 0.83 1.83 0.86 1.98 1.50 2.64 1.16 2.39 0.79 1.66 - 1.19 0.99 2.23
Scenario B2
Increase in effective land tax with no exemptions 0.82 1.21 1.03 1.55 1.13 1.66 1.41 1.98 1.04 1.54 1.34 1.80 0.45 0.86 1.05 1.69
Scenario C1
Increase in effective payroll tax with current exemptions 5.88 6.9 4.95 5.95 4.75 5.56 5.00 6.12 5.50 6.3 6.10 7.20 5.90 6.67 6.85 7.74
Scenario C2
Increase in effective payroll tax with no exemptions - 0.58 - 0.58 - 0.43 - 0.55 - 0.49 - 0.43 - 0.31 - 0.22
Scenario D
Increase in effective land tax with no exemptions 0.82 1.20 1.03 1.54 1.13 1.65 1.41 1.97 1.04 1.53 1.34 1.79 0.45 0.86 1.05 1.68
Increase in effective payroll tax with no exemptions - 0.58 - 0.58 - 0.43 - 0.55 - 0.49 - 0.43 - 0.31 - 0.22
Source: Deloitte Access Economics estimates All figures calculated against 2008/09 data and rates
2011 Analysis of State Tax Report
21 Deloitte Access Economics Commercial-in-confidence
Conclusions The results highlight the inefficiencies associated with transaction taxes and the potential gains that may be realised from the reform of State tax systems. The efficiency rankings and scenarios analysed act as a valuable guide to the range of options available to governments when considering reform scenarios and their impacts on economic efficiency and welfare of the Australian people.
The analysis suggests that the potential gains from the reform of State taxation are large and rival the gains derived from past microeconomic reforms. The abolition of inefficient State transaction taxes with a corresponding increase in other more efficient taxes can yield economic efficiency gains in the order of 1.3% to 1.7% increase in Australian household consumption.
While the largest net economic benefit is where the abolition of State taxes is offset by an increase in the GST – therefore requiring involvement of the Federal Government – there are nonetheless significant gains to be realised by States acting unilaterally. For example, the replacement of property transaction taxes by broad-based land taxes along with the replacement of other transaction taxes with broad-based payroll taxes are estimated to yield economic efficiency gains of around 1.3% increase in household consumption.
In any such reforms of the tax system, a range of policy objectives will need to be considered including the impact on equity and the simplicity of the system both from the perspective of administration and compliance. Nevertheless the potential gains to economic efficiency indicate that there is scope for substantial benefits to be achieved.

2011 Analysis of State Tax Report
22 Deloitte Access Economics Commercial-in-confidence
References
Adams, P.D., Horridge, M. and Wittwear, G (2002), “MMRF-GREEN: A Dynamic Multi-Regional Applied General Equilibrium Model of the Australian Economy, Draft documentation prepared for the Regional CGE Modelling Course”, Centre of Policy Studies, Monash University, 25-29 November.
Productivity Commission (2006), Potential Benefits of the National Reform Agenda, Report to the Council of Australian Governments, available at www.pc.gov.au.
Australia’s Future Tax System (2009), Report to the Treasurer, available at www.taxreview.treasury.gov.au.

2011 Analysis of State Tax Report
23 Deloitte Access Economics Commercial-in-confidence
Appendix A
Deloitte Access Economics used the Monash Multi-Regional Forecasting model to construct the efficiency ranking of various State taxes and estimate the impact of the various taxation reforms. This model was developed by the Centre of Policy Studies at Monash University and released by the Productivity Commission (2006) in support of its work estimating the potential benefits of the National Reform Agenda. The model used in that work was called the MMRF-NRA model.
MMRF-NRA is a computable general equilibrium (CGE) model of the Australian economy that captures detailed information for all States and Territories of Australia. The model projects changes in macroeconomic aggregates such as GDP (or GSP at the State level), employment, export volumes, investment and private consumption. At the sectoral level, detailed results such as output, exports, imports and employment are also produced.
The model is primarily based on input-output or social accounting matrices, as a means of describing how economies are linked through production, consumption, trade and investment flows. For example, the model considers:
Direct linkages between industries and regions through purchases and sales of each other’s goods and services.
Indirect linkages through mechanisms such as the collective competition for available resources, such as labour, that operates an economy-wide context.
The base data used in the model are derived from the Australian input-output tables produced by the Australian Bureau of Statistics. The database relate to input-output details for 2001-02. These have been updated in this exercise to a 2005-06 base, and all results have been calibrated against 2008-09 data.
The database has been aggregated from its original 58 sectors used by the Productivity Commission, to the 19 sectors shown in Table 4.6 below. In performing this task, the taxation database in the model was fully upgraded to incorporate the most recent data available from the Australian Bureau of Statistics.
CGE models are widely used in estimating the economy-wide impacts of reforms, such as the taxation reform, because they capture the direct and indirect impacts of such changes. The model is based on a wide range of economic assumptions which are described in more detail in Adams, Horridge and Wittwear (2002). The model is run in a long-run comparative static mode. This assumes enough time for changes in taxes to flow through the economy with full adjustment to factors such as labour and capital (around 10 years).
The model considers employment, production, consumption, investment and trade across the 19 sectors represented in each State and Territory of Australia. Interactions between industries are governed by the input-output data that underpin the model, which measures the various inputs required by each industry to produce a certain level of output.

2011 Analysis of State Tax Report
24 Deloitte Access Economics Commercial-in-confidence
Each sector, or industry, in the model is assumed to maximise profits by combining inputs such as labour, capital and intermediate inputs to minimise costs. Capital and labour are assumed to be mobile between sectors, and the supply of labour is responsive to real wage adjustments. Output is sold in either the domestic market (to other firms, household, the government or as an investment good) or exported (internationally or to another State or Territory). In the domestic market, goods and services can either be sourced from domestic producers or imported. These sources of imports are treated as imperfect substitutes.
Table 4.6: Sectors and occupations in MMRF-NRA
No Sectors
1 Agriculture
2 Mining
3 Food manufacturing
4 Light manufacturing, including footwear, clothing, textiles, wood, paper products
5 Heavy manufacturing, including petrol chemical, transport equipment, metal products, etc
6 Construction
7 Utility including gas, water and electricity
8 Wholesale trade
9 Retail trade
10 Hotels and restaurants
11 Transport
12 Communications
13 Finance
14 Business services
15 Dwellings
16 Government services
17 Education
18 Health
19 Other services
Consumption expenditure is allocated between goods and services based on a Klein-Rubin (or Stone-Geary) utility system. This allows consumption of each industry’s output to be sensitive to price changes (own price elasticities). For each good and service in the consumption function there is a fixed, or ‘autonomous’, level of consumption and a ‘discretionary’ level. The latter adjusts to maximise utility. Changes in real consumption are then used to measure the economic welfare implications of various changes to taxes.
The model distinguishes between Commonwealth and local/State government sectors. Each level of government imposes a series of direct and indirect taxes.
Estimates of the effective tax rates in the model are primarily based on State and local government tax revenue estimates for 2008-09 from Australian Bureau of Statistics, Taxation Revenue, Cat 5506.0, with additional detail sourced from State budget papers for budget years 2005-06 and 2006-07 and Treasury working paper TRP07-1.

Limitation of our work
General use restriction
This report is prepared solely for the internal use of the Finance Industry Council of Australia
and its members. This report is not intended to and should not be used or relied upon by
anyone else and we accept no duty of care to any other person or entity. The report has
been prepared for the purpose of analysis of the economic impact of a number of taxation
reform scenarios. You should not refer to or use our name or the advice for any other
purpose.

Our Signals Recruit and retain the best – our people are talented, enthusiastic, self-starters, team players who are bursting with potential. They are people with whom we have a lifetime association.
Talk straight – when we talk, it’s open, regular, honest, constructive two-way communication between our people and our clients.
Empower and trust – we encourage a sense of ownership and pride by giving responsibility and delegating authority.
Continuously grow and improve – we have an environment that respects the individual, rewards achievements, welcomes change and encourages a lifetime of learning – with ourselves and our clients.
Aim to be famous – we aim to reach for the stars – and beyond. To be thought leaders, showcasing our clients and our team’s talent and expertise.
Play to win-think globally – winning is our stated objective. It is also our state of mind.
Have fun and celebrate – there is never a wrong time to celebrate and have fun – recognising, appreciating, acknowledging and learning from the experiences and success shared between our client and Deloitte teams.
Our culture – our essence Culture at Deloitte does not just happen – we work at it.
It’s the sum total of the actions of our people, it’s the way we treat others – it’s the way we behave. Our seven Signals embody these values. Our passion for teamwork and exceptional client service is our point of difference.
At Deloitte, we live and breathe our culture.
Our internationally experienced professionals strive to deliver seamless, consistent services wherever our clients operate. Our mission is to help our clients and our people excel.
Recent awards and achievements Awarded the Accountancy Firm of the Year - CFO Awards 2008 for the second time in three years
The largest, independent management consulting capability in Australia with over 630 people
Recognised for its innovative approach to managing growth in McKinsey’s international organisational study The Granularity of Growth as a full-chapter case study
Tier one ranking as one of the best tax firms in Australia by the International Tax Review in its World Tax 2009 report
The largest Forensic practice in the Asia Pacific region and a nationally integrated Corporate Finance business of more than 250 professionals, active in takeovers, acquisitions, divestments and initial public offerings
A Risk Services practice nominated by industry analyst Forrester Research as the global leader in both Risk Consulting Services (Q2 2007) and Security Consulting (Q3 2007)
Corporate Reorganisation Services ranked the number one non-investment bank financial advisers globally by The Deal for nine consecutive quarters (to Q4 2007)
Recognised in 2008 as an Employer of Choice for Women for the seventh year in a row as well as winning the prestigious award for the Leading Organisation for the Advancement of Women by the Federal Government’s Equal Opportunity for Women in the Workplace Agency (EOWA)
Contact us
Deloitte Access Economics ACN: 49 633 116 Level 1 9 Sydney Avenue Barton ACT 2600 PO Box 6334 Kingston ACT 2604 Australia Tel: +61 2 6175 2000 Fax: +61 2 6175 2001 www.deloitte.com/au/economics
About Deloitte Deloitte refers to one or more of Deloitte Touche Tohmatsu Limited, a UK private company limited by guarantee, and its network of member firms, each of which is a legally separate and independent entity. Please see www.deloitte.com/au/about for a detailed description of the legal structure of Deloitte Touche Tohmatsu Limited and its member firms. Deloitte provides audit, tax, consulting, and financial advisory services to public and private clients spanning multiple industries. With a globally connected network of member firms in more than 150 countries, Deloitte brings world-class capabilities and deep local expertise to help clients succeed wherever they operate. Deloitte's approximately 170,000 professionals are committed to becoming the standard of excellence About Deloitte Australia In Australia, the member firm is the Australian partnership of Deloitte Touche Tohmatsu. As one of Australia’s leading professional services firms, Deloitte Touche Tohmatsu and its affiliates provide audit, tax, consulting, and financial advisory services through approximately 5,000 people across the country. Focused on the creation of value and growth, and known as an employer of choice for innovative human resources programs, we are dedicated to helping our clients and our people excel. For more information, please visit Deloitte’s web site at www.deloitte.com.au. Deloitte Access Economics is Australia’s pre-eminent economics advisory practice and a member of Deloitte's global economics group. The Directors and staff of Access Economics joined Deloitte in early 2011. Liability limited by a scheme approved under Professional Standards Legislation. Member of Deloitte Touche Tohmatsu Limited © 2011 Access Economics Pty Ltd