re-thinking the digital agenda for europe (dae): a richer … · re-thinking the digital agenda for...
TRANSCRIPT

1
Berlin, 9 April 2013
Re-thinking the
Digital Agenda for Europe (DAE):
A richer mix of technologies
J. Scott Marcus, Director

2
Berlin, 9 April 2013
A richer mix of technologies
• Introduction
• Coverage of broadband networks in Europe
• Network usage trends
• Technical capabilities of cable
• A mix of technologies could offer advantages
• Concluding remarks

3
Berlin, 9 April 2013
Introduction
• The European Union is committed to an
ambitious Digital Agenda for Europe (DAE).
• The DAE includes
- full broadband availability in 2013,
- 100% availability of 30 Mbps in 2020, and
- 50% adoption of 100 Mbps by 2020.
• It is widely acknowledged that meeting these
goals is challenging.

4
Berlin, 9 April 2013
Introduction
• What is really meant by 30 or 100 Mbps?
• Requirements for speed and symmetry
should be understood in light of the use that
consumers are likely to make of the network.
• What trends are visible as regards:
- Applications in use?
- Bandwidth demand per HH?
- Traffic asymmetry?
• Demand is dynamic over time.

5
Berlin, 9 April 2013
Introduction
• DAE was initially viewed in an FTTx-centric way.
• Commissioner Kroes, Barcelona, 27 February:
“I also want at least half of Europeans to have ultra-
fast access at over 100 Megabits by 2020: again, it is
clear that no single technology will deliver this, no
single magic potion will get us there overnight. We
rather need an intelligent mix of complementary
technologies, deployed incrementally, and according
to local circumstances. Such technologies include in
particular Fibre-to-the-Home, upgraded Cable, Fibre-
to-the-Cabinet and LTE.”
6
Berlin, 9 April 2013
Coverage and capabilities

7
Berlin, 9 April 2013
Basic broadband coverage
• For years, European broadband policy was
based on flawed coverage data.
- Assumed full coverage of the fixed network, which
clearly was not the case in newer Member States.
- Assumed that all fixed network lines were good
enough to support broadband.
• A 2012 Point Topic report for the European
Commission provide an improved baseline.

8
Berlin, 9 April 2013
Basic broadband coverage
Source: Point Topic (2012)

9
Berlin, 9 April 2013
NGA coverage
Source: Point Topic (2012)

10
Berlin, 9 April 2013
Coverage in Europe
• Basic broadband
- The older Member States have nearly full
coverage.
- Some of the newer Member States have
sufficient gaps in rural coverage.
• NGA coverage
- Member States with cable already enjoy full
deployment (the Netherlands, Belgium, Malta).
- Some eastern Member States have already
deployed substantial fibre.
- Some eastern Member States have lots of cable.

11
Berlin, 9 April 2013
Coverage of Cable Networks
• Total cable coverage in Europe is
substantial.
• A significant fraction of this cable
infrastructure is DOCSIS 3.0 capable.
• The remainder could be upgraded at
modest cost.
• In many Member States, cable represents
a significant fraction of total broadband.

12
Berlin, 9 April 2013
Coverage of Cable Networks
12
• Total cable coverage in many EU Member States
is substantial.
Source: Screen Digest (2010),
WIK calculations.
Percentage of
households passed by
cable (2010)
Full report, page 36.

13
Berlin, 9 April 2013
Cable’s Potential
13
• The “gap” between cable coverage and cable broadband penetration
represents a significant opportunity for Europe and for the industry.
Source: Screen Digest (2010), WIK calculations. Full report, page 37.

14
Berlin, 9 April 2013
Challenges of achieving full basic and NGA
coverage

15
Berlin, 9 April 2013
Coverage poses challenges
Population density
Source: Center for
International Earth Science
Information Network (CIESIN).
Full report, page 41.

16
Berlin, 9 April 2013
Challenges of achieving NGA
deployment
Source: Feijoo, Gomez-Barroso et al. (2011a). Full report, page 45.
Cost and ARPU per customer per month for FTTH P2P Ethernet
(Germany, 70% penetration)

17
Berlin, 9 April 2013
Challenges of achieving NGA
deployment
Source: WIK Full report, page 46.
Investment subsidy per customer required for FTTH P2P Ethernet (Germany)

18
Berlin, 9 April 2013
Usage Trends

19
Berlin, 9 April 2013
Global Internet traffic trends
“It's tough to make predictions, especially
about the future.”
- Yogi Berra (US baseball player and manager)

20
Berlin, 9 April 2013
Global Internet traffic trends
Source: Cisco VNI (2012), WIK calculations. Full report, page 16.

21
Berlin, 9 April 2013
Average busy hour traffic per user
Source: Cisco VNI 2011 data, WIK calculations. Full report, page 20.

22
Berlin, 9 April 2013
Implications for network design
• Average busy hour traffic (which largely drives the
size of the network) per user is much lower than
many assume, and is likely to remain far less than
DAE access speeds.
• This suggests that media with shared bandwidth –
wireless and cable – are likely to be able to meet
consumer demand well into the future.
• High access speeds nonetheless offer benefits.
- Enable applications that would not otherwise be possible.
- Faster response from all applications.

23
Berlin, 9 April 2013
Does supply drive demand?
• It is fairly clear that demand for broadband
can drive supply.
• How does supply affect demand?
• Will abundant supply stimulate creation of
new bandwidth-hungry applications?
• Alternative hypothesis:
- too little available bandwidth can reduce
consumption, but
- “too much” bandwidth availability has only limited
ability to promote bandwidth consumption.
24
Berlin, 9 April 2013
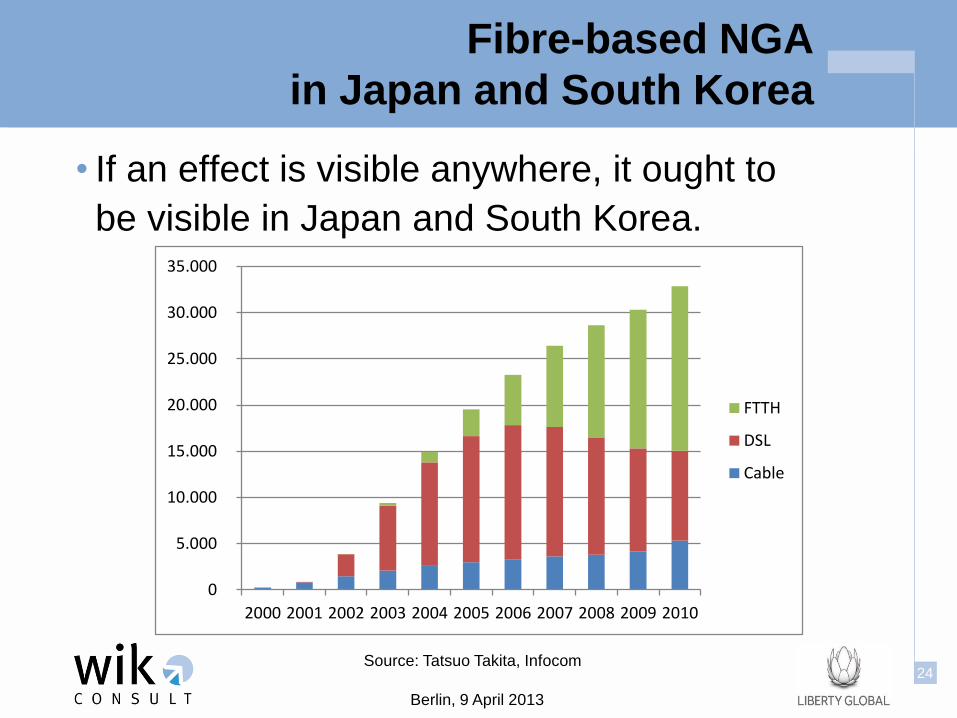
Fibre-based NGA
in Japan and South Korea
• If an effect is visible anywhere, it ought to
be visible in Japan and South Korea.
0
5.000
10.000
15.000
20.000
25.000
30.000
35.000
2000 2001 2002 2003 2004 2005 2006 2007 2008 2009 2010
FTTH
DSL
Cable
Source: Tatsuo Takita, Infocom

25
Berlin, 9 April 2013
Japan and South Korea vs Europe
-
20,0
40,0
60,0
80,0
100,0
120,0
Japan South Korea Germany United Kingdom Italy France
GB
/mo
nth
per
su
bscri
ber
Traffic per subscriber
2011
2012
Data sources: Cisco VNI 2012 online database, OECD, ITU, WIK calculations
Internet Traffic per Fixed Subscriber

26
Berlin, 9 April 2013
Japan vs Europe
Source: Rupert Wood,
Analysys Mason

27
Berlin, 9 April 2013
Global Internet traffic trends
“[M]ost forms of Internet video do not have a
large upstream component. As a result, traffic is
not becoming more symmetric as many expected
when user-generated content first became
popular. [S]ubscribers still consume far more
video than they produce.”
- Cisco VNI Methodology (2012)

28
Berlin, 9 April 2013
Cable Technology

29
Berlin, 9 April 2013
Technical capabilities of cable
• The (inexpensive) upgrade to DOCSIS 3.0
enables high speed cable broadband.
• Cable is a shared medium; nonetheless, cable
operators have considerable control over the
bandwidth available per user.
- More CMTS can be deployed to serve a group of users.
- More fibre nodes can be deployed to a street cabinet.
- If a cable system has been deployed with excess fibre
capacity, these upgrades need not require civil works.
• These upgrades can be made incrementally.

30
Berlin, 9 April 2013
Two-way HFC/DOCSIS cable
Source: WIK-Consult Full report, page 54.
31
Berlin, 9 April 2013
Technical capabilities of cable
• Cable systems could offer symmetric bandwidth if
there were customer demand for it.
• Current channel allocations on cable systems
provide far more bandwidth downstream
(e.g. 5 MHz to 65 MHz) in order to enable more
linear video to consumers.
• There could however be a different allocation if
there were a business case to do so.
• If consumer demand for symmetric broadband
services were to grow, cable could readily adapt.

32
Berlin, 9 April 2013
Spectrum allocation in cable networks
Source: Cable Europe Labs (2009): Cable network
handbook; CEL-TR-HFC-V4_3-091001. Full report, page 57.
33
Berlin, 9 April 2013
A Mix of Technologies

34
Berlin, 9 April 2013
The use of cable
influences the cost
of meeting DAE
objectives
Source: Hätönen/EIB (2011).
Full report, page 63.

35
Berlin, 9 April 2013
The use of cable influences the cost of
meeting DAE objectives
35
Source: Hätönen/EIB analysis, WIK calculations.
• Aggregate incremental cost of achieving DAE objectives for the
EU as a whole, with and without cable.
• Savings for the EU as a whole could be substantial – up to 30%.
Full report, page 65.

36
Berlin, 9 April 2013
36
- Incremental cost of meeting DAE objectives with and without
cable, in Germany, France and the UK
Source: Hätönen/EIB analysis, WIK calculations. Full report, page 66.
The use of cable influences the cost
meeting DAE objectives

37
Berlin, 9 April 2013
Infrastructure Competition

38
Berlin, 9 April 2013
Infrastructure-based competition and
NGA deployment
Source: Feijoo and Gomez-Barroso (2010a). Full report, page 72.
• Policymakers may prefer to promote facilities-based competition,
rather than cost savings for a single infrastructure.
• This example reflects Spain as it was in 2010.

39
Berlin, 9 April 2013
Concluding remarks
• A technologically neutral approach to the DAE,
drawing on cable and LTE, offers real benefits.
• Cable can and does serve as
- an alternative to making FTTx upgrades, especially in
areas where the cost of fibre upgrades would be
particularly uneconomic, providing cost savings; or
- as a second fixed network in a given area, providing a
facilities-based fixed network alternative to an FTTx
network, thus enhancing competition.