reaching the peak: improving development through an
TRANSCRIPT

Reaching the Peak: Improving Development through an
Analysis of Nepal’s Historical Dynamics
Report by: Shelby Johnson
November 14, 2014

Table of Contents Executive Summary
Brief Overview of Nepal……………………………...………………………………………………......1 Population & Health…………....……………………………………....…....……………………………1
Population……...………………………...………………………………..………………………1 Health……………………………………………………..………………………..…………...…2
Demographic & Health Drivers……………………………………..………...……..……………3 Current Trajectory ………………………………………………...………………………………3
Interventions……………...…………………………….................…………………..…………..4 Education……………………………………………………………………………………….…………5
Educational Drivers………………………………………………………….……..……………..6 Current Trajectory …………………………………………………………..……………………7 Interventions…….……….………………………………..…………...………………………….7
Governance, Economy, & Infrastructure…………………………………………….……………………8 Governance………………………………………………………...………..…………………….8
Economy & Infrastructure………………………………………….………..……………………9 Economic Drivers…………………………………………………...……..…………………….10 Current Trajectory………………….……………………………...………...…………………...10 Interventions…………………………….……………………………..……..………………….11
Food, Agriculture, & Climate Change………………………..………………………………………….12 Food & Agriculture………………………………………………………………………...……12 Agricultural Production Drivers…………………………………………..……………………..12 Food Insecurity…………………………………………………………..………………………13 Undernourishment…………………………………………………………..………..………….14 Climate Change………………………………………………………………………………….14 Current Trajectory……………………………………………….....……………………………15 Interventions…………………………………………………...………..……………………….15
The Future of Nepal………………………………………………………………..………………….....16 Scenario 1……………………………………………...………………………..……………….16 Scenario 2………………………………………………......……………………………………16 Scenario 3…………………………………………………………..……………………………18 Scenario 4………………………………………………………….…………………………….18 Population & Health……………………………………………….…………………………….18 Education…………………………………………………………..…………………………….19 Economy & Production…………………………………………...……………………………..20
Conclusion...……………………………………………………………………………………………..23 Works Cited………………………...……………………....…...…………...…………………………..24
Graphs & Figures
Figure 1: Population Distribution Forecast………………………………………………... ……………………...…..4 Figure 2: Total Fertility Rate Forecast……………………………………………………... ……………………….....4 Figure 3: DALYs Forecast………………………………………………………………… …………………...……..5 Figure 4: Prevalence of Malnutrition Forecast……………………………………………. ……………………….....5 Figure 5: Social Capital Multifactor Productivity Forecast………………………………... ………………………….5 Figure 6: Deaths By Cause Forecast……………………………………………………….. ………………………….6 Figure 7: Graduation Rates Forecast……………………………………………………….. ………………………….7 Figure 8: Secondary Students Not Enrolled Forecast………………………………………. ……………………….....7 Figure 9: GDP (PPP) Forecast……………………………………………………………… ……………………….....8 Figure 10: Infrastructure Forecast…………………………………………………………… ………………………...11 Figure 11: Governance Effectiveness Index Forecast……………………………………….. ……………………..….11 Figure 12: Governance Inclusion Index Forecast……………………………………………. ………………………...11 Figure 13: GDP, GDP per capita, & Poverty Rate Forecasts………………………………... ………………………...12 Figure 14: Percent of Calories Consumed from Various Food Groups……………………... ………………………...13 Figure 15: Agricultural Production, Food Stocks, GDP, and GDP per capita Forecasts……. ………………………...16 Figure 16: Agriculture Imports & Exports Forecasts………………………………………... ………………………...16 Figure 17: Undernourished Population and Population Below $1.25/day Forecasts………... ………………………...16 Figure 18: Undernourished Population Forecast…………………………………………….. ………………………...18 Figure 19: Population & Health Indicators Forecasts……………………………………….. ………………………...19 Figure 20: Average Education Years, Age 25+ Forecast……………………………………. …………………...…....19 Figure 21: Education Indicators Forecasts…………………………………………………... ………………………...20 Figure 22: Population Living Below $1.25/day Forecast……………………………………. ………………………...20 Figure 23: Economic Indicators Forecasts…………………………………………………... ………………………...21 Figure 24: Total Exports & Imports Forecasts………………………………………………. ………………………...21 Figure 25: Trade & Productivity Indicators Forecasts………………………………………. ………………………...22

Executive Summary
Nepal is a small country with a big reputation; known throughout the world for the staggering beauty of its Himalayan mountains and for the exotic appeal of its World Heritage Site, the Chitwan National Park. Nepal, however, like any country, is more than its geography. It is a country of people and politics, progress and regression. This report goes beyond the tourist appeal of Nepal and presents a glimpse of where the country is and has been, where it is likely heading, and what can be done to improve its development. To do this, the report considers key aspects vital to the country’s development: population, health, education, governance, economy, infrastructure, agriculture, food security, and climate change. It also includes comparisons between Nepal and other least developed countries, on average, and between Nepal and the region of South Asia. These comparisons help to clarify where Nepal’s development stands in contrast to its peers and neighbors.
This report is meant to elucidate the most important variables for Nepal’s development, and to present possible
points of intervention that can lead to alternative paths which are more promising for Nepal’s future than the current trajectory. Research shows that the issues most in need of intervention are:
• Poverty; poverty negatively impacts quality of life, food security, opportunity, agency, and human capital.
• Infrastructure; insufficient infrastructure exacerbates poverty by decreasing access to markets, hindering
industrial development, and, consequently, job creation and export creation, decreases productivity through poor production and lack of electricity, and negatively impacts health through poor access to sanitation.
• Production; low levels of production decrease economic activity and create a need for imports, and,
consequently, worsens poverty though the higher price of goods. It also intensifies food insecurity. These issues are, of course, all inter-related, and related to other important developmental aspects such as
health and education. In order to effectively progress, both socially and economically, it will be necessary for the society and government of Nepal to implement comprehensive policies and programs and to understand the potential impact of each intervention on all sectors of the society and economy. Increased infrastructure, for instance, was found to cause changes in production and decreases in poverty, but necessary maintenance of infrastructure also increased the need for government expenditure in this area.
Fortunately, this report has found that many issues can be addressed through simple policy changes or the
implementation of programs. Governance issues can be addressed through better planning, more accountability, and improved structure, and investment can be improved through policies that create a better business environment. In addition, population pressures can be somewhat alleviated though media disbursement of new ideologies and better access to health and education. Other areas, however, will require more investment, such as health, education, and infrastructure, but Nepal’s high levels of foreign aid, and, if interventions are undertaken successfully, increased money supply from better economic production should prevent the costs from being a barrier. In essence, though Nepal’s current situation as one of the least developed countries in the world looks bleak, substantial improvement are unquestionably possible, and, if made, can secure a brighter future for the country before the decade is through.
P a g e | 1
A Brief Overview of Nepal:
Nepal’s modern history began in the mid-18th century with the unification of various states and provinces in the area by Prithvi Narayan Shah, a Gorkha King.1 Following unification, and an 1814 war with the British that resulted in the loss of some territory, the boundary for the modern day state of Nepal was established.2 The unification also resulted in the establishment of a system of monarchic rule that would last until the mid-20th century, when, in the 1950s, a popular movement for the end of the monarchy and the establishment of democracy began. Democracy did not come easily, however, and political instability, including a ten year civil war (1996-2006), continued over the next several decades.3 Nepal finally became a republic in 2008, but political turmoil still exists, especially in the form of disputes over the creation of a new constitution.4
Nepal’s social and economic advancement in recent history has also been fitful, and, despite significant improvement in many areas, there is still much progress to be desired. Nepal is, and has been for forty years, on the list of least developed countries (LDCs), meaning it ranks as one of 48 countries in the world with extremely low levels of development. 5 This is evidenced by low levels of economic and human development, high poverty and malnutrition rates, and seriously underdeveloped infrastructure. Moreover, the country is heavily dependent on foreign aid, and owes much of its recent development to aid and developmental planning instruction from international organizations and other countries.
If these problems persist, and especially if the amount or foreign aid decreases, Nepal’s progress in the coming decades will inevitably be minimal; and, some issues, such as inequality and food security, could actually worsen. In order to ensure favorable development for Nepal, interventions must occur. To maximize the effectiveness of these interventions, it will be necessary for the government to have a clear picture of what Nepal’s future should look like and to understand the key elements and interactions that influence development. The following sections explore these key elements and interactions by looking at recent dynamics, current situations, likely trajectories, and possible intervention points.
Population & Health Population
Over the past century, despite being one of the poorest countries in the world and remaining very low in development rankings, Nepal has managed to progress to a ‘late expanding’ phase of demographic transition.6 While the population has more than tripled, increasing to over 26 million by 2011, the annual growth rate has seen a significant drop in the past decade, falling to 1.35% by 2011.7 Comparatively, Nepal’s annual growth rate is less than the 1% average for the Asia and Pacific region, but about even with the 1.3% average of LDCs.8 The total fertility rate has notably fallen as well, from 6.1 in 1960 to 2.6 in 2011,9 and denotes a rate between the Asia and Pacific rate of 2.110 and the LDC rate of 4.2.11
1 Savada, Andrea Matles, ed. “A Country Study: Nepal.” Federal Research Division, Library of Congress. Call Number DS491.4 .N46 1993. 1993. http://lcweb2.loc.gov/frd/cs/nptoc.html. 2 “History of Nepal.” Thamel.com. http://www.thamel.com/htms/history.htm. Accessed September 26, 2014. 3 Savada, pp. 4-5. 4 BBC News South Asia. “Nepal Profile.” August 14, 2014. http://www.bbc.com/news/world-south-asia-12499391. Accessed September 26, 2014. 5 UN DESA: Development Policy and Analysis Division. “What are the least developed countries?” http://www.un.org/en/development/desa/policy/cdp/ldc_info.shtml. Accessed October 13, 2014. 6 From PowerPoint for September 18, 2014. Original Source: http://www.google.com/images?rlz=1T4DKUS_en___US296&q=demographic+transition&um=1&ie=UTF-8&source=univ&ei=5BmOTIiFL46gsQPtu8CtBA&sa=X&oi=image_result_group&ct=title&resnum=4&ved=0CDgQsAQwAw&biw=1259&bih=527 Earlier source: http://hs-geography.ism-online.org/2010/09/07/the-demographic-transition-model/ 7 Central Bureau of Statistics, Nepal. National Population and Housing Census 2011 (National Report). Volume 01, NPHC 2011. Kathmandu, Nepal. November 2012. 8 Both percentages from 2012. United Nations. Statistical Yearbook for Asia and the Pacific 2013. Economic and Social Commission for Asia and the Pacific. 2013. pg. 7. http://www.unescap.org/resources/statistical-yearbook-asia-and-pacific-2013. Accessed October 13, 2014. 9 Index Mundi. “Facts about Nepal.” http://www.indexmundi.com/facts/nepal#Health-Population. Accessed September 27, 2014. 10 For 2013. For list of countries in UN’s Asia and Pacific region category visit: http://asia-pacific.undp.org/content/rbap/en/home/regioninfo/. United Nations. Statistical Yearbook. pg. 1. 11 United Nations. World Population Ageing 2013. Department of Economic and Social Affairs Population Division. New York. 2013. pg. 4.

P a g e | 2 As aforementioned, the annual growth rate of the Nepalese population has dropped off significantly during the
past decade. This has resulted in a youth bulge, with 57% of the population recently becoming economically active.12 In addition, the number of young dependents is high, with 37% of the population under the age of 15, but this percentage is still smaller than the 39% dependent in the LDCs13 and the 40% dependent in Asia and the Pacific.14 On the other hand, the number of older dependents is quite low in proportion to the working population at only 6% of the total population,15 and is just slightly higher than the 5% for both LDCs16 and the Asia and Pacific region.17 Also, in striking contrast to its neighbors, China and India, women compose just over half of the population and represent a noticeably higher proportion of the population between the ages of 15 and 60.18
Health
Undoubtedly shaping demographic developments to a large degree, Nepal has also seen drastic changes in the health of its population. Mortality has decreased overall, with adult mortality (dying before the age of 60) for both males and females decreasing by close to 100 per 1,000 people over the past decade, to 182 and 155 respectively.19 Additionally, under-5 mortality more than halved in the same period to 54 per 1,000,20 which is more than the 40 per 1,000 for Asia and Pacific,21 but considerably less than the 80 per 1,000 for the LDCs.22 Maternal mortality, however, though it has reduced by approximately 350 in the past decade, is still quite high at 190 deaths per 100,000. 23 Nevertheless, comparatively, it is not much higher than the Asia and Pacific average of 142, and is considerably less than the LDC average of 271.24 Finally, the average life expectancy increased to 68 in 2011, an increase of 30 years from the life expectancy in 1960,25 and higher than both the LDC’s 61 years and South Asia’s nearly 67 years.26
Health concerns have also been shifting in Nepal in recent history. A few decades ago, the majority of deaths in Nepal were contributed to communicable diseases, maternal and perinatal deaths, and nutritional deficiencies.27 These causes now contribute to a much smaller 30% of deaths, with tuberculosis and repository infections having a high prevalence rate, but malnutrition being the lead factor of deaths in this category. Despite the decline of communicable diseases, the incidence is still unacceptably high considering that many deaths from communicable disease could be prevented with better access to sanitation and improved diet. The percent of the population with access to improved sanitation is despairingly low at 37%, and is not justified by comparably low levels in LDCs and South Asia.28 Levels of undernourishment are also alarming and are responsible for approximately 60% of all child deaths. 29
Non-communicable diseases, on the other hand, have taken over as the leading cause of death in Nepal. They now account for 60% of all deaths, with cardiovascular diseases leading the category at 22%30 and mostly being driven by poor diet, little exercise, smoking, and indoor air pollution caused by the “use of traditional cooking stoves and combustion of solid biomass fuels (animal dung, crop residue, and wood).”31 Nepal’s prevalence of non-communicable diseases is about the same as the South Asian region, but is almost double that of the LDCs which still have a much higher rate of communicable diseases.32 In looking at these health concerns from a quality of life perspective, Nepal’s
12 Central Bureau of Statistics, Nepal. National Population and Housing Census 2011 (National Report). 13 United Nations. World Population Ageing 2013. pg. 18. 14 For 2012. United Nations. Statistical Yearbook. pg. 1. 15 Ministry of Health and Population (MOHP) Nepal, New ERA, and ICF International Inc. Nepal Demographic and Health Survey 2011. Kathmandu, Nepal: Ministry of Health and Population, New ERA, and ICF International, Calverton, Maryland. 2012. 16 United Nations. World Population Ageing 2013. pg. 19 17 For 2012. United Nations. Statistical Yearbook. pg. 1 18 Ministry of Health and Population. Nepal Demographic and Health Survey 2011. 19 For 2011. Index Mundi. “Facts about Nepal.” 20 Ibid. 21 For 2011. United Nations. Statistical Yearbook.. pg. 4. 22 For 2013. World Bank. “Data: Mortality Rate, under-5 (per 1,000 live births).” http://data.worldbank.org/indicator/SH.DYN.MORT/countries/1W-XL?display=graph. Accessed October 16, 2014. 23 For 2012. World Health Organization. “Nepal: Health Profile.” Global Health Observatory: Country Statistics. 2013. http://www.who.int/gho/countries/npl/country_profiles/en/. Accessed October 21, 2014. 24 For 2010. United Nations. Statistical Yearbook.. pg. 40. 25 Ibid. 26 For 2012. World Bank. “Data: Life Expectancy at Birth, total (years).” http://data.worldbank.org/indicator/SP.DYN.LE00.IN/countries/1W-8S?display=graph. Accessed October 16, 2014. 27 Nepal Public Health Foundation. “About.” 2011. http://www.nphfoundation.org/. Accessed October 17, 2014 28 36% and 40% respectively. World Bank. “Data: Improved sanitation facilities (% of population with access).” http://data.worldbank.org/indicator/SH.STA.ACSN/countries/NP-XL-8S?display=graph. Accessed October 17, 2014. 29 UNICEF. “Nepal: Background.” February 2003. http://www.unicef.org/infobycountry/nepal_nepal_background.html. Accessed October 19, 2014. 30 Injuries and accidents make up the other 10%. World Health Organization - Noncommunicable Diseases (NCD): Country Profiles. Global Health Observatory: Country Statistics. 2014. http://www.who.int/gho/countries/npl/country_profiles/en/. Accessed October 21, 2014. 31 Nepal Health and Research Council. Prevalence of Non-Communicable Disease in Nepal Hospital Based Study. Kathmandu, Nepal. December 2010. pg. 38. 32 For 2012. World Bank. “Data: Cause of death, by non-communicable diseases (% of total).” http://data.worldbank.org/indicator/SH.DTH.NCOM.ZS/countries/1W-NP-XL-8S?display=graph. Accessed October 17, 2014.
P a g e | 3
disability adjusted life years (DALYs) rate was 303 per 1,000 in 2002, but was much lower for the Asia Pacific Region at 209 per 1,000 in the same year. 33
Demographic & Health Drivers
Though it is difficult to determine the specific causal links behind these demographic changes, research suggests several likely factors. The two main drivers, it seems, are government programs, incentivized by the Millennium Development Goals and funded by foreign aid, and media exposure. During the past several decades, the government of Nepal has implemented or encouraged various programs and policies to improve access to health care, family planning services, and schools.34 The government’s health policies have focused on improving maternal and infant health, providing comprehensive immunizations, distributing vitamins, ensuring access to health care facilities, ensuring access to contraceptives, legalizing abortion, circulating information about health, providing transportation and financial health incentives for expecting and new mothers, and encouraging community based health care groups.35 These improvements in health care have undoubtedly contributed to decreased levels of DALYs and of maternal, under-5, and adult mortality, and have also caused an increase in life expectancy. In conjunction, they have resulted in an overall increase in the population. However, better health care and family planning may be contributing more significantly to a decrease in the population as couples are more capable of determining the number and spacing of children, and as they see less need to have numerous children in order to offset the likely death of some children.
Government efforts in health and education have been coupled with ideational changes, which many researchers contribute to a greater exposure to media.36 Media exposure plays a role in demographic and health change by disseminating information about health and population pressures, and, more importantly, by exposing the population to new ideas about love, marriage, family size, and contraceptive use. Studies show that youths who have been consistently exposed to media sources are more likely to favor contraceptive use, delay marriage, have smaller families, and immunize their children.37 All of which can lead to lower fertility rates and better health.
Other factors that have likely influenced demographic and health changes include: an overall increase in primary education completion rates, especially for women; global pressure to induce changes, in the form of the Millennium Development Goals or conditional aid; and high rates of migration that lead to delayed marriages or spousal separation.
Current Trajectory
Based on the changes previously mentioned, it is probable that the population will continue to grow for close to 60 years,38 due to population momentum, declining mortality, and longer life expectancy. However, if the total fertility rate continues to decline, the population growth will gradually slow and then decline to a negative population growth by around 2100. The dedication of the Nepali government to health care and contraceptive access will likely lead to increasingly lower rates of maternal and under-5 mortality, a lower fertility rate, and increasing life expectancy.
In conjunction with increased life expectancy, it is likely that the non-communicable disease burden will increase. Communicable diseases will continue to decrease with improved access to health care. Nevertheless, without government intervention to improve sanitation, the incidence of preventable communicable diseases will almost certainly remain unacceptable high. Additionally, rates of undernourishment will probably not improve without a direct and concentrated effort.
Moreover, the recent development of a demographic dividend is likely to have a significant impact on the population demographics. The fact that such large proportion of the population is now of working age, coupled with the fact that the declining population growth has led to fewer dependents, means that the government can redirect
33 Most recent data I could find; was unable to find a DALYs rate for LDCs. World Health Organization Regional Offices for South-East Asia and the Western Pacific. Health in Asia and the Pacific. Chapter 6. 2008. pg. 183. http://www.wpro.who.int/publications/Health_in_Asia_and_the_Pacific/en/. 34 Ban, B., Tuladhar, S., Pant, S., and Suvedi, BK. Review of Health and Health Service Improvements in Nepal. JSI Research & Training Institute Inc., Policy, Planning and International Cooperation Division, Ministry of Health and Population, Nepal. JNHRC, Vol. 10, No. 2, Issue 21. May 2012. 35 Ibid. 36 See for example: Ghimire, Dirgha J., and Axinn, William G. “Family Change in Nepal: Evidence from Western Chitwan.” Contributions to Nepalese Studies. Vol. 33, Number 2. July 2006. pp. 177-201. Also: Macro International Inc. Trends in Demographic and Reproductive Health Indicators in Nepal. 2007. Calverton, Maryland, USA: Macro International Inc. 37 Ghimire, et al. 38 International Futures (IFs). Version 7.07.

P a g e | 4
funds that would have been used for supporting the basic needs of the dependent population to “productive sectors.”39 This means that Nepal can set itself up to be a more economically productive society. However, it is unlikely that, without serious economic development, Nepal will be able to provide steady employment for such a large portion of its population. A situation which may lead to more social unrest for the country. This also means that migration will probably increase. An increase in migration will probably lead to fewer children due to spousal separation, later marriages, and larger numbers of people who do not return to Nepal after migrating. Finally, as the current working population gets older, the lower population growth rate will mean an increasingly high dependency ratio.
Figure 1: Population Distribution Forecast
International Futures (IFs). Version 7.07. International Futures (IFs). Version 7.07.
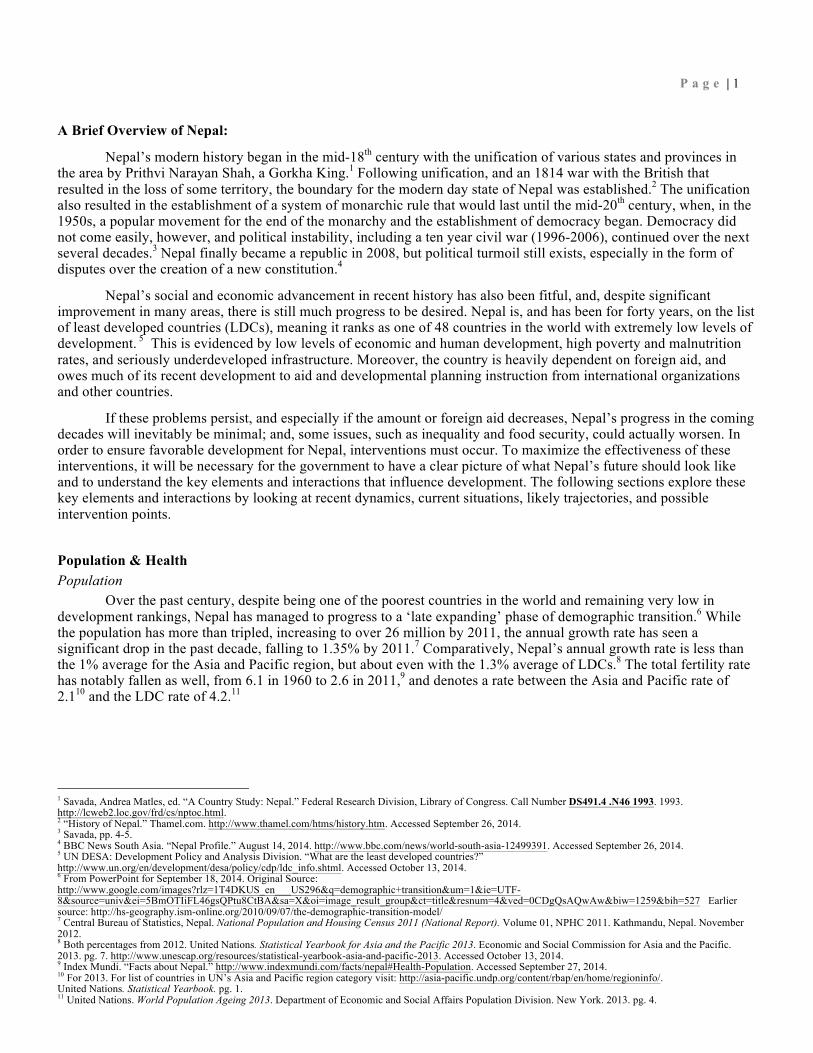
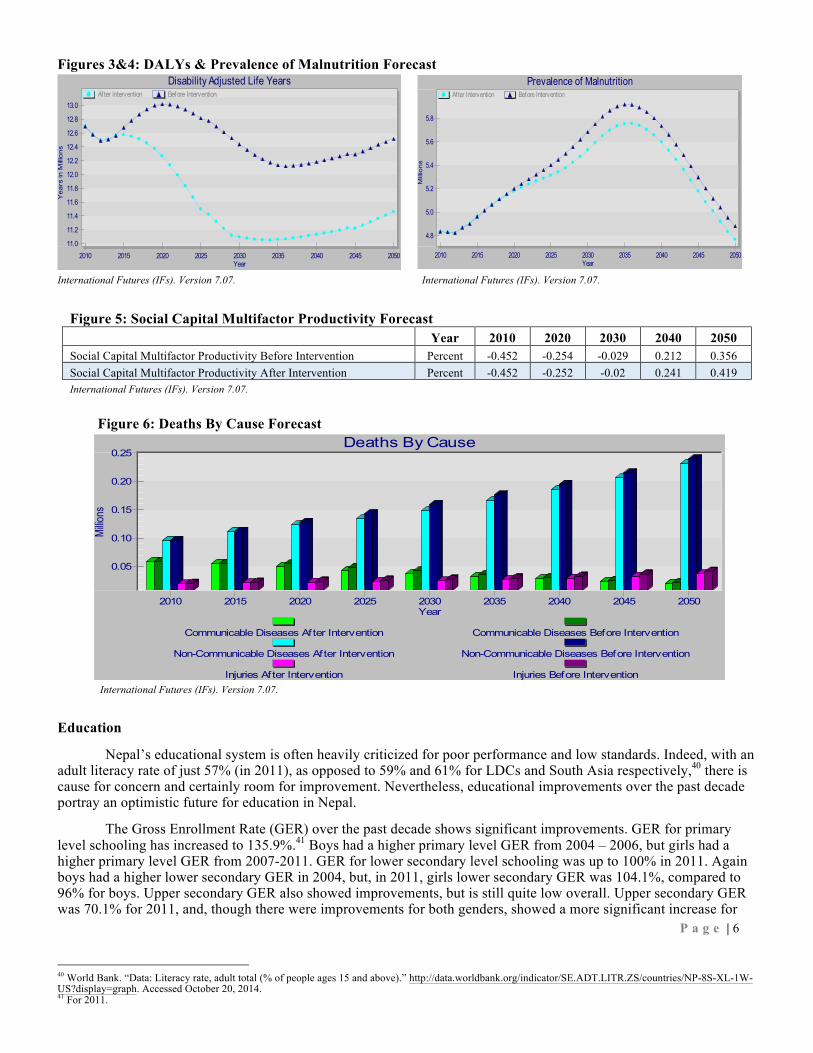
Interventions The continued growth of Nepal’s population over the next several decades is practically inevitable. The government will need to protect against social unrest through job creation or welfare support. They will also need prepare policies to protect the increasingly large numbers of aging population. Aside from this, the government will need to anticipate the greater financial and environmental burdens resulting from population increase. There is, however, some potential for limited relief. If the government can influence a decrease in the total fertility rate by 20% over the next fifteen years, even with mortality decreasing by 10% in the same period, by 2050 there will be 2 million fewer people in the country than there will be at current fertility rates. In addition to these changes, if the government increases spending on health by 20%, it will see a substantial decrease in DALYs, malnutrition rates, and communicable diseases (as well as non-communicable diseases) below the levels they will be at without intervention. Furthermore, the social capital multifactor productivity levels will be higher than can otherwise be expected.
P a g e | 5 39 Koirala, Kosh Raj. “Slowing Population Growth Sparks Optimism in Nepal.” Khabar South Asia. January 18, 2013. http://khabarsouthasia.com/en_GB/articles/apwi/articles/features/2013/01/18/feature-01. Accessed September 29, 2014.
Figure 2: Total Fertility Rate Forecast Year 2010 2020 2030 2040 2050
Population Before Intervention Millions 26.85 30.72 34.51 37.07 39.17 Population After Intervention Millions 26.85 30.47 33.49 35.83 37.55 International Futures (IFs). Version 7.07.
Government Health Expenditure (gdsm) • Gradual increase to 1.2 over 15 years
Mortality Multiplier (hlmortm)
• Gradual decrease to 0.9 over 15 years
Total Fertility Rate Multiplier (tfrm) • Gradual decrease to 0.8 over 15 years
Parameter Changes
Figures 3&4: DALYs & Prevalence of Malnutrition Forecast
International Futures (IFs). Version 7.07. International Futures (IFs). Version 7.07.
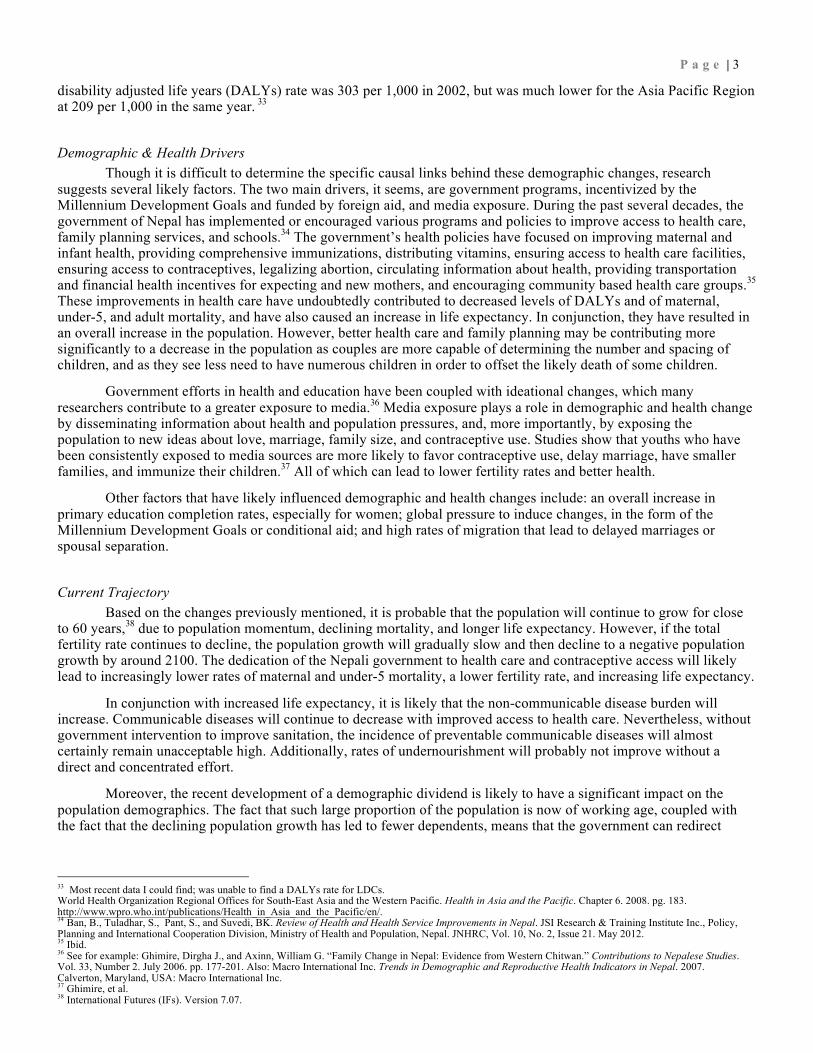
Figure 5: Social Capital Multifactor Productivity Forecast Year 2010 2020 2030 2040 2050 Social Capital Multifactor Productivity Before Intervention Percent -0.452 -0.254 -0.029 0.212 0.356 Social Capital Multifactor Productivity After Intervention Percent -0.452 -0.252 -0.02 0.241 0.419 International Futures (IFs). Version 7.07.
Figure 6: Deaths By Cause Forecast
International Futures (IFs). Version 7.07. Education
Nepal’s educational system is often heavily criticized for poor performance and low standards. Indeed, with an adult literacy rate of just 57% (in 2011), as opposed to 59% and 61% for LDCs and South Asia respectively,40 there is cause for concern and certainly room for improvement. Nevertheless, educational improvements over the past decade portray an optimistic future for education in Nepal.
The Gross Enrollment Rate (GER) over the past decade shows significant improvements. GER for primary level schooling has increased to 135.9%.41 Boys had a higher primary level GER from 2004 – 2006, but girls had a higher primary level GER from 2007-2011. GER for lower secondary level schooling was up to 100% in 2011. Again boys had a higher lower secondary GER in 2004, but, in 2011, girls lower secondary GER was 104.1%, compared to 96% for boys. Upper secondary GER also showed improvements, but is still quite low overall. Upper secondary GER was 70.1% for 2011, and, though there were improvements for both genders, showed a more significant increase for
P a g e | 6
40 World Bank. “Data: Literacy rate, adult total (% of people ages 15 and above).” http://data.worldbank.org/indicator/SE.ADT.LITR.ZS/countries/NP-8S-XL-1W-US?display=graph. Accessed October 20, 2014. 41 For 2011.
11.0
11.2
11.4
11.6
11.8
12.0
12.2
12.4
12.6
12.8
13.0
Disability Adjusted Life Years
Yea
rs in
Milli
ons
Year2010 2015 2020 2025 2030 2035 2040 2045 2050
After Intervention Before Intervention
4.8
5.0
5.2
5.4
5.6
5.8
Prevalence of Malnutrition
Mill
ion
s
Year2010 2015 2020 2025 2030 2035 2040 2045 2050
After Intervention Before Intervention
0.05
0.10
0.15
0.20
0.25Deaths By Cause
Millio
ns
Year2010 2015 2020 2025 2030 2035 2040 2045 2050
Communicable Diseases After Intervention Communicable Diseases Before Intervention
Non-Communicable Diseases After Intervention Non-Communicable Diseases Before Intervention
Injuries After Intervention Injuries Before Intervention
girls. This translated to an increase of the percentage of girls at secondary level to 49.7% in 2011.42 In comparison, the total GER for primary level schooling for South Asia in 2012 was 110% and was 106% for LDCs in the same year.43 For secondary level, the GER for these groups was 63% and 41%, respectively.44
The internal efficiency of Nepal’s schools also improved over the past decade. Promotion rates increased to 88% for grades 1-8, and to 89% percent for grades 9-10. The promotion rates were nearly the same for boys and girls. Repetition rates decreased for all grades, with little disparity for boys and girls. The dropout rate for grades 1-8 decreased, but increased for grades 1-10, again with little discrepancy between genders.45
Additionally, the number of children not in primary school significantly decreased to 5.4% in 2011. This is considerably better than the 9% of the South and West Asian region,46 and remarkably better than the 34% of the LDCs.47 In Nepal, for boys not in primary school, the percentage decreased from 9.9% to 5.7%, and for girls this it declined dramatically from 22% to 5.2%. However, the numbers are less heartening for lower secondary. Though progress has been made, 30.5% of children are still not attending lower secondary school.48
Finally, though it is difficult to measure, it seems the quality of education has also improved. The percentage of fully trained teachers has increased to 86.7%.49 The availability of free textbooks at primary level has also increased to 69.4%.50 The number of students per school has decreased for all levels, as has the overall student teacher ratio.51 Moreover, public spending on education has increased from 3.2% of total GDP expenditure in 2004 to 4.7% in 2011.52 Educational Drivers Once again, despite the extremely low income level of the country and the high levels of political instability over the last decade, it seems that the government is primarily responsible for the improvements in education. Aside from increasing expenditure for buildings and supplies, the government has made basic education (through 10th grade) free for students between the ages of 6 and 12.53 It has also heavily encouraged community involvement in schools and has provided financial incentives for both students and teachers for higher attendance and better performance.54 Many researchers believe the World Bank and the Millennium Development Goals are also behind the educational changes.55 The Millennium Development Goals are responsible for applying international focus and pressure on education in all countries, and the World Bank has played a role through funding and shaping educational policies.56
Despite the government’s involvement, it is hard to believe that government intervention is solely responsible for the educational changes, especially given the fact that education is not compulsory in Nepal. It seems necessary that widespread sentiment must have altered in recent history. People must find some value in education that they did not previously believe existed. There is little research to explain the ideological change about education in Nepal or the drivers behind it. It is possible that it is driven by the belief that education can lead to better employment opportunities, and, thus, better economic well-being. This is possible given the low unemployment in Nepal (2.7),57 but with so much of the population migrating for work, there is room for doubt. Another possibility is that the shift is driven by income increases. The International Futures software shows a strong global correlation between increasing GDP per capita and
P a g e | 7
42 All statistics in this paragraph from: School Level Educational Statistics of Nepal: 2011. Sanothimi, Bhaktapur. School Level Educational Statistics of Nepal: 2011. Government of Nepal: Department of Education. June 2012. www.doe.gov.np. 43 World Bank. “Data: School enrollment, primary (% gross).” http://data.worldbank.org/indicator/SE.PRM.ENRR/countries/NP-8S-XL?display=graph. Accessed October 20, 2014. 44 For 2012. World Bank. “Data: School enrollment, secondary (% gross).” http://data.worldbank.org/indicator/SE.SEC.ENRR/countries/NP-8S-XL?display=graph. Accessed October 20, 2014. 45 Ibid. 46 For 2009. UNESCO Institute for Statistics. Fact Sheet: Out-of-School Children. No. 12. June 2011. pg. 2. 47 For the period from 2000-2007. UNESCO Institute for Statistics. Building Human Capacities in Least Developed Countries to Promote Poverty Eradication and Sustainable Development. Paris, France. 2011. pg. 22. http://portal.unesco.org/en/ev.php-URL_ID=37082&URL_DO=DO_TOPIC&URL_SECTION=201.html. 48 Ibid. 49 For 2011. 50 For 2011. 51 UNESCO Institute for Statistics. Building Human Capacities in Least Developed Countries to Promote Poverty Eradication and Sustainable Development. 52 All Data in this paragraph from: World Bank. “Nepal Data.” http://data.worldbank.org/indicator/SE.XPD.TOTL.GD.ZS/countries/NP-8S-XM?display=graph. Accessed: September 29, 2014. 53 Sanothimi, Bhaktapur. School Level Educational Statistics of Nepal: 2011. 54 Ibid. 55 Carney, Stephen. “Negotiating Policy in an Age of Globalization: Exploring Educational “Policyscapes” in Denmark, Nepal, and China.” Comparative Education Review. Vol. 53, No. 1. February 2009. pp. 63-88. Also: Bista, Min Bahadur and Carney, Stephen. “Community Schooling in Nepal: A Genealogy of Education Reform since 1990.” Comparative Education Review. Vol. 53, No. 2. May 2009. pp. 189-211. 56 Ibid. 57 Index Mundi. “Facts about Nepal.”
higher levels of education.58 However, Nepal’s GDP per capita was actually lower in 2011 than in 2004.59 Therefore, the most likely drivers for ideological change in this case are the media and global opinions.
Current Trajectory If educational advances continue as they have been, educational attainment in Nepal will increase at all levels for both genders. The educational gender gap for primary and secondary will continue to narrow until it equals out, but may reverse, with more young women attending tertiary level schooling than young men. As this happens, it is likely that the total fertility rate will decline. However, with the current population momentum, government cost will inevitably continue to rise over the next century. This could be offset by higher economic productivity resulting from increased education or even by greater financial input from individuals as GDP per capita rises. However, if the costs are not sufficiently offset, it is likely that, in the long run, the quality of education will suffer.
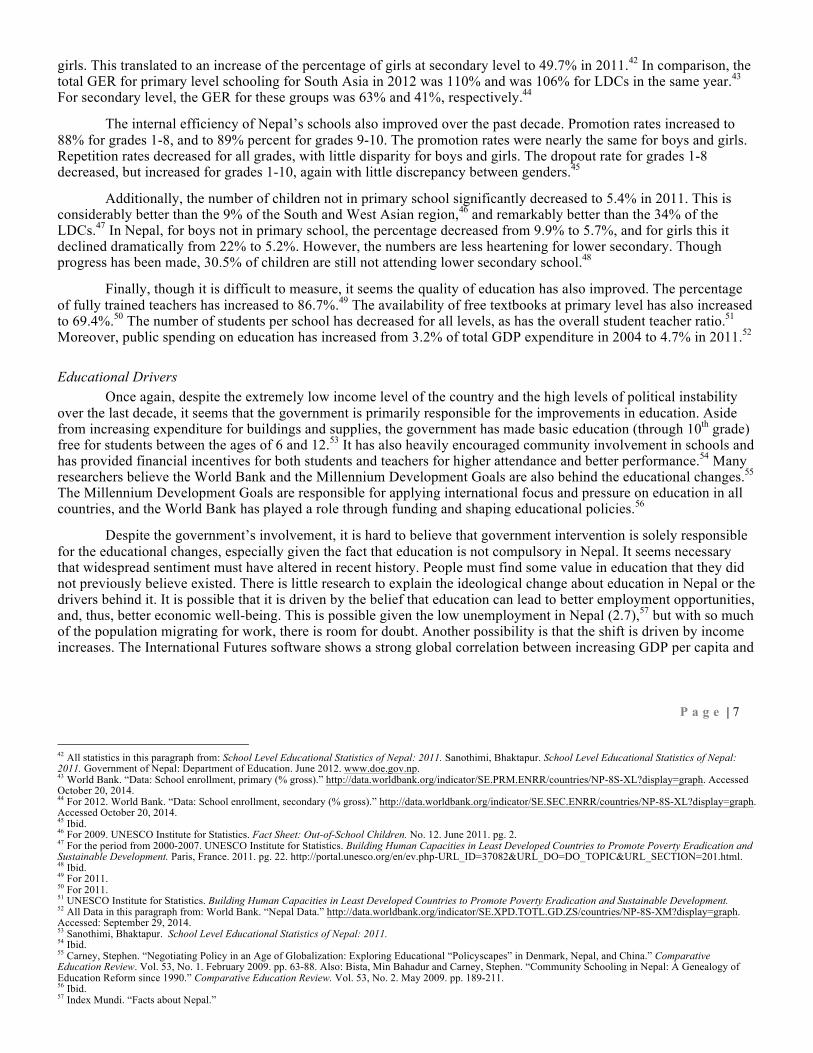
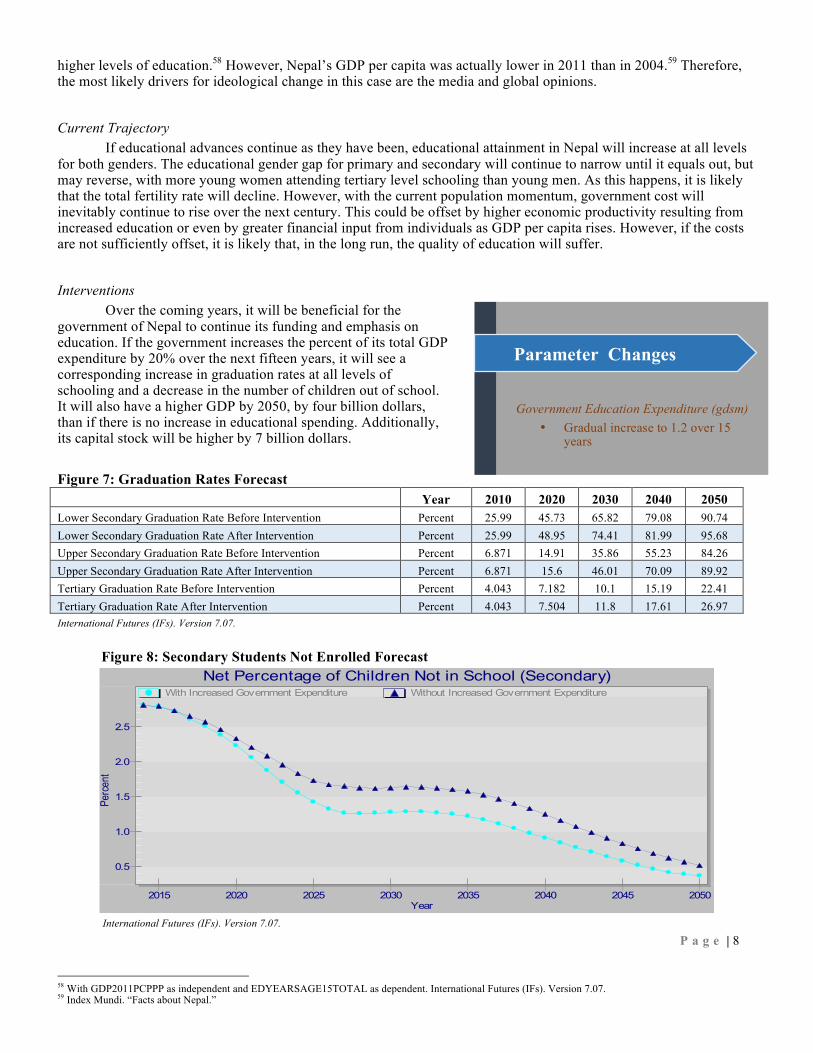
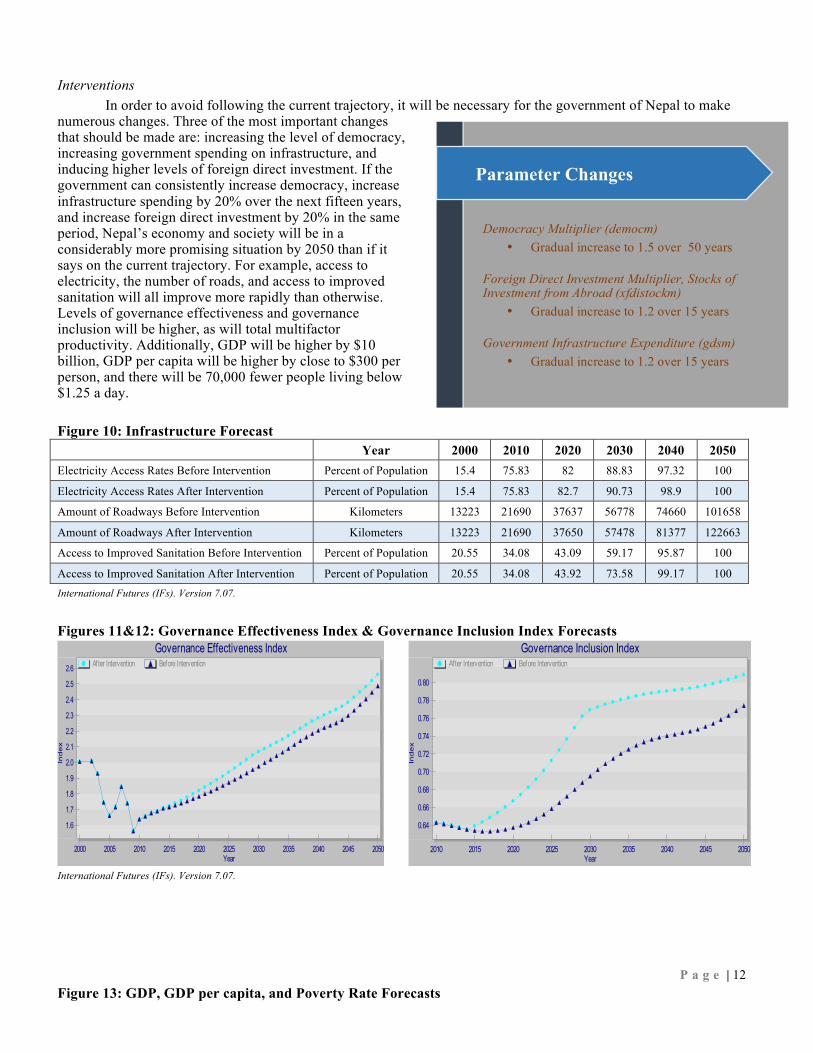
Interventions Over the coming years, it will be beneficial for the government of Nepal to continue its funding and emphasis on education. If the government increases the percent of its total GDP expenditure by 20% over the next fifteen years, it will see a corresponding increase in graduation rates at all levels of schooling and a decrease in the number of children out of school. It will also have a higher GDP by 2050, by four billion dollars, than if there is no increase in educational spending. Additionally, its capital stock will be higher by 7 billion dollars. Figure 7: Graduation Rates Forecast Year 2010 2020 2030 2040 2050 Lower Secondary Graduation Rate Before Intervention Percent 25.99 45.73 65.82 79.08 90.74 Lower Secondary Graduation Rate After Intervention Percent 25.99 48.95 74.41 81.99 95.68 Upper Secondary Graduation Rate Before Intervention Percent 6.871 14.91 35.86 55.23 84.26 Upper Secondary Graduation Rate After Intervention Percent 6.871 15.6 46.01 70.09 89.92 Tertiary Graduation Rate Before Intervention Percent 4.043 7.182 10.1 15.19 22.41 Tertiary Graduation Rate After Intervention Percent 4.043 7.504 11.8 17.61 26.97 International Futures (IFs). Version 7.07.
Figure 8: Secondary Students Not Enrolled Forecast
International Futures (IFs). Version 7.07.
P a g e | 8
58 With GDP2011PCPPP as independent and EDYEARSAGE15TOTAL as dependent. International Futures (IFs). Version 7.07. 59 Index Mundi. “Facts about Nepal.”
0.5
1.0
1.5
2.0
2.5
Net Percentage of Children Not in School (Secondary)
Perc
ent
Year2015 2020 2025 2030 2035 2040 2045 2050
With Increased Government Expenditure Without Increased Government Expenditure
Government Education Expenditure (gdsm) • Gradual increase to 1.2 over 15
years
Parameter Changes

Figure 9: GDP (PPP) Forecast Year 2010 2020 2030 2040 2050 GDP PPP Billions (in 2011 dollars) 53.67 73.03 98.75 144.5 243.5 GDP PPP Billion (in 2011 dollars) 53.67 72.97 98.31 143.2 239.4 Capital Stock Before Intervention Billion (in 2011 dollars) 80.04 122.7 182.6 280.6 493.2
Capital Stock After Intervention Billion (in 2011 dollars) 80.04 122.7 182.8 282.1 499.2
International Futures (IFs). Version 7.07. Governance, Economy, & Infrastructure Governance
Governance issues in Nepal are extensive. The country recently emerged from a decade long civil war and only became a democracy 2008. Since then, there have been several disputes concerning the make-up of the government and the constitution which have led to political turmoil.60 Additionally, Nepal suffers from high levels of corruption and low levels of political rights and civil liberties. The fledging government is not transparent, rule of law is weak, discrimination, in the form of the limited access of some minorities or groups to electoral stations and participation in government, is widespread, and media censorship is excessive. 61
In addition, the capacity of the government still leaves much to be desired. Its ability to affect the significant changes in education and health mentioned previously is a promising start, but the funding and structure of those changes are mostly attributable to outside forces.62 In fact, 26% of Nepal’s national budget comes from foreign aid.63 Government revenue only accounts for 19% of Nepal’s GDP, with 14% coming from tax revenue.64 Remarkably, in comparison with South Asia’s 11% and the LDC’s 14.5%,65 Nepal’s low levels of tax revenue seem tolerable, especially for a newly minted government. Nevertheless, high levels of perceived corruption may be hampering the government’s ability to both collect revenue and to spend it effectively.66
Moreover, though the civil war has ended, the government has been unsuccessful in permanently incorporating the interest of the insurgency group into the political arena. This has, of course, caused the group to be increasingly dissatisfied with the government, and may untimely lead to further conflict.67 Thus, the internal security of Nepal is fragile. Threats to security from external sources, however, are few. Nepal’s major concern regards its close proximity to Tibet and the large number of Tibetan immigrants in Nepal. Given the conflict between Tibet and China, it is possible the large Tibetan immigrant population could lead to a spillover of the conflict into Nepal. If either of these situations were to occur, it is unlikely that the Nepalese government could ensure the security of its people.68
Finally, inclusiveness is another governance issue that needs to be addressed in Nepal, though women’s suffrage and inclusion is not a significant problem for the country. Women currently have higher levels of educational enrollment and longer life expectancies than men;69 they have high levels of workforce participation;70 and they have a higher percentage of seats in the national parliament than most countries in the world. Indeed the percentage of women in the national parliament is 33%, as compared to an average of 20% for South Asia, 21% for LDC countries, and 22% for the world.71 On the other hand, religious and minority inclusion is a problem for Nepal. Much discrimination is
P a g e | 9
60 Such as a dissolution of the Constituent Assembly after their failure to agree on a new constitution before the deadline. Minority Rights Group International. State of the World's Minorities and Indigenous Peoples 2013 – Nepal. September 24, 2013. http://www.refworld.org/docid/526fb73ab.html. Accessed October 15, 2014. 61 Information from Aggregate Scores and Subcategory Scores 2014. Freedom House. “Freedom in the World: Aggregate and Subcategory Scores.” http://www.freedomhouse.org/report/freedom-world-aggregate-and-subcategory-scores. Accessed October 19, 2014. 62 Funding from organizations such as IMF and WB structure of changes and planning also significantly influenced by these organizations and UN Millennium Development Goals. Carney, Stephen. “Negotiating Policy in an Age of Globalization: Exploring Educational “Policyscapes” in Denmark, Nepal, and China.” Bista, Min Bahadur and Carney, Stephen. “Community Schooling in Nepal: A Genealogy of Education Reform since 1990.” 63 Government of Nepal. Source Book: Foreign Aid in Nepal. Ministry of Finance: Foreign Aid Coordination Division. Kathmandu, Nepal. http://mof.gov.np/en/content/mof-link-pages-7.html. 64 For 2012. World Bank. “Data: Tax revenue (% of GDP).” http://data.worldbank.org/indicator/GC.TAX.TOTL.GD.ZS/countries/NP-8S-XL?display=graph. Accessed October 18, 2014. 65 Ibid. 66 Transparency International. “Corruption Perceptions Index 2013.” 67 Central Intelligence Agency. “World Factbook: Nepal.” https://www.cia.gov/library/publications/the-world-factbook/geos/np.html. 68 Based on its recent history and current instability. 69 World Bank. “Data: Education Statistics.” http://data.worldbank.org/topic/education?display=graph#boxes-box-topic_cust_sec. Accessed October 19, 2014. 70 Ibid. 71 World Bank. “Data: Proportion of seats held by women in national parliaments (%).” http://data.worldbank.org/indicator/SG.GEN.PARL.ZS/countries/NP-8S-XL-1W-US?display=graph. Accessed October 19, 2014.

caused by the large numbers of ethnic groups and enduring caste system, but discrimination against non-Hindus and immigrants is also prevalent.72 Economy & Infrastructure Nepal’s economy has been highly variable over the past two decades due to the internal conflict, political instability, poor governance, and external shocks. However, recent patterns indicate the economy is improving. For example, the GDP annual growth rate has been between 3 and 5 percent over the last five years. This rate is similar to the average LDC rate and just under South Asia’s rate of 6%.73 Nevertheless, the GDP and GDP per capita are still quite low at $62 billion74 and $2,244, 75 respectively, at current international dollars. These figures are remarkably small compared to the LDC’s average GDP of $1.8 trillion,76 but not so when compared with the LDC’s average GDP per capita of $2,003.77 Compared with South Asia, however, Nepal’s GDP and GDP per capita are dwarfed by South Asia’s average GDP of $8.3 trillion78 and average GDP per capita of $5,005.79 Moreover, the country ranks extremely low for human development, with an HDI rank of 145th of 187 and a score of 0.540, 80 and it suffers from high levels of poverty, with a quarter of its population falling below the international poverty line of $1.25/day.81
Nepal’s GDP is comprised primarily of agricultural exports, accounting for 35%, remittances, accounting for 25%, and foreign aid, accounting for 26%.82 The export of goods and services accounts for only 10% of the country’s GDP, 83 while imports take up 38%.84 This, of course, results in a trade deficit, which has been continuously increasing over the past decade, and currently stand at negative five billion. 85 The trade gap in Nepal is notably larger than the gap in both South Asia and the LDCs. In South Asia, for example, exports of goods and services account for 23% of the total GDP, while imports consume 28%. Similarly, in the LDCs, exports are 27% of the total GDP and imports are 38%. In addition to the ever-increasing trade deficit, investment is extremely low in all sectors of the economy and net inflows of foreign direct investment as a percentage of GDP are discouragingly low at only 0.5%.86 Inflation is also problematically high in Nepal, with consumer prices having an annual inflation rate of 9%, which is higher than both South Asia, at 8%, and LDCs, at 6%.87 Finally, concerning savings, Nepal has a surprisingly high rate of gross national savings, at 40% of the GDP, 88 and ranks 16th in the world for top saving countries.89 However, it is likely that the high rate of savings can be contributed to the high levels of foreign aid, and the impressive rate of saving does not persist when it comes to Nepal’s gross domestic savings rate, which is only 9.4%.90
P a g e | 10
72 Minority Rights Group International. State of the World's Minorities and Indigenous Peoples 2013 – Nepal. 73 World Bank. “Data: GDP Growth, (annual %).” http://data.worldbank.org/indicator/NY.GDP.MKTP.KD.ZG/countries/NP-XL-8S?display=graph. Accessed October 17, 2014. 74 For 2013. World Bank. “Data: GDP, PPP (current international dollar).” http://data.worldbank.org/indicator/NY.GDP.MKTP.PP.CD/countries/NP-XL-8S?display=graph. Accessed October 17, 2014. 75 For 2013. World Bank. “Data: GDP per capita PPP (current international dollar).” http://data.worldbank.org/indicator/NY.GDP.PCAP.PP.CD/countries/1W-XL-NP-8S?display=graph. Accessed October 17, 2014. 76 PPP in current international dollars, for 2013. World Bank. “Data: GDP, PPP (current international dollar).” http://data.worldbank.org/indicator/NY.GDP.MKTP.PP.CD/countries/NP-XL-8S?display=graph. Accessed October 17, 2014. 77 PPP in current international dollars, for 2013. World Bank. “Data: GDP per capita PPP (current international dollar).” http://data.worldbank.org/indicator/NY.GDP.PCAP.PP.CD/countries/1W-XL-NP-8S?display=graph. Accessed October 17, 2014. 78 PPP in current international dollars, for 2013. World Bank. “Data: GDP, PPP (current international dollar).” http://data.worldbank.org/indicator/NY.GDP.MKTP.PP.CD/countries/NP-XL-8S?display=graph. Accessed October 17, 2014. 79 PPP in current international dollars, for 2013. World Bank. “Data: GDP per capita PPP (current international dollar).” http://data.worldbank.org/indicator/NY.GDP.PCAP.PP.CD/countries/1W-XL-NP-8S?display=graph. Accessed October 17, 2014. 80 For 2013. United Nations Development Program. “Human Development Reports.” 2013. http://hdr.undp.org/en/content/table-1-human-development-index-and-its-components. Accessed October 18, 2014. 81 Central Intelligence Agency. “World Factbook: Nepal.” 82 For 2010/2011. Government of Nepal. Foreign Aid in Nepal (FY 2010/2011). Ministry of Finance: Foreign Aid Coordination Division. Singhadurbar, Kathmandu. www.mof.gov.np. 83 For 2012. World Bank. “Data: Exports of goods and services (% of GDP).” http://data.worldbank.org/indicator/NE.EXP.GNFS.ZS/countries/NP-8S-XL?display=graph. Accessed November 1, 2014. 84 For 2012. World Bank. “Data: Imports of goods and services (% of GDP).” http://data.worldbank.org/indicator/NE.IMP.GNFS.ZS/countries/NP-8S-XL?display=graph. Accessed October 30, 2014. 85 For 2012. Knoema. “World Data Atlas: Nepal - Balance of Payments » Current accounts - Net trade in goods and services (BoP, current US$).” http://knoema.com/atlas/Nepal/topics/Economy/Balance-of-Payments-Current-accounts/Net-trade-in-goods-and-services-BoP-current-USdollar. Accessed November 1, 2014. 86 Net inflows, % of GDP, for 2011. Index Mundi. “Facts about Nepal.” 87 For 2013. World Bank. “Data: Inflation, consumer prices (annual %).” http://data.worldbank.org/indicator/FP.CPI.TOTL.ZG/countries/NP-8S XL?display=graph. Accessed November 1, 2014. 88 As compared to 30% in South Asia and 25% in LDCs; for 2012. World Bank. “Data: Gross savings (% of GDP).” http://data.worldbank.org/indicator/NY.GNS.ICTR.ZS/countries/NP-8S-XL?display=graph. Accessed November 2, 2014. 89 Forbes. “World's Top Saving Countries, 2013.” http://www.forbes.com/pictures/fflf45kll/no-16-nepal/. Accessed November 9, 2014. 90 Basnet, Subarna. Cointegration Analysis of the Impact on Foreign Aid on Gross Domestic Saving: Case Study of Nepal. Tribhuvan University. 2011. pg. 15.

Economic Drivers Nepal’s poor economic and developmental performance stems from several issues. To begin with, Nepal’s economy is highly dependent on agriculture, and over 70% of the population relies on agriculture for their livelihood.91 As a result, the majority of Nepal’s exports are agricultural goods. Research has shown that heavy reliance on such ‘primary’ goods can impede a country’s economic growth and that industrial production is necessary to help a country move to a higher income level group.92 However, Nepal’s current prospects for industrial growth are bleak. Industry accounts for only 16% of Nepal’s GDP, a percentage nearly half the level of both South Asia (26%) and the least developed countries (29%).93 Additionally, as previously mentioned, it has low levels of capital and investment, including very little foreign direct investment, and, therefore, little ability to generate economic growth through increased industrial production. The low levels of investment, in particular, can be attributed to a poor regulatory environment, strict labor regulations, and high subsidies to government owned businesses.94 Furthermore:
“a statist approach to economic management and development is a serious drag on business activity. A lack of transparency, corruption, and a burdensome approval process impede much-needed private investment and production. Property rights are undermined by the inefficient judicial system, which is subject to substantial corruption and political influence.”95
Increased capital and investment, especially foreign direct investment (because it can boost Nepal’s economy without expending Nepalese resources), could help Nepal develop valuable industries and create jobs. For example, Nepal has vast hydroelectric potential, but requires investment to create the necessary infrastructure.96 Nevertheless, it will not be able to do so without governmental reforms to improve the business environment.
A second issue impeding economic development, as just suggested, is poor infrastructure. Nepal has poor transportation infrastructure with insufficient roadways and few other options.97 Electricity is also a problem. Only 70% of the population has access to electricity, as compared to 76% in South Asia and 35% in LDCs, and frequent and persistent power outages make reliance on electricity troublesome. 98 Additionally, sanitation is a problem for both infrastructure and health, and levels are exceeding low, with only 37% of the population having access to improved sanitation. Comparatively, this percentage is 36 in LDCs and 40 in South Asia.99 Finally, access to technology is also limited, with only 13 of every 100 people having access to the internet.100 This serious dearth of physical capital hinders Nepal’s production levels. 101 Conversely, there is high demand for industrial and consumer goods, which, of course, contributes to the negative trade balance.102 Human capital is also quite low. With 43% of the adult education being illiterate,103 and much of the rest having low levels of education, there is a definitive shortage of skilled labor in the country.104 Current Trajectory If the current trajectory continues unimpeded, there is little hope for significant improvement in Nepal’s governance or economy. Increased levels of education and a better overall level of health within the population will expand human capital and will probably help boost the economy over the coming decades. However, without intervention, these changes may be counterbalanced by high levels of corruption and poor governance. Moreover, without improvements in infrastructure, industrial production, and poverty levels, Nepal’s future will most probably include economic stagnation and distributional inequality.
P a g e | 11
91 Ibid. 92 Food and Agriculture Organization. “World Agriculture: Towards 2015/2030 – An FAO Perspective.” http://www.fao.org/docrep/005/y4252e/y4252e11.htm. Accessed October 18, 2014. 93 For 2012. World Bank. “Data: Value added, % of GDP.” http://data.worldbank.org/indicator/NV.IND.TOTL.ZS/countries/NP-8S-XL?display=graph. Accessed November 9, 2014. 94 The Heritage Foundation. “2014 Index of Economic Freedom: Nepal.” 2014. http://www.heritage.org/index/country/nepal. Accessed October 17, 2014. 95 Ibid. 96 Central Intelligence Agency. “World Factbook: Nepal.” 97 Ibid. 98 World Bank. “Data: Access to electricity (% of population).” http://data.worldbank.org/indicator/EG.ELC.ACCS.ZS/countries/1W-NP-XL-8S?display=graph. Accessed October 17, 2014. 99 World Bank. Data: Improved sanitation facilities (% of population with access).” http://data.worldbank.org/indicator/SH.STA.ACSN/countries/NP-XL-8S?display=graph. Accessed October 17, 2014. 100 This is comparable to South Asia and higher than the LDCs 7 out of 100. World Bank: “Data: Internet Users (per 100 people).” http://data.worldbank.org/indicator/IT.NET.USER.P2/countries/NP-8S-XL-1W-US?display=graph. Accessed October 19, 2014. 101 Trading Economics. “Nepal: Economic Indicators.” 2014. http://www.tradingeconomics.com/nepal/indicators. Accessed October 17, 2014. 102 Ibid. 103 World Bank. “Data: Literacy rate, adult total (% of people ages 15 and above).” 104 Encyclopedia of the Nations. “Nepal-Industry.” http://www.nationsencyclopedia.com/economies/Asia-and-the-Pacific/Nepal-INDUSTRY.html. Accessed October 22, 2014.
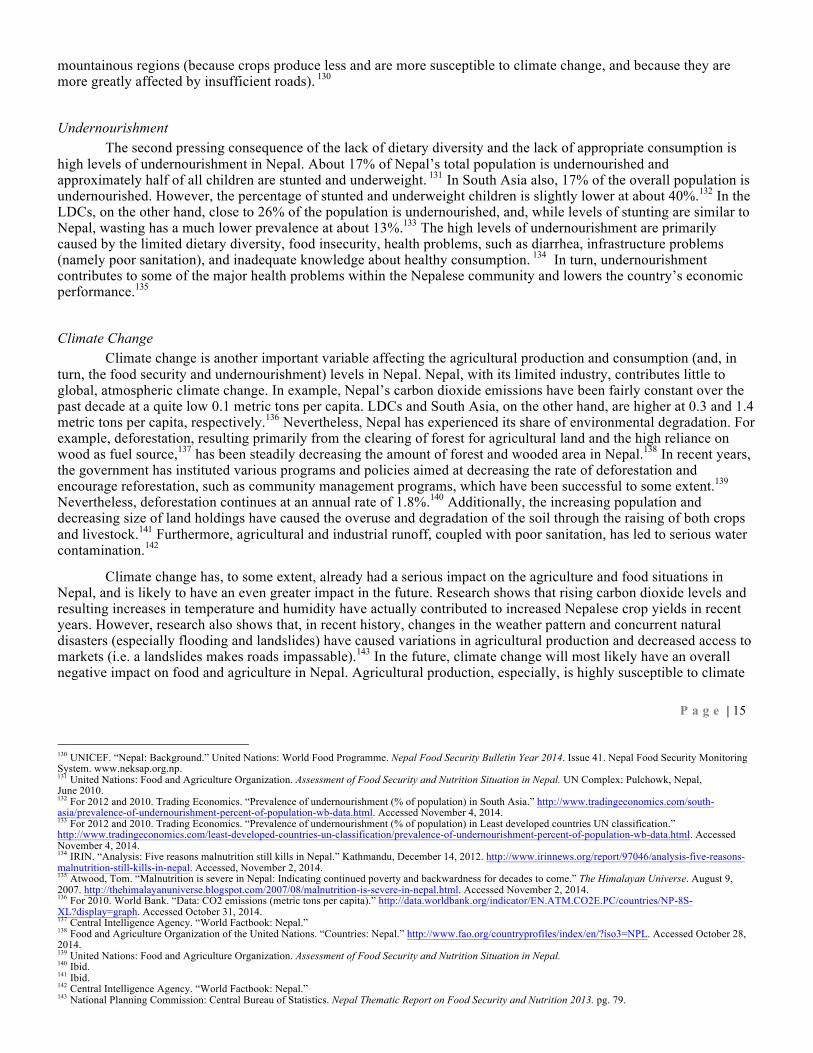
Interventions In order to avoid following the current trajectory, it will be necessary for the government of Nepal to make numerous changes. Three of the most important changes that should be made are: increasing the level of democracy, increasing government spending on infrastructure, and inducing higher levels of foreign direct investment. If the government can consistently increase democracy, increase infrastructure spending by 20% over the next fifteen years, and increase foreign direct investment by 20% in the same period, Nepal’s economy and society will be in a considerably more promising situation by 2050 than if it says on the current trajectory. For example, access to electricity, the number of roads, and access to improved sanitation will all improve more rapidly than otherwise. Levels of governance effectiveness and governance inclusion will be higher, as will total multifactor productivity. Additionally, GDP will be higher by $10 billion, GDP per capita will be higher by close to $300 per person, and there will be 70,000 fewer people living below $1.25 a day. Figure 10: Infrastructure Forecast Year 2000 2010 2020 2030 2040 2050 Electricity Access Rates Before Intervention Percent of Population 15.4 75.83 82 88.83 97.32 100
Electricity Access Rates After Intervention Percent of Population 15.4 75.83 82.7 90.73 98.9 100
Amount of Roadways Before Intervention Kilometers 13223 21690 37637 56778 74660 101658
Amount of Roadways After Intervention Kilometers 13223 21690 37650 57478 81377 122663
Access to Improved Sanitation Before Intervention Percent of Population 20.55 34.08 43.09 59.17 95.87 100
Access to Improved Sanitation After Intervention Percent of Population 20.55 34.08 43.92 73.58 99.17 100 International Futures (IFs). Version 7.07. Figures 11&12: Governance Effectiveness Index & Governance Inclusion Index Forecasts
International Futures (IFs). Version 7.07.
P a g e | 12 Figure 13: GDP, GDP per capita, and Poverty Rate Forecasts
1.6
1.7
1.8
1.9
2.0
2.1
2.2
2.3
2.4
2.5
2.6
Governance Effectiveness Index
Ind
ex
Year2000 2005 2010 2015 2020 2025 2030 2035 2040 2045 2050
After Intervention Before Intervention
0.64
0.66
0.68
0.70
0.72
0.74
0.76
0.78
0.80
Governance Inclusion Index
Ind
ex
Year2010 2015 2020 2025 2030 2035 2040 2045 2050
After Intervention Before Intervention
Democracy Multiplier (democm) • Gradual increase to 1.5 over 50 years
Foreign Direct Investment Multiplier, Stocks of Investment from Abroad (xfdistockm)
• Gradual increase to 1.2 over 15 years
Government Infrastructure Expenditure (gdsm) • Gradual increase to 1.2 over 15 years
Parameter Changes

International Futures (IFs). Version 7.07.
Food, Agriculture, & Environment Food & Agriculture Hampered by high levels of poverty and poor infrastructure and contributing significantly to health problems, the food and agricultural situations in Nepal are cause for serious concern. Agricultural production comprises a considerable proportion of the GDP of Nepal, about 35%, with about two-thirds of “agriculture’s contribution to GDP [coming] from the crops sub-sector [and] the remainder [deriving] from the livestock sub-sector.”105 Agriculture value added is higher in Nepal than in the LDCs and South Asia at 37%, versus 25% and 18% respectively. 106 Work in agriculture employs three-fourths of the population’s labor force,107 and likely explains why 82% of Nepal’s total population lives in rural areas; a percentage that, while declining consistently for the past decade, is still much high than the 70% rural population in LDCs and the 68% rural population in South Asia. 108
As substantial as the agricultural sector seems, arable land actually only accounts for 16% of Nepal’s total landmass. Farms are small with low levels of production, and, even with livestock contributions,109 often do not produce enough to meet the needs of the family.110 Needless to say, few farms are able to produce surplus produce for export. In fact, only 3.1% of all farms are able to do so.111 Livestock exports are limited as well.112 Indeed, though agriculture value added is relatively high, agriculture value added per worker is only 270 and is significantly lower than the 446 per worker in LDCs and 669 per worker in South Asia.113 In addition, though yield has been increasing overall in the past decade and cereal yield is currently at 2,570 kg per hectare as compared to 1,974 in LDCs and 3,085 in South Asia,114 the use of high-yield/high-resistance seeds is limited (probably mostly to the small percentage of commercial producers). Moreover, production is still variable year to year, is not increasing across all crops, and, for some crops and some regions, is solely contributable to increased areas of production.115
Agricultural Production Drivers
The problematically low levels of production stem from three major causes. First, the small size of land holdings keeps farmers from producing efficiently.116 The average farm size is only 0.7 hectares, though the majority
P a g e | 13
105 National Planning Commission: Central Bureau of Statistics. Nepal Thematic Report on Food Security and Nutrition 2013. pg. 62. 106 For 2012. Agriculture value added “is the net output of a sector after adding up all outputs and subtracting intermediate inputs. It is calculated without making deductions for depreciation of fabricated assets or depletion and degradation of natural resources.” World Bank. “Data: Agriculture, value added (% of GDP).” http://data.worldbank.org/indicator/NV.AGR.TOTL.ZS/countries/1W-NP-XL-8S?display=graph. Accessed October 28, 2014. 107 National Planning Commission: Central Bureau of Statistics. Nepal Thematic Report on Food Security and Nutrition 2013. pg. 62. 108 For 2012. World Bank. “Data: Rural population (% of total population).” http://data.worldbank.org/indicator/SP.RUR.TOTL.ZS/countries/1W-NP-XL-8S?display=graph. Accessed November 1, 2014. 109 A majority of agricultural households keep livestock. [….]The average number of cattle, buffalo, goat, sheep, and poultry among agriculture households are 1.4, 0.7, 2.2, 2.4, and 3.4, respectively. National Planning Commission: Central Bureau of Statistics. Nepal Thematic Report on Food Security and Nutrition 2013. pg pg. 64. 110 United Nations: World Food Programme. Executive Brief: Nepal Comprehensive Food Security and Vulnerability Analysis. February 2007. http://www.wfp.org. 111 National Planning Commission: Central Bureau of Statistics. Nepal Thematic Report on Food Security and Nutrition 2013. pg. 62. 112 Pariyar, Dinesh. “Country Pasture/Forage Resource Profiles: Nepal.” Food and Agriculture Organization. http://www.fao.org/ag/AGP/AGPC/doc/Counprof/Nepal/nepal.htm. Accessed November 3, 2014. 113 For 2012, in constant 2005 U.S. Dollars. World Bank. “Data: Agriculture value added per worker (constant 2005 US$).” http://data.worldbank.org/indicator/EA.PRD.AGRI.KD/countries/1W-NP-XL-8S?display=graph. Accessed October 28, 2014. 114 For 2013. World Bank. “Data: http://data.worldbank.org/indicator/AG.YLD.CREL.KG/countries/NP-8S-XL?display=graph Accessed October 30, 2014. 115 National Planning Commission: Central Bureau of Statistics. Nepal Thematic Report on Food Security and Nutrition 2013. pg. 62-73. 116 Because they have to fraction their land for different subsistence crops rather than planting larger amounts of the most climate appropriate or most profitable crops.
Year 2010 2020 2030 2040 2050 GDP PPP Before Intervention Billions (in 2011 dollars) 53.67 72.97 98.31 143.2 239.4
GDP PPP After Intervention Billions (in 2011 dollars) 53.67 73.01 99.11 147.2 249.7
GDP per capita PPP Before Intervention Thousands (in 2011 dollars) 1.999 2.375 2.848 3.863 6.112
GDP per capita PPP After Intervention Thousands (in 2011 dollars) 1.999 2.376 2.871 3.97 6.373
Population with Income Below $1.25 a Day After Intervention Millions 6.663 6.207 5.721 3.834 1.802
Population with Income Below $1.25 a Day Before Intervention Millions 6.663 6.195 5.703 3.908 1.872
Total Multifactor Productivity Before Intervention 1 1.201 1.481 1.955 2.741
Total Multifactor Productivity After Intervention 1 1.201 1.496 2.014 2.848

of farms are smaller than 0.5 hectares.117 With the inevitable population increase, it is likely that the size of farms will decrease as land fragmentation occurs, and, correspondingly, production will decrease.118 Second, farmers in Nepal primarily rely on rudimentary tools for farming. They have little access to and little ability to buy machinery or improved tools that would increase production.119 Third, there is low government and individual investment in agricultural inputs such as advanced (high-yield/high-resistance) seeds, improved (not rain-fed) irrigation, pesticides, and chemical fertilizers. 120
Food Insecurity
Inefficient and inconsistent production has obvious negative consequences for Nepal’s GDP (they have an agricultural trade deficit)121 and for household income. A more urgent matter for the country, however, is the repercussion that poor production has on food security. As aforementioned, small land plots hinder many families from producing enough to meet their needs.122 As a consequence, the majority of families are forced to purchase goods to supplement their diet. However, steep inflation of food prices over the last decade, combined with limited access to markets caused by poor infrastructure, namely insufficient roads, means many families are unable to supply themselves with the necessary dietary supplements.123 Unexpectedly given this information, most individuals in Nepal not only meet the minimum kilocalorie requirements of the country, which is 2,200 kcals per capita, per day, but exceed it with an average kilocalorie intake (per capita, per day) of 2,536.124 This average also exceeds the LDC’s average of 2,200 kcals per capita, per day,125 but is slightly lower than South Asia’s approximate average of 2,700.126 Despite the high average calorie intake, it is likely that most of the rural population is still not consuming enough. The “national thresholds set by the government of Nepal are based on “light activity” and the energy demands for a healthy active life in rural areas typically exceed those in urban areas due to increased activity.”127 In fact, 38% of the population is food energy deficient.128 In addition, the dietary distribution of the majority of the population, though it has been improving in recent years, is limited to mostly cereals and very little consumption of meat or other protein sources or fruits and vegetables.129
The lack of dietary diversity and the lack of appropriate consumption both have serious consequences for the Nepalese population. Of these, the most urgent are food insecurity and undernourishment. Food insecurity in Nepal stems from low levels of agricultural production, poor access to markets, rising food prices, climate change (which can affect both production and access to markets), population growth, low incomes, and lack of access to credit. Because Nepal relies heavily on food imports, global food deficits and food prices can also affect the country’s food security. In addition, although food insecurity is wide-spread in Nepal, it disproportionally affects minority groups and groups that are discriminated against, such as low caste groups, families with low incomes and no financial support from remittances, and families in the
P a g e | 14
117 National Planning Commission: Central Bureau of Statistics. Nepal Thematic Report on Food Security and Nutrition 2013. pg. 65. 118 Land fragmentation occurs as parents split up their land in order to distribute it amongst their children. National Planning Commission: Central Bureau of Statistics. Nepal Thematic Report on Food Security and Nutrition 2013. pg. 66. 119 National Planning Commission: Central Bureau of Statistics. Nepal Thematic Report on Food Security and Nutrition 2013. pg. 69. 120 Ibid. pg. 68. 121 For 2012. Knoema. “World Data Atlas: Nepal - Balance of Payments » Current accounts - Net trade in goods and services (BoP, current US$).” 122 United Nations: World Food Programme. Executive Brief: Nepal Comprehensive Food Security and Vulnerability Analysis. 123 Ibid. 124 For 2010/2011. National Planning Commission: Central Bureau of Statistics. Nepal Thematic Report on Food Security and Nutrition 2013. pg. 7. 125 For 2005. I was unable to find more recent data. Rosen, Stacey and Shapouri, Shahla. Global Diet Composition: Factors Behind the Changes and Implications of the New Trends. Food Security Assessment, GFA-19: Economic Research Service: USDA. 2007. pg. 31. 126 Based on estimate for 2015. Food and Agriculture Organization. Diet, Nutrition and the Prevention of Chronic Diseases. Chapter 3. Geneva, February 2002. http://www.fao.org/docrep/005/ac911e/ac911e05.htm. Accessed November 3, 2014. 127 National Planning Commission: Central Bureau of Statistics. Nepal Thematic Report on Food Security and Nutrition 2013. pg. 7. 128 Ibid. pg. 7. 129 Ibid. pg. 36.
Figure 14: Percent of Calories Consumed from Various Food Groups
National Planning Commission: Central Bureau of Statistics. Nepal Thematic Report on Food Security and Nutrition 2013. pg. 36.
mountainous regions (because crops produce less and are more susceptible to climate change, and because they are more greatly affected by insufficient roads). 130
Undernourishment
The second pressing consequence of the lack of dietary diversity and the lack of appropriate consumption is high levels of undernourishment in Nepal. About 17% of Nepal’s total population is undernourished and approximately half of all children are stunted and underweight. 131 In South Asia also, 17% of the overall population is undernourished. However, the percentage of stunted and underweight children is slightly lower at about 40%.132 In the LDCs, on the other hand, close to 26% of the population is undernourished, and, while levels of stunting are similar to Nepal, wasting has a much lower prevalence at about 13%.133 The high levels of undernourishment are primarily caused by the limited dietary diversity, food insecurity, health problems, such as diarrhea, infrastructure problems (namely poor sanitation), and inadequate knowledge about healthy consumption. 134 In turn, undernourishment contributes to some of the major health problems within the Nepalese community and lowers the country’s economic performance.135
Climate Change
Climate change is another important variable affecting the agricultural production and consumption (and, in turn, the food security and undernourishment) levels in Nepal. Nepal, with its limited industry, contributes little to global, atmospheric climate change. In example, Nepal’s carbon dioxide emissions have been fairly constant over the past decade at a quite low 0.1 metric tons per capita. LDCs and South Asia, on the other hand, are higher at 0.3 and 1.4 metric tons per capita, respectively.136 Nevertheless, Nepal has experienced its share of environmental degradation. For example, deforestation, resulting primarily from the clearing of forest for agricultural land and the high reliance on wood as fuel source,137 has been steadily decreasing the amount of forest and wooded area in Nepal.138 In recent years, the government has instituted various programs and policies aimed at decreasing the rate of deforestation and encourage reforestation, such as community management programs, which have been successful to some extent.139 Nevertheless, deforestation continues at an annual rate of 1.8%.140 Additionally, the increasing population and decreasing size of land holdings have caused the overuse and degradation of the soil through the raising of both crops and livestock.141 Furthermore, agricultural and industrial runoff, coupled with poor sanitation, has led to serious water contamination.142
Climate change has, to some extent, already had a serious impact on the agriculture and food situations in Nepal, and is likely to have an even greater impact in the future. Research shows that rising carbon dioxide levels and resulting increases in temperature and humidity have actually contributed to increased Nepalese crop yields in recent years. However, research also shows that, in recent history, changes in the weather pattern and concurrent natural disasters (especially flooding and landslides) have caused variations in agricultural production and decreased access to markets (i.e. a landslides makes roads impassable).143 In the future, climate change will most likely have an overall negative impact on food and agriculture in Nepal. Agricultural production, especially, is highly susceptible to climate
P a g e | 15
130 UNICEF. “Nepal: Background.” United Nations: World Food Programme. Nepal Food Security Bulletin Year 2014. Issue 41. Nepal Food Security Monitoring System. www.neksap.org.np. 131 United Nations: Food and Agriculture Organization. Assessment of Food Security and Nutrition Situation in Nepal. UN Complex: Pulchowk, Nepal, June 2010. 132 For 2012 and 2010. Trading Economics. “Prevalence of undernourishment (% of population) in South Asia.” http://www.tradingeconomics.com/south-asia/prevalence-of-undernourishment-percent-of-population-wb-data.html. Accessed November 4, 2014. 133 For 2012 and 2010. Trading Economics. “Prevalence of undernourishment (% of population) in Least developed countries UN classification.” http://www.tradingeconomics.com/least-developed-countries-un-classification/prevalence-of-undernourishment-percent-of-population-wb-data.html. Accessed November 4, 2014. 134 IRIN. “Analysis: Five reasons malnutrition still kills in Nepal.” Kathmandu, December 14, 2012. http://www.irinnews.org/report/97046/analysis-five-reasons-malnutrition-still-kills-in-nepal. Accessed, November 2, 2014. 135 Atwood, Tom. “Malnutrition is severe in Nepal: Indicating continued poverty and backwardness for decades to come.” The Himalayan Universe. August 9, 2007. http://thehimalayanuniverse.blogspot.com/2007/08/malnutrition-is-severe-in-nepal.html. Accessed November 2, 2014. 136 For 2010. World Bank. “Data: CO2 emissions (metric tons per capita).” http://data.worldbank.org/indicator/EN.ATM.CO2E.PC/countries/NP-8S-XL?display=graph. Accessed October 31, 2014. 137 Central Intelligence Agency. “World Factbook: Nepal.” 138 Food and Agriculture Organization of the United Nations. “Countries: Nepal.” http://www.fao.org/countryprofiles/index/en/?iso3=NPL. Accessed October 28, 2014. 139 United Nations: Food and Agriculture Organization. Assessment of Food Security and Nutrition Situation in Nepal. 140 Ibid. 141 Ibid. 142 Central Intelligence Agency. “World Factbook: Nepal.” 143 National Planning Commission: Central Bureau of Statistics. Nepal Thematic Report on Food Security and Nutrition 2013. pg. 79.
changes, because of the high reliance on rain fed irrigation.144 Production will also be affected by soil erosion and soil exhaustion. Finally, climate change is likely to increase pests, diseases, use of pesticides, and food prices (lower production means more imports and fewer exports). 145
Current Trajectory
Without government intervention, it is not likely that food production or food security will improve. Regarding production, with potential agricultural land nearly exhausted,146 it is likely that commercial farmers will increase usage of high-yield/high-resistance seeds, but the increased production from such use may be counterbalanced by lower production resulting from land fragmentation, soil degradation, and increasing natural disasters. Food security, on the other hand, is definitively not liable to improve. The small gains in production that may occur without intervention will be offset by the increasing population. Additionally, if patterns follow their current trajectory, food prices will continue to rise, leading to even higher rates of food insecurity.
In general, increased demand without corresponding increased production, will result in higher levels of imports. Fuel imports will also increase. As efforts to sustainably manage forest increase, the amount of wood available for fuel will decrease. Coupled with Nepal’s death of other fuel sources, this will lead to higher demand for fuel imports.
Interventions Fortunately, there are several interventions that can significantly improve the future of Nepal’s food production, food security, and import demand. Nepal has the resource potential to decrease fuel imports though domestic production of biofuels, and simply needs investment to make this potential a reality.147 More importantly, however, high-yield/high-resistance seeds could be easily obtained and distributed in the country. If the government implemented a program to make these seeds more available and to make farmers aware of the benefits of such seeds, agricultural yield, and, consequently, production, could increase significantly. In addition, as mentioned previously, the government must invest in infrastructure. If the government can increase the amount of roads and irrigated land, in addition to increasing yield, then, even with inevitable population increases, agricultural production and food security will increase. For example, over the next fifteen years, if agricultural yield increases by 30% and irrigated land and roads increase by 20%, by 2050 agricultural production will be higher by five million metric tons; food stocks will be higher by one million metric tons; GDP will increase by over ten billion and GDP per capita will increase by almost four hundred; agricultural imports will halve, while exports increase slightly; the percent of the population undernourished will fall to 8% rather than 12%; and the percent of the population living below $1.25 a day will fall to 3% rather than 4%.
P a g e | 16 Figure 15: Agricultural Production, Food Stocks, GDP, and GDP per capita Forecasts
144 Ibid. pg. 62. 145 Malla, G. “Climate Change and Its Impact on Nepalese Agriculture.” The Journal of Agriculture and Environment, Vol.9, June 2008. 146 United Nations: World Food Programme. Executive Brief: Nepal Comprehensive Food Security and Vulnerability Analysis. 147 Shrestha, Bharat. “Production possibility of Biofuel in Nepal.” Canada Foundation for Nepal. October 3, 2011. http://cffn.ca/2011/10/production-possibility-of-biofuel-in-nepal/. Accessed November 3, 2014.
Agricultural Yield Multiplier (ylm)
• Gradual increase to 1.3 over 15 years
Agricultural Demand Multiplier (Total) (agdemm) • Gradual increase to 1.1 over 15 years
Irrigation, Multiplier on Land Area Equipped for Irrigation (landirareaequipm)
• Gradual increase to 1.2 over 15 years
Road Network Density Multiplier, Roads per Land Area (infraroadm)
• Gradual increase to 1.2 over 15 years
Parameter Changes

Year 2010 2020 2030 2040 2050 Agricultural Production Before Intervention Million Metric Tons 15.82 17.51 18.47 18.41 19.52
Agricultural Production After Intervention Million Metric Tons 15.82 19.43 23.64 23.84 25.24
Agricultural Production per capita Before Intervention 0.589 0.57 0.535 0.497 0.498
Agricultural Production per capita After Intervention 0.589 0.632 0.685 0.644 0.645
Food Stocks Before Intervention Million Metric Tons 3.86 4.044 3.848 5.969 3.696
Food Stocks After Intervention Million Metric Tons 3.86 4.943 5.454 7.218 4.506
GDP PPP Before Intervention Billion (in 2011 dollars) 53.67 72.97 98.31 143.2 239.4
GDP PPP After Intervention Billion (in 2011 dollars) 53.67 74.64 104.6 153.6 250.1
GDP per capita PPP Before Intervention Thousand (in 2011 dollars) 1.999 2.375 2.848 3.863 6.112
GDP per capita PPP After Intervention Thousand (in 2011 dollars) 1.999 2.43 3.033 4.148 6.394
International Futures (IFs). Version 7.07.
Figures 16 & 17: Agriculture Imports & Exports, Undernourished Population, and Population Below $1.25/day Forecasts
International Futures (IFs). Version 7.07.
The Future of Nepal
It is, ultimately, the responsibility of the people and the government of Nepal to decide what actions to take regarding Nepal’s development. Nevertheless, in order to ensure desirable outcomes, it will be necessary to make informed decisions. The interventions in the previous sections give some examples of isolated actions that could be beneficial to Nepal’s development. However, development policies and practices must be more comprehensive, and, thus, must be informed by more inclusive forecasts. For this reason, several inclusive scenarios and their resulting outcomes are presented below.
Scenario 1 This scenario is a base case scenario. It does not incorporate any changes or interventions, and represents likely future dynamics if Nepal follows its current trajectory.
Scenario 2 This scenario represents a comprehensive set of actions that can be taken that will likely improve Nepal’s development. First, the government of Nepal can shift its spending to focus more on health, education, and
0
0.5
1.0
1.5
2.0
2.5
3.0
Agricultural Imports and Exports
Milli
on M
etric
Ton
s
Year2010 2015 2020 2025 2030 2035 2040 2045 2050
Imports After Intervention Imports Before Intervention
Exports After Intervention Exports Before Intervention
5
10
15
20
25Percent of Population Undernourished and Below Poverty Line ($1.25/day)
Year2010 2015 2020 2025 2030 2035 2040 2045 2050
Undernourished Population After Intervention Undernourished Population Before Intervention
Population Below Poverty Line After Intervention Population Below Poverty Line Before Intervention

infrastructure, and expend less on military and research and development. It is important to note that, if the government decreases military spending, it will be vital that a concerted effort be made to incorporate the concerns of the country’s dissident group into government decisions. This will help ensure internal security, and make the decrease in military spending less of a risk. It addition, it should be understood that research and development should not be permanently set aside. Rather the government should focus on building the foundational aspects of the society, such as education and infrastructure. Then, in the future, when development has progressed and the economy and society are more advanced, the government should shift to a greater focus on research and development.
Second, the government should implement policies to improve their business environment and make Nepal more appealing to foreign direct investment. If investment increases, it will probably result in more revenue and more jobs. Both of which Nepal will need in the future. It could also help increase infrastructure development and hydroelectric energy production.148
Third, efforts to increase agricultural yield will be essential. Programs should be created to ensure most farmers have access to improved resources, namely improved seeds, so that overall yield will increase. Even a small investment should allow for enough increased production to ensure food security for a growing population and to increase exports while decreasing imports, leading to a smaller trade deficit.
Fourth, the government should increase expenditures on education, health, and infrastructure, especially roads and hydroelectric plants. It should be noted that, in addition to increased expenditure, cost in these areas will naturally increase. As the population increases, health and education costs increase, and as infrastructure increases, maintenance costs increase. Nevertheless, increased investment in these areas should appreciably advance quality of life and economic productivity; two of the most important aspects of development. Moreover, decreases in military and research and development expenditures should help cover
148 Some foreign investors may find it worthwhile to invest in building roads in order to ensure profits from production.
Base Case • Follows current trajectory without changes or intervention
Agricultural Demand Multiplier (Total) (agdemm)
• Gradual increase to 1.1 over 15 years Agricultural Yield Multiplier (ylm)
• Starting in 2018, gradual increase to 1.3 over 10 years Energy Demand Multiplier (Total) (endemm)
• Starting in 2018, gradual increase to 1.2 over 15 years Energy Production Multiplier, Hydroelectric (enpm)
• Starting in 2020, gradual increase to 3 over 15 years Foreign Direct Investment Multiplier, Stocks of Investment from Abroad (xfdistockm)
• Starting in 2018, increase to 1.5 over 2 years, then increase to 1.2 over 10 years
Government Education Expenditure (gdsm) • Gradual increase to 1.2 over 15 years
Government Health Expenditure (gdsm) • Gradual increase to 1.2 over 15 years
Government Infrastructure Expenditure (gdsm) • Gradual increase to 1.3 over 15 years
Government Military Expenditure (gdsm) • Gradual decrease to 0.5 over 5 years
Government R&D Expenditure (gdsm) • Gradual decrease to 0.8 over 5 years
Mortality Multiplier (hlmortm) • Gradual decrease to 0.8 over 30 years
Road Network Density Multiplier, Roads per Land Area (infraroadm) • Starting in 2016, gradual increase to 1.3 over 15 years
Total Fertility Rate Multiplier (tfrm) • Gradual decrease to 0.8 over 15 years
Same as Scenario 2 Except: Government Health Expenditure (gdsm)
• Gradual increase to 1.4 over 15 years Government Education Expenditure (gdsm)
• Gradual increase to 1.4 over 15 years Same as Scenario 2 Except: Agricultural Yield Multiplier (ylm)
• Gradual decrease to 0.9 over 10 years Foreign Aid Receipts as Percent of GDP (aidrec)
• Gradual two percent decrease over 10 years Government Education Expenditure (gdsm)
• Gradual decrease to 0.9 over 10 years Government Health Expenditure (gdsm)
• Gradual decrease to 0.9 over 10 years Government Infrastructure Expenditure (gdsm)
• Gradual increase to 1.1 over 10 years Road Network Density Multiplier, Roads per Land Area (infraroadm)
• Gradual increase to 1.1 over 10 years
Scenario 2: Parameter Changes
Scenario 1
Scenario 3: Parameter Changes
Scenario 4: Parameter Changes

8
10
12
14
16
18
Undernourished Population
Pe
rce
nt
of
Po
pu
latio
n
Year2010 2015 2020 2025 2030 2035 2040 2045 2050
Scenario 1 Scenario 2 Scenario 3 Scenario 4
P a g e | 18
the initial spending increases in these sectors, but, over time, if foreign direct investment increases and total productivity increases, there should be a resulting increase in revenue that can also help cover these expenditures.
Finally, it will be indispensable for the government to focus on internal governance issues. Corruption must be addressed and eradicated to every possible extent. A constitution needs to be finalized, political and civil rights must be ensured, and political rifts have to be resolved.
Scenario 3
This scenario considers the same elements of scenario 2, but represents higher levels of government expenditure on health and education.
Scenario 4
This final scenario represents a not unlikely possibility that the government of Nepal needs to consider, and, to whatever extent possible, prepare contingencies for in case of its occurrence. This scenario, then, incorporates all the aspects of scenario 2, but concentrates on the possibility that foreign aid, which accounts for over a quarter of the country’s GDP, will decrease. The scenario considers a mild decrease of two percentage points, but, in reality, this could be more severe, especially if another global recession were to occur. Likely resulting decreases in government spending on health and education are considered, as well as possible agricultural yield decreases due to land fragmentation and environmental degradation. Infrastructure spending, and namely road production, does not decrease, but rather increases more slowly. This is because foreign direct investment in the country will not necessarily be affected by decreases in foreign aid.
Population and Health As aforementioned, Nepal’s population will inevitably increase for approximately 60 years.149 If nothing is done, the population will increase by about 13 million people by 2050. However, increased information and opportunity can influence a decrease in the total fertility rate, which can decrease the population growth from 13 million to 11 million. The outcomes show that none of the elements comprising scenarios 2, 3, and 4 have a significant impact on the size of the population except total fertility rate.150 Given this information, the government should continue to spread information and access to contraceptives, as well as increasing educational and economic opportunities, but it is not particularly necessary for the government to increase expenditures in this area.
Regarding health, however, the different scenarios show notable benefits with increased investment. Scenario 2, with increased health expenditure and agricultural production, shows undernourishment almost halving from the base case, scenario 1. Interestingly, however, it seems higher rates of spending on health have diminishing returns, and scenario 3, with doubled health expenditure, only shows a slightly lower percent of undernourishment than the percent from scenario 2. Also surprising, scenario 4, with decreased spending on health and decreased agricultural yield, has only a slightly higher percent of undernourishment than scenario 2. This may result from the fact that even slight improvements in infrastructure and roads allow for better access to markets, and, thus, better access to food.
Totals DALYs show similar outcomes, though all differences are slight. The higher levels of increased health spending from scenario 3, show the most significant decrease in DALYs, with the lower levels of spending in scenario 2 showing smaller decreases, and scenario 4, with decreased levels of spending, showing only a slight decrease. The lack of significant change in DALYs can be explained by remembering that though mortality and communicable diseases are decreasing, non-communicable diseases are increasing.
149 Ifs 150 Based on receiving the same results in these scenarios as in the earlier scenario when only total fertility rate was changed.
Figure 18: Undernourished Population Forecast
International Futures (IFs). Version 7.07.

4.0
4.5
5.0
5.5
6.0
6.5
7.0
7.5
8.0
Average Education Years for Age 25 and Above
Ye
ars
Co
mp
lete
d
Year2010 2020 2030 2040 2050
Scenario 1 Scenario 2 Scenario 3 Scenario 4
P a g e | 19
Finally, all scenarios show an increase in the percent of the population with access to improved sanitation to 100% by 2050. Investment to ensure this increase will still be necessary, but may require less input than efforts to decrease undernourishment and increase access to health care.
Figure 19: Population & Health Indicators Forecasts Year 2010 2020 2030 2040 2050 Population, Scenario 1 Millions 26.85 30.72 34.51 37.07 39.17
Population, Scenario 2 Millions 26.85 30.6 33.66 36.08 37.88
Population, Scenario 3 Millions 26.85 30.6 33.66 36.08 37.89
Population, Scenario 4 Millions 26.85 30.6 33.67 36.06 37.84
Undernourished Population, Scenario 1 Percent 18 16.92 16.47 15.47 12.46
Undernourished Population, Scenario 2 Percent 18 15.09 11.74 10.56 7.608
Undernourished Population, Scenario 3 Percent 18 15.09 11.74 10.56 7.602
Undernourished Population, Scenario 4 Percent 18 15.25 12.3 11.2 7.996
Total DALYs, Scenario 1 Million Years 12.69 13.02 12.44 12.18 12.52
Total DALYs, Scenario 2 Million Years 12.69 12.6 11.77 11.68 12.02
Total DALYs, Scenario 3 Million Years 12.69 12.59 11.73 11.58 11.94
Total DALYs, Scenario 4 Million Years 12.69 12.68 11.97 11.97 12.23
Population with Access to Improved Sanitation, Scenario 1 Percent 34.08 43.09 59.17 95.87 100
Population with Access to Improved Sanitation, Scenario 2 Percent 34.08 44.25 72.69 99.69 100
Population with Access to Improved Sanitation, Scenario 3 Percent 34.08 43.54 60.36 99.16 100
Population with Access to Improved Sanitation, Scenario 4 Percent 34.08 44.79 80.52 99.35 100 International Futures (IFs). Version 7.07.
Education Recalling the positive recent changes in educational attainment in Nepal, it is not surprising that, even in the base case, scenario 1, educational attainment rates will be much improved by 2050. The scenario outcomes indicate that primary and secondary gross enrollment rates, in addition to the literacy rate, will level out around 100 percent by 2050 regardless of expenditure patterns. Tertiary gross enrollment, however, indicates that higher rates of expenditure for this level result in higher enrollment rates. Indeed, the results show a definitive relationship between educational expenditure and tertiary enrollment, with the double expenditure of scenario 3 resulting in the highest enrollment, then scenario 2, 4, and 1, respectively. Nevertheless, even at high levels of spending, by 2050 the tertiary enrollment rate is still quite low at 39%. Given these patterns, it may be most beneficial for the government to focus a larger portion of its educational expenditure on ensuring access to and ability to attend tertiary school.
Figure 20: Average Education Years, Age 25+ Forecast
International Futures (IFs). Version 7.07.

5
10
15
20
25Population with Income Below $1.25 a day
Pe
rce
nt
of
Po
pu
latio
n
Year2010 2020 2030 2040 2050
Scenario 1 Scenario 2 Scenario 3 Scenario 4
P a g e | 20 Figure 21: Education Indicators Forecasts
Economy and Production Nepal’s economy and productivity rely on all of the elements in the scenarios. The results show that scenario 2, which incorporates positive changes in both social and economic factors, has the most significant impact on the economy and on production levels.151 The doubled health and education expenditures in scenario 3 produce nearly the same results as scenario 2, while, despite moderate increases in infrastructure and the increased foreign direct investment, scenario 4 shows much smaller gains. If the government is able to implement the suggested changes in scenario 2, by 2050 Nepal’s GPD will be larger by 16 billion dollars than if it doesn’t not make any changes. GDP per capita, poverty levels, and export levels will also see significant improvement. It is important to note, however, that if foreign aid decreases, and,
151 Multifactor productivity does not show the same pattern as the other variables. I have been unable to determine the reason for this, but it may be because IFs registers the decreases in spending on health and education as increasing the money supply for investment in industrial sectors of the economy.
Year 2010 2020 2030 2040 2050 Primary Gross Enrollment Rate, Scenario 1 Percent 115.1 127.5 118.5 110.2 102.1
Primary Gross Enrollment Rate, Scenario 2 Percent 115.1 128.1 121.4 109.5 101.6
Primary Gross Enrollment Rate, Scenario 3 Percent 115.1 130.7 121.8 108.1 101.2
Primary Gross Enrollment Rate, Scenario 4 Percent 115.1 124.8 120 111.7 102.1
Secondary Gross Enrollment Rate, Scenario 1 Percent 43.6 56.24 74.89 85.01 98.06
Secondary Gross Enrollment Rate, Scenario 2 Percent 43.6 56.9 77.15 96.1 101.2
Secondary Gross Enrollment Rate, Scenario 3 Percent 43.6 59.33 85.78 96.29 102.3
Secondary Gross Enrollment Rate, Scenario 4 Percent 43.6 54.63 67.39 92.1 99.73
Tertiary Gross Enrollment Rate, Scenario 1 Percent 7.109 10.36 14.07 19.75 29.26
Tertiary Gross Enrollment Rate, Scenario 2 Percent 7.109 10.49 15.16 24.98 35.84
Tertiary Gross Enrollment Rate, Scenario 3 Percent 7.109 10.79 16.85 27.15 39.4
Tertiary Gross Enrollment Rate, Scenario 4 Percent 7.109 10.06 13.35 20.85 31.26
Average Education Years at Age 25, Scenario 1 Years 3.873 4.517 5.425 6.411 7.604
Average Education Years at Age 25, Scenario 2 Years 3.873 4.519 5.444 6.542 7.917
Average Education Years at Age 25, Scenario 3 Years 3.873 4.519 5.511 6.757 8.185
Average Education Years at Age 25, Scenario 4 Years 3.873 4.519 5.378 6.309 7.549
Literacy Rate, Scenario 1 Percent 57.37 67.02 83.25 92.12 96.44
Literacy Rate, Scenario 2 Percent 57.37 67.04 83.3 92.09 96.31
Literacy Rate, Scenario 3 Percent 57.37 67.07 83.41 92.13 96.32
Literacy Rate, Scenario 4 Percent 57.37 67.02 83.09 91.91 96.2 International Futures (IFs). Version 7.07.
Figure 22: Population Living Below $1.25/day Forecast
International Futures (IFs). Version 7.07.

0
10
20
30
40
50
60
70
Total Exports and Imports
Billi
on D
olla
rs
Year2010 2020 2030 2040 2050
Total Exports, Scenario 1 Total Exports, Scenario 2 Total Exports, Scenario 3 Total Exports, Scenario 4
Total Imports, Scenario 1 Total Imports, Scenario 2 Total Imports, Scenario 3 Total Imports, Scenario 4
P a g e | 21 correspondingly, health and education expenditures decreases, as in scenario 4, poverty levels will not noticeably improve and GDP will be 18 billion less than if the conditions in scenario 2 occur. In addition, gains in exports and decreases in imports will be considerably less significant. Figure 23: Economic Indicators Forecasts Year 2010 2020 2030 2040 2050 GDP PPP, Scenario 1 Billion (in 2011 dollars) 53.67 72.97 98.31 143.2 239.4 GDP PPP, Scenario 2 Billion (in 2011 dollars) 53.67 73.63 104 157.7 265.4 GDP PPP, Scenario 3 Billion (in 2011 dollars) 53.67 73.65 104.1 157.6 265.7 GDP PPP, Scenario 4 Billion (in 2011 dollars) 53.67 71.88 95.61 141.9 247.7 GDP per capita PPP, Scenario 1 Thousand (in 2011 dollars) 1.999 2.375 2.848 3.863 6.112 GDP per capita PPP, Scenario 2 Thousand (in 2011 dollars) 1.999 2.406 3.089 4.37 7.006 GDP per capita PPP, Scenario 3 Thousand (in 2011 dollars) 1.999 2.407 3.092 4.367 7.013 GDP per capita PPP, Scenario 4 Thousand (in 2011 dollars) 1.999 2.349 2.84 3.936 6.546 Population with Income Below $1.25 a Day, Scenario 1 Percent 24.82 20.17 16.52 10.54 4.78 Population with Income Below $1.25 a Day, Scenario 2 Percent 24.82 19.33 13.8 7.801 2.997 Population with Income Below $1.25 a Day, Scenario 3 Percent 24.82 19.32 13.71 7.747 2.963 Population with Income Below $1.25 a Day, Scenario 4 Percent 24.82 20.02 17.11 12.55 4.731 International Futures (IFs). Version 7.07.
Finally, if the social and
economic interventions of scenario 2 are undertaken, productivity will improve as evidenced by higher agricultural production, food stocks, exports, GDP, and GDP per capita. Moreover, hydro-electric energy production will be higher than the base case by 75 million barrels of oil equivalent, and will result in a higher, net positive, level of energy exports.152 As before, lower investment in human capital and lowered levels of foreign aid will result in almost insignificant changes in production and food stocks. However, because infrastructure and foreign direct investment still increase in scenario 4, energy production and exports do increase, but at a slower rate than the increases for scenario 2.
152 No other sources of energy production increased in any of the scenarios.
Figure 24: Total Exports & Imports Forecasts
International Futures (IFs). Version 7.07.

P a g e | 22 Figure 25: Trade & Productivity Indicators Forecasts Year 2010 2020 2030 2040 2050 Total Exports, Scenario 1 Billion (in 2011 dollars) 1.734 3.548 6.939 15.74 27.17
Total Exports, Scenario 2 Billion (in 2011 dollars) 1.734 3.576 7.423 14.86 37.65
Total Exports, Scenario 3 Billion (in 2011 dollars) 1.734 3.578 7.44 14.85 37.68
Total Exports, Scenario 4 Billion (in 2011 dollars) 1.734 3.63 8.306 18.45 35.92
Total Imports, Scenario 1 Billion (in 2011 dollars) 6.231 8.761 12.53 23.75 53.52
Total Imports, Scenario 2 Billion (in 2011 dollars) 6.231 8.832 13.06 27.49 71.13
Total Imports, Scenario 3 Billion (in 2011 dollars) 6.231 8.834 13.08 27.46 71.2
Total Imports, Scenario 4 Billion (in 2011 dollars) 6.231 9.045 12.58 23.44 59.82
Total Multifactor Productivity, Scenario 1 1 1.201 1.481 1.955 2.741
Total Multifactor Productivity, Scenario 2 1 1.201 1.489 2.001 2.883
Total Multifactor Productivity, Scenario 3 1 1.201 1.491 1.997 2.887
Total Multifactor Productivity, Scenario 4 1 1.2 1.501 2.058 3.005
Agricultural Production, Scenario 1 Million Metric Tons 15.82 17.51 18.47 18.41 19.52
Agricultural Production, Scenario 2 Million Metric Tons 15.82 18.56 23.38 23.86 25.21
Agricultural Production, Scenario 3 Million Metric Tons 15.82 18.56 23.38 23.86 25.21
Agricultural Production, Scenario 4 Million Metric Tons 15.82 16.59 16.75 16.66 17.7
Food Stocks, Scenario 1 Million Metric Tons 3.86 4.044 3.848 5.969 3.696
Food Stocks, Scenario 2 Million Metric Tons 3.86 4.443 5.913 7.106 4.558
Food Stocks, Scenario 3 Million Metric Tons 3.86 4.443 5.913 7.106 4.556
Food Stocks, Scenario 4 Million Metric Tons 3.86 3.636 3.666 5.795 3.546 Energy Exports Minus Imports as Percent of GDP, Scenario 1
-2.643 -2.17 -0.105 3.381 2.476
Energy Exports Minus Imports as Percent of GDP, Scenario 2
-2.643 -2.252 -0.715 1.512 6.612
Energy Exports Minus Imports as Percent of GDP, Scenario 3
-2.643 -2.252 -0.719 1.518 6.6
Energy Exports Minus Imports as Percent of GDP, Scenario 4
-2.643 -2.253 -0.387 2.523 4.595
Hydro-electric Energy Production, Scenario 1 Billion Barrels Oil Equivalent 0.008 0.012 0.019 0.026 0.035
Hydro-electric Energy Production, Scenario 2 Billion Barrels Oil Equivalent 0.008 0.012 0.021 0.074 0.11
Hydro-electric Energy Production, Scenario 3 Billion Barrels Oil Equivalent 0.008 0.012 0.021 0.074 0.11
Hydro-electric Energy Production, Scenario 4 Billion Barrels Oil Equivalent 0.008 0.012 0.021 0.074 0.101
International Futures (IFs). Version 7.07.

P a g e | 23 Conclusion
This report has highlighted some of the key developmental challenges that Nepal faces. The most pressing issues are poverty, which, though not specifically addressed in this report, is one of the primary drivers of issues such as food insecurity and low human capital, lack of infrastructure and investment, and low levels of production. Ideally, Nepal’s government and society will work to concurrently address these issues through several avenues; some possibilities for comprehensive approaches have been outlined above. For now, the three most important areas for investment are infrastructure, health, and education. Investment, especially foreign direct investment, can be encouraged though policy changes, and poverty, though it should be a top priority, should hopefully be somewhat alleviated though better opportunities created by education, higher individual productivity caused by better health, and higher GDP per capita resulting from increased economic opportunity.
The government of Nepal should also make every effort to capitalize on its currently high levels of foreign aid. If they are able to channel aid into initial costs for building roads, industrial plants (especially hydro-electricity), health clinics, and schools, then, in the future, even if aid decreases, the increased economic activity should allow them to cover maintenance costs without having to rely on aid. Nepal should also capitalize on the heavy involvement of international organizations, such as the World Bank and IMF, by utilizing their expertise to help shape developmental policies and programs.
There are, of course, aspects of development that have not been considered here that will need to be addressed. However, Nepal’s current situation, given its history and resources, is not as bad as it could be, and, in many respects, is better than other least developed countries on average. The country has shown considerable improvement in many developmental facets, and shows real potential for even more improvement in the future. The interventions suggested in this report are definitively attainable. If sincerely undertaken, Nepal will be well on its way to reaching the peak.
P a g e | 24 Works Cited Atwood, Tom. “Malnutrition is severe in Nepal: Indicating continued poverty and backwardness for decades to come.” The Himalayan Universe. August 9, 2007. Ban, B., Tuladhar, S., Pant, S., and Suvedi, BK. Review of Health and Health Service Improvements in Nepal. JSI Research & Training Institute Inc., Policy, Planning and International Cooperation Division, Ministry of Health and Population, Nepal. JNHRC, Vol. 10, No. 2, Issue 21. May 2012 Basnet, Subarna. Cointegration Analysis of the Impact on Foreign Aid on Gross Domestic Saving: Case Study of Nepal. Tribhuvan University. 2011. pg. 15. BBC News South Asia. “Nepal Profile.” August 14, 2014. http://www.bbc.com/news/world-south-asia-12499391. Bista, Min Bahadur and Carney, Stephen. “Community Schooling in Nepal: A Genealogy of Education Reform since 1990.” Comparative Education Review. Vol. 53, No. 2. May 2009. pp. 189-211. Carney, Stephen. “Negotiating Policy in an Age of Globalization: Exploring Educational “Policyscapes” in Denmark, Nepal, and China.” Comparative Education Review. Vol. 53, No. 1. February 2009. pp. 63-88. Central Bureau of Statistics, Nepal. National Population and Housing Census 2011 (National Report). Volume 01, NPHC 2011. Kathmandu, Nepal. November 2012. Central Intelligence Agency. “World Factbook: Nepal.” https://www.cia.gov/library/publications/the-world-factbook/geos/np.html. Encyclopedia of the Nations. “Nepal-Industry.” http://www.nationsencyclopedia.com/economies/Asia-and-the-Pacific/Nepal-INDUSTRY.html. Freedom House. “Freedom in the World: Aggregate and Subcategory Scores.” http://www.freedomhouse.org/report/freedom-world-aggregate-and-subcategory-scores. Food and Agriculture Organization. Diet, Nutrition and the Prevention of Chronic Diseases. Chapter 3. Geneva, February 2002. Food and Agriculture Organization. “World Agriculture: Towards 2015/2030 – An FAO Perspective.” http://www.fao.org/docrep/005/y4252e/y4252e11.htm. Forbes. “World's Top Saving Countries, 2013.” http://www.forbes.com/pictures/fflf45kll/no-16-nepal/. Ghimire, Dirgha J., and Axinn, William G. “Family Change in Nepal: Evidence from Western Chitwan.” Contributions to Nepalese Studies. Vol. 33, Number 2. July 2006. pp. 177-201. Global Democracy Ranking. “Democracy Ranking 2013.” http://democracyranking.org/wordpress/?page_id=738#prettyPhoto. Government of Nepal. Source Book: Foreign Aid in Nepal. Ministry of Finance: Foreign Aid Coordination Division. Kathmandu, Nepal. http://mof.gov.np/en/content/mof-link-pages-7.html. Government of Nepal. Foreign Aid in Nepal (FY 2010/2011). Ministry of Finance: Foreign Aid Coordination Division. Singhadurbar, Kathmandu. www.mof.gov.np. The Heritage Foundation. “2014 Index of Economic Freedom: Nepal.” 2014. http://www.heritage.org/index/country/nepal. “History of Nepal.” Thamel.com. http://www.thamel.com/htms/history.htm. Index Mundi. “Facts about Nepal.” http://www.indexmundi.com/facts/nepal#Health-Population. International Futures (IFs). Version 7.07. IRIN. “Analysis: Five reasons malnutrition still kills in Nepal.” Kathmandu, December 14, 2012. http://www.irinnews.org/report/97046/analysis-five-reasons-malnutrition-still-kills-in-nepal. Accessed, November 2, 2014. Knoema. “World Data Atlas: Nepal - Balance of Payments » Current accounts - Net trade in goods and services (BoP, current US$).” http://knoema.com/atlas/Nepal/topics/Economy/Balance-of-Payments-Current-accounts/Net-trade-in-goods-and-services-BoP-current-USdollar. Koirala, Kosh Raj. “Slowing Population Growth Sparks Optimism in Nepal.” Khabar South Asia. January 18, 2013. http://khabarsouthasia.com/en_GB/articles/apwi/articles/features/2013/01/18/feature-01.

Macro International Inc. Trends in Demographic and Reproductive Health Indicators in Nepal. 2007. Calverton, Maryland, USA: Macro International Inc. Malla, G. “Climate Change and Its Impact on Nepalese Agriculture.” The Journal of Agriculture and Environment, Vol.9, June 2008. Ministry of Health and Population (MOHP) [Nepal], New ERA, and ICF International Inc. Nepal Demographic and Health Survey 2011. Kathmandu, Nepal: Ministry of Health and Population, New ERA, and ICF International, Calverton, Maryland. 2012. Minority Rights Group International. State of the World's Minorities and Indigenous Peoples 2013 – Nepal. September 24, 2013. http://www.refworld.org/docid/526fb73ab.html. National Planning Commission: Central Bureau of Statistics. Nepal Thematic Report on Food Security and Nutrition 2013. Nepal Health and Research Council. Prevalence of Non-Communicable Disease in Nepal Hospital Based Study. Kathmandu, Nepal. December 2010. Pariyar, Dinesh. “Country Pasture/Forage Resource Profiles: Nepal.” Food and Agriculture Organization. http://www.fao.org/ag/AGP/AGPC/doc/Counprof/Nepal/nepal.htm. Accessed November 3, 2014. Rosen, Stacey and Shapouri, Shahla. Global Diet Composition: Factors Behind the Changes and Implications of the New Trends. Food Security Assessment, GFA-19: Economic Research Service: USDA. 2007. Sanothimi, Bhaktapur. School Level Educational Statistics of Nepal: 2011. Government of Nepal: Department of Education. June 2012. www.doe.gov.np. Savada, Andrea Matles, ed. “A Country Study: Nepal.” Federal Research Division, Library of Congress. Call Number DS491.4 .N46 1993. 1993. http://lcweb2.loc.gov/frd/cs/nptoc.html. Shrestha, Bharat. “Production possibility of Biofuel in Nepal.” Canada Foundation for Nepal. October 3, 2011. http://cffn.ca/2011/10/production-possibility-of-biofuel-in-nepal/. Accessed November 3, 2014. Trading Economics. “Nepal: Economic Indicators.” 2014. http://www.tradingeconomics.com/nepal/indicators. Transparency International 2013 score of 31 (0=most corrupt), rank 116 of 175. Transparency International. “Corruption Perceptions Index 2013.” http://www.transparency.org/cpi2013/results#myAnchor1. UNICEF. “Nepal: Background.” February 2003. http://www.unicef.org/infobycountry/nepal_nepal_background.html. United Nations: Food and Agriculture Organization. Assessment of Food Security and Nutrition Situation in Nepal. UN Complex: Pulchowk, Nepal, June 2010. United Nations Development Program. “Human Development Reports.” 2013. http://hdr.undp.org/en/content/table-1-human-development-index-and-its-components. United Nations. Statistical Yearbook for Asia and the Pacific 2013. Economic and Social Commission for Asia and the Pacific. 2013. pg. 7. http://www.unescap.org/resources/statistical-yearbook-asia-and-pacific-2013. United Nations: World Food Programme. Executive Brief: Nepal Comprehensive Food Security and Vulnerability Analysis. February 2007. http://www.wfp.org. United Nations. World Population Ageing 2013. Department of Economic and Social Affairs Population Division. New York. 2013. United Nations: World Food Programme. Nepal Food Security Bulletin Year 2014. Issue 41. Nepal Food Security Monitoring System. www.neksap.org.np. UNESCO Institute for Statistics. Building Human Capacities in Least Developed Countries to Promote Poverty Eradication and Sustainable Development. Paris, France. 2011. pg. 22. http://portal.unesco.org/en/ev.php-URL_ID=37082&URL_DO=DO_TOPIC&URL_SECTION=201.html. UNESCO Institute for Statistics. Fact Sheet: Out-of-School Children. No. 12. June 2011. The World Bank. “Nepal Data.” http://data.worldbank.org/indicator/SE.XPD.TOTL.GD.ZS/countries/NP-8S-XM?display=graph. World Health Organization. “Nepal: Health Profile.” Global Health Observatory: Country Statistics. 2013. http://www.who.int/gho/countries/npl/country_profiles/en/.

World Health Organization - Noncommunicable Diseases (NCD): Country Profiles. Global Health Observatory: Country Statistics. 2014. http://www.who.int/gho/countries/npl/country_profiles/en/. World Health Organization Regional Offices for South-East Asia and the Western Pacific. Health in Asia and the Pacific. Chapter 6. 2008. http://www.wpro.who.int/publications/Health_in_Asia_and_the_Pacific/en/.