reactions of 2, 3-dibromonaphthalene-1, 4-dione and
TRANSCRIPT

Eng. Sci., 2021, 14, 78–93
78 | Eng. Sci., 2021, 14, 78-93 © Engineered Science Publisher LLC 2021
1 Department of Chemistry, Savitribai Phule Pune University, Pune
411007, Maharashtra State, India. 2 Central Instrumentation Facility, Savitribai Phule Pune
University, Pune 411007, Maharashtra State, India. 3 Centre for material Characterization, National Chemical
Laboratory, Pashan Road, Maharashtra State, Pune 411008, India.
*Email: [email protected] (S. Salunke-Gawali)
Engineered Science
DOI: https://dx.doi.org/10.30919/es8d427
Reactions of 2, 3-Dibromonaphthalene-1, 4-Dione and Pyridyl Amines: X-ray Structures, DFT Investigations, and Selective Detection of the Hg2+ and Ni2+ Ions
Gunjan Aggrwal,1 Sunita Salunke-Gawali,1,* Shridhar P. Gejji,1 Milind Nikalje,1 Debamitra Chakravarty,2 Prakash L. Verma,1
Prajkta Gosavi-Mirkute,1 Shital Harihar,1 Mahesh Jadhav1 and Vedavati G. Puranik3
Abstract
In this work, the products formed by the reaction between 2,3-dibromonaphthalene-1,4-dione with (pyridine-2-yl)methanamine and (pyridine-4-yl)methanamine are discussed in detial. The products 2-amino-3-bromonaphthalene-1,4-dione (A) and 2-aminonaphthalene-1,4-dione (B(1)) obtained are characterized through 1H and 13C-NMR, FTIR, mass spectrometry, single-crystal X-ray diffraction experiments, which are in conjunction with wB97X based density functional theory. Compound A can effectively and selectively detect Hg2+ and Ni2+ ions, and proposes a potential mechanism of action.
Keywords: Naphthoquinone; Unusual reactions; Aminonaphthoquinone; DFT; Hg2+ sensor.
Received: 4 January 2021; Accepted: 18 February 2021. Article type: Research article.
1.Introduction
Currently, there has been considerable interest in molecule
and ion recognition based on supramolecular chemistry.
Fluorescent and colorimetric chemosensors for various
analytes have been developed for physiology and medical
diagnostics, particularly for heavy metal cations.[1-3] Among
them, mercury being highly toxic[4] is considered to be most
dangerous for human health and the environment as it can
accumulate in the human body[5,6] and poses a risk for a wide
variety of diseases even in minute concentrations. Mercury
pollution arises through various natural activities, such as
oceanic and volcanic emissions,[7,8] solid waste incineration,
thermometer manufacturing, and human activities, as
mercury and its derivatives are widely used in the industry.
Hg2+ is an extremely toxic divalent metal ion and can affect
many vital organs of the human body.[9] Methylmercury can
be formed naturally by biomethylation of mercuric ion in the
aquatic environment and is bioaccumulated in the human
body through biological food chains, causing serious damage
to the brain and central nervous systems.[10-13] After
absorption, Hg2+ ions would be distributed to all biological
membranes in humans and animals. It is extremely toxic
because of the high affinity of mercury for thiol groups in
proteins and enzymes, which leads to the dysfunction of cells
and consequently results in health problems. Due to the
extremely hazardous nature of mercury, numerous analytical
methods have been employed to serve the purpose, such as
atomic fluorescence spectrometry,[14] cold vapor atomic
absorption spectrometry,[15] neutron activation analysis,[16]
inductively coupled plasma mass spectrometry,[17] anodic
stripping voltammetry,[18] etc., but all involve complex
instrumentation and are time-consuming. Therefore, it
becomes highly demanding to have efficient, easy-to-use
chemical sensors for real-time mercury detection in
environmental analyses and industrial wastewater treatments.
Various colorimetric[19-21] and fluorimetric sensors[22,23] have
been designed to detect the presence of the hazardous
element for its elimination from the environment.
Schiff'sbases,[24] benzothiazoles,[25] thiosemicarbazide,[26]

Engineered Science Research article
© Engineered Science Publisher LLC 2021 Eng. Sci., 2021, 14, 78-93 | 79
lawsone,[27] anthraquinone[28] moiety and others[29] were used
to develop efficient mercury sensors in solution. Many
fluorescent sensors have been reported to detect mercury in
an aqueous solution[30,31] at low concentrations.[32] Direct
mercury detection is possible with carbon nanodots[33] and
self-assembled zinc oxide nanoparticles[34] based on the
mechanism of supramolecular self-assembly[35] with low
detection limits.
Scientists have applied many photophysical concepts
such as photo-induced electron transfer (PET),[36] resonance
energy transfer[37] to enhance the efficiency of chemosensors
and break the limitations.[38] Multi fluorophores systems[39]
are developed by combining two or more fluorophores with
different photophysical properties such as rhodamine and
naphthoquinone derivatives[40] based on an
energy-donor-acceptor structural design following the
excitation energy transfer (ET) mechanism. When
electronically connected with recognition sites, quinone
derivatives are electron acceptors that have provided suitable
receptors for the colorimetric sensing of various analytes.
The optical characteristics[41] of the simpler quinone
derivatives change on chemical transformation, and therefore
they are widely used in analytical chemistry. Its absorption
and fluorescence emission spectra lie within the UV
(Ultraviolet) and visible regions. The various photophysical
properties can be easily fine-tuned through judicious
structural designs with steric and electronic features
complementary to the target analytes.[42-43]
The amino group's introduction creates π – π*
donor-acceptor chromophores, which absorb more intensely
in the 450–500 nm region of the visible spectrum and are
thus orange to red. The reaction of
2,3-dibromonaphthalene-1,4-dione with primary amines
results in the formation of monosubstituted
aminonaphthoquinones,[44-47] which are reported to detect
various transition metal ions[48,49] as well as heavy metal
ions[50] with ease.
Quinones are attracted more attention due to their
numerous biological activity. Among all kinds of quinone,
2-aminonaphthoquinone moiety is an integral part of
antibiotic drugs or naturally occurring quinone compounds[51]
synthesized by nature under ambient conditions.[52,53] Severe
conditions are necessary for their synthesis on the laboratory
scale,[54] with their formation usually facilitated via several
intermediates wherein the 1,4-naphthoquinone moiety serves
as electrophile.[55] The reactions involving
1,4-naphthoquinones as the substrate may lead to the
formation of unexpected products; few reactions are enlisted
as Diels-Alder cycloaddition reaction of bis-xanthene[56]to
1,4-naphthoquinone, regioselectivity in dimerization during
the synthesis of pyronaphthoquinones, ventiloquinone L[57] in
the presence of cerium ammonium nitrate,[58] reactions
between 5,7-dihydroxynaphthoquinone and nucleophiles[59]
aryl-aryl coupling[60] in 6-bromo-1,2-naphthoquinone
reactions, are some examples of unexpected reactions. On
parallel lines, a remarkable regio- and -enantioselective
photodimerization of naphthols in the presence of
ruthenium/palladium heterometallic coordination cage via
1,4-coupling led to bi-1,2-naphthoquinone[61] as the product.
Likewise, the reaction between vitamin K3 and
o-phenylenediamine follows regioselective Michael addition
yielding dihydrophenazine.[62]
In the present work, we investigate products resulting
from the reactions of 2,3-dibromonaphthalene-1,4-dione and
naphthalene-1,4-dione with pyridyl amines. The expected
product in the reaction of 2,3-dibromonaphthalene-1,4-dione
with (pyridine-2-yl)methanamine is 2-((pyridine-2-yl)
methylamino)-3-bromonaphthalene-1,4-dione designated as
2MPA,[63] however, the reaction concomitantly leads to the
formation of product 2-amino-3-bromonaphthalene-1,4-dione
(A). It was further observed that the reaction of
2,3-dibromonaphthalene-1,4-dione with (pyridine-4-yl)
methanamine yield the 2-aminonaphthalene-1,4-dione (B(1)).
A similar product was obtained from the reaction of
naphthalene-1,4-dione with (pyridine-2-yl)methanamine
(B(2)). X-ray crystal structures of A, B(1), and B(2) are
established. The mechanism for the formation of compound
A is presented. The density functional theory further
characterized the molecular structures of A and B(1). The
vibrational frequencies, 1H NMR chemical shifts,
HOMO-LUMO energies are evaluated. Discernibly enough,
in methanol-water solvent mixtures, compound A selectively
detects Hg2+ and Ni2+ ions.
2. Experimental
2.1 Materials and methods
Chemicals and reagents viz. 2,3-dibromonaphthalene -1,4-
dione(DBrNQ),naphthalene-1,4-dione, (pyridine-2-yl)metha
namine, and (pyridine-4-yl)methanamine purchased from
Sigma-Aldrich were used as received. Analytical grade
solvents dichloromethane, chloroform, methanol obtained
from Merck Chemicals. Laboratory grade toluene, methanol
for chromatography were distilled by standard methods[64] and
dried wherever necessary. CuCl, CuCl2·2H2O, NiCl2·6H2O,
ZnCl2, CoCl2·6H2O HgCl2, triethylamine were obtained from
Merck chemicals. FeCl3·6H2O procured from Qualigens
Chemicals. CrCl3·6H2O, CdSO4, MnCl2·4H2O purchased
from Fluka. LaCl3·7H2O was obtained from Thomas and
Baker. Milli-Q water is used for the preparation of aqueous
solutions.
2.2 Physical measurements
The melting point was determined using a melting point

Research article Engineered Science
80 | Eng. Sci., 2021,14, 78-93 © Engineered Science Publisher LLC 2021
Scheme 1 Reaction scheme for the synthesis of compound A.
apparatus (Make-METTLER). FT-IR (Fourier-Transform
Infrared) spectra recorded between 4000-400 cm-1 as KBr
pellets on BRUKER (Tensor 37) spectrometer(Fig. S1 and Fig.
S2 in ESI†).1H, 13C, DEPT (Distortionless Enhancement by
Polarization Transfer), HSQC (Heteronuclear Single Quantum
Coherence), COSY (1H-1H Correlation Spectroscoy) NMR
(Nuclear Magnetic Resonance) recorded (Fig. S3 through Fig.
S14 in ESI†) in DMSO-d6, on Varian 500 MHz NMR
instrument. TMS (tetramethylsilane) is used as a reference.
The mass of compound A was determined by the Liquid
chromatograph-mass spectrum (LC-MS) recorded on Bruker
mass spectrometer (Make: IMPACT II UHR-TOF, Ultra-High
Resolution Time-Of-Flight) (Fig. S15 through Fig. S17 in
ESI†). The mass spectra of A and B(1) were also recorded on
MALDI-TOF (Matrix Assisted Laser Desorption/
Ionization-Time Of Flight) (AB 4800 plus) spectrometer (Fig.
S18 through Fig. S19 in ESI†). The UV-Visible spectra of A
recorded from 200 nm to 800 nm on Shimadzu UV 1800
spectrophotometer (Fig. S20 in ESI†). Fluorescence spectra
were recorded on the JASCO spectrofluorometer FP-8300
(Fig. S21 through Fig. S22 in ESI†).
2.3 Synthesis
2.3.1 Synthesis of 2-amino-3-bromonaphthalene-1,4-dione;
compound A
One gram of 2,3-dibromonaphthalene-1,4-dione(DBrNQ)
(3.16 mmol) was taken into a two neck round bottom flask and
dissolved in 25 ml of dichloromethane (DCM) with constant
magnetic stirring for about 15 min (Scheme 1) and followed
by dropwise addition of the (pyridine-2-yl)methanamine (3.37
mmol, 0.330 ml). The color change of the reaction mixture has
occurred from yellow to dark orange. After one hour of
continuous magnetic stirring at room temperature (26 C), the
white-colored precipitate was formed, separated by
decantation. The bright orange-colored solution was stirred for
a further 24 hrs. The reaction was monitored by thin-layer
chromatography using a 9:1 toluene and methanol solvent
system. A crude product formed was isolated by evaporation
of the solvent from the reaction mixture under reduced
pressure.
Further, the purification carried out using column
chromatography over silica gel in the methanol/toluene (1:9)
system. The column chromatography indicated two separate
bands, and the two products (as shown in Fig. 1) were
separated. The orange fraction that eluted first corresponds to
the product A, while the other one which comes out later was
the usual Michael addition product aminonaphthoquinone
ligand 2-((pyridine-2-yl)methylamino)-3-bromonaphthalene-
1,4-dione. The purified orange-colored products obtained from
the rotatory evaporator under reduced pressure were slowly
allowed to re-evaporate at room temperature (26 oC) for 2-3
days to give beautiful bright orange-colored crystals.
Fig. 1 (a) First fraction in column (A), (b) Second fraction in
column (2MPA).
2.3.2 Reaction scheme for the synthesis of compound A
The yield of the pure dark orange-colored product 2MPA
ligand (Fig. 1) is 0.4 g (36.8%), while that of
2-amino-3-bromonaphthalene-1,4-dione (A) is 0.25 g (33.1%);
furthermore, if chloroform is used as a reaction solvent, only
the product (A) is formed at room temperature (26 oC).
Analytical data: Bright orange crystals. Yield: 0.25 g (33.1%).
mp 190C; FT-IR (KBr, max/cm-1): 3827, 3730, 3325, 3090,
2921, 2658, 1980, 1676, 1619, 1367, 1268, 1176, 1008, 833,
785, 720, 674, 576, 521, 450; 1H NMR (499.81 MHz, CDCl3)
δ7.96 (d, 2H, J = 4.99 Hz,), 7.81 (t, 1H, J =7.49 Hz,), 7.73 (t,
1H, J =7.49 Hz), 7.10-7.40 (s, N-H); 13C NMR (CDCl3,
125.69 MHz) δ 178.75, 175.25, 148.93, 134.93, 132.73,
132.31, 129.71 126.44, 126.22, 101.42; UV-Vis (DMSO)
Engineered Science Research article
© Engineered Science Publisher LLC 2021 Eng. Sci., 2021, 14, 78-93 | 81
/nm)): 449; MALDI-TOF/TOF m/z, observed: 252.4707;
C10H6NO2Br requires: 252.0711; LC-MS: m/z observed:
251.9, 253.8; C10H6NO2Br[A] (due to isotopic bromine)
requires: 252.0711.
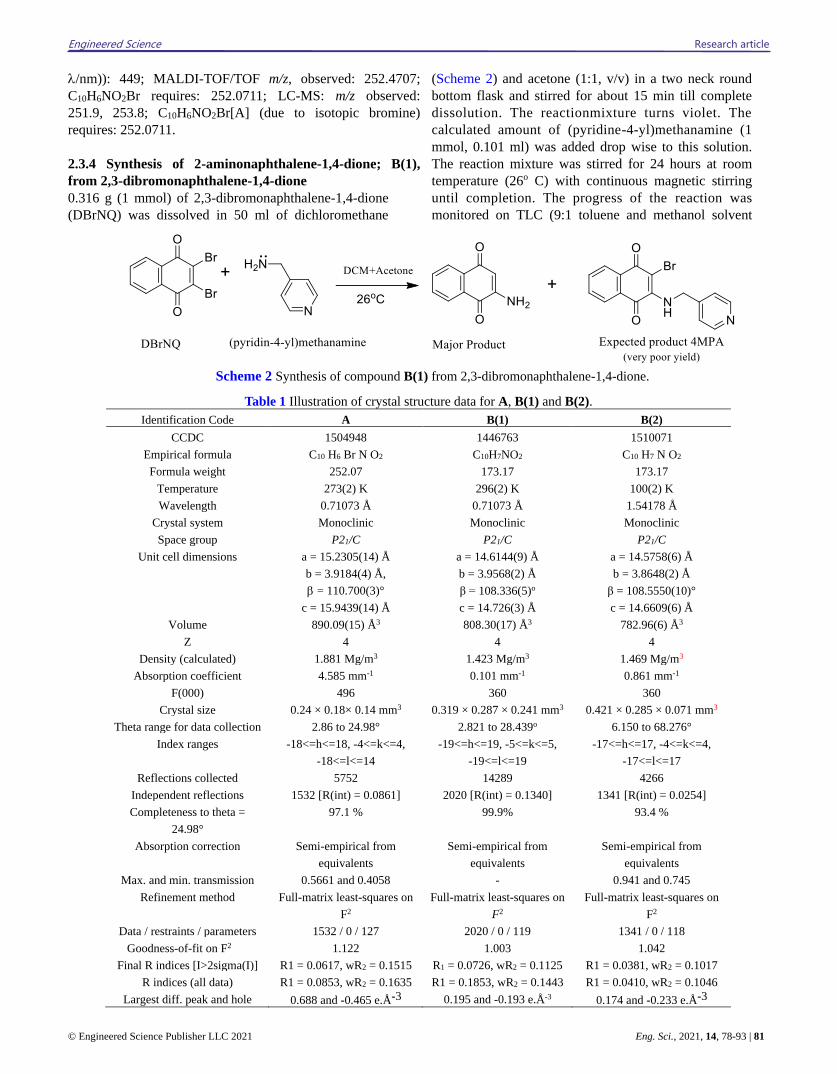
2.3.4 Synthesis of 2-aminonaphthalene-1,4-dione; B(1),
from 2,3-dibromonaphthalene-1,4-dione
0.316 g (1 mmol) of 2,3-dibromonaphthalene-1,4-dione
(DBrNQ) was dissolved in 50 ml of dichloromethane
(Scheme 2) and acetone (1:1, v/v) in a two neck round
bottom flask and stirred for about 15 min till complete
dissolution. The reactionmixture turns violet. The
calculated amount of (pyridine-4-yl)methanamine (1
mmol, 0.101 ml) was added drop wise to this solution.
The reaction mixture was stirred for 24 hours at room
temperature (26o C) with continuous magnetic stirring
until completion. The progress of the reaction was
monitored on TLC (9:1 toluene and methanol solvent
Scheme 2 Synthesis of compound B(1) from 2,3-dibromonaphthalene-1,4-dione.
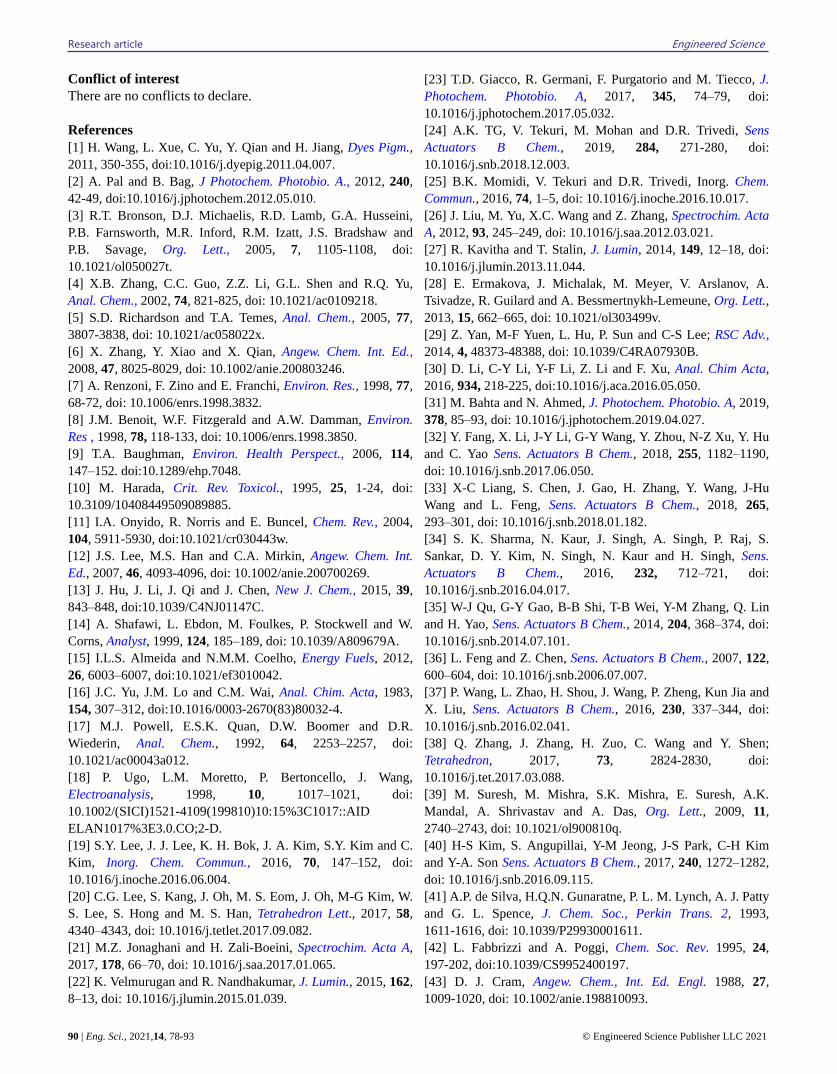
Table 1 Illustration of crystal structure data for A, B(1) and B(2).
Identification Code A B(1) B(2)
CCDC 1504948 1446763 1510071
Empirical formula C10 H6 Br N O2 C10H7NO2 C10 H7 N O2
Formula weight 252.07 173.17 173.17
Temperature 273(2) K 296(2) K 100(2) K
Wavelength 0.71073 Å 0.71073 Å 1.54178 Å
Crystal system Monoclinic Monoclinic Monoclinic
Space group P21/C P21/C P21/C
Unit cell dimensions a = 15.2305(14) Å
b = 3.9184(4) Å,
= 110.700(3)°
c = 15.9439(14) Å
a = 14.6144(9) Å
b = 3.9568(2) Å
β = 108.336(5)o
c = 14.726(3) Å
a = 14.5758(6) Å
b = 3.8648(2) Å
β = 108.5550(10)°
c = 14.6609(6) Å
Volume 890.09(15) Å3 808.30(17) Å3 782.96(6) Å3
Z 4 4 4
Density (calculated) 1.881 Mg/m3 1.423 Mg/m3 1.469 Mg/m3
Absorption coefficient 4.585 mm-1 0.101 mm-1 0.861 mm-1
F(000) 496 360 360
Crystal size 0.24 × 0.18× 0.14 mm3 0.319 × 0.287 × 0.241 mm3 0.421 × 0.285 × 0.071 mm3
Theta range for data collection 2.86 to 24.98° 2.821 to 28.439o 6.150 to 68.276°
Index ranges -18<=h<=18, -4<=k<=4,
-18<=l<=14
-19<=h<=19, -5<=k<=5,
-19<=l<=19
-17<=h<=17, -4<=k<=4,
-17<=l<=17
Reflections collected 5752 14289 4266
Independent reflections 1532 [R(int) = 0.0861] 2020 [R(int) = 0.1340] 1341 [R(int) = 0.0254]
Completeness to theta =
24.98°
97.1 % 99.9% 93.4 %
Absorption correction Semi-empirical from
equivalents
Semi-empirical from
equivalents
Semi-empirical from
equivalents
Max. and min. transmission 0.5661 and 0.4058 - 0.941 and 0.745
Refinement method Full-matrix least-squares on
F2
Full-matrix least-squares on
F2
Full-matrix least-squares on
F2
Data / restraints / parameters 1532 / 0 / 127 2020 / 0 / 119 1341 / 0 / 118
Goodness-of-fit on F2 1.122 1.003 1.042
Final R indices [I>2sigma(I)] R1 = 0.0617, wR2 = 0.1515 R1 = 0.0726, wR2 = 0.1125 R1 = 0.0381, wR2 = 0.1017
R indices (all data) R1 = 0.0853, wR2 = 0.1635 R1 = 0.1853, wR2 = 0.1443 R1 = 0.0410, wR2 = 0.1046
Largest diff. peak and hole 0.688 and -0.465 e.Å-3 0.195 and -0.193 e.Å-3 0.174 and -0.233 e.Å-3

Research article Engineered Science
82 | Eng. Sci., 2021,14, 78-93 © Engineered Science Publisher LLC 2021
system). The crude product was filtered and purified by
column chromatography over silica gel in the
methanol/toluene (1:9) system. It showed a separate orange
band on the column apart from the violet band. The orange
fraction that eluted first corresponds to the unexpected
product. The purified orange-colored solid product obtained
from rotary evaporator under reduced pressure was slowly
allowed to re-evaporate at room temperature (26 C) for 2-3
days in toluene-methanol eluent to give beautiful dark
orange-colored crystals. The crystal data obtained is
represented as B(1) in Table 1.
We attempted this reaction under various reaction
conditions, such as in
i) in DCM,
ii) DCM in the presence of base triethylamine,
iii) in DCM and sodium acetate,
iv) in DCM and methanol,
v) in ethanol, both the base's absence/presence at room
temperature (26 oC) and under refluxed conditions, but no
noticeable results were obtained. The yield of the expected
aminonaphthoquinone was feeble.
2.3.5 Analytical Data of 2-aminonaphthalene-1,4-dione;
B(1)
Dark orange crystals. Yield: 0.188 g (79%); FT-IR (KBr,
max/cm-1): 3381, 3066, 2995, 2918, 2686, 2486, 1961, 1865,
1681, 1620, 1564, 1421, 1359, 1269, 1219, 1124, 985, 889,
825, 781, 723, 663, 594, 532, 491; 1H NMR (CDCl3, 499.84
MHz)δ 8.16 (d, J = 6.99 Hz, 1H, Ar), 8.07 (d, J = 7.99 Hz,
1H), 7.73 (m, J = 7.75 Hz, 1H), 7.66 (m, J = 7.49 Hz, 1H),
7.27 (s, 1H). (5.0-6.35 Hz, 2H, NH2); 13C NMR (CDCl3,
125.70 MHz) δ 178.50, 176.31, 147.16, 134.89, 132.64,
129.69, 127.23, 126.74, 105.15, 77.02; MALDI-TOF: m/z
observed 172.2298, C10H6NO2 requires 172.1621.
2.3.6 Synthesis of 2-aminonaphthalene-1,4-dione; B(2),
from naphthalene-1,4-dione
One mmol of naphthalene-1,4-dione (0.2 g) dissolved in 20
ml dry methanol, and the mixture stirred for about 15 min.
One mmol of (pyridine-2-yl)methanamine (~0.10 ml) was
added dropwise to this solution. The color of the solution
changes from yellow to orange-red. The reaction mixture was
stirred for 24 hours at room temperature (26 °C) with
constant magnetic stirring. The formation of the product was
monitored by TLC (methanol/toluene 1:9). Dark red-colored
solid was obtained by evaporation and further purified by
column chromatography using silica as the stationary phase
and toluene: methanol (9:1) as eluent. After evaporation, dark
red-colored crystals were obtained. Yield: 0.121 g (65.76%).
The crystal data obtained represented in Table 1 as B(2).
There is also the formation of
2-((pyridine-2-yl)methylamino)naphthalene-1,4-dione observe
d for this reaction; however, when the synthesis carried out in
toluene, only compound B(2) resulted as a final major
product.
2.4 Single crystal X-ray diffraction
Single crystal X-ray diffraction data for A, B(1) and B(2)
were collected on D8 Venture PHOTON 100 CMOS
diffractometer using graphite monochromatized Mo-K
radiation ( = 0.7107 Å) with exposure /frame = 10 secs. The
X-ray generator operated at 50 kV and 30 mA for Mo-K
radiation with 50 kV and one mA for Cu-K. An initial set of
cell constants and an orientation matrix were calculated from
24 frames and 60 frames for Mo and Cu sources. The
optimized strategy used for data collection consisted of
different and scans with 0.5° steps in /. Crystal to
detector distance was 5.00 cm with 512 × 512 pixels/frame,
Oscillation/frame -0.5º, maximum detector swing angle =
-30.0º, beam centre = (260.2, 252.5), in-plane spot width =
1.24. Data integration was carried out with a Bruker SAINT
program, and empirical absorption correction for intensity
data carried out subsequently by Bruker SADABS. The
programs are integrated into the APEX II package.[65] The
data corrected for Lorentz and polarization effect. The
structures were solved by Direct Method using SHELX-97.[66]
The final refinement of the structure was performed by
full-matrix least-squares techniques with anisotropic thermal
data for non-hydrogen atoms on F2. The non-hydrogen atoms
were refined anisotropically, while hydrogen atoms were
refined at the calculated positions as riding atoms with
isotropic displacement parameters. Molecular diagrams
generated using Mercury program.[67] Geometrical
calculations were performed using SHELXTL[66] and
PLATON.[68]
2.5 Computational details
Compounds A and B(1) were optimized, employing the
B97X based density functional theory[69]using the
Gaussian-09 program.[70] The internally stored 6-31G basis set
with diffuse functions added to the basis of heavier atoms
(denoted by 6-31+G(d,p) basis) was used.[71] The stationary
point structure was confirmed to be the local minimum on the
potential energy surface through vibrational frequency
computations. Frontier orbitals are derived within the same
framework of the theory. Time-dependent Density Functional
Theory (TD-DFT) computations predict wavelength maxima
in A and B(1).
2.6 Metal ion binding studies of A
Metal ion binding studies were studied[44-47] by following
methods, (i) in dry methanol solution of chemosensor A and
metal ions (110-4 M); (ii) 110-4 M solution of (i) in the
presence of triethylamine; (iii) methanol (chemosensor
(110-4 M) and water (metal ion, 110-4 M) mixture; and (iv)
110-4 M solution of (iii) in the presence of triethylamine. In
all methods, 2 ml of chemosensor, i.e., compound A (110-4
M), mixed with 2 ml of metal ion solution at room
temperature (26 C). 1 ml triethylamine added to

Engineered Science Research article
© Engineered Science Publisher LLC 2021 Eng. Sci., 2021, 14, 78-93 | 83
O
O
Br
Br
NH2N
O
O
Br
N Py
H
H
Br
O
O
Br
N PyBr
H
H
O
O
Br
N Py
H
2MPA
O
O
Br
N
H
H
Py
H
O
O
Br
Br
O
O
Br
N Py
O
O
Br
N Py
-HBr
H
O
O
Br
NH2
Product A
(a)
(b)
(1)
(2)
(3) (4) (5)
(6) (7)
(8)
(5)
H2O
Oxidn +HBr
H
Imine Iminium cation
DCM
(0.02%
H2O)
Scheme 3 Plausible reaction mechanism involved in the synthesis of a) 2MPA and b) Unusual Product A.
chemosensor solution in case of (ii) and (iv)before the addition
of metal ion solution. UV- visible and fluorescence spectra of
all the solutions were measured after mixing the ligand and
metal ion solution with a concentration of 110-4 M each.
3. Results and Discussion
3.1 Reaction mechanisms accompanying synthesis of
2-amino-3-bromonaphthalene-1,4-dione; A
Formation of product A observed in the synthesis of 2MPA.
Product A was isolated and characterized as
2-amino-3-bromonaphthalene-1,4-dione. This product is
characterized by FT-IR, 1H, 13C-NMR, gDQCOSY (Gradient
double Quantum Filtered Correlation Spectroscopy), DEPT
experiments.
The plausible mechanism for the formation of product A is
shown in Scheme 3. Herein, Michael's addition of the
2,3-dibromonaphthalene-1,4-dione (DBrNQ)(1) reacts with
(pyridine-2-yl)methanamine (2) in DCM (0.02% water) used
as a solvent resulting in the formation of 2MPA (5) via in situ
generation of the anion (3), followed by proton shifting and
loss of –HBr molecule from (4). After the formation of
2MPA(5) was oxidized in the presence of an excess of DBrNQ
(1), resulting in corresponding imine (6), which leads to
intermediate iminium cation formation (7) by nucleophilic
attack of the bromide anion present in the solution and then
further hydrolysis to form compound (8) in the final step. It
was isolated and fully characterized by FT-IR, 1H- and 13C-NMR spectroscopic techniques. Finally, the structure of
the product A confirmed by Single Crystal X-ray diffraction
studies. The product 2-aminonaphthalene-1,4-dione B(1) is
obtained from the reaction of 2,3-dibromonaphthalene-
1,4-dione and (pyridine-4-yl)methanamine. A similar
product was obtained from the reaction of
naphthalene-1,4-dione and (pyridine-2-yl) methanamine; it is
designated as B(2). Plausible reaction mechanism of
compound B(1) presented in Scheme S1 and Scheme S2 (in
ESI†).
3.2 FT-IR and NMR Studies
The FT-IR spectrum of compound A (8) shows the
characteristic band at 1676 cm-1 and 1619 cm-1, assigned
toC=O vibrations of naphthalene-1,4-dione. The other
distinctive bands that appear at 3350 and 3461 cm-1,
respectively (Fig. S1 in ESI†) are due to the presence of N-H
stretching of the amino functionality of product A (8). Further,
the FT-IR band at 674 cm-1 corresponds to C-Br stretching,
which gives a fair idea about the bromine's retention in
compound ‘A’.[63] The N-H stretching frequency was found
near 3379 cm-1 (Fig. S2 in ESI†) for B(1) while C=O vibrations
here was located near1654 and 1634 cm-1 1H NMR spectrum of the unique product A, recorded in
CDCl3 solvent (Fig. S3 in ESI†), reveals two multiplets in the
aromatic region = 7.73-8.00 ppm, indicating the presence of
four protons of naphthoquinone moiety. While the other proton
signals at ~ = 7.10-7.40 ppm results from the NH2 group of
A. 13C NMR spectrum of A shows signals at δ = 175.25 ppm
and δ = 178.75 ppm (Fig. S4 in ESI†) for two carbonyl groups
naphthalene-1,4-dione moiety. Four quaternary carbons are
thus evident. The 13C chemical shift signals appearing at δ =
132.30 ppm and δ = 129.70 ppm correspond to the ring
junction of phenyl functionality fused with quinone. The
remaining two quaternary carbon signals indicate Br by NH2
group's substitution with C-NH2 being downfield to 148.93
ppm. The signal appearing at 126.21 ppm is due to the C-Br
bond of the starting material DBrNQ. 1H and 13C NMR spectra of B(1) recorded in the CDCl3
solvent are shown in Fig. S7 and Fig. S8 of ESI†. Besides,
gHSQCAD and gDQCOSY are displayed in Figs. S9 and S10

Research article Engineered Science
84 | Eng. Sci., 2021,14, 78-93 © Engineered Science Publisher LLC 2021
Fig. 2 ORTEP of compound A (left) and B(1) (right), the ellipsoids are drawn with a 50% probability.
of the ESI†. The 1H NMR spectrum B(1) reveals two
multiplets in the range 7.66-8.16 ppm, integrating four
hydrogens of the α-naphthoquinone moiety in the desired
compound. NH2 substituent moves to absorb between δ =
5.0-6.35 ppm, whereas the C-3) proton adjacent to the amino
group absorbs at δ = 7.27 ppm.
Two signals at δ = 176.31 ppm and δ = 178.50 ppm on the 13C NMR spectrum are characteristic of the two carbonyl
groups on naphthalene-1,4-dione moiety. The 13C NMR
signals, which reveal the most about the substitution pattern
of these compounds, arise at δ = 147.158 ppm (C-2) and δ =
105.151 ppm (C-3) (Fig. S5 in ESI†).
The molecular mass of compound A has been determined
by different mass spectral techniques such as LC-MS and
MALDI-TOF experiments (Fig. S16 and Fig. S19in ESI†).
For compound A, the mass was found to be 252.4707 m/z.
3.3 Single Crystal X-ray diffraction
Compounds A and B(1) crystallize in monoclinic space
group P21/C. ORTEP diagrams of compound A and B(1) are
shown in Fig. 2, and the crystal structure data presented in
Table 1. The hydrogen bond parameters are summarized in
Table 2 (bond distances in Table S2, Table S7 of, and Table
S11 in ESI†). The carbonyl bond distances (~1.21Å and
~1.23Å) compared well with those in its oxidized form
reported earlier.[72-77]
As can be noticed, compound A is associated with
neighboring five molecules via N-H∙∙∙O, N-H∙∙∙Br, and Br∙∙∙O
interactions (Fig. 3). Each molecule is associated as a dimer
unit, which facilitates intermolecular N-H∙∙∙O interaction and
is linked via Br∙∙∙O Fig. 4a. A butterfly-like arrangement
extending down the c-axis is displayed in Fig. 4b.
Table 2 Hydrogen bonding geometries and other molecular interactions for A and B(1).
Table 3 Selected bond distances (in Å) in A and B(1) in the gas phase (G) and dimethylsulfoxide (D).
D-H∙∙∙A D-H(Ǻ) H∙∙∙A(Ǻ) D∙∙∙A(Ǻ) D-H∙∙∙A() Symmetry
A N-H(1N)∙∙∙O(1) 0.880 2.446 2.744(9) 100.4 Intra
N-H(1N)···O(1) 0.880 2.261 3.02(1) 144.3 1-x,-y,2-z
N-H(2N)···Br 0.880 3.173(7) 3.7061) 133.6 1-x,-1/2+y,2.5-z
Br(1)···O(1) - - 3.173 - x,-1/2-y,-1/2+z
B(1) N(11)-H(11B)∙∙∙O(1) 0.860 2.350 2.680(3) 103.1 Intra
N(11)-H(11B)∙∙∙O(2) 0.860 2.190 2.919(3) 142.3 -x,-1/2+y,1/2-z
N(11)-H(11B)∙∙∙O(2) 0.860 2.216 3.042(3) 160.9 x,1.5-y,-1/2+z
C(5)-H(5)···O(1) 0.929 2.642 3.363(4) 135.0 x,1/2-y-1/2+z
A(Å) Observed (Å) B(1)(Å) Observed(Å)
G( Å) D(Å) G(Å) D(Å)
C(4) = O(2) 1.218 1.217 1.217 1.224 1.224 1.240
C1=O1 1.219 1.217 1.217 1.219 1.219 1.216
C- N 1.344 1.344 1.430 1.351 1.351 1.331
C-Br/C-H 1.872 1.872 1.885 1.086 1.086 0.930

Engineered Science Research article
© Engineered Science Publisher LLC 2021 Eng. Sci., 2021, 14, 78-93 | 85
Fig. 3 Molecular association of A with neighboring molecules.
(a)
(b)
Fig. 4 Molecular packing in A down the a) b-axis and b) c-axis.
Molecule B(1) shows intra and intermolecular N-H∙∙∙O
hydrogen bonding interaction. Six other similar molecules
surround each molecule of B(1) via C-H∙∙∙O, N-H∙∙∙O, and
C-H∙∙∙ interactions (Fig. 5). Tetrameric molecular unit of
B(1) molecules (Fig. 6) formed by N-H∙∙∙O
(N(11)-H(11A)∙∙∙O(2); -x,1/2+y, +1/2-z and
N(11)-H(11B)∙∙∙O(2); x, 1.5-y, +1/2+z ) interaction and also
supported by C(3)-H(3)∙∙∙ (3.57 Å, -x,1/2+y, 1/2-z)
interaction (Fig. 6).
Fig. 5 Molecular association of B(1).
Fig. 6 Tetrameric unit of B(1) down the b-axis linked via
N-H∙∙∙O interactions.
3.4 DFT investigations
Optimized structures of naphthoquinone derivatives A and
B(1) from the B97X based DFT are depicted in Fig. 7. The
observed and calculated bond distances and bond angles are
shown in Table 3. The carbonyl C(1)-O(1) bond distances
became 1.219 Å in A. The longer corresponding bond in B(1)
compared to A attributed to intramolecular N-H∙∙∙O hydrogen
bonding. 1H NMR chemical shifts (δH) in A and B(1) in
DMSO (as solvent) simulated through the SCRF-PCM (Self
Consistent Reaction Field- Polarizable Continuum Model)
theory. A comparison with the measured spectra presented in
Table 4. As shown, H1A proton participating in N-H∙∙∙O
interactions in B(1) emerge with relatively large deshielding
(5.7 ppm) relative to the H1B proton in the spectrum.
Aromatic proton signals show up in the 8.3 to 9.0 ppm
region.
Structural ramifications to vibrational spectra can be
noticed in Table 5. Theoretical vibrational frequencies
(harmonic) reported were scaled by a factor of 0.91. As may
be seen, the C(1)O(1) carbonyl stretching in A assigned to

Research article Engineered Science
86 | Eng. Sci., 2021,14, 78-93 © Engineered Science Publisher LLC 2021
(a)
(b)
Fig. 7 Optimized structures of A and B(1).
Table 4 1H chemical shift (in ppm) in dimethylsulfoxide.
the 1639 cm-1 (Fig. 8) vibration that corresponds to the 1628.
cm-1 vibration in B(1). The aromatic stretching was predicted
at ~2962 cm-1 (Fig. 9). These inferences agree well with the
experiment. Frontier orbitals HOMO and LUMO (isosurface
of 0.04 au) in the aminonaphthquinones are portrayed (Fig.
10 and Fig. 11). HOMO of both derivatives extended over
the entire molecule and rendered with a large π-character,
whereas the LUMO reveals significant σ-character.
Electronic spectra of these were computed in the presence of
methanol using the TD-DFT theory.
Table 5 Selected vibrational frequencies (in cm–1, ν) of A and
B(1).
3500 3000 2500
85
90
95
100
% T
ran
sm
itta
nce
Wavenumber (cm-1)
A
3500 3000 2500
1000
500
0
A DFT
1500 1000 500
80
90
100
% T
ransm
itta
nce
Wavenumber (cm-1)
A
1500 1000 500
2000
1500
1000
500
0
A DFT
Fig. 8 Experimental and calculated FT-IR spectrum of A.
The wavelength maxima, oscillator strengths, and orbital
descriptors have been summarized in Table 6. As is
transparent, the absorption band arising from the HOMO to
LUMO transition shows up near ~382 nm and 373 nm for A
and B(1), respectively. The HOMO-LUMO energies, global
indices of reactivity viz., chemical potential (μ), hardness (η),
A Observed B(1) Observed
H(1A) - 5.7 -
H(1B) - 4.8 5.0-6.35
H(3) - 6.2 7.27
H(5) 8.7 8.15 8.8 8.16
H(6) 8.2 7.71 8.4 7.72
H(7) 8.3 7.71 8.3 7.76
H(8) 8.7 8.15 9.0 8.06
H(9) 6.1 2.19 - -
H(10) 5.0
Vibrations A Observed B(1) Observed
(CH) 2964 2922, 2852 2961
(C1=O1) 1639 1614 1628 1634
(C4=O2) 1656 1676 1654 1654
(C=C) 1564 1572 1571 1578
(NH2) 3441
3317
3459
3348
3457
3322
3379
3298

Engineered Science Research article
© Engineered Science Publisher LLC 2021 Eng. Sci., 2021, 14, 78-93 | 87
electrophilicity (ω) of amino naphthoquinone derivative, and
its anionic form summarized in Table 7. A separation of
HOMO and LUMO energies (ΔE) in the molecule implies
the reluctance toward accepting electrons in the LUMO and
removing an electron from the HOMO, which explains why
A is more stable.
Fig. 9 Experimental and Calculated FT-IR spectrum of B(1).
Table 6 Separation of HOMO, LUMO energies, and global indices in A and B(1).
A B(1)
Transition Eex λmax (f) Eex λmax (f)
HOMO → LUMO 3.2 382 0.067 3.3 373 0.015
HOMO → LUMO +1 5.7 218 0.535 5.7 216 0.510
HOMO → LUMO +2 6.4 194 0.020 6.5 191 0.374
HOMO → LUMO +3 6.5 190 0.332
HOMO -1→ LUMO 4.4 280 0.112 4.5 277 0.098
HOMO -1 → LUMO +1 4.9 256 0.355 6.3 197 0.079
HOMO -1 → LUMO +2 7.4 168 0.380
HOMO -2 → LUMO 3.2 382 3.2 4.9 254 0.372
HOMO -2 → LUMO +1 4.4 280 4.4 6.2 199 0.045
HOMO -4 → LUMO 6.5 190 6.5 4.8 259 0.302
Fig. 10 Representative frontier orbital’s in A.

Research article Engineered Science
88 | Eng. Sci., 2021,14, 78-93 © Engineered Science Publisher LLC 2021
Table 7 Wavelength maxima (λmax(nm), oscillator strengths
(f),and assignments of bands in the electronic spectra of the
monomer A and B(1) in methanol from TDDFT.
3.5 Chemosensor ability of compound A
Molecular recognition of fluorescent and colorimetric
chemosensors of various analytes with potential applications
in physiology and medical diagnostics, particularly the heavy
metal cations,[1-3] has been the focus of attention within the
domain of supramolecular chemistry. Amongst these, in
particular, mercury with high toxicity[4] and its trace amounts,
causing adverse effects to human health,[5-8] has been of
considerable interest in the literature.[5,6]
300 400 500 600 700 800
0.0
0.1
0.2
0.3
0.4
0.5 A
Cr3+
Mn2+
Fe3+
Co2+
Ni2+
Cu+
Cu2+
Zn2+
Cd2+
Hg2+
La3+
Ab
so
rban
ce
Wavelength (nm)
Solvent : Methanol
(a)
300 400 500 600 700 8000.0
0.2
0.4
0.6
0.8
1.0
Ab
so
rban
ce
Wavelength ((nm)
A
Cr3+
Mn2+
Fe3+
Co2+
Ni2+
Cu+
Cu2+
Zn2+
Cd2+
Hg2+
La3+
Solvent : Methanol+ TEA
(b)
300 400 500 6000.0
0.2
0.4
0.6
0.8
1.0
Ab
so
rban
ce
Wavelength ((nm)
A
Hg2+
Solvent : Methanol+ TEA
449 nm456 nm
(c)
Fig. 12 A UV-visible spectrum of A (10-4 M) methanol in the
presence of transition metal ions (a) in methanol, (b) UV-visible
spectra of A (10-4 M) in methanol and triethylamine in the
presence of transition metal ions (c) UV-visible spectra of A and
Hg2+ solution.
The metal binding ability of compound A, evaluated
with various metal ions (Cr3+, Mn2+, Fe3+, Co2+, Ni2+, Cu2+,
Zn2+, Hg2+, La3+, and Cd2+ spectrophotometrically and
fluorescence measurements in different solvents including i)
Molecular properties A B(1)
∆E HOMO-LUMO 0.278 0.293
Softness(σ) 7.202 6.824
Global hardness (ŋ) 0.139 0.147
Electronic chemical potential (μ) -0.186 -0.186
Electronegativity(χ) 0.186 0.186
Global electrophilicity index (ω) 0.125 0.017
HOMO LUMO
HOMO-1 LUMO+1
HOMO-2 LUMO+2
HOMO-3 LUMO+3
Fig. 11 Most representative frontier orbital’s B(1).

Engineered Science Research article
© Engineered Science Publisher LLC 2021 Eng. Sci., 2021, 14, 78-93 | 89
pure dry methanol (Fig. 12), ii) methanol and water mixture
(1:1) (v/v) of the ligand in methanol and metal ion solutions
in Millipore water, iii) in the presence of a mild base like
triethylamine (TEA) in methanol and methanol-water
mixture as well (Fig. S20 in ESI†). As observed, compound
A shows color change, specifically only with a few metal
ions.
A+MeOH Cr3+ Mn2+ Fe3+ Co2+ Ni2+ Cu1+ Cu2+ Zn 2+ Cd2+ Hg2+La3+
(a)
A+TEA Cr3+ Mn2+ Fe3+ Co2+Ni2+ Cu1+ Cu2+ Zn 2+ Cd2+ Hg2+ La3+
(b)
Fig. 13 (a) Color change in Compound A (10-4 M) with metal
ions (10-4 M) in methanol (b) Compound A (10-4 M) with metal
ions (10-4 M) in methanol and triethylamine.
Furthermore, a highly selective colorimetric response
towards mercuric ions can be easily detected by the naked
eye in the presence of base triethylamine in the methanol
system. Its solution reveals an instant change in color from
greenish-yellow to brick red (Fig. 13), that accompanies the
metal complex formation. Moreover, compound A did not
respond to the metal ion in the methanol/water system with
or without the base triethylamine. The UV-visible spectrum
of the ligand was nearly insensitive to the presence of a
solvent. Compound A revealed the absorption maximum at
449 nm in methanol with and without base and likewise
methanol-water mixture with TEA or without TEA as well
(Fig. S20 in ESI†). Photographs in the methanol system are
shown in Fig. 14. This figure shows that the yellow color of
ligand (compound A) was changed to brown on addition of
Hg2+ and greenish with on Ni2+, respectively.
(a) (b)
Fig. 14 Change in mercury color in solution in the presence of a
base and the absence of a base for Hg2+ and Ni2+.
The fluorescence behavior of ligands was assessed in
different solvents. Spectra were recorded at 450 nm and 350
nm, shown in Fig. S21 and Fig. S22 of ESI†. As may readily
be observed, the compound solution shows enhanced
fluorescence intensity toward Zn2+ ions in the presence of
triethylamine.
4. Conclusions
The products of the reaction of 2,3-dibromonaphthalene-1,4-
dione with (pyridine-2-yl)methanamine (A) and (pyridine-
4-yl)methanamine (B(1)) have been reported. A mechanism
of the formation of A (2-amino-3-bromonaphthalene-
1,4-dione) and B(1) (2-aminonaphthalene-1,4-dione) is
proposed. The compounds were characterized using FT-IR,
NMR, mass spectroscopy, and single-crystal X-ray
diffraction studies. X-ray structure reveals that compound A
is associated with the five, whereas the compound B(1) to six
nearest similar molecules via N-H∙∙∙O and the Br∙∙∙O
interactions. Besides the compound A also shows N-H∙∙∙Br
interaction. The inferences on structure and spectra are
corroborated through the density functional theory. It has
been demonstrated that compound A remarkable exhibit
selectivity towards Hg2+ and Ni2+ions in methanol in the
presence of a mild base, which is accompanied by a color
change from greenish-yellow to brick red.
Supplementary Information
†Electronic Supplementary Information (ESI).
FT-IR figures Fig.S1 to Fig.S2, NMR Figures Fig.S3 through
Fig. S14, LC-MS Fig.S15 to Fig.S17, MALDI-TOF Fig. S18
and Fig.S19. Crystallography Table S1 through Table S14.
CambridgeCrystallographic Data Centre and may be obtained
on request quoting the deposition number CCDC numbers
1504948 for A, 1446763 for B(1), and 1510071 for B(2) from
the CCDC, 12 Union Road, Cambridge CB21EZ, UK (fax:
+44 1223 336 033; E-mail address: deposit@ccdc.
cam.ac.uk).
Acknowledgments
SSG is grateful to DST-SERB(Ref. No. EMR/2016/007912).
SPG acknowledges support from the Research Project
(37(2)/14/11/2015-BRNS) from the Board of Research in
Nuclear Sciences (BRNS), India. DNL grateful to New
Delhi, India, for the Senior Research Fellowship and
Savitribai Phule Pune University for the award of research
fellowship through the University of Potential excellence
scheme from the University Grants Commission, New Delhi,
India. SPG thanks the Centre for Development of Advanced
Computing (C-DAC), Pune, for computer time at the
National Param Supercomputing Facility.
Supporting information
Applicable
Research article Engineered Science
90 | Eng. Sci., 2021,14, 78-93 © Engineered Science Publisher LLC 2021
Conflict of interest
There are no conflicts to declare.
References
[1] H. Wang, L. Xue, C. Yu, Y. Qian and H. Jiang, Dyes Pigm.,
2011, 350-355, doi:10.1016/j.dyepig.2011.04.007.
[2] A. Pal and B. Bag, J Photochem. Photobio. A., 2012, 240,
42-49, doi:10.1016/j.jphotochem.2012.05.010.
[3] R.T. Bronson, D.J. Michaelis, R.D. Lamb, G.A. Husseini,
P.B. Farnsworth, M.R. Inford, R.M. Izatt, J.S. Bradshaw and
P.B. Savage, Org. Lett., 2005, 7, 1105-1108, doi:
10.1021/ol050027t.
[4] X.B. Zhang, C.C. Guo, Z.Z. Li, G.L. Shen and R.Q. Yu,
Anal. Chem., 2002, 74, 821-825, doi: 10.1021/ac0109218.
[5] S.D. Richardson and T.A. Temes, Anal. Chem., 2005, 77,
3807-3838, doi: 10.1021/ac058022x.
[6] X. Zhang, Y. Xiao and X. Qian, Angew. Chem. Int. Ed.,
2008, 47, 8025-8029, doi: 10.1002/anie.200803246.
[7] A. Renzoni, F. Zino and E. Franchi, Environ. Res., 1998, 77,
68-72, doi: 10.1006/enrs.1998.3832.
[8] J.M. Benoit, W.F. Fitzgerald and A.W. Damman, Environ.
Res , 1998, 78, 118-133, doi: 10.1006/enrs.1998.3850.
[9] T.A. Baughman, Environ. Health Perspect., 2006, 114,
147–152. doi:10.1289/ehp.7048.
[10] M. Harada, Crit. Rev. Toxicol., 1995, 25, 1-24, doi:
10.3109/10408449509089885.
[11] I.A. Onyido, R. Norris and E. Buncel, Chem. Rev., 2004,
104, 5911-5930, doi:10.1021/cr030443w.
[12] J.S. Lee, M.S. Han and C.A. Mirkin, Angew. Chem. Int.
Ed., 2007, 46, 4093-4096, doi: 10.1002/anie.200700269.
[13] J. Hu, J. Li, J. Qi and J. Chen, New J. Chem., 2015, 39,
843–848, doi:10.1039/C4NJ01147C.
[14] A. Shafawi, L. Ebdon, M. Foulkes, P. Stockwell and W.
Corns, Analyst, 1999, 124, 185–189, doi: 10.1039/A809679A.
[15] I.L.S. Almeida and N.M.M. Coelho, Energy Fuels, 2012,
26, 6003–6007, doi:10.1021/ef3010042.
[16] J.C. Yu, J.M. Lo and C.M. Wai, Anal. Chim. Acta, 1983,
154, 307–312, doi:10.1016/0003-2670(83)80032-4.
[17] M.J. Powell, E.S.K. Quan, D.W. Boomer and D.R.
Wiederin, Anal. Chem., 1992, 64, 2253–2257, doi:
10.1021/ac00043a012.
[18] P. Ugo, L.M. Moretto, P. Bertoncello, J. Wang,
Electroanalysis, 1998, 10, 1017–1021, doi:
10.1002/(SICI)1521-4109(199810)10:15%3C1017::AID
ELAN1017%3E3.0.CO;2-D.
[19] S.Y. Lee, J. J. Lee, K. H. Bok, J. A. Kim, S.Y. Kim and C.
Kim, Inorg. Chem. Commun., 2016, 70, 147–152, doi:
10.1016/j.inoche.2016.06.004.
[20] C.G. Lee, S. Kang, J. Oh, M. S. Eom, J. Oh, M-G Kim, W.
S. Lee, S. Hong and M. S. Han, Tetrahedron Lett., 2017, 58,
4340–4343, doi: 10.1016/j.tetlet.2017.09.082.
[21] M.Z. Jonaghani and H. Zali-Boeini, Spectrochim. Acta A,
2017, 178, 66–70, doi: 10.1016/j.saa.2017.01.065.
[22] K. Velmurugan and R. Nandhakumar, J. Lumin., 2015, 162,
8–13, doi: 10.1016/j.jlumin.2015.01.039.
[23] T.D. Giacco, R. Germani, F. Purgatorio and M. Tiecco, J.
Photochem. Photobio. A, 2017, 345, 74–79, doi:
10.1016/j.jphotochem.2017.05.032.
[24] A.K. TG, V. Tekuri, M. Mohan and D.R. Trivedi, Sens
Actuators B Chem., 2019, 284, 271-280, doi:
10.1016/j.snb.2018.12.003.
[25] B.K. Momidi, V. Tekuri and D.R. Trivedi, Inorg. Chem.
Commun., 2016, 74, 1–5, doi: 10.1016/j.inoche.2016.10.017.
[26] J. Liu, M. Yu, X.C. Wang and Z. Zhang, Spectrochim. Acta
A, 2012, 93, 245–249, doi: 10.1016/j.saa.2012.03.021.
[27] R. Kavitha and T. Stalin, J. Lumin, 2014, 149, 12–18, doi:
10.1016/j.jlumin.2013.11.044.
[28] E. Ermakova, J. Michalak, M. Meyer, V. Arslanov, A.
Tsivadze, R. Guilard and A. Bessmertnykh-Lemeune, Org. Lett.,
2013, 15, 662–665, doi: 10.1021/ol303499v.
[29] Z. Yan, M-F Yuen, L. Hu, P. Sun and C-S Lee; RSC Adv.,
2014, 4, 48373-48388, doi: 10.1039/C4RA07930B.
[30] D. Li, C-Y Li, Y-F Li, Z. Li and F. Xu, Anal. Chim Acta,
2016, 934, 218-225, doi:10.1016/j.aca.2016.05.050.
[31] M. Bahta and N. Ahmed, J. Photochem. Photobio. A, 2019,
378, 85–93, doi: 10.1016/j.jphotochem.2019.04.027.
[32] Y. Fang, X. Li, J-Y Li, G-Y Wang, Y. Zhou, N-Z Xu, Y. Hu
and C. Yao Sens. Actuators B Chem., 2018, 255, 1182–1190,
doi: 10.1016/j.snb.2017.06.050.
[33] X-C Liang, S. Chen, J. Gao, H. Zhang, Y. Wang, J-Hu
Wang and L. Feng, Sens. Actuators B Chem., 2018, 265,
293–301, doi: 10.1016/j.snb.2018.01.182.
[34] S. K. Sharma, N. Kaur, J. Singh, A. Singh, P. Raj, S.
Sankar, D. Y. Kim, N. Singh, N. Kaur and H. Singh, Sens.
Actuators B Chem., 2016, 232, 712–721, doi:
10.1016/j.snb.2016.04.017.
[35] W-J Qu, G-Y Gao, B-B Shi, T-B Wei, Y-M Zhang, Q. Lin
and H. Yao, Sens. Actuators B Chem., 2014, 204, 368–374, doi:
10.1016/j.snb.2014.07.101.
[36] L. Feng and Z. Chen, Sens. Actuators B Chem., 2007, 122,
600–604, doi: 10.1016/j.snb.2006.07.007.
[37] P. Wang, L. Zhao, H. Shou, J. Wang, P. Zheng, Kun Jia and
X. Liu, Sens. Actuators B Chem., 2016, 230, 337–344, doi:
10.1016/j.snb.2016.02.041.
[38] Q. Zhang, J. Zhang, H. Zuo, C. Wang and Y. Shen;
Tetrahedron, 2017, 73, 2824-2830, doi:
10.1016/j.tet.2017.03.088.
[39] M. Suresh, M. Mishra, S.K. Mishra, E. Suresh, A.K.
Mandal, A. Shrivastav and A. Das, Org. Lett., 2009, 11,
2740–2743, doi: 10.1021/ol900810q.
[40] H-S Kim, S. Angupillai, Y-M Jeong, J-S Park, C-H Kim
and Y-A. Son Sens. Actuators B Chem., 2017, 240, 1272–1282,
doi: 10.1016/j.snb.2016.09.115.
[41] A.P. de Silva, H.Q.N. Gunaratne, P. L. M. Lynch, A. J. Patty
and G. L. Spence, J. Chem. Soc., Perkin Trans. 2, 1993,
1611-1616, doi: 10.1039/P29930001611.
[42] L. Fabbrizzi and A. Poggi, Chem. Soc. Rev. 1995, 24,
197-202, doi:10.1039/CS9952400197.
[43] D. J. Cram, Angew. Chem., Int. Ed. Engl. 1988, 27,
1009-1020, doi: 10.1002/anie.198810093.
Engineered Science Research article
© Engineered Science Publisher LLC 2021 Eng. Sci., 2021, 14, 78-93 | 91
[44] P. Gosavi-Mirkute, A. Patil, D. N. Lande, D. Chakravarty,
S. P. Gejji, S. Satpute and S. Salunke-Gawali, RSC Adv., 2017,
7, 55163-55174, doi: 10.1039/C7RA10490A.
[45] A. P. Ware, A. Patil, S. Khomane, T. Weyhermuller, S. S.
Pingale and S Salunke-Gawali, J Mol. Struct., 2015, 1093,
39-48, doi: 10.1016/j.molstruc.2015.03.016.
[46] A. Patil, A. P. Ware, S. Bhand, D. Chakravarty, R. Gonnade,
S. S. Pingale and S Salunke-Gawali, J Mol. Struct., 2016, 1114,
132-143, doi: doi: 10.1016/j.molstruc.2016.02.065.
[47] A. Patil, D. N. Lande, A. Nalkar, S. P. Gejji, D.
Chakravarty, R. Gonnade, T. Moniz, M. Rangel, E. Pereira and
S Salunke-Gawali, J Mol. Struct., 2017, 1143, 495-514, doi:
10.1016/j.molstruc.2017.04.094.
[48] S. Madhupriya and K.P. Elango, Spectrochim. Acta A, 2012,
97, 100-104. doi: 10.1016/j.saa.2012.05.044.
[49] S. Madhupriya and K.P. Elango, Spectrochim. Acta A, 2012,
97, 429-434. doi: 10.1016/j.saa.2012.06.020.
[50] C. Parthiban, R. Manivannan and K. P. Elango, Dalton
Trans., 2015, 44, 3259-3264. doi: 10.1039/C4DT03289F.
[51] R. H. Thomson, Naturally Occurring Quinones IV. Recent
Advances, 4th ed., Blackie Academic & Professional: London,
1997.
[52] P. E. Cockram and T. K. Smith, J. Nat. Prod., 2018,
81,2138-2154, doi:10.1021/acs.jnatprod.8b00159.
[53] Z. G. Ding, J. Y. Zhao, M. G. Li, R. Huang, Q. M. Li, X. L.
Cui, H. J. Zhu, and M. L. Wen, J. Nat Prod.,2012, 75, 1994-1999,
doi: 10.1021/np3004936.
[54] C. C. Nawrat, L. I. Palmer, A. J. Blake and C.J. Moody, J.
Org. Chem., 2013, 78, 5587-5603, doi: 10.1021/jo400737f.
[55] Y. Kumagai, Y. Shinkai, T. Miura, and A. K. Cho, Annu. Rev.
Pharmacol. Toxicol., 2012, 52, 221-247, doi:
10.1146/annurev-pharmtox-010611-134517.
[56] J. Li, C. Jiao, K-W. Huang and J. Wu, Chem. Eur. J., 2011,
17, 14622-14680. doi:10.1002/chem.201102120.
[57] Y. C.Hao Jiang, L. Zhengtao, N. Wu, Z. Yang, and J. Quan,
Org. Lett., 2009, 11, 4628-4631, doi: 10.1021/ol901902v.
[58] J. Sperry, J. J. P. Sejberg, F. M. Stiemke, and M. A.
Brimble, Org. Biomol. Chem., 2009, 7, 2599-2603,
doi:10.1039/b905077a.
[59] H. J. Banks, D. W. Cameron, M. J. Crossley and E. L.
Samuel, Aus. J. Chem., 1976, 29, 2247-2256, doi:
10.1071/ch9762247.
[60] A. V. Bogdanov, N. R. Khasiyatullina, V. F. Mironov, D.
B. KrivolapovIgor, A. Litvinov and A. I. Konovalov, Mendeleev
Commun., 2009, 19, 39-41, doi:
10.1016/j.mencom.2009.01.016.
[61] J. Guo, Y. W. Xu, K. Li, L. M. Xiao, S. Chen, K. Wu, X. D.
Chen, Y. Z. Fan, J. M. Liu and C. Y. Su, Angew. Chem. Int. Ed.,
2017, 56, 3852-3856, doi:10.1002/anie.201611875.
[62] D. Chadar, S. S. Rao, S. P. Gejji, B. Ugale, C. M. Nagaraja,
M. Nikalje and S. Salunke-Gawali, RSC Adv., 2015, 5,
76419-76423, doi:10.1039/C5RA13169C.
[63] G. Agarwal, D. N. Lande, D. Chakravarty, S. P. Gejji, P.
Gosavi-Mirkute, A. Patil and S. Salunke-Gawali, RSC Adv.,
2016, 6, 88010-88029, doi: 10.1039/C6RA20970J.
[64] D. D. Perrin, W. L. Armarego and D. R. Perrin, Purification
of Laboratory Chemicals, 2nd Edn., Pergamon Press, Oxford,
1988, p. 260.
[65] Bruker, APEX2, SAINT and SADABS: Bruker AXS Inc.,
Madison, Wisconsin, USA. 2007.
[66] G. M. Sheldrick, Acta Crystallogr. A, 2008, A64, 112-122,
doi: 10.1107/S0108767307043930.
[67] C. F. Macrae, I. J. Bruno, J.A. Chisholm, P. R. Edgington,
P. McCabe, E. Pidcock, L. Rodriguez-Monge, R. Taylor, J. van
de Streek and P. A. Wood, J. Appl. Crystallogr., 2008, 41,
466-470, doi:10.1107/S0021889807067908.
[68] A. L. Spek, Acta Crystallogr., 2009, D65, 148-155,
doi:10.1107/S090744490804362x.
[69] J. D. Chai and M. Head-Gordon, J. Chem. Phys., 2008,
128, 084106,doi: 10.1063/1.2834918.
[70] M. J. Frisch, G. W. Trucks, H. B. Schlegel, G. E. Scuseria,
M. A. Robb, J. R. Cheeseman, J. A. Montgomery Jr, T. Vreven,
K. N. Kudin, J. C. Burant, J. M. Millam, S. S. Iyengar, J.
Tomasi, V. Barone, B. Mennucci, M. Cossi, G. Scalmani, N.
Rega, G. A. Petersson, H. Nakatsuji, M. Hada, M. Ehara, K.
Toyota, R. Fukuda, J. Hasegawa, M. Ishida, T. Nakajima, Y.
Honda, O. Kitao, H. Nakai, M. Li, X. Klene, J. E. Knox, H. P.
Hratchian, J. B. Cross, V. Bakken, C. Adamo, J. Jaramillo, R.
Gomperts, R. E. Stratmann, O. Yazyev, A. J. Austin, R. Cammi,
C. Pomelli, J. W. Ochterski, P. Y. Ayala, K. Morokuma, G. A.
Voth, P. Salvador, J. J. Dannenberg, V. G. Zakrzewski, S.
Dapprich, A. D. Daniels, M. C. Strain, O. Farkas, D. K. Malick,
A. D. Rabuck, K. Raghavachari, J. B. Foresman, J. V. Orti, Q.
Cui, A. G. Baboul, S. Clifford, J. Cioslowski, B. B. Stefanov, G.
Liu, A. Liashenk, P. Piskorz, I. Komaromi, R. L. Martin, D. J.
Fox, T. Keith, M. A. Al-Laham, C. Y. Peng, A. Nanayakkara, M.
Challacombe, P. M. W. Gill, B. Johnson, W. Chen, M. W. Wong,
C. Gonzalez and J. A. Pople, Gaussian, revision,
C.01,Wallingford, CT: Gaussian, Inc. 2004.
[71] G. A. Petersson, T. G. Tensfeldt and J. A. Montgomery Jr, J.
Chem. Phys., 1991, 94, 6091, doi:10.1063/1.460448.
[72] S. Salunke-Gawali, O. Pawar, M. Nikalje, R. Patil, T.
Weyhermüller, V. G. Puranik and V. B. Konkimalla, J. Mol.
Struct., 2014, 1056-1057, 97-103, doi: 10.1016/j.molstruc.2013.
10.016.
[73] U. A. Dar, S. Bhand, D. N. Lande, S. S. Rao, Y. P. Patil, S.
P. Gejji, M. Nethaji, T. Weyhermüller and S. Salunke-Gawali,
Polyhedron, 2016, 113, 61-72, doi: 10.1016/j.poly.2016.04.002.
[74] D. Choudhari, D. Chakravarty, D. N. Lande, S. Parveen,
S.P. Gejji, K. M. Kodam and S. Salunke-Gawali, Struct. Chem.,
2019, 30, 2257-2270, doi: 10.1007/s11224-019-01343-8.
[75] S. Salunke-Gawali, E. Pereira, U. A. Dar and S. Bhand, J.
Mol. Struct., 2017, 1148, 435-458, doi:
10.1016/j.molstruc.2017.06.130.
[76] P. J. Gaultier and E. C. Hauw, Acta Cryst., 1966, 20, 620,
doi: 10.1107/s0365110x66001518.
[77] P. J. Gaultier and E. C. Hauw, Acta Cryst., 1969, B25, 419,
doi: 10.1107/s0567740869002524.

Research article Engineered Science
92 | Eng. Sci., 2021,14, 78-93 © Engineered Science Publisher LLC 2021
Author information
Gunjan Aggrwal completed her Ph.D. in
2020 under the guidance of Professor
Sunita Salunke-Gawali at Savitribai
Phule Pune University, Pune (India). She
passed a National eligibility Test for
Lectureship conducted by CSIR-UGC in
2010 and received her Master’s degree in
Inorganic Chemistry in 2004. Her research interests are
synthesis of chemosensor ligands and transition metal
complexes of naphthoquinone derivatives.
Sunita Salunke-Gawali She received her
M.Sc.(1993) in Inorganic Chemistry and
Ph.D. (1999) from Pune University. As a
professional experience she worked as
Post-doctoral Research Associate at
Laboratoire de Magnétisme et
d’Optique, Versailles France (Prof. F.
Varret, 2001-2002), Department of Chemistry, IIT Bombay,
India (Prof. C. P. Rao, 2002 and 2004), Universidade do
Porto, Portugal, supervised by Prof. Eulália Pereira
(2004-2007) and Max-Planck-Institut für Bioanorganische
Chemie, Mülheim an der Ruhr, Germany (Dr. Eckhard Bill,
2007- 2008). She joined as Reader in Department of
Chemistry, Savitribai Phule Pune University in 2008, where
she serves as Professor. Her research interests include
coordination and bioorganic Chemistry of naphthoquinone
ligands, developing photosensitizer for DSSC, HPLC method
development for anticancer drugs and separation of
tautomers, chemosensors and metallosurfactants. She is the
author of more than 87 articles in international journals.
Shridhar P. Gejji is the former head,
department of Chemistry, Savitribai
Phule Pune University, Pune, India. He
received M. Sc. (in1980) and Ph. D.
(in 1985) from the same university. He
has professional experience in
Theoretical and Computational
Chemistry from the Institute of Quantum Chemistry and
Department of Inorganic Chemistry, Uppsala University,
Sweden (1987-1994). His academic positions include Reader
(1995-2003) and Professor of Physical Chemistry
(2003-2018). He continues to be emeritus Professor at the
department of Chemistry, Savitribai Phule Pune University,
India. He has authored more than 160 articles in the
International Journals.
Milind Nikalje received M. Sc.
(in1994) in Organic Chemistry from
University of Pune and Ph. D. (in 2002)
from National Chemical Laboratory,
Pune. He has professional experience as
a JSPS fellow at GIFU University,
Japan (2003-2005). He joined Savitribai Phule Pune
University in 2002, and continues as Associate Professor in
the same University. His research interest includes synthetic
organic chemistry and asymmetric synthesis.
Debamitra Chakravarty completed her
Master of Science from Bangalore
University. She received her M. Phil.
from Department of Zoology, Savitribai
Phule Pune University, Pune (India)
under the guidance of Dr. Deepti
Deobagkar. She received training on
X-ray crystallography at CSIR-National Chemical
Laboratory under the guidance Dr. Vedavati G. Puranik.
Later she worked as Instrument Operator of Single Crystal
X- Ray Diffractometer at Central Instrumentation facility,
Savitribai Phule Pune University. Her research interests are
chemical crystallography and medicinal biology.
Prakash L. Verma completed his Ph.D.
(2019) and M.Phil. (2015) degrees
under guidance of Professor Shridhar
P. Gejji from Savitribai Phule Pune
University, Pune (India) in theoretical
Chemistry. He received his master’s in
Physical Chemistry in 2010; he worked
as Junior Research Fellow at IISER
Bhopal, India.
Mahesh Jadhav is a Ph. D. student
working under guidance of Professor
Sunita Salunke - Gawali at Savitribai
Phule Pune University, Pune (India). He
received his M. Sc. in Analytical
Chemistry in 2008, and M. Phil. degree
in 2016. He worked in Centaur
Pharmaceutical Pvt. Ltd. as junior officer in quality control
(2008-2009). He also worked in National Chemical
Laboratory (NCL) Pune as a project fellow (2010- 2013) in
Chemical Engineering and Process Development
department. Currently, he is working in Indian Institute of
Science Education and Research (IISER) Pune as a
Technical Officer since 2013. His research interests are

Engineered Science Research article
© Engineered Science Publisher LLC 2021 Eng. Sci., 2021, 14, 78-93 | 93
synthesis of naphthoquinone ligands and their metal
complexes for energy harvesting and storage application.
Prajakta Gosavi-Mirkute is Ph. D.
student under the guidance of Prof.
Sunita Salunke-Gawali at Savitribai
Phule Pune University, Pune (India). She
received her master’s degree in Organic
Chemistry in 2014 and M.Phil. in 2018.
Her research interest includes first row
transition metal ion detection by naphthoquinone and
anthraquinone based chemosensors.
Shital Harihar is a Ph.D. student under
the guidance of Professor Sunita
Salunke-Gawali at Department of
Chemistry, Savitribai Phule Pune
University. She received her Master’s
degree in Inorganic Chemistry in 2016
from the same university. She qualified the State Eligibility
Test (SET 2018) for Assistant Lecturership. Her research
interests are Synthesis, characterization and of biological
activity naphthoquinone metal.
Vedavati G. Puranik, Educated from
Bangalore University India and later on
worked at National Chemical Laboratory,
Pune as senior scientist from 1983.
Executive committee member for Indian
crystallographic Association. Invited talk
at Universität Leipzig Fakultät für Chemie
und Mineralogie, Institut für Anorganische Chemie, Leipzig,
at Korea Research Institute of Chemical Technology
(KRICT) Daejon, at different Pharmaceutical companies, R
& D institutes, at various colleges and university in Pune and
other states of India. Consultancy for dfferent Pharma
Industries. Refereed many manuscripts of different
international journals. Visited Parry Sound, Ontario,
Canada for International Conference on Bioinorganic
Chemistry, Institut für Anorganische Chemie,
Christian-Albrechts Universität Kiel, Germany, for
DST_DAAD project. Member for The International Associate
Laboratories programe (2013-16) between NCL, CNRS and
Unité de Catalyse et de Chimie du Solide (UCCS), France.
She is the author of more than 270 articles in international
journals. Research interests are single crystal X-ray analysis
different compounds, bioactive molecules from natural
sources and Chemically Synthesised novel anticancer
compounds and structure activity correlations.
Publisher’s Note: Engineered Science Publisher remains
neutral with regard to jurisdictional claims in published maps
and institutional affiliations.