reactions supporting information removal of … figure s10. oxygen reduction reaction polarization...
TRANSCRIPT

S1
Supporting Information
Changes in the Oxidation State of Pt Single-Atom Catalysts Upon Removal of Chloride Ligands and Their Effect for Electrochemical Reactions
Sangyong Shin,a Jiwhan Kim,a Subin Park,b Hee-Eun Kim,a Yung-Eun Sungb and Hyunjoo Lee*a
a Department of Chemical and Biomolecular Engineering, Korea Advanced Institute of Science and Technology, Daejeon 34141, South KoreaE-mail: [email protected].
b Center for Nanoparticle Research, Institute for Basic Science (IBS), School of Chemical and Biological Engineering, Seoul National University, Seoul 08826, Republic of Korea
Experimental Section
Additional DataFigure S1 ~ S15Table S1 ~ S3
Electronic Supplementary Material (ESI) for Chemical Communications.This journal is © The Royal Society of Chemistry 2019

S2
Experimental Section
Catalyst Syntheses
TiC (NanoAmor, 99%) were acid-treated to remove oxides on the surface. The TiC powder 500
mg was added to 20 mL of hydrochloric acid (Samchun, 35.0-37.0%) and the mixture was
sonicated for 15 min, then heated for 1 h at 45 ˚C. The acid-treated TiC powder was separated
by centrifugation and washed several time with deionized water (18.3 cm, Human power II+
scholar). Then, the TiC powder was dried in a vacuum oven at 50 ˚C for 4 h and uniformly
ground. Pt was deposited on the acid-treated TiC at 0.2 wt% and 0.5 wt% by incipient wetness
impregnation (IWI) method or at 5 wt% by wetness impregnation (WI) method. H2PtCl6·6H2O
(Sigma−Aldrich) 0.267 mg and 0.667 mg were dissolved in 20 μL of anhydrous ethanol (Sigma-
Aldrich) for 0.2 wt% and 0.5 wt% Pt/TiC, respectively. The Pt precursor solution and 50 mg of
acid-treated TiC powder were mixed well and dried in a vacuum oven at 50 ˚C for 4 h. Then,
the resulting powder was put on an alumina boat and reduced at 100, 300, 500, and 700 ˚C for
1 h under 10 vol% H2 flow with balance N2. H2PtCl6·6H2O (Sigma−Aldrich) 13.34 mg was
dissolved in 1 mL of anhydrous ethanol (Sigma-Aldrich) for 5 wt% Pt/TiC. The acid-treated
TiC 100 mg was added to 5 mL of anhydrous ethanol (Sigma-Aldrich) and sonicated for 15
min. The Pt precursor solution 1 mL was added to the TiC nanoparticles in ethanol and the
mixture was stirred for 9 h at 60 ˚C. After all the ethanol was dried, the remaining powder was
collected and dried further for 4 h at 50 ˚C in a vacuum oven. Then, the powder was put on an
alumina boat and reduced at 100 ˚C for 1 h under a 10 vol% H2 flow with balance N2. The
powders were stored in a vacuum desiccator.
Electrochemical Reactions
Electrochemical oxygen reduction reaction (ORR), methanol oxidation reaction (MOR), formic
acid oxidation reaction (FAOR) were performed. A three-electrode electrochemical cell
composing of a rotating ring disk electrode (glassy-carbon disk, platinum ring, PINE), a 3 M
NaCl Ag/AgCl (RE-5B, BASi) reference electrode, and a Pt wire counter electrode, was used
for all the electrochemical measurements. The potential was measured with a bipotentiostat
(CHI 760E, CH Instruments, Inc). The reversible hydrogen electrode (RHE) was measured
prior to each measurement by performing cyclic voltammetry in H2-purged 0.1 M HClO4
(Sigma-Aldrich) solution with a rotating Pt electrode as a working electrode. The reaction
temperature maintained at 25 ˚C using a water bath. The catalyst 5 mg and carbon black
(XC72R, Vulcan) 2.5 mg were mixed with 17 μL of nafion solution (5 wt %, Sigma-Aldrich)
in 5 mL of anhydrous ethanol (Sigma-Aldrich), and sonicated for 10 min. The catalyst solution

S3
15 μL was deposited on the polished glassy-carbon disk. The ORR was performed by anodic
linear scan voltammetry (LSV) in an O2-saturated 0.1 M HClO4 solution with a scan rate of
0.01 V s-1 and a rotating rate of 1600 rpm. The potential of the Pt ring electrode was held at 1.2
V during the ORR to measure the H2O2 oxidation current. The iR compensation was performed
using the CHI software. H2O2 selectivity was calculated by the Equation (1), where iR is the
ring current, iD is the disk current, and N is the collection efficiency (0.3826 for the specific
rotating ring disk electrode that we have used).
(1)𝐻2𝑂2 𝑠𝑒𝑙𝑒𝑐𝑡𝑖𝑣𝑖𝑡𝑦 (%) =
2𝑖𝑅/𝑁
(𝑖𝑅/𝑁 + 𝑖𝐷)× 100
The MOR or FAOR was performed by cyclic voltammetry (CV) in an Ar-saturated 0.5 M
methanol or formic acid in 0.1 M HClO4 solution with a scan rate of 0.05 V s-1 and a rotating
rate of 1600 rpm.
Characterizations
Transmission electron microscopy (TEM) images were collected using F30 S-Twin (Tencai)
instruments. High-angle annular dark field scanning transmission electron microscopy
(HAADF-STEM) images were collected using a Titan cubed G2 60-300 with an accelerating
voltage of 300 kV. X-ray photoelectron spectroscopy (XPS) were conducted using a K-alpha
(Thermo Scientific) instrument. Al K-alpha 1488.6 eV beam was used. The atomic
concentration was calculated using Thermo Abantange v5.964 software. High resolution X-ray
photoelectron spectroscopy (HR-XPS) was conducted using 10A2 HR-PES beamline of the
Pohang Light Source (PLS). 650 eV beam was used and the beam was calibrated so that the
peak position of 4f7/2 of Au metal was 84.0 eV. X-ray absorption spectroscopy (XAS) was
conducted using 8C Nano XAFS beamline of the Pohang Light Source (PLS). A fluorescence
spectra of Pt L3 edge was obtained and a reference Pt foil was concurrently measured to
calibrate each sample. The XAS data were processed and fitted with ATHENA and ARTEMIS
software programs. The coordination number was estimated based on the fitted S02 value of the
reference Pt foil. Diffuse reflectance infrared Fourier transform spectroscopy (DRIFT) was
conducted using Nicolet iS50 FTIR spectrometer (Thermo scientific) equipped with a Collector
II diffuse reflectance accessory (DRIFT cell). The catalyst 3 mg and KBr powder 97 mg were
grinded well and put into a sample cup in a DRIFT cell. Before measuring the CO adsorption
spectrum, the sample was heated at 100 ˚C for 1 h under Ar flow. All spectra were measured in
room temperature. CO gas was flowed for 10 min, the DRIFT cell was purged by flowing Ar
with vacuum pumping for 5 min, then the spectra was collected.

S4
Additional Data
Figure S1. HAADF-STEM images of 0.2 wt% Pt/TiC catalyst reduced at 100 ˚C.

S5
Figure S2. TEM images of 0.2 wt% Pt/TiC catalysts reduced at a) 100 ˚C, b) 300 ˚C, c) 500
˚C and d) 700 ˚C.

S6
Figure S3. TEM images of 0.5 wt% Pt/TiC catalysts reduced at a) 100 ˚C, b) 300 ˚C, c) 500
˚C and d) 700 ˚C.

S7
Figure S4. HAADF-STEM image and the corresponding STEM-EDX elemental mapping
images of 0.2 wt% Pt/TiC reduced at 100 ˚C. These HAADF-STEM images and elemental
mapping data were collected using a Talos F200X (FEI) with an accelerating voltage of 200
kV.

S8
Figure S5. HAADF-STEM image and the corresponding STEM-EDX elemental mapping
images of 0.2 wt% Pt/TiC reduced at 300 ˚C. These HAADF-STEM images and elemental
mapping data were collected using a Talos F200X (FEI) with an accelerating voltage of 200
kV.

S9
Figure S6. Diffuse reflectance infrared Fourier transform (DRIFT) spectra of CO adsorbed on
0.2 wt% Pt/TiC catalysts reduced at various temperatures and 5 wt% Pt/TiC catalyst. The
dashed line indicates a CO peak attached to the single atomic Pt, and the solid line indicates a
CO peak attached to the Pt nanoparticles.

S10
Figure S7. Peak fitting of high resolution XPS spectra (Pt 4f region) of 0.2 wt% Pt/TiC
catalysts reduced at a) 100 ˚C, b) 300 ˚C and c) 700 ˚C. The green line indicates Pt(IV), the
red line Pt(II) and the blue line Pt (0).

S11
Figure S8. a) White line height ratio (a/b) of XANES spectra at Pt L3 edge of 0.5 wt% Pt/TiC
catalyst reduced at 100 ˚C. b) The ratio of Pt(IV) to Pt(II) estimated from the white line height
ratio. The white line height ratio of 1.80 corresponds to Pt(IV) ratio of ~33% (Pt(IV) : Pt(II) =
1 : 2) from the calibration curve made by Hambley et al.; Adopted with permission.[S1]
Copyright (2003) American Chemical Society.

S12
Figure S9. White line height ratio (a/b) of XANES spectra at Pt L3 edge of 0.5 wt% Pt/TiC
catalysts reduced at a) 300 ˚C, b) 500 ˚C, c) 700 ˚C, and d) Pt foil.
S13
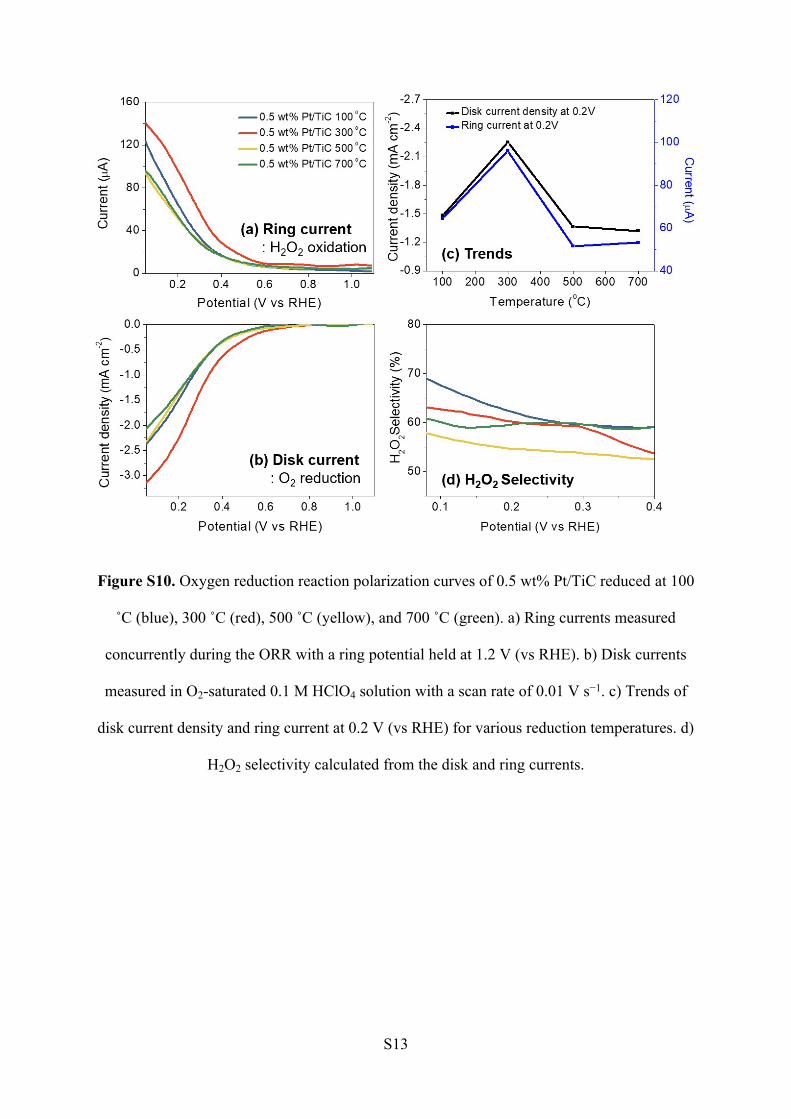
Figure S10. Oxygen reduction reaction polarization curves of 0.5 wt% Pt/TiC reduced at 100
˚C (blue), 300 ˚C (red), 500 ˚C (yellow), and 700 ˚C (green). a) Ring currents measured
concurrently during the ORR with a ring potential held at 1.2 V (vs RHE). b) Disk currents
measured in O2-saturated 0.1 M HClO4 solution with a scan rate of 0.01 V s−1. c) Trends of
disk current density and ring current at 0.2 V (vs RHE) for various reduction temperatures. d)
H2O2 selectivity calculated from the disk and ring currents.

S14
Figure S11. a) TEM image and b) nanoparticle size distribution of 5 wt% Pt/TiC catalyst.

S15
Figure S12. a) Peak fitting of XPS spectrum (Pt 4f region) of 5 wt% Pt/TiC catalyst. b)
Normalized XANES spectra at Pt L3 edge of 0.5 wt% Pt/TiC catalysts reduced at various
temperatures, Pt foil, and 5 wt% Pt/TiC.
S16
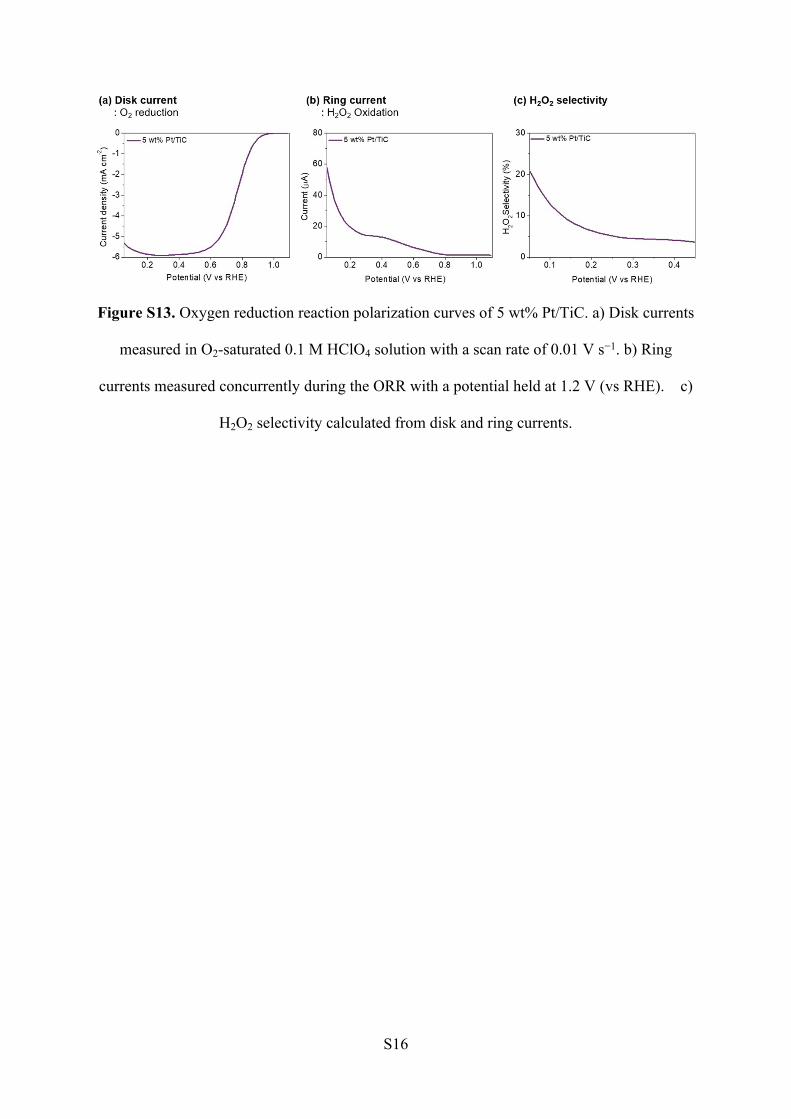
Figure S13. Oxygen reduction reaction polarization curves of 5 wt% Pt/TiC. a) Disk currents
measured in O2-saturated 0.1 M HClO4 solution with a scan rate of 0.01 V s−1. b) Ring
currents measured concurrently during the ORR with a potential held at 1.2 V (vs RHE). c)
H2O2 selectivity calculated from disk and ring currents.

S17
Figure S14. Oxygen reduction reaction polarization curves of 0.2 wt% Pt/TiC reduced at 100
˚C (blue), 0.2 wt% Pt/TiC reduced at 300 ˚C (red), and a physical mixture of 5 wt% Pt/TiC
with 0.2 wt% Pt/TiC reduced at 100 ˚C (pink) with the same Pt loading. a) Disk currents
measured in O2-saturated 0.1 M HClO4 solution with a scan rate of 0.01 V s−1. b) Ring
currents measured concurrently during ORR with a potential held at 1.2 V (vs RHE). c) H2O2
selectivity calculated from disk and ring currents.

S18
Figure S15. Forward scans of cyclic voltammetry of 0.2 wt% Pt/TiC reduced at 100 °C (blue),
300 °C (red), 5wt% Pt/TiC (purple) and physical mixture of 5 wt% Pt/TiC and 0.2 wt%
Pt/TiC 100 °C (pink). (a) Formic acid oxidation reaction performed in Ar-saturated 0.5 M
HCOOH + 0.1 M HClO4 solution. (b) Methanol oxidation reaction performed in Ar-saturated
0.5 M CH3OH + 0.1 M HClO4 solution.

S19
Table S1. Surface elemental composition (% atomic concentration) of 0.2 wt% Pt/TiC
catalysts reduced at various temperatures determined by high resolution XPS analyses (using
synchrotron X-ray source).
0.2 wt% Pt/TiC Reduced Temperature
Elements 100 ˚C 300 ˚C 700 ˚C
C 81.54 87.73 78.83
Ti 9.39 4.84 12.49
O 5.34 6.45 8.57
Pt 0.39 0.17 0.08
Cl 3.35 0.82 0.03
Cl/Pt ratio 8.6 4.8 0.4
Pt/Ti ratio 0.042 0.035 0.006

S20
Table S2. Surface elemental composition (% atomic concentration) of 0.5 wt% Pt/TiC
catalysts reduced at various temperatures determined by XPS analyses.
0.5 wt% Pt/TiC Reduced Temperature
Elements 100 ˚C 300 ˚C 500 ˚C 700 ˚C
C 78.57 77.61 76.16 68.91
Ti 9.21 9.89 11.49 13.82
O 11.12 11.93 11.86 17.11
Pt 0.15 0.11 0.11 0.08
Cl 0.95 0.46 0.37 0.07
Cl/Pt ratio 6.3 4.2 3.4 0.9
Pt/Ti ratio 0.016 0.011 0.010 0.006
S21
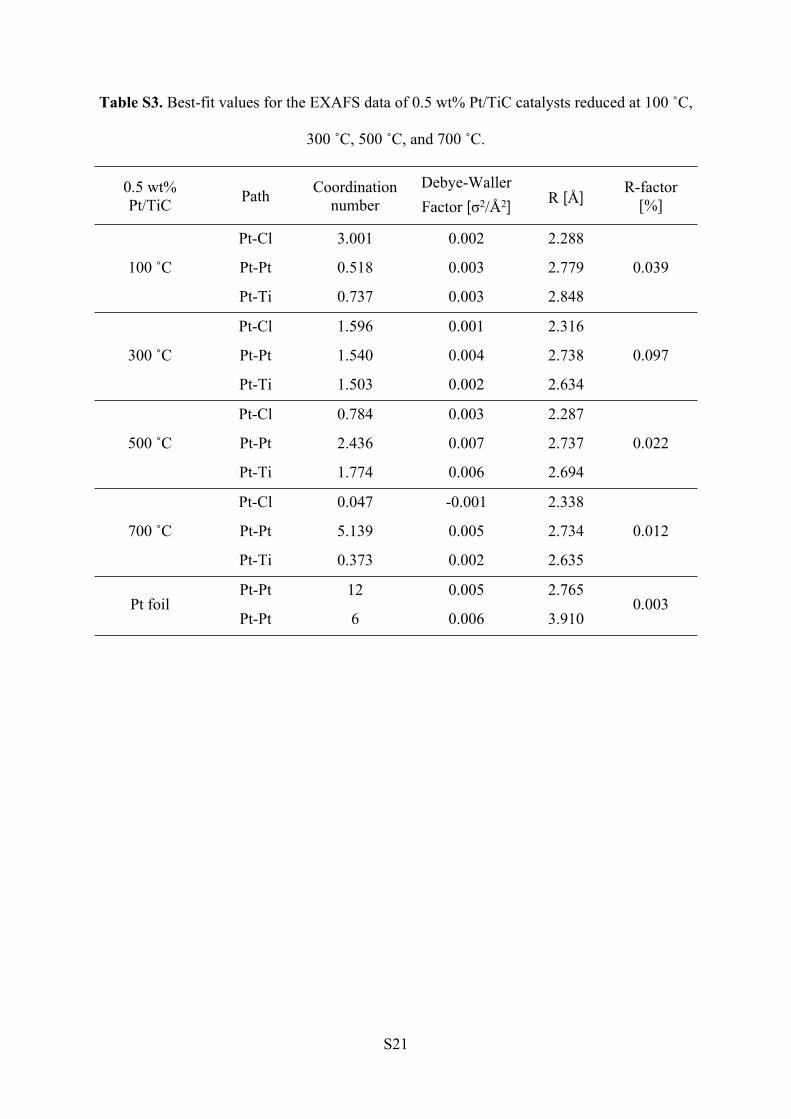
Table S3. Best-fit values for the EXAFS data of 0.5 wt% Pt/TiC catalysts reduced at 100 ˚C,
300 ˚C, 500 ˚C, and 700 ˚C.
0.5 wt% Pt/TiC Path Coordination
numberDebye-Waller Factor [σ2/Å2] R [Å]
R-factor [%]
Pt-Cl 3.001 0.002 2.288
Pt-Pt 0.518 0.003 2.779100 ˚C
Pt-Ti 0.737 0.003 2.848
0.039
Pt-Cl 1.596 0.001 2.316
Pt-Pt 1.540 0.004 2.738300 ˚C
Pt-Ti 1.503 0.002 2.634
0.097
Pt-Cl 0.784 0.003 2.287
Pt-Pt 2.436 0.007 2.737500 ˚C
Pt-Ti 1.774 0.006 2.694
0.022
Pt-Cl 0.047 -0.001 2.338
Pt-Pt 5.139 0.005 2.734700 ˚C
Pt-Ti 0.373 0.002 2.635
0.012
Pt-Pt 12 0.005 2.765Pt foil
Pt-Pt 6 0.006 3.9100.003

S22
References
[S1] M. D. Hall, G. J. Foran, M. Zhang, P. J. Beale and T. W. Hambley, J. Am. Chem. Soc.,
2003, 125, 7524-7525.