Hydrology and Hydrologic Analysis · Hydrology and Hydrologic Analysis . Hydrologic Cycle . ... These curves are often used to determine reliable sources of water and in the 對design
12
Greg Kruse Water Monitoring and Surveys Unit Hydrology and Hydrologic Analysis
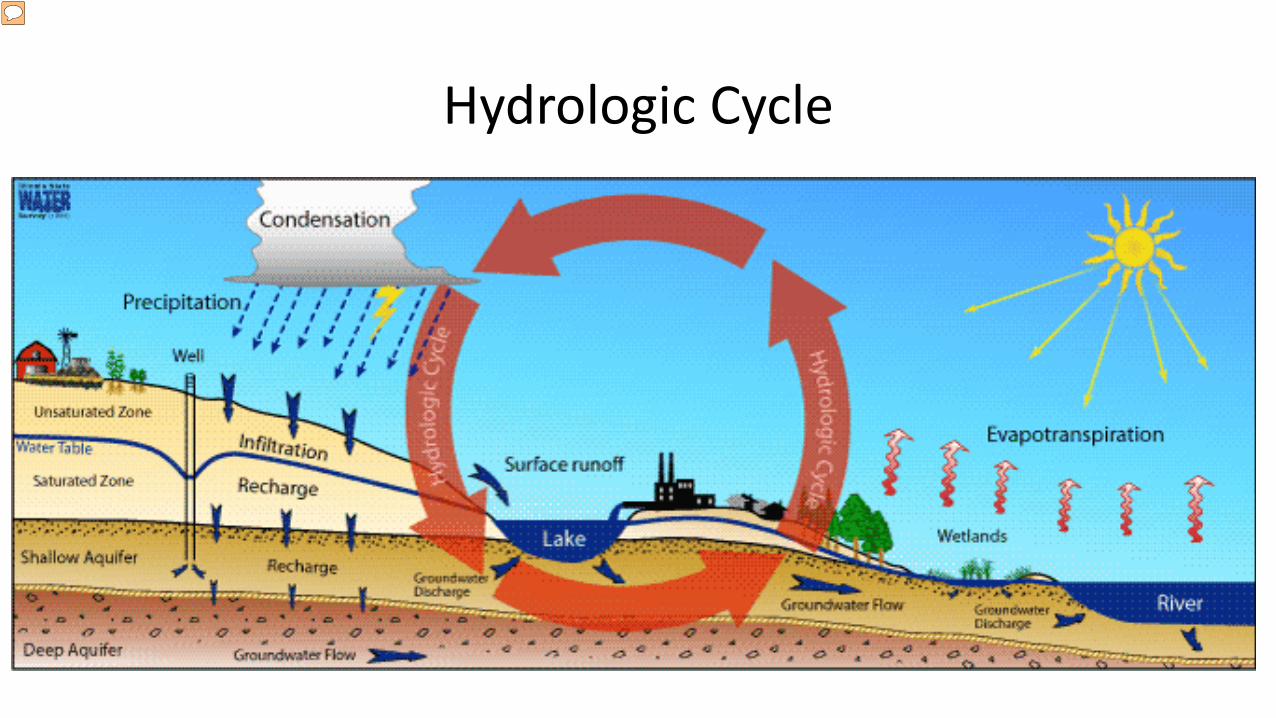
MN DNR Maintains monitoring networks to collect, store and analyze data on key components of the hydrologic cycle. Human activity changes the movement of water within the cycle. Example: groundwater use extracts water from its normal path to a wetland, lake or stream and redirects some of it into the atmosphere through ET. These changes to the natural process can have significant influences in some areas of the state - refer to a previous climate slide showing ET deficits for MN. (Graphic Source Reference: Illinois Water Survey)
Presenter
Presentation Notes
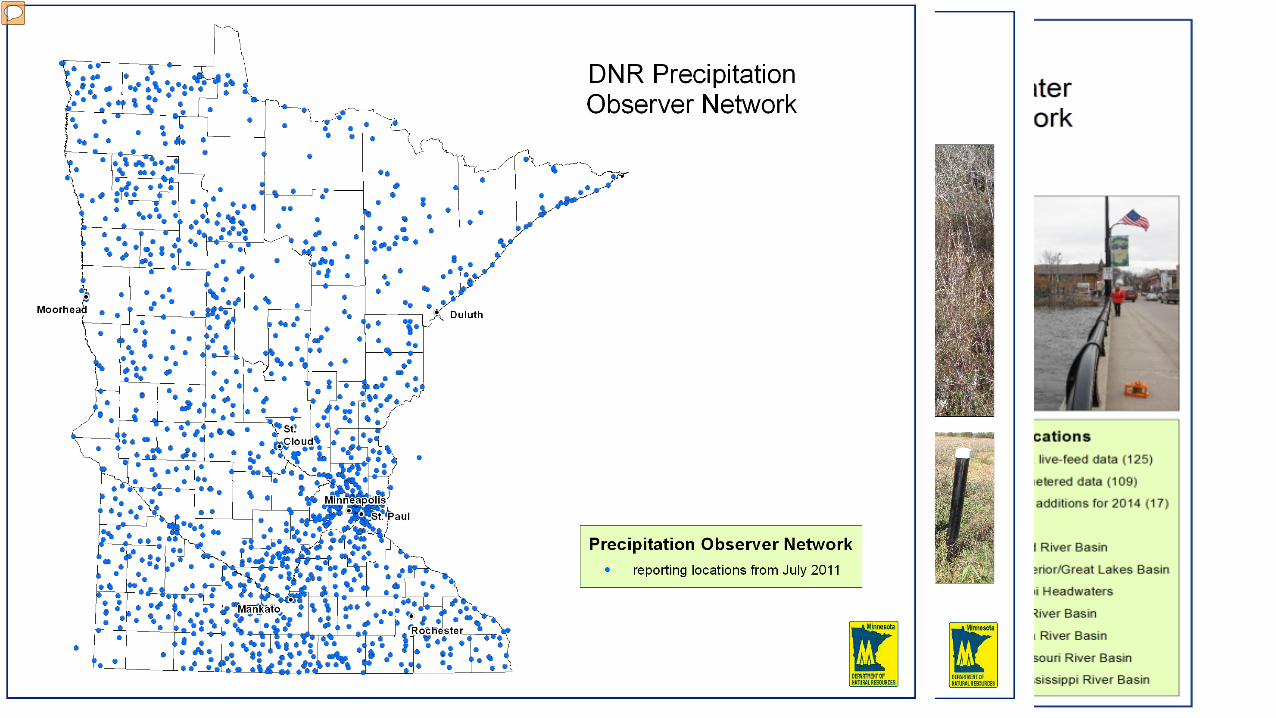
MN DNR Water Quantity Monitoring Networks: clockwise from upper left Approximately: Precipitation : 1500 Citizen observers Stream Flow: 280 gages Lakes Levels : 1000 gages Groundwater Levels: 960 observation wells
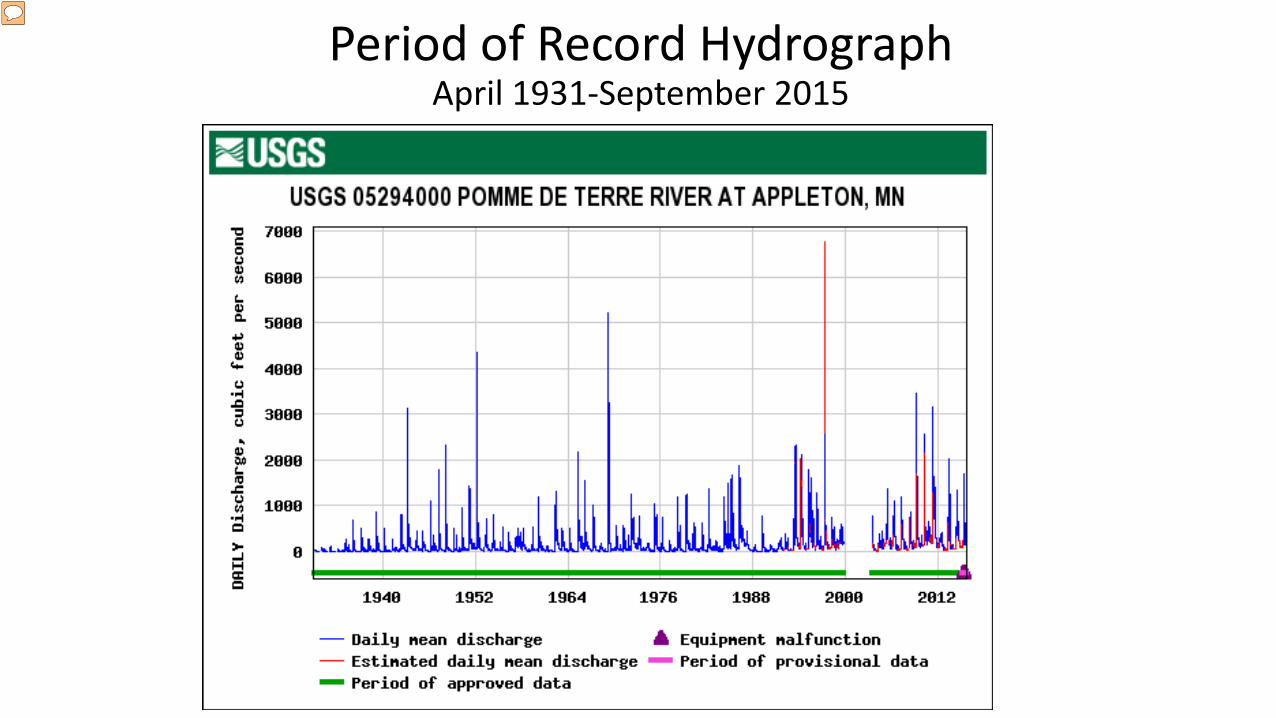
Period of Record Hydrograph April 1931-September 2015
Presenter
Presentation Notes
Long historical quantity records on a river, lake, wetland or aquifer provide a enough data to calculate event frequency, identify trends and evaluate water availability. We look at the past to give us a sense of what we may expect in the future.
0.1
1
10
100
1000
10000
0 10 20 30 40 50 60 70 80 90 100
Disc
harg
e (c
fs)
Percent Of Time Indicated Discharges Were Equaled or Exceeded
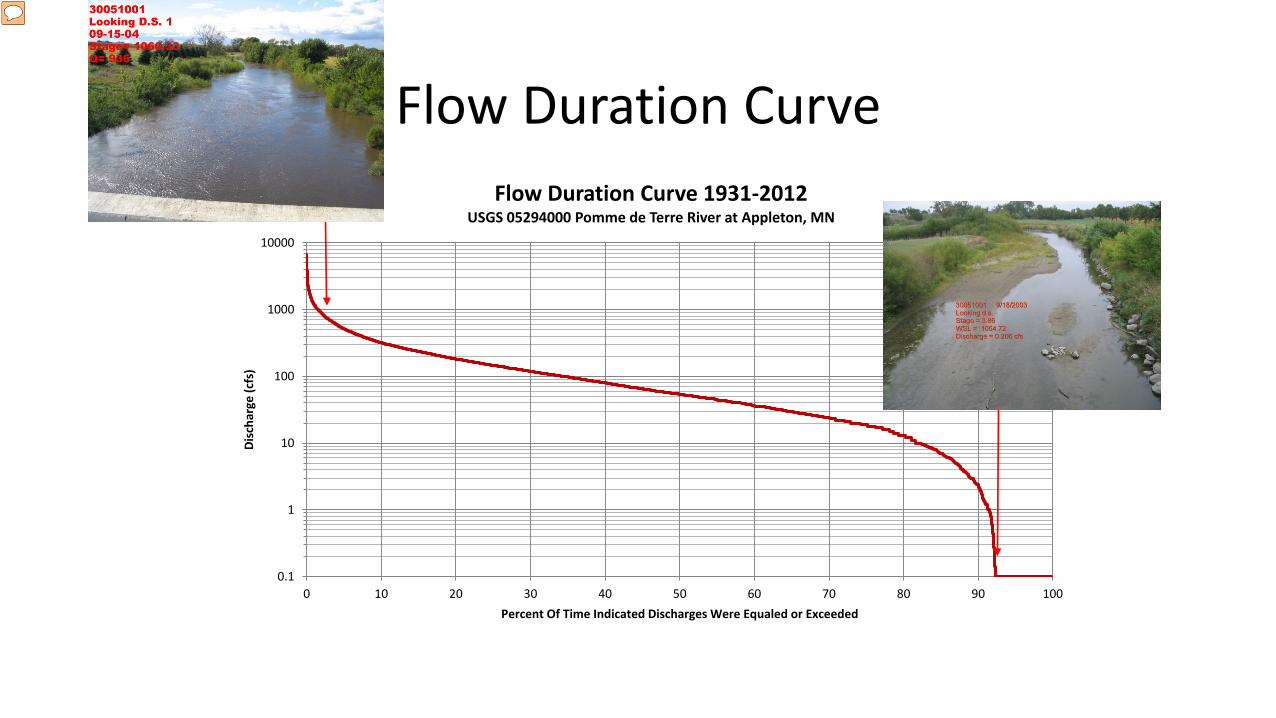
Flow Duration Curve 1931-2012 USGS 05294000 Pomme de Terre River at Appleton, MN
Flow Duration Curve
Presenter
Presentation Notes
Flow duration curves are used to show the percent of time during which specified discharges were equaled or exceeded in a given period. The above chart is the mean daily flow duration assessment the entire period of record for the Pomme de Terre River, USGS gage at Appleton, MN. It is useful in analysis because it integrates the effects of climate, topography and geology and gives us a indicator the watershed characteristics. These curves are often used to determine reliable sources of water and in the design and the placement facilities such as power plants, hydropower dams, ethanol plants and manufacturing facilities. A relatively flat slope throughout a curve suggests the presence of surface water storage or groundwater interaction. A steep slope like that at the low end of this curve indicates low perennial storage in the watershed. In this watershed baseflows/ low flows have risen in the past 30 years, so the slope of this curve may flatten on the low end if the trend continues. The flat slope toward the higher discharge end of this curve (5% to 25% exceedance) may be attributed to a few things: snowmelt events account for most of the high flow events and/or large floodplain or wetland storage. Concept Source: Manual of Hydrology: Part 2 Low Flow Techniques: 1542-A (http://pubs.usgs.gov/wsp/1542a/report.pdf)
0.1
1
10
100
1000
0 10 20 30 40 50 60 70 80 90 100
Disc
harg
e (c
fs)
Percent Of Time Indicated Discharges Were Equaled or Exceeded
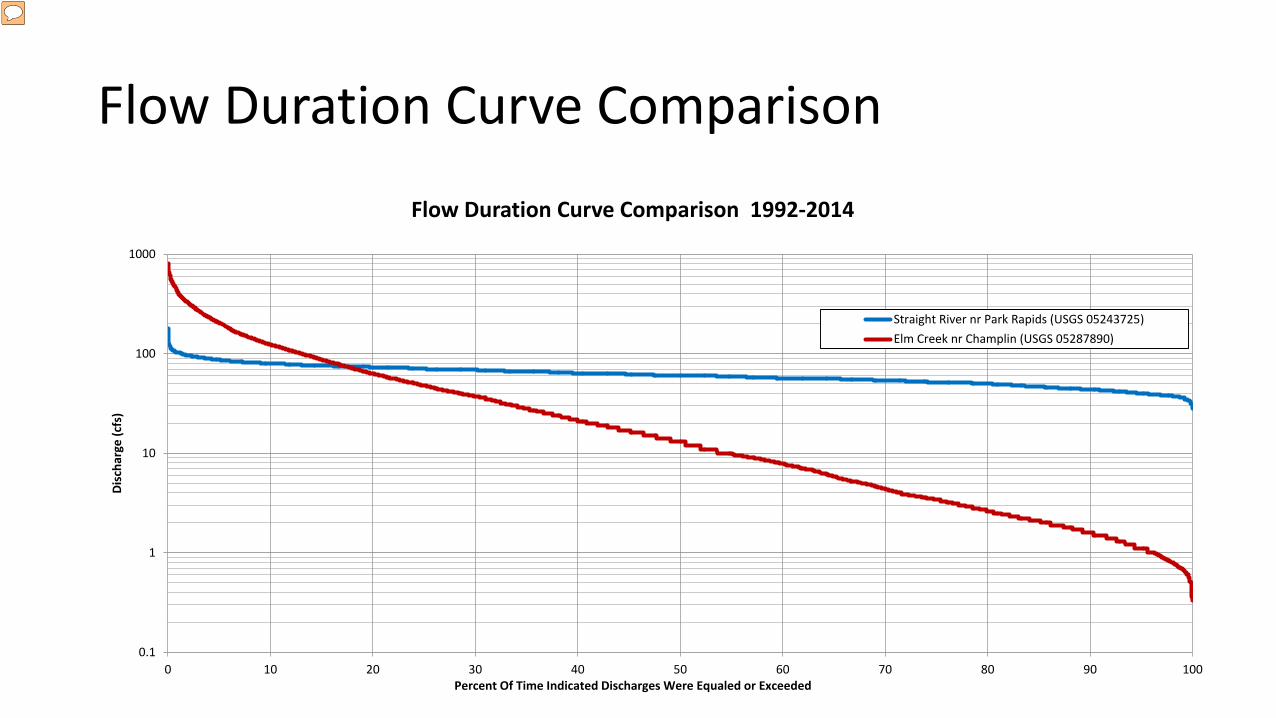
Flow Duration Curve Comparison 1992-2014
Straight River nr Park Rapids (USGS 05243725)Elm Creek nr Champlin (USGS 05287890)
Flow Duration Curve Comparison
Presenter
Presentation Notes
Duration Assessment Comparison of the USGS gages on smaller watershed. Watershed characteristics and the amount of water and timing are vastly different between these two. to upstream MPCA/DNR gage for period of overlapping record 2010-2012 Both curves have a flat slope at high flows indicating longer prolonged evens like snowmelt, large floodplain storage, or wetland areas. This matches what we know about the watershed, with the upper watershed having more lake storage and shows up flatter on the high flows. The relationship only deviates at the 90% exceedance level where the upstream site plateaus a little further, again likely from more groundwater and surface water sources in the upper watershed.
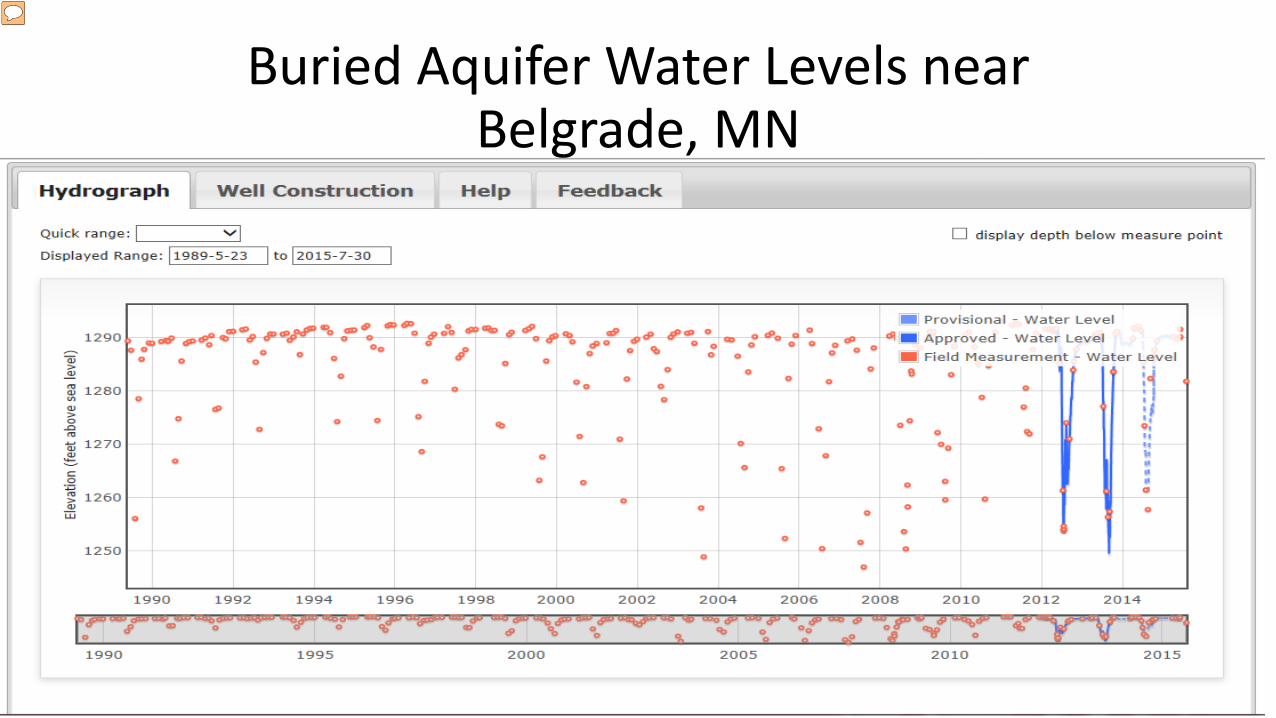
Buried Aquifer Water Levels near Belgrade, MN
Presenter
Presentation Notes
Annual minimum and maximum trends Minimum water levels continue to decline over time and occur at the peak of summer water appropriations Maximum water levels return to about the same level each year
0
10
20
30
40
50
60
70
80
Jan Feb Mar Apr May Jun Jul Aug Sep Oct Nov Dec
Days
0 c
fs o
ccur
ed
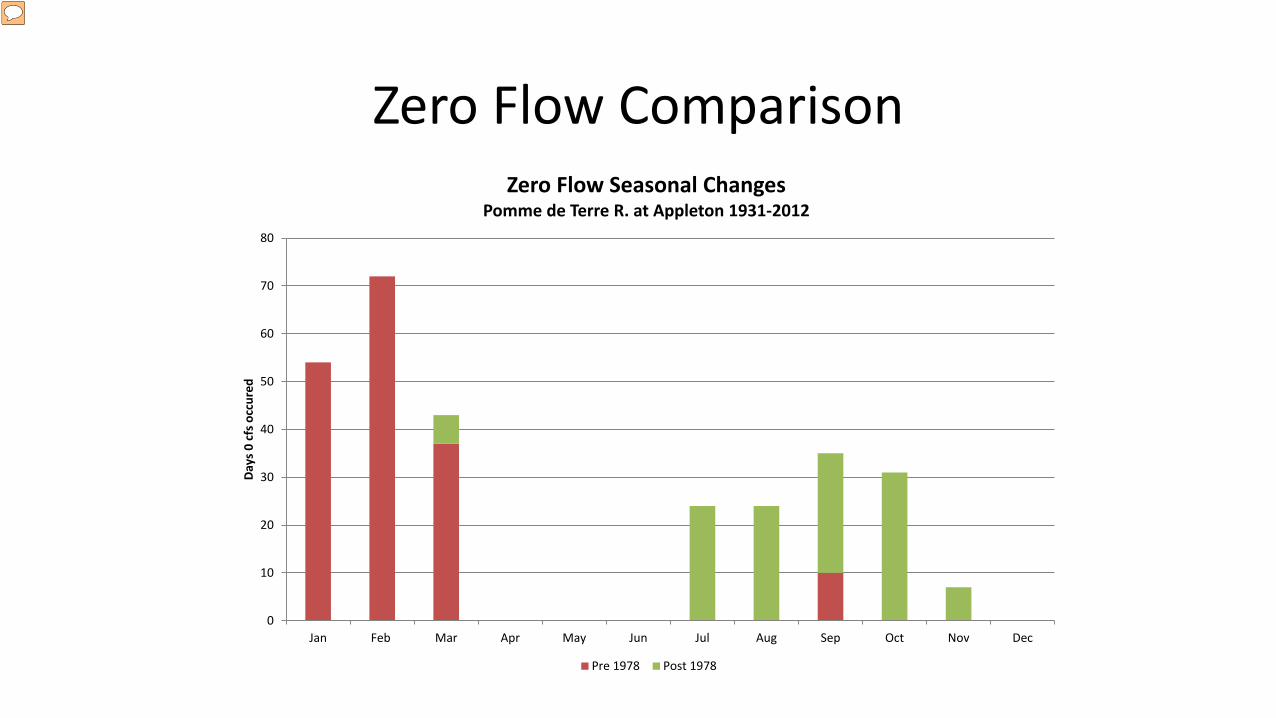
Zero Flow Seasonal Changes Pomme de Terre R. at Appleton 1931-2012
Pre 1978 Post 1978
Zero Flow Comparison
Presenter
Presentation Notes
Additional example of analysis Over the history of the USGS gage at Appleton, the Pomme de Terre river has gone to zero flow 306 days. The above graph is a review for the period of record pre and post 1978, when surface water and groundwater appropriation increased significantly. For the period prior to 1978 94% of the zero flow days occurred from 1934-1940 during the Dust Bowl drought. For the period post 1978 100% of the zero flow days occurred during the drought of 1988-1989. The significant difference between these two time periods is when these days of zero flow occurred during the year. The chart shows the vast majority of zero flow days in the 1930s occurred during the late winter as base flows decline to zero prior to spring snowmelt recharge. Conversely, in the peak appropriation years of 1988 and 1989 the majority of the zero flow days occurred in the Summer/Fall (95%). Changes in the watershed and water use since the 1930’s are reflected in changing trends in the hydrology of the watershed. Summary of analysis: Human activity has changed the dynamic of the hydrologic cycle Evapotranspiration and seasonal flow availability changed under similar climatic conditions.
Maps of the Watershed
Presenter
Presentation Notes
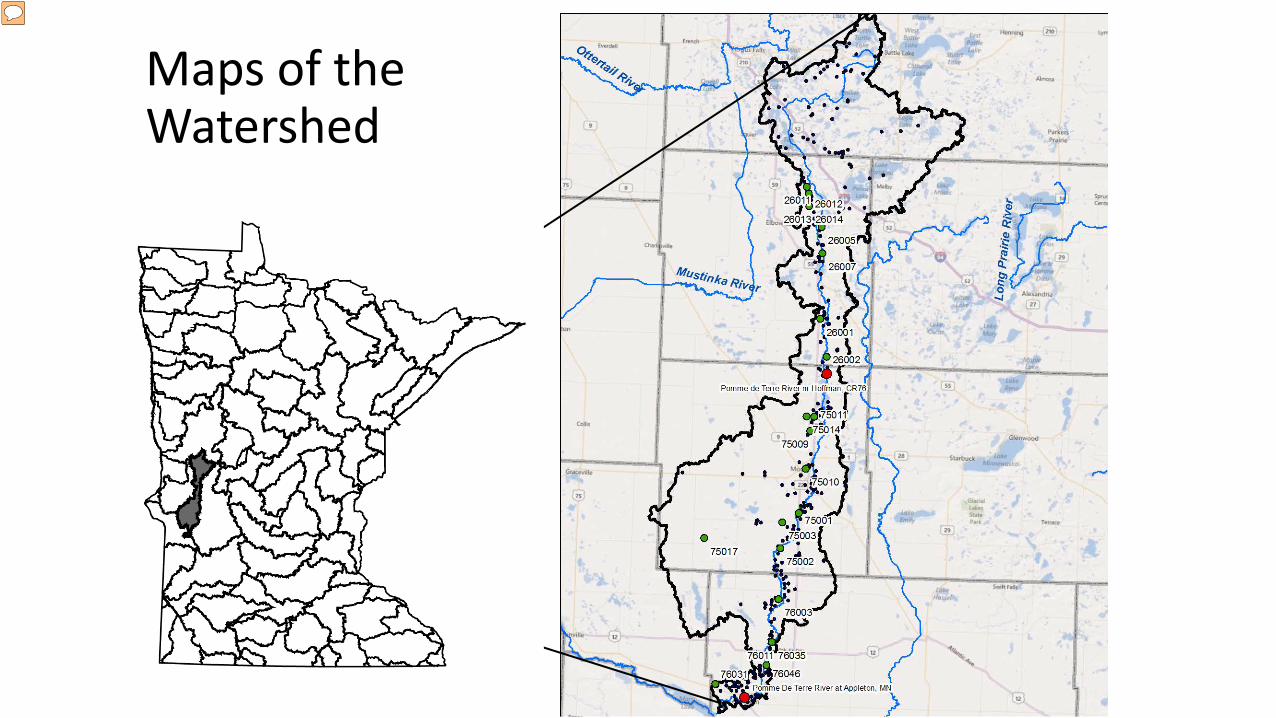
Overview map for a watershed comparison: Two stream gage locations used in the analysis Appropriations (purple) and observation wells (green) in the watershed The upper watershed has significantly more lakes than lower part of the watershed. The lower watershed is mostly cultivated and has a higher density of appropriations. The upper flow monitoring location’s (DNR/MPCA H23054001, 2010-current) drainage area = 397 sq. mi., approximately 40% of the downstream USGS long term station (USGS 05294000, 1931-current) at 905 sq. mi. Note: Analysis done in 2013 using 2012 data and prior overlapping years only.
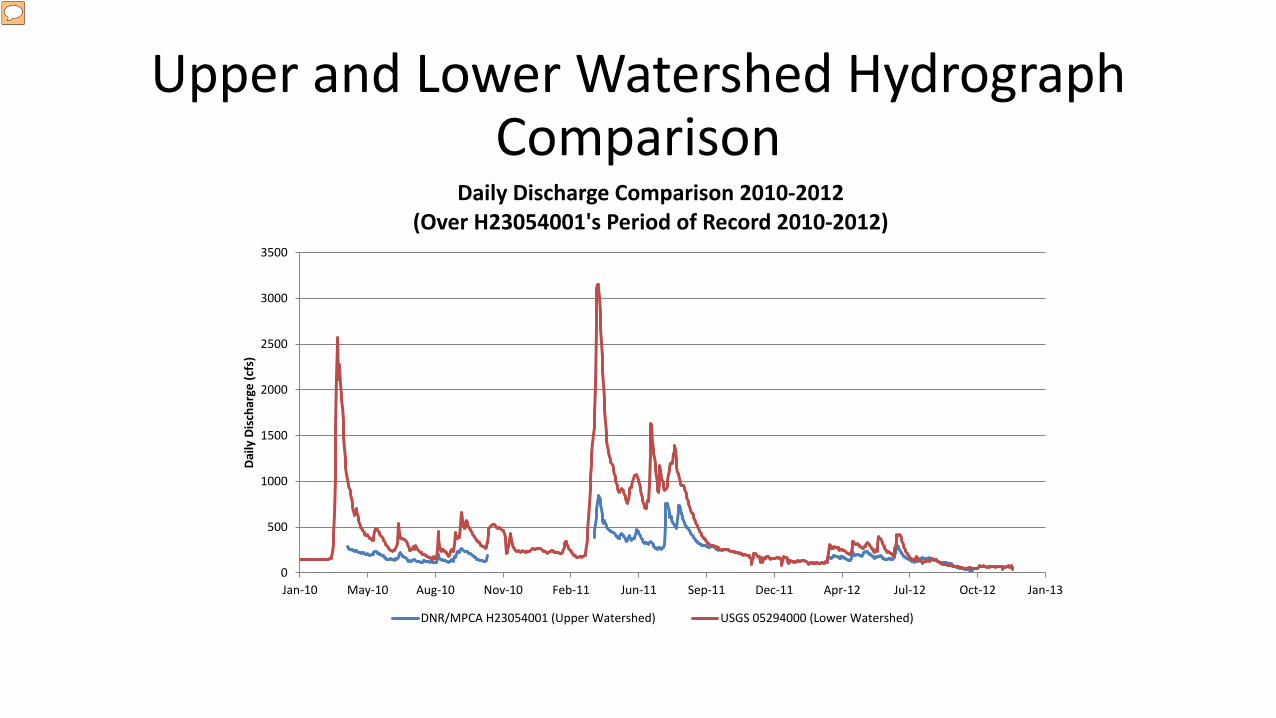
Hydrograph comparison of the 2 surface water monitoring sites. A comparison of data from 2010-2012 (3 years). Large rain events and snowmelts result greater discharges downstream than the upstream. In 2012 a drought brought both sites to similar base flow discharges. These differences in run off conditions reflect the watershed characteristics of the two monitoring sites.
Flow Duration Curve Comparison
10
100
1000
10000
0 10 20 30 40 50 60 70 80 90 100
Disc
harg
e (c
fs)
Percent Of Time Indicated Discharges Were Equaled or Exceeded
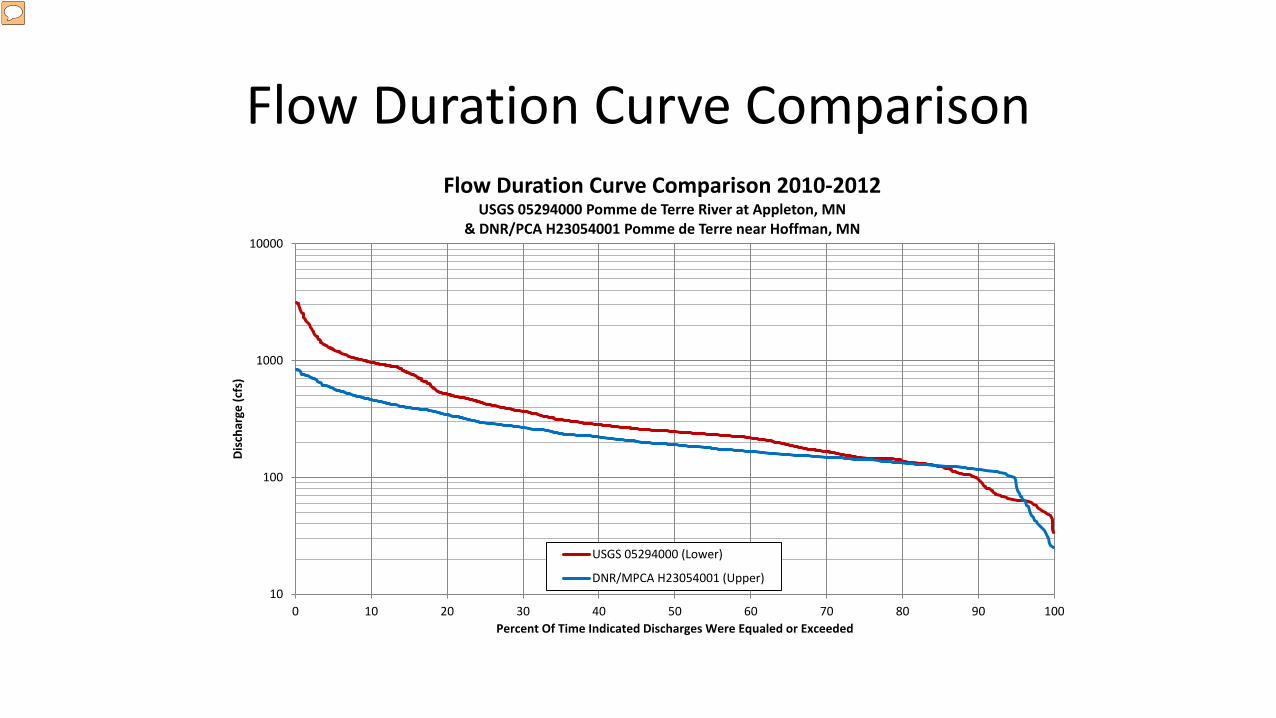
Flow Duration Curve Comparison 2010-2012 USGS 05294000 Pomme de Terre River at Appleton, MN
& DNR/PCA H23054001 Pomme de Terre near Hoffman, MN
USGS 05294000 (Lower)
DNR/MPCA H23054001 (Upper)
Presenter
Presentation Notes
Both curves have relatively flat slopes at high flows indicating longer prolonged events like snowmelt, large floodplain storage, or wetland areas. The upper watershed has a larger storage component reflected in the flatter slope at exceedences less than 10 percent compared to the lower watershed. The two locations also deviates at the 90% discharege where the upstream site plateaus a little further, again likely from more groundwater and surface water base flow sources when compared to the lower watershed.