reading borough local plan 2013-2036 … borough local plan 2013-2036 housing implementation...
TRANSCRIPT

READING BOROUGH LOCAL PLAN 2013-2036
HOUSING IMPLEMENTATION STRATEGY
March 2018
1

CONTENTS
1. Introduction 3
2. Approach 4
3. Current Five-Year Housing Land Supply 10
4. Housing Trajectory across Plan Period 15
5. Predicted Five-Year Housing Land Supply across Plan Period 24
6. Maintaining a Five-Year Housing Land Supply across Plan Period 26
2
1. INTRODUCTION 1.1 The production of a Housing Implementation Strategy is a requirement of the
National Planning Policy Framework (NPPF). Paragraph 47 of the NPPF states that local planning authorities will
“for market and affordable housing, illustrate the expected rate of housing delivery through a housing trajectory for the plan period and set out a housing implementation strategy for the full range of housing describing how they will maintain delivery of a five-year supply of housing land to meet their housing target;”
1.2 As such, a Housing Implementation Strategy pulls together various evidence on
housing delivery to accompany the Local Plan.
1.3 This Strategy will firstly demonstrate that a five-year supply of housing exists at the point of production of the Local Plan, when measured against the housing targets in policy H1. Policy H1 of the Pre-Submission Draft Local Plan (November 2017) states that an average of 671 dwellings will be delivered per annum between 2013 and 2036.
1.4 The Strategy then sets out the full Housing Trajectory for the plan period up to 2036, to set out the housing supply across the timeframe of the Local Plan.
1.5 In accordance with the NPPF, the Strategy then assesses how the five-year housing land supply will change from year to year across the plan period, and whether there are expected to be points where the supply drops below five years.
1.6 Finally, the Strategy considers measures that can be taken to ensure that the Local Plan housing targets continue to be met.
3

2. APPROACH 2.1 Whilst the production of a five-year housing land supply and housing trajectory
follow standard methodologies, there are a number of key decisions and assumptions that have been made, and this section sets these out for clarity.
2.2 It is important to note that the five-year supply and the housing trajectory (together with the Housing and Economic Land Availability Assessment, November 2017) all use the same basic information and approach, to ensure consistency across all evidence. The three pieces of work are heavily inter-related. In terms of expected timescales of delivery, the five-year supply is based on a five-year extract from the housing trajectory.
Buffer
2.3 Paragraph 47 of the NPPF states that, in calculating five year housing land supply,
an additional buffer (moved forward from later in the plan period) should be included to ensure choice and competition. In general, this should be 5%, but, where there has been a record of persistent under-deliver of housing, this should be increased to 20% to provide a realistic prospect of achieving the planned supply. It must therefore be determined whether a 5% or 20% buffer should be applied in Reading. Table 1: Delivery compared to requirements, 1997-2017 Year Delivery Requirement Over/under
provision 1997-1998 467 350 +117 1998-1999 538 350 +188 1999-2000 731 350 +381 2000-2001 371 350 +21 2001-2002 747 350 +397 2002-2003 574 350 +224 2003-2004 761 350 +411 2004-2005 1177 350 +827 2005-2006 656 402 +254 2006-2007 637 514 +123 2007-2008 837 514 +323 2008-2009 782 572 +210 2009-2010 693 611 +82 2010-2011 321 611 -290 2011-2012 312 611 -299 2012-2013 474 611 -137 2013-2014 361 572 -211 2014-2015 635 572 +63 2015-2016 751 572 +179 2016-2017 717 699 +18 Average 1997-2017 627 483 +144
2.4 The housing requirements against which delivery should be measured are those
that were in place at the beginning of the monitoring year. These were as follows: • 1997-2005: Berkshire Structure Plan 1991-2006 set a figure of 5,250 for Reading
for 1991-2006 (350 per annum); • 2005-2008: A replacement Berkshire Structure Plan was adopted in 2005, and
this sets figures of 2,010 homes from 2001-2006 (402 per annum), 2,570 from
4

2006-2011 (514 per annum) and 2,570 again between 2011 and 2016 (514 per annum);
• 2008-2009: Reading’s Core Strategy was adopted in January 2008, and this set targets of 572 per annum between 2006 and 2016 and 521 per annum between 2016 and 2026;
• 2009-2013: The housing figures in the Core Strategy were superseded in 2009 by the production of the South East Plan in May 2009, which set a target of 611 per annum for Reading;
• 2013-2016: The South East Plan was revoked in 2013, which meant a reversion to the Core Strategy figures for this period.
• 2016-2017: Although the Core Strategy remains the adopted development plan for this period, the publication of the Berkshire SHMA in February 2016 with an objectively assessed need of 699 per annum in Reading arguably meant that housing supply should be considered against this need in accordance with the NPPF.
2.5 Table 1 shows that, in general, Reading has delivered well against housing
requirements. On average, over the twenty years period, there has been an annual overprovision of 144 dwellings against targets. In the twenty years, there have been only four years of under-delivery, which made up the four-year period between 2010 and 2014. The reason for this is not due to a lack of developable land, as levels of permitted homes where development had not started were around 3,000 at this time, but rather was related to the recession. The recession significantly affected housebuilding in Reading, particularly on the complex town centre brownfield sites on which Reading depends. However, housing delivery has bounced back well since 2014, and there is no reason to believe that this will not continue for the immediate future.
2.6 Therefore, in general Reading has an excellent record of delivery against
requirements, and it is appropriate to apply a 5% buffer to assess five year housing land supply.
Approach to past under-provision 2.7 When calculating five year housing land supply, there are two possible methods for
how to account for any past under-provision within the plan period. 2.8 The first method is to make up that provision over the entire rest of the plan
period, which in the case of the Reading Borough Local Plan would be up to 2036. This is commonly known as the ‘Liverpool’ approach.
2.9 The alternative method is to make up the shortfall during the next five years of the
plan period, and in this case that would mean prior to 2023. This is commonly known as the ‘Sedgefield’ method.
2.10 There has been a great deal of debate in appeals on which method is preferable,
and much has depended on the particular circumstances of the local authority. The general view seems to be that the ‘Sedgefield’ method is preferable unless it would result in figures that would not be deliverable. In Reading’s case, the shortfall is comparatively small, and the ‘Sedgefield’ approach is therefore used here.
5

Windfalls 2.11 Windfalls are sites which have not previously been identified and which do not
make up part of the identified supply. A reliance on windfalls must be adequately justified by evidence.
2.12 We consider that there is a clear case for an allowance for small site windfalls of
below ten dwellings. The cut-off for Local Plan allocations and for the HELAA is ten dwellings, and it is therefore logical to assume that smaller sites will continue to come forward in addition. Over the last 15 years (2002-2017), an average of 147 small site windfalls have been completed each year, as set out in Table 2 below. What is also notable is just how robust these figures are, in that they do not decrease to the same extent as larger developments at times when completions overall were badly hit by the recession (2009-2012).
2.13 However, this supply of small site windfalls has included an element of
development of residential gardens. Paragraph 48 of the NPPF states that local authorities should not include development of gardens within a windfall allowance when calculating 5-year housing land supply. Removing past small site windfalls on garden land therefore gives a revised average of 127 dwellings per year1.
Table 2: Completions on small windfall sites
Year Homes completed on small windfall
sites (<10 dwellings)
Of which on garden land
Homes completed on small windfall
sites not including garden land
2002-2003 164 25 139 2003-2004 140 38 102 2004-2005 141 38 103 2005-2006 152 11 141 2006-2007 157 43 114 2007-2008 177 30 147 2008-2009 203 43 160 2009-2010 193 23 170 2010-2011 134 12 122 2011-2012 117 4 113 2012-2013 134 6 128 2013-2014 114 8 106 2014-2015 155 16 139 2015-2016 127 9 118 2016-2017 103 6 97 Average 1997-2017 147.4 20.8 126.6
2.14 No allowance is made for windfalls of more than ten dwellings. It is our experience
that such larger windfalls are a regular feature of development in Reading, with changes in a fast-moving market meaning that sites in existing use that had not been anticipated to have particular development potential come forward for development quite quickly. Nevertheless, it is considered that process of identifying sites within the HELAA is more thorough than was often the case in the past, and it is not therefore proposed to rely on larger windfalls for housing.
1 A longer time period for calculating windfalls, e.g. 20 years, could be seen as more robust. However, the Council does not hold reliable records of which small sites before 2001-2 constituted garden land, and it is therefore preferable to rely on a 15 year period.
6

Housing potential of specific sites 2.15 Where planning permission has not yet been granted, the potential of specific sites
to deliver new housing has been taken from the HELAA, where a full analysis of each site has been carried out. The HELAA formed the basis for the allocations of sites, and in general the Local Plan dwelling range on allocated sites is 20% either side of the HELAA figure. Therefore, as the HELAA figure is the usually mid-point for the dwelling range on allocated sites, this is the figure that is used in the following sections.
Non-Implementation Rates 2.16 Non-implementation or lapse rates are a means of discounting predicted delivery to
take account of the fact that not all sites come forward, or come forward in the form expected. It is considered reasonable to include these rates, as otherwise the process would be unlikely to reflect actual delivery on the ground.
2.17 Non-implementation rates are set for each site through the HELAA process, taking
into account whether the owners or developers have confirmed availability, and are as follows: • Development commenced – 0% • Planning permission granted and availability confirmed – 0% • Planning permission granted but availability not confirmed – 10% • No planning permission but availability confirmed – 10% • No planning permission and availability not confirmed – 20% On occasion, where a mix of these statuses is present on different parts of a single site, a rate of 5 or 15% is used. The detailed tables for the housing trajectory clarify which rate has been used for which site.
2.18 It has not been possible to base this on an analysis of past non-implementation
rates. Calculating such past rates is an extremely complex matter. The Council does monitor number of permissions that lapse in any given year, but in general the issue is not so much that permissions lapse, but that consents are legally implemented with some minor works, or periodically renewed, and then the site sits untouched for many years, or that existing permissions are superseded by new permissions with fewer dwellings or no dwellings at all. There is no straightforward way to calculate this. Past experience is that the rates above appear to be largely robust.
Delivery rates 2.19 By and large, assumptions about delivery rates are based on what was assessed
through the HELAA process which, for allocated sites, informed the development timelines in Chapter 10 of the Local Plan. The HELAA process involved a questionnaire around availability and achievability being sent to landowners or developers. Only around half of landowners responded, so for the rest of the sites, assumptions had to be made based on any other site knowledge, such as through pre-application discussions or application processes, or through Local Plan representations made.
2.20 Where a site has planning permission, there is usually much better information
available, particularly where development is already underway. For this reason, the earlier in the plan period the more accurate the housing figure is likely to be.
7
For sites that are not yet started, unless there is good reason to believe otherwise, it is assumed that development will begin before the permission expires.
2.21 For proposed allocations in the Local Plan, Chapter 10 of the plan contains Figure
10.1, in which the delivery of the proposals is allocated to five year periods – short (2016-2021), medium (2021-2026) and long (2026-2031 and 2031-2036) term. Where no further information is available, the housing trajectory spreads the delivery of those sites across the whole of the relevant period. In reality, for smaller sites, the whole development may be delivered within a single year, but it is rarely possible to identify a specific year this far in advance, so this approach allows for such issues to be smoothed out. Where allocations are expected to come forward in the short term, there is often more information available that allows specific figures in specific years to be identified.
Other forms of residential 2.22 There are a variety of other forms of residential that do not fit in the C3 use class
and are not therefore usually picked up in the annual residential commitment monitoring, but which nevertheless provide an important supply of residential. Planning Practice Guidance clarifies that housing provision should take account of housing for older people, which may be within the C2 residential institution use class. It also states that student accommodation can count towards the housing requirement on the basis that it frees up other housing. Our approach also takes account of houses in multiple occupation (which forms an important source of accommodation in Reading) and other residential institutions. The key is that these should only be included as part of the supply if they have also been factored into need, to ensure consistency.
2.23 The different sources of housing have been dealt with as follows:
• Student accommodation The SHMA looked at whether there is a need for new student housing in Reading to 2036, and did not identify any, although this is clearly very dependent on any growth at the University. Therefore, no additional need is added. Our approach assumes that four student bedspaces equate to one dwelling. This is based on the fact that, where students occupy traditional housing, it tends to be terraced housing close to the University for 3-5 people.
• Houses in Multiple Occupation The approach to HMOs is largely similar to that for student accommodation. Small C4 HMOs are already counted as ‘dwellings’ in our monitoring anyway. For larger ‘sui generis’ HMOs, it is considered that, where it is a cluster of bedrooms in a dwelling style with shared kitchen and living facilities, it is equivalent to a single dwelling. Where it is bedsits with shared toilet facilities, it is assumed that four bedsits equates to one dwelling. There is no additional need for HMOs identified in the SHMA.
• Residential care and other accommodation for older people Some accommodation for older people, such as extra care housing, tends to count as a C3 dwelling anyway, where it is a wholly self-contained residential unit, and this section does not therefore apply in those cases.
8
Provision of residential care, or other specialist housing for older people also potentially frees up existing housing to help meet needs. However, it will not be the case that each residential care (or equivalent) space equates to one dwelling. A partner may stay living in the main home, for instance, or someone may move into care after living with family, either in the main home or in an annexe. The assumption has been made that entirely self-contained units free up one dwelling, whereas in care accommodation with shared facilities, two new residential care spaces free up one new home. The SHMA has also identified a fairly limited need for new residential care on top of the overall housing need, of 253 bedspaces over the whole plan period. Using the two to one ratio above, a need of 127 over the plan period (or 6-7 per annum), as identified in policy H6 of the Local Plan, is added to the overall housing requirement set out in policy H1. This raises the annual requirement from 671 to 676-677.
2.24 No allowance is made for empty homes. Planning Practice Guidance is clear that
the use of empty homes in such calculations would need to be robustly justified, and it is not considered that such an approach can be supported in Reading by the evidence. Serviced apartments, which are a common feature of central Reading, are also excluded, as these are not considered to relate to Reading’s general housing need.
Additional allowances 2.25 A need has been identified for a new six-form entry secondary school. Work is
underway on examining candidate sites for providing this new school, but it is clear that whichever site is chosen, it will almost certainly one which has already been considered within the HELAA process, and probably one that is considered suitable for another form of development such as housing. Therefore, until such time as a site is identified, this needs to be taken into account within the overall figures as a general allowance as a reduction in housing supply.
2.26 Initial work has indicated that a site of around 0.6 ha could be sufficient to
accommodate the necessary buildings. The focus for seeking to identify a site will be in and around the town centre, and likely to be a site in a location on the fringe of the town centre. For this reason, the overall loss of housing that would result could be calculated using the town centre fringe density of 200 dph, which on a site of 0.6 ha would mean a loss of 120 dwellings.
9

3. CURRENT FIVE-YEAR HOUSING LAND SUPPLY 3.1 The first step in assessing whether a five-year supply can be maintained across the
plan period is to assess whether it exists at the beginning of the plan period. The most recent full monitoring of development progress was at 31st March 2017, and this therefore forms the base date. The relevant five year period would be from 2018-2023, and the Local Plan is expected to be adopted during the first year of that period.
3.2 Table 3 summarises the five year housing land supply situation for 2018-23, and
Table 4 itemises the sites that contribute towards this supply. It should be noted that this is a different calculation from the five-year supply set out in the 2017 Annual Monitoring Report showing a 5.23 years supply, because the AMR version is measured against a different requirement (the objectively assessed need of 699 per annum) and includes only existing allocated sites in the Sites and Detailed Policies Document and Reading Central Area Action Plan, rather than proposed allocated sites in the new Local Plan. The AMR version also excludes consideration of non-C3 forms of residential.
3.3 It can be seen that for the five-year period, a 6.60 years’ supply can be
demonstrated.
10
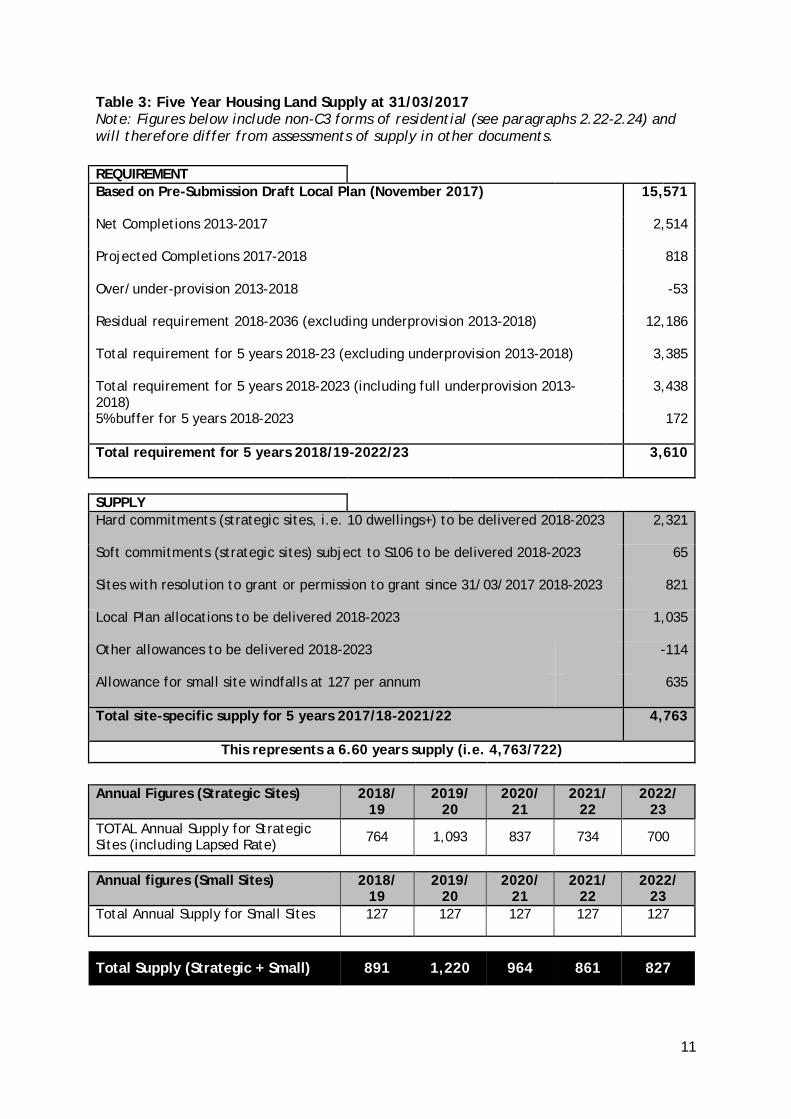
Table 3: Five Year Housing Land Supply at 31/03/2017 Note: Figures below include non-C3 forms of residential (see paragraphs 2.22-2.24) and will therefore differ from assessments of supply in other documents. REQUIREMENT Based on Pre-Submission Draft Local Plan (November 2017)
15,571
Net Completions 2013-2017
2,514
Projected Completions 2017-2018
818
Over/under-provision 2013-2018
-53
Residual requirement 2018-2036 (excluding underprovision 2013-2018)
12,186
Total requirement for 5 years 2018-23 (excluding underprovision 2013-2018)
3,385
Total requirement for 5 years 2018-2023 (including full underprovision 2013-2018)
3,438
5% buffer for 5 years 2018-2023
172
Total requirement for 5 years 2018/19-2022/23
3,610
SUPPLY Hard commitments (strategic sites, i.e. 10 dwellings+) to be delivered 2018-2023
2,321
Soft commitments (strategic sites) subject to S106 to be delivered 2018-2023
65
Sites with resolution to grant or permission to grant since 31/03/2017 2018-2023
821
Local Plan allocations to be delivered 2018-2023
1,035
Other allowances to be delivered 2018-2023
-114
Allowance for small site windfalls at 127 per annum
635
Total site-specific supply for 5 years 2017/18-2021/22
4,763
This represents a 6.60 years supply (i.e. 4,763/722) Annual Figures (Strategic Sites) 2018/
19 2019/
20 2020/
21 2021/
22 2022/
23 TOTAL Annual Supply for Strategic Sites (including Lapsed Rate) 764 1,093 837 734 700
Annual figures (Small Sites) 2018/
19 2019/
20 2020/
21 2021/
22 2022/
23 Total Annual Supply for Small Sites 127 127 127 127 127
Total Supply (Strategic + Small) 891 1,220 964 861 827
11
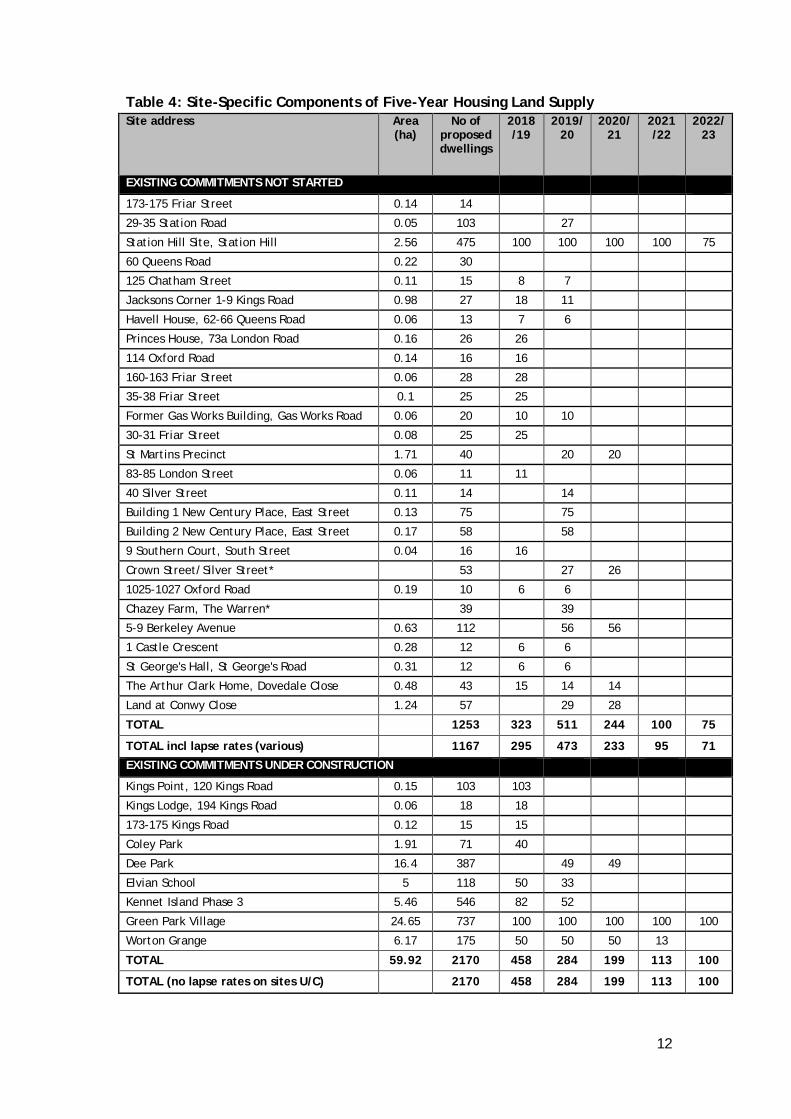
Table 4: Site-Specific Components of Five-Year Housing Land Supply Site address Area
(ha) No of
proposed dwellings
2018/19
2019/20
2020/21
2021/22
2022/23
EXISTING COMMITMENTS NOT STARTED 173-175 Friar Street 0.14 14
29-35 Station Road 0.05 103 27
Station Hill Site, Station Hill 2.56 475 100 100 100 100 75
60 Queens Road 0.22 30
125 Chatham Street 0.11 15 8 7
Jacksons Corner 1-9 Kings Road 0.98 27 18 11
Havell House, 62-66 Queens Road 0.06 13 7 6
Princes House, 73a London Road 0.16 26 26
114 Oxford Road 0.14 16 16
160-163 Friar Street 0.06 28 28
35-38 Friar Street 0.1 25 25
Former Gas Works Building, Gas Works Road 0.06 20 10 10
30-31 Friar Street 0.08 25 25
St Martins Precinct 1.71 40 20 20
83-85 London Street 0.06 11 11
40 Silver Street 0.11 14 14
Building 1 New Century Place, East Street 0.13 75 75
Building 2 New Century Place, East Street 0.17 58 58
9 Southern Court, South Street 0.04 16 16
Crown Street/Silver Street* 53 27 26
1025-1027 Oxford Road 0.19 10 6 6
Chazey Farm, The Warren* 39 39
5-9 Berkeley Avenue 0.63 112 56 56
1 Castle Crescent 0.28 12 6 6
St George's Hall, St George's Road 0.31 12 6 6
The Arthur Clark Home, Dovedale Close 0.48 43 15 14 14
Land at Conwy Close 1.24 57 29 28
TOTAL 1253 323 511 244 100 75
TOTAL incl lapse rates (various) 1167 295 473 233 95 71
EXISTING COMMITMENTS UNDER CONSTRUCTION Kings Point, 120 Kings Road 0.15 103 103
Kings Lodge, 194 Kings Road 0.06 18 18
173-175 Kings Road 0.12 15 15
Coley Park 1.91 71 40
Dee Park 16.4 387 49 49
Elvian School 5 118 50 33
Kennet Island Phase 3 5.46 546 82 52
Green Park Village 24.65 737 100 100 100 100 100
Worton Grange 6.17 175 50 50 50 13
TOTAL 59.92 2170 458 284 199 113 100
TOTAL (no lapse rates on sites U/C) 2170 458 284 199 113 100
12

PERMITTED SUBJECT TO S106 Alexander House, 205-207 Kings Road 0.16 56 28 28
Warwick House, Warwick Road 0.15 10 10
TOTAL 0.31 66 0 38 28 0 0 TOTAL incl lapse rates (various) 65 0 37 28 0 0
GRANTED/RESOLUTION TO GRANT SINCE 31/03/2017 Napier Road Junction 315 158 157
3-4 Wesley Gate, Queens Road 14 14
Clarendon House, 59-75 Queens Road 49 25 24
Crown Street and Silver Street (uplift) 27 14 13
79 Silver Street* 14 14
Aspen House, Kings Road 78 78
72 Bath Road 13 13
Land at the Madejski Stadium 618 100 100 100 100
TOTAL 1,128 13 311 386 100 100 TOTAL incl lapse rates (various) 1,017 12 280 349 90 90
LOCAL PLAN ALLOCATIONS WITHOUT PLANNING PERMISSION CR11a: Friar Street & Station Road (remainder) 1.36 67 23 22
CR11b: Friars Walk & Greyfriars Rd (remainder) 0.48 96 10 10
CR11e: North of the Station 6.71 634 43 43
CR11g: Riverside 1.24 255 26 26
CR11i: Napier Court 261 18 18
CR12b: Gr Knollys St & Weldale St 2.53 329 33 33 CR12c: Chatham Street, Eaton Place and Oxford Road 188 38 38
CR13a: Reading Prison 1.44 80 16 16
CR13b: Forbury Retail Park 6.66 1153 77 77
CR13c: Forbury Bus Pk/Kenavon Dr 2.07 156 32 31
CR13d: Gas Holder 0.71 58 12 12
CR14a: Central Pool, Battle Street 97 20 20
CR14b: Reading Family Centre 0.23 19 4 4
CR14c: 17-23 Queen Victoria Street 13 13 CR14d: 173-175 Friar Street and 27-32 Market Place 53 27 26
CR14f: 1-5 King Street 20 4 4
CR14h: Central Club, London Street 10 2 2
CR14i: Enterprise House, 89-97 London Street 10 2 2
CR14j: Corner of Crown St/Southampton St 0.08 16 4 3
CR14k: Crown St/Silver St (remainder) 0.38 4 1 1
CR14l: 187-189 Kings Road 27 14 13
CR14m: Caversham Lock Island -1 -1
SR4b: Rear of 3-29 Newcastle Road 22 3 3
WR3a: Former Cox & Wyman, Cardiff Road 89 13 13
WR3e: Yeomanry House, Castle Hill 12 3 3
WR3f: 4 Berkeley Avenue 12 3 3 WR3g: 211-221 Oxford Rd & Prospect Street (remainder) 2 2
WR3h: Rear of 303-315 Oxford Road 0.22 17 4 4
WR3i: Part of Former Battle Hospital, 2.77 196 40 39
13

Portman Road
WR3j: Land at Moulsford Mews 13 3 3
WR3l: 816 Oxford Road 17 4 4
WR3m: 103 Dee Road 42 9 9
WR3n: Amethyst Lane 40 8 8
WR3p: Alice Burrows Homes Dwyer Road 0.48 22 5 5
WR3r: Charters Car Sales, Oxford Road 15 8 7
WR3s: Land at Kentwood Hill 51 11 10
WR3t: Land at Armour Hill 15 3 3 CA1a: Reading University Boat Club, Thames Promenade 20 10 10
CA1d: Rear of 200-214 Henley Road, 12-24 All Hallows Road and 4, 7 and 8 Copse Avenue 21 5 4
CA1e: Rear of 13-14a Hawthorne Road & 282-292 Henley Road 11 3 2
CA1f: Rear of 1 & 3 Woodcote Road and 21 St Peter's Hill 10 2 2
CA2: Caversham Park 40 4 4
ER1a: Woodley Arms PH, Waldeck Street 32 16 16
ER1b: Dingley House, 3-5 Craven Road 18 4 4
ER1c: Land rear of 8-26 Redlands Road 10 -5 4
ER1d: Land adjacent to 40 Redlands Road 29 6 6
ER1e: St Patricks Hall, Northcourt Avenue* 119 12 12
ER1f: Hamilton Centre, Bulmershe Road 16 4 3 ER1h: Arthur Hill Swimming Pool, 221-225 Kings Road 8 2 2
TOTAL 4444 0 90 98 510 512 TOTAL incl lapse rates (various) 3777 0 79 86 434 436 OTHER ALLOWANCES Non-allocated HELAA sites 14 3 3 3
Secondary School site -120 -60 -60 TOTAL -106 0 -60 -57 3 3
TOTAL incl lapse rates (various) -109 0 -60 -58 2 2
TOTAL FOR ALL (with lapse rates) 8087 764 1,093 837 734 700
*indicates non-C3 residential, where an equivalent figure is used.
14

4. HOUSING TRAJECTORY ACROSS PLAN PERIOD 4.1 A housing trajectory for market and affordable housing across the plan
period is a requirement of paragraph 47 of the NPPF. It is no longer a requirement that the trajectory be included within the Local Plan itself, although the Reading Borough Local Plan does include a summary trajectory at Appendix 1. The full version of the trajectory is set out in Table 5 in tabular form, and Figure 1 in graph form, which itemises the sites that have contributed towards the summary version.
4.2 As for the five-year housing land supply, it is important to note that this
differs from the version of the housing trajectory included in the 2017 AMR, and it differs for the same reasons as set out in paragraph 3.2.
4.3 The trajectory demonstrates how the full housing requirement as set out in
policy H1 of the Local Plan will be met across the plan period. What is apparent is that the delivery is expected to be strongest in the earlier half of the plan period, with delivery drying up later in the plan period. This is an issue that the Council has already identified, and the Memorandum of Understanding signed by the four Western Berkshire Housing Market Area authorities recognises this.
4.4 There is a very slight differences in the final total for how many homes will be delivered from the calculations in the HELAA. The HELAA has a total delivery of 15,570, whilst the trajectory shows total delivery of 15,564. This is entirely due to the very slightly different way in which the two methodologies account for rounding.
15

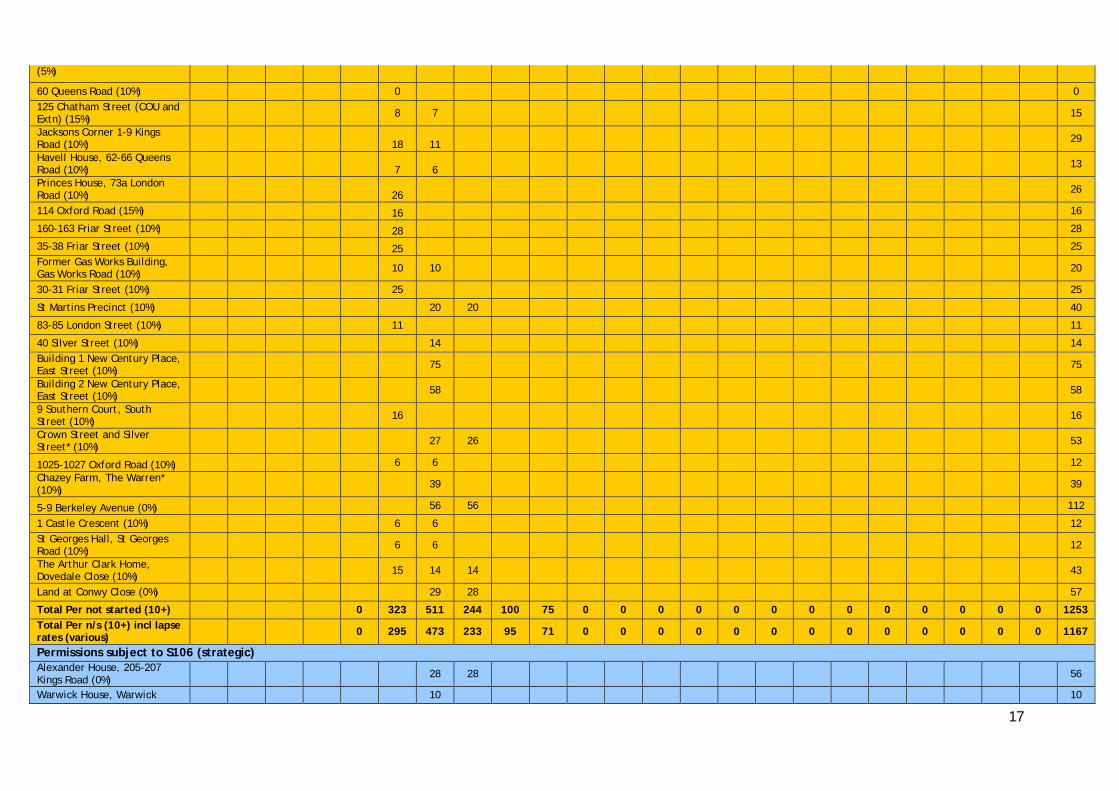
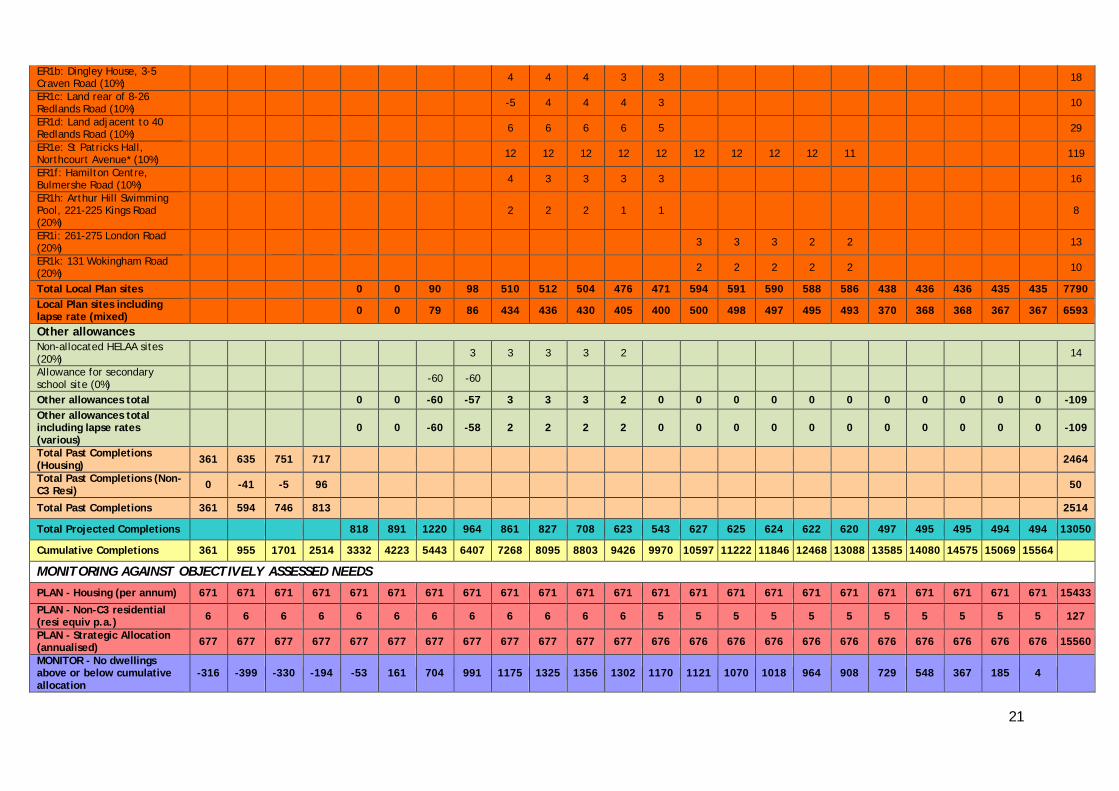
Table 5: Local Plan Full Housing Trajectory 2013/14 to 2035/36 (31st March 2017)
2013/ 14
2014/ 15
2015/ 16
2016/ 17
2017/ 18
2018/ 19
2019/ 20
2020/ 21
2021/ 22
2022/ 23
2023/ 24
2024/ 25
2025/ 26
2026/ 27
2027/ 28
2028/ 29
2029/ 30
2030/ 31
2031/ 32
2032/ 33
2033/ 34
2034/ 35
2035/ 36 TOTAL
Small Scale unidentified windfalls (< 10 units) 114 155 127 103 127 127 127 127 127 127 127 127 127 127 127 127 127 127 127 127 127 127 127 2848
Planning Permissions (strategic) Sites under construction (no lapse rate) 120 Oxford Road 6 6
6-14 Weldale Street 14 14
21 Caversham Road 11 11
84 Watlington Street 10 10
Kings Point, 120 Kings Road 103 103
Kings Lodge, 194 Kings Road 18 18 Garrard House 30 Garrard Street 101 101
173-175 Kings Road 15 15
34-36 Crown Street 14 14
Coley Park 31 40 71
Dee Park 44 31 30 44 49 49 247 Wells Hall, Upper Redlands Road -75 17 17 -41
University of Reading, London Road 53 53
1a Upper Redlands Road 10 10
252 Kings Road* 32 32 79 London Road and 34 Eldon Terrace 6 6
Elvian School 35 50 33 118
Kennet Island Phase 3 73 111 90 138 82 52 546
Green Park Village 26 201 100 100 100 100 100 59 786
Worton Grange 12 50 50 50 13 175 Total Per under construction (10+) 691 458 284 199 113 100 59 0 0 0 0 0 0 0 0 0 0 0 0 1872
Total Per u/c (10+) incl lapse rates (0%) 691 458 284 199 113 100 59 0 0 0 0 0 0 0 0 0 0 0 0 1872
Sites not started (lapse rate as shown) 173-175 Friar Street (10%)2 0 0
29-35 Station Road (10%) 27 27
Station Hill Site, Station Hill 100 100 100 100 75 475
2 Percentage indicates applicable lapse rate – see paragraphs 2.16 to 2.18 16
(5%)
60 Queens Road (10%) 0 0 125 Chatham Street (COU and Extn) (15%) 8 7 15
Jacksons Corner 1-9 Kings Road (10%) 18 11 29
Havell House, 62-66 Queens Road (10%) 7 6 13
Princes House, 73a London Road (10%) 26 26
114 Oxford Road (15%) 16 16
160-163 Friar Street (10%) 28 28
35-38 Friar Street (10%) 25 25 Former Gas Works Building, Gas Works Road (10%) 10 10 20
30-31 Friar Street (10%) 25 25
St Martins Precinct (10%) 20 20 40
83-85 London Street (10%) 11 11
40 Silver Street (10%) 14 14 Building 1 New Century Place, East Street (10%) 75 75
Building 2 New Century Place, East Street (10%) 58 58
9 Southern Court, South Street (10%) 16 16
Crown Street and Silver Street* (10%) 27 26 53
1025-1027 Oxford Road (10%) 6 6 12 Chazey Farm, The Warren* (10%) 39 39
5-9 Berkeley Avenue (0%) 56 56 112
1 Castle Crescent (10%) 6 6 12 St Georges Hall, St Georges Road (10%) 6 6 12
The Arthur Clark Home, Dovedale Close (10%) 15 14 14 43
Land at Conwy Close (0%) 29 28 57
Total Per not started (10+) 0 323 511 244 100 75 0 0 0 0 0 0 0 0 0 0 0 0 0 1253 Total Per n/s (10+) incl lapse rates (various) 0 295 473 233 95 71 0 0 0 0 0 0 0 0 0 0 0 0 0 1167
Permissions subject to S106 (strategic) Alexander House, 205-207 Kings Road (0%) 28 28 56
Warwick House, Warwick 10 10
17

Road (10%)
Total Per subject to S106 (10+) 0 0 38 28 0 0 0 0 0 0 0 0 0 0 0 0 0 0 0 66
Total Per subj S106 incl lapse rates (various) 0 0 37 28 0 0 0 0 0 0 0 0 0 0 0 0 0 0 0 65
HELAA sites with permission granted/resolution to grant since 2016/17 Napier Road Junction (10%) 158 157 315 3-4 Wesley Gate, Queens Road (10%) 14 14
Clarendon House, 59-75 Queens Road (10%) 25 24 49
Crown Street and Silver Street (uplift) (10%) 14 13 27
79 Silver Street* (0%) 14 14 Aspen House, Kings Road (10%) 78 78
72 Bath Road (10%) 13 13 Land at the Madejski Stadium (10%) 100 100 100 100 100 100 18 618
Total per since 16/17 (10+) 0 13 311 386 100 100 100 100 18 0 0 0 0 0 0 0 0 0 0 1128 Total per since 16/17 incl lapse rates (various) 0 12 280 349 90 90 90 90 16 0 0 0 0 0 0 0 0 0 0 1017
Allocated Sites (not yet with pp) CR11a: Friar Street and Station Road (remainder unpermitted) (20%)
23 22 22 67
CR11b: Greyfriars Road Corner (20%) 10 10 10 10 10 10 9 9 9 9 96
CR11d: Brunel Arcade and Apex Plaza (20%) 41 40 40 40 40 40 40 40 40 40 401
CR11e: North of Station (remainder unpermitted) (15%)
43 43 43 43 42 42 42 42 42 42 42 42 42 42 42 634
CR11f: West of Caversham Road (20%) 10 10 10 10 10 10 9 9 9 9 96
CR11g: Riverside (20%) 26 26 26 26 26 25 25 25 25 25 255
CR11i: Napier Court (20%) 18 18 18 18 18 18 17 17 17 17 17 17 17 17 17 261
CR12a: Cattle Market (10%) 45 45 45 45 45 45 45 45 45 45 450 CR12b: Great Knollys Street and Weldale Street (10%) 33 33 33 33 33 33 33 33 33 32 329
CR12c: Chatham Street, Eaton Place and Oxford Road (15%) (remainder unpermitted)
38 38 38 37 37 188
CR12d: Broad Street Mall (20%) 50 50 50 50 50 250
CR12e: Hosier Street (10%) 69 69 69 68 68 68 68 68 68 68 683
18
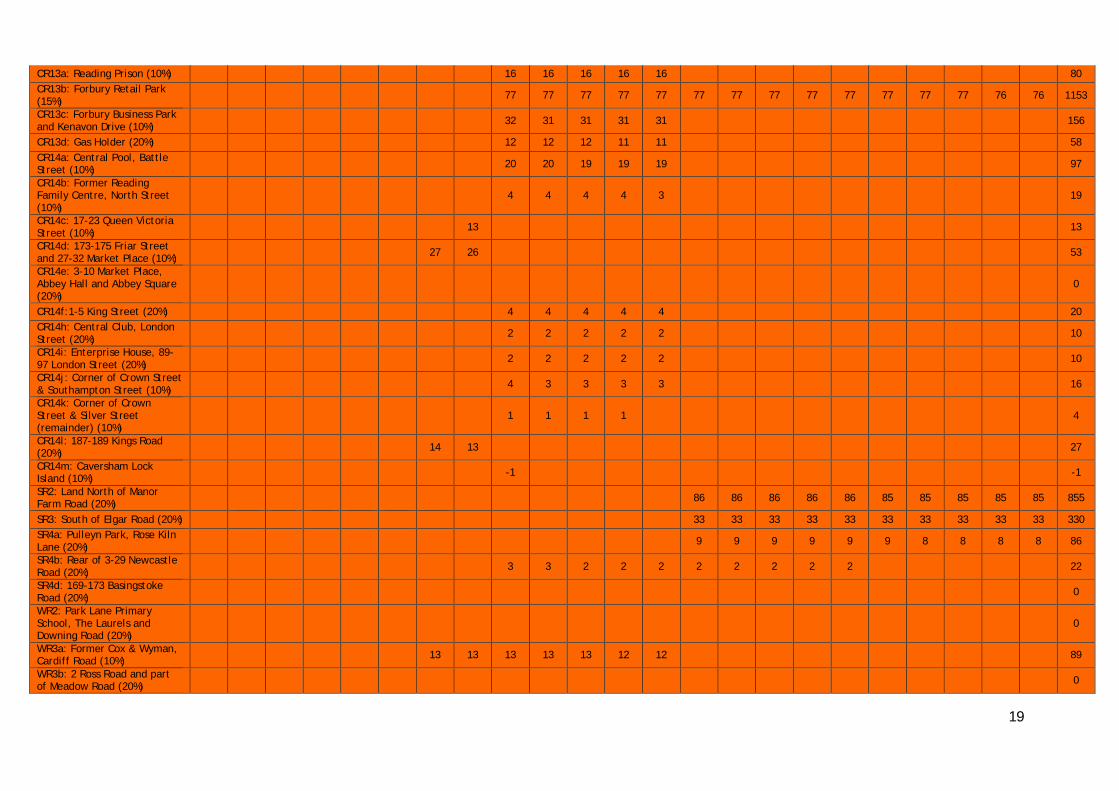
CR13a: Reading Prison (10%) 16 16 16 16 16 80 CR13b: Forbury Retail Park (15%) 77 77 77 77 77 77 77 77 77 77 77 77 77 76 76 1153
CR13c: Forbury Business Park and Kenavon Drive (10%) 32 31 31 31 31 156
CR13d: Gas Holder (20%) 12 12 12 11 11 58 CR14a: Central Pool, Battle Street (10%) 20 20 19 19 19 97
CR14b: Former Reading Family Centre, North Street (10%)
4 4 4 4 3 19
CR14c: 17-23 Queen Victoria Street (10%) 13 13
CR14d: 173-175 Friar Street and 27-32 Market Place (10%) 27 26 53
CR14e: 3-10 Market Place, Abbey Hall and Abbey Square (20%)
0
CR14f:1-5 King Street (20%) 4 4 4 4 4 20 CR14h: Central Club, London Street (20%) 2 2 2 2 2 10
CR14i: Enterprise House, 89-97 London Street (20%) 2 2 2 2 2 10
CR14j: Corner of Crown Street & Southampton Street (10%) 4 3 3 3 3 16
CR14k: Corner of Crown Street & Silver Street (remainder) (10%)
1 1 1 1 4
CR14l: 187-189 Kings Road (20%) 14 13 27
CR14m: Caversham Lock Island (10%) -1 -1
SR2: Land North of Manor Farm Road (20%) 86 86 86 86 86 85 85 85 85 85 855
SR3: South of Elgar Road (20%) 33 33 33 33 33 33 33 33 33 33 330 SR4a: Pulleyn Park, Rose Kiln Lane (20%) 9 9 9 9 9 9 8 8 8 8 86
SR4b: Rear of 3-29 Newcastle Road (20%) 3 3 2 2 2 2 2 2 2 2 22
SR4d: 169-173 Basingstoke Road (20%) 0
WR2: Park Lane Primary School, The Laurels and Downing Road (20%)
0
WR3a: Former Cox & Wyman, Cardiff Road (10%) 13 13 13 13 13 12 12 89
WR3b: 2 Ross Road and part of Meadow Road (20%) 0
19

WR3c: 28-30 Richfield Avenue (20%) 0
WR3e: Yeomanry House, Castle Hill (10%) 3 3 2 2 2 12
WR3f: 4 Berkeley Avenue (20%) 3 3 2 2 2 12
WR3g: 211-221 Oxford Road, 10 & rear of 8 Prospect Street (20%)
2 2
WR3h: Rear of 303-315 Oxford Road (20%) 4 4 3 3 3 17
WR3i: Part of Former Battle Hospital, Portman Road (20%) 40 39 39 39 39 196
WR3j: Land at Moulsford Mews (20%) 3 3 3 2 2 13
WR3k: 784-794 Oxford Road (20%) 0
WR3l: 816 Oxford Road (10%) 4 4 3 3 3 17
WR3m: 103 Dee Road (20%) 9 9 8 8 8 42
WR3n: Amethyst Lane (10%) 8 8 8 8 8 40 WR3p: Alice Burrows Home, Dwyer Road (10%) 5 5 4 4 4 22
WR3q: Norcot Community Centre, Lyndhurst Road (10%) 4 4 3 3 3 17
WR3r: Charters Car Sales, Oxford Road (20%) 8 7 15
WR3s: Land at Kentwood Hill (10%) 11 10 10 10 10 51
WR3t: Land at Armour Hill (10%) 3 3 3 3 3 15
CA1a: Reading University Boat Club, Thames Promenade (10%)
10 10 20
CA1b: Part of Reading Golf Club, Kidmore End Road (10%) 13 13 13 13 13 12 12 12 12 12 125
CA1c: Land at Lowfield Road (10%) 6 6 6 6 6 30
CA1d: Rear of 200-214 Henley Rd, 12-24 All Hallows Rd and 4, 7 and 8 Copse Avenue (20%)
5 4 4 4 4 21
CA1e: Rear of 13-14a Hawthorne Road & 282-292 Henley Road (10%)
3 2 2 2 2 11
CA1f: Rear of 1 & 3 Woodcote Road and 21 St Peter's Hill (20%)
2 2 2 2 2 10
CA2: Caversham Park (20%) 4 4 4 4 4 4 4 4 4 4 40 ER1a: Woodley Arms PH, Waldeck Street (10%) 16 16 32
20
ER1b: Dingley House, 3-5 Craven Road (10%) 4 4 4 3 3 18
ER1c: Land rear of 8-26 Redlands Road (10%) -5 4 4 4 3 10
ER1d: Land adjacent to 40 Redlands Road (10%) 6 6 6 6 5 29
ER1e: St Patricks Hall, Northcourt Avenue* (10%) 12 12 12 12 12 12 12 12 12 11 119
ER1f: Hamilton Centre, Bulmershe Road (10%) 4 3 3 3 3 16
ER1h: Arthur Hill Swimming Pool, 221-225 Kings Road (20%)
2 2 2 1 1 8
ER1i: 261-275 London Road (20%) 3 3 3 2 2 13
ER1k: 131 Wokingham Road (20%) 2 2 2 2 2 10
Total Local Plan sites 0 0 90 98 510 512 504 476 471 594 591 590 588 586 438 436 436 435 435 7790 Local Plan sites including lapse rate (mixed) 0 0 79 86 434 436 430 405 400 500 498 497 495 493 370 368 368 367 367 6593
Other allowances Non-allocated HELAA sites (20%) 3 3 3 3 2 14
Allowance for secondary school site (0%) -60 -60
Other allowances total 0 0 -60 -57 3 3 3 2 0 0 0 0 0 0 0 0 0 0 0 -109 Other allowances total including lapse rates (various)
0 0 -60 -58 2 2 2 2 0 0 0 0 0 0 0 0 0 0 0 -109
Total Past Completions (Housing) 361 635 751 717 2464
Total Past Completions (Non-C3 Resi) 0 -41 -5 96 50
Total Past Completions 361 594 746 813 2514
Total Projected Completions 818 891 1220 964 861 827 708 623 543 627 625 624 622 620 497 495 495 494 494 13050
Cumulative Completions 361 955 1701 2514 3332 4223 5443 6407 7268 8095 8803 9426 9970 10597 11222 11846 12468 13088 13585 14080 14575 15069 15564
MONITORING AGAINST OBJECTIVELY ASSESSED NEEDS PLAN - Housing (per annum) 671 671 671 671 671 671 671 671 671 671 671 671 671 671 671 671 671 671 671 671 671 671 671 15433
PLAN - Non-C3 residential (resi equiv p.a.) 6 6 6 6 6 6 6 6 6 6 6 6 5 5 5 5 5 5 5 5 5 5 5 127
PLAN - Strategic Allocation (annualised) 677 677 677 677 677 677 677 677 677 677 677 677 676 676 676 676 676 676 676 676 676 676 676 15560
MONITOR - No dwellings above or below cumulative allocation
-316 -399 -330 -194 -53 161 704 991 1175 1325 1356 1302 1170 1121 1070 1018 964 908 729 548 367 185 4
21

MANAGE - Annual requirement taking account of past / projected completions
677 691 695 693 687 679 667 632 610 592 574 563 558 559 551 542 531 515 494 494 493 492 491
22
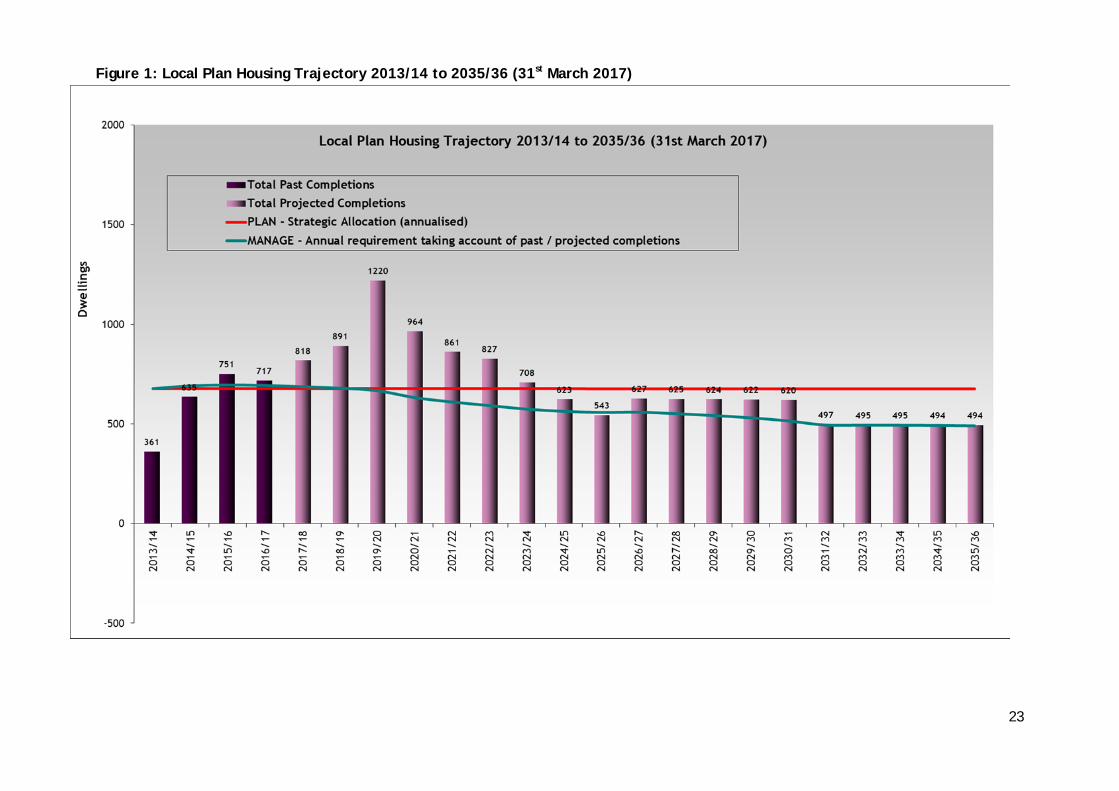
Figure 1: Local Plan Housing Trajectory 2013/14 to 2035/36 (31st March 2017)
23

5. PREDICTED FIVE-YEAR HOUSING LAND SUPPLY ACROSS PLAN PERIOD
5.1 It is possible to predict how the five-year supply of housing would change
across the plan period, assuming that the delivery of housing each year is as predicted in the housing trajectory. This is summarised in Table 6.
5.2 In terms of methodology, there are two main points during the plan period at which the way the 5 year land supply is calculated change. Firstly, at some point the past under-provision is eliminated, and no longer needs to be taken account of using either the ‘Liverpool’ or ‘Sedgefield’ method. It is currently estimated that the under-provision will be eliminated at the end of the 2017-18 period.
5.3 Secondly, for the final five years of the plan period, the 5-year supply no longer needs to take account of a 5% buffer. As set out in the NPPF, the 5% buffer is not an additional requirement, rather it is moved forward from the end of the plan period. Once the end of the plan period is reached, there is no longer a need to bring anything forward, and that means that the final 5 year period 2031 to 2036 (calculated for 2029/30) does not include a buffer. Of course, in practice much is likely to have changed by that point, with five-yearly plan reviews and other changes, but this represents the best possible snapshot at this point.
5.4 As set out above, this calculation is dependent on the predicted annual
delivery, and it is inevitable that this will not be exactly as predicted. However, it illustrates that it should be possible to maintain a five-year land supply across much of the plan period.
5.5 The periods for which the land supply dips below five years are those in the last seven years of the plan period. This arises solely due to the need to apply a 5% buffer. This issue is highlighted in paragraph 5.3 above, and does not apply to the final period, because the buffer is not applied (although 4.98 years are shown, this is only below 5 years due to the effect of rounding). It could be argued that the degree to which a buffer is applied ought to gradually decline towards the end of the plan period, and therefore smooth this issue out, but this has not been taken into account in our methodology.
24

Table 6: Maintaining a five-year housing land supply across the plan period
2013
/14
2014
/15
2015
/16
2016
/17
2017
/18
2018
/19
2019
/20
2020
/21
2021
/22
2022
/23
2023
/24
2024
/25
2025
/26
2026
/27
2027
/28
2028
/29
2029
/30
2030
/31
2031
/32
2032
/33
2033
/34
2034
/35
2035
/36
Base year 6.60 years
Year 1 6.53 years
Year 2 5.99 years
Year 3 5.55 years
Year 4 5.34 years
Year 5 5.18 years
Year 6 5.14 years
Year 7 5.18 years
Year 8 5.30 years
Year 9 5.15 years
Year 10 5.01 years
Year 11 4.88 years
Year 12 4.79 years
Year 13 4.98 years
Year at end of which 5 year housing land supply is assessed
5-year period covered
25

6. MAINTAINING A FIVE-YEAR HOUSING LAND SUPPLY ACROSS PLAN PERIOD
6.1 This section discusses the measures that the Council can take to ensure that
a five-year supply is maintained across the plan period, should there be any issues with the anticipated delivery. In many ways, the context for the Local Plan makes it difficult to have fallback options should a five-year supply cannot be demonstrated, because the Council is already seeking to make use of all of the suitable, available and achievable housing sites in Reading. Other authorities might have options such as the release of reserve sites, but in Reading’s Local Plan, no sites that would otherwise be appropriate to develop are being held back.
Monitoring
6.2 The existing monitoring arrangements that the Council has in place can be
expected to pick up any issues with maintaining a five-year supply in good time. Development progress is measured at the end of each monitoring year, and a Residential Commitments document is published. This feeds into an Annual Monitoring Report, which the Council produces in December each year, which contains both an updated housing trajectory and a five-year housing land supply. In addition, there is an expectation that the HELAA will be updated regularly. This should mean that an expected lack of five-year supply can be picked up in good time and allow the Council to consider how it should be addressed.
Meeting needs across the Housing Market Area
6.3 The Local Plan already identifies that Reading cannot meet its full need for
housing within its boundaries. The Plan identifies a shortfall of 644 dwellings in total across the plan period (see policy H1). This means that, should insufficient land be available in Reading to meet the housing targets, this will be likely to simply add to the pressure on the rest of the Housing Market Area.
6.4 The four authorities in the Western Berkshire Housing Market Area3 have
signed a Memorandum of Understanding relating to Reading’s unmet need in October 2017. This recognises that Reading will not be able to meet its needs in full, and commits the HMA as a whole to meeting the full needs arising within its boundaries. The MoU identifies the shortfall as being within the range of 500 and 1,000 dwellings. The identified Local Plan shortfall of 644 dwellings is towards the lower end of that range. There is therefore scope for this to increase but still be within the range discussed under the duty to co-operate.
6.5 As the pressure is likely to arise in the later years of the plan period, it is
anticipated that, should monitoring measures identify an issue that will result in needing to make up a larger shortfall than the Local Plan identifies, this can inform duty to co-operate discussions around later iterations of Reading’s own Local Plan (which now need to be reviewed on a
3 Bracknell Forest Borough Council, Reading Borough Council, West Berkshire District Council and Wokingham Borough Council
26

five-yearly basis) and around the Local Plans of other local authorities in the area.
Local Plan reviews 6.6 Under Regulation 4 of the Town and Country Planning (Local Planning)
(England) (Amendment) Regulations 2017, which comes into force in April 2018, the Local Plan will need to be reviewed within a five-year period beginning on the date of adoption. Based on the dates in Reading’s most recent Local Development Scheme, this will mean needing to have completed the plan review by January 2024.
6.7 Table 6 estimates that the first point at which demonstrating a five year
supply may become difficult is at the end of the 2026/27 year. This will be within the period of producing the Council’s second five-yearly review of the Local Plan. If this is the case, this will represent an opportunity to resolve this issue within the plan, by identifying other sites (which may have become available within the preceding ten years) or through duty to co-operate discussions.
Local authority land and housebuilding 6.8 Reading Borough Council regularly reviews the use of its own land, which
can free up sites for housing. This has resulted in a number of sites being identified in the HELAA and brought forward as Local Plan allocations. There are additional significant sites over and above these HELAA sites and allocations that are known to be surplus, but changes in the way the Council operates over the plan period may result in other sites becoming available.
6.9 The Council is also keen to take any opportunities that may arise to build its
own homes. Work has recently begun on 57 homes at a site at Conwy Close. Whilst the availability of land is a constraint on such housebuilding, the ability of the Council to fund such developments is a very significant barrier. Any changes in the ability of the Council to finance local authority housebuilding during the 20 year life of the plan could result in a boost to housing supply. The HELAA looked at the possibility of reconfiguration of some of Reading’s older, primarily Council-owned estates, and noted significant achievability issues, which prevented these sites being included within forecast supply. However, if changes to how development is financed enabled these issues to be overcome, there could be some additional supply.
Rebalancing of office and housing on mixed-use sites 6.10 It may be that, as economic conditions change through the plan period,
some sites currently identified for office development, would be proposed with a greater balance towards residential than is currently factored into the figures. This particularly refers to mixed use sites in the town centre which contain both offices and residential. Many of these have existing planning permissions, which is why they are not considered to have greater potential in the HELAA, but alternative applications may come forward. If this were to happen, it would assist in maintaining a five-year supply.
27

6.11 It should be clarified that the above refers to offices rather than other forms of employment, and it does not refer to land protected as Core Employment Areas. The Local Plan currently anticipates exceeding the office need for Reading, but does not do so for industrial and warehouse need, so there is not the same level of flexibility in those uses.
28