reading charts in ophthalmology - springer · reading charts in ophthalmology w. radner1 ......
TRANSCRIPT
REVIEWARTICLE
Reading charts in ophthalmology
W. Radner1
Received: 17 November 2016 /Revised: 12 March 2017 /Accepted: 22 March 2017 /Published online: 14 April 2017# The Author(s) 2017. This article is an open access publication
Abstract A new generation of logarithmic reading charts hassparked interest in standardized reading performance analy-ses. Such reading charts have been developed according to thestandards of the International Council of Ophthalmology. Theprint size progression in these calibrated charts is in accor-dance with the mathematical background of EN ISO 8596.These reading charts are: the Bailey–Lovie Word ReadingChart, the Colenbrander English Continuous Text NearVision Cards, the Oculus Reading Probe II, the MNREADCharts, the SKread Charts, and the RADNER ReadingCharts. The test items used for these reading charts differamong the charts and are standardized to various extents.The Bailey–Lovie Charts, MNREAD Charts, SKreadCharts, and RADNER Charts are also meant to measure read-ing speed and allow determination of further reading parame-ters such as reading acuity, reading speed based on readingacuity, critical print size, reading score, and logMAR/logRADratio. Such calibrated reading charts have already providedvaluable insights into the reading performance of patients inmany research studies. They are available in many languagesand thus facilitate international communication about near vi-sual performance. In the present review article, the back-grounds of these modern reading charts are presented, andtheir different levels of test-item standardization are discussed.Clinical research studies are mentioned, and a discussionabout the immoderately high number of reading acuity
notations is included. Using the logReading AcuityDetermination ([logRAD] = reading acuity equivalent oflogMAR) measure for research purposes would give readingacuity its own identity as a standardized reading parameter inophthalmology.
Keywords Reading acuity . Reading charts . Readingperformance . Reading speed . Sentence optotypes
Introduction
The near visual properties of our patients, particularly theability to read, can be affected by many eye diseases. Sincethe treatment of eye diseases could be significantly improved,and patients who suffer from sight-threatening eye diseaseshare a desire to regain a comfortable reading ability, it isevident that there is increasing clinical interest in well- stan-dardized, calibrated reading charts [1–15]. Accordingly, thisreview gives an overview of the history and background ofmodern logarithmically progressing reading charts that can beconsidered calibrated for the assessment of functional vision[16, 17].
This article is also meant to spark interest in the concept ofthe necessity for calibrated reading charts in order to achieveinternational comparability in reading acuity measures, as isalready the case for single-optotype distance acuity.Therefore, only those reading charts that can be consideredcalibrated are discussed here, i.e., those whose standards are inaccordance with the standards of the Visual FunctionCommittee of the International Council of Ophthalmology(ICO) [16] and alsomeet the requirements of the mathematicalstandards of EN-ISO 8596 [17]. The print sizes of these read-ing charts were investigated with a measuring microscope in aprevious study [18].
Commercial relationship The author receives royalties for the RadnerReading Charts and served as consultant for the Oculus Corporation.
* W. [email protected]
1 Austrian Academy of Ophthalmology, Mollgasse 11,1180 Vienna, Austria
Graefes Arch Clin Exp Ophthalmol (2017) 255:1465–1482DOI 10.1007/s00417-017-3659-0
Holladay recently indicated that, by analogy to the stan-dards for distance acuity measurements with single optotypes,near-vision measurements must also conform to the same vi-sual angle as distance measurements [19], and he developed anear acuity card using Sloan letters and the EDTRS format.The definition of the relationship between visual angle andoptotype size had first been introduced by Snellen in 1862[20]. It is still the mathematical basis for the construction ofoptotypes and for all reliable visual acuity notations.However, except for the Birkhaeuser charts, which were pro-duced in 1911 [21] (see below: historical aspects), this rela-tionship has not been applied to the heights of lower-caseletters in reading charts for more than a century, most likelybecause the height of lower-case letters was never a criterionof interest in the printing business. Therefore, the exact heightof lower-case letters was not known for hot-lead printing, anduntil now it could not be determined with the software avail-able for current professional printing. The heights of lower-case letters still have to be determined with a microscope [18,22]. It must be noted that such measurements come with therisk of artifacts, leading to considerable inaccuracy, and thataccurate print sizes below a reading acuity of 0.32 at 40 cm(Snellen: 20/63) are difficult to achieve. Nevertheless, modernprinting techniques have allowed us to achieve accurate printsizes with a deviation of no more than 0.01–0.03 of a milli-meter, as in, for example, the RADNER Reading Charts.Thus, it is possible to produce reading charts in accord withthe desire of clinical professionals to work with measuringtools of the highest accuracy.
It is well accepted that reading words or sentences is a morecomplex function than is reading single optotypes on an acuitychart [23], because individual letters within words are moredifficult to recognize [24, 25]. Accordingly, routine single-optotype distance acuity has been shown to be a limited pre-dictor of reading performance and, thus, cannot elucidate thefull functional impairment of several ophthalmic diseases [26,27]. Reading charts are therefore included as part of an eval-uation to ensure a complete evaluation of visual properties. Itseems evident that a reading chart standard, by analogy todistance acuity standards, is required in order to allow forcomparable measurements of reading parameters, such asreading acuity and speed. In 1988, the Visual FunctionCommittee of the ICO published a standard for reading charts[16], aiming to establish calibrated reading acuity measures.In addition, the mathematical backgrounds of the EN ISO8596 standard [17] have come to be considered a conceptualrequirement for calibrated reading charts.
Only a few reading charts have been designed upon theseuseful standards or standards equal to these: (a) the Bailey–Lovie Word Reading Chart [28], (b) the Oculus ReadingProbe II (Oculus Corporation, DE, USA), (c) theColenbrander English Continuous Text Near Vision Cards(Precision Vision, Woodstock, IL, USA), (d) the MNREAD
Charts [29] (Precision Vision), (e) the SKread Charts [50](Precision Vision), and (f) the RADNER Reading Charts[30–32] (Neumed AG, AT; Precision Vision). The last fourreading charts are available in several languages.
The present review article discusses the backgrounds of themodern logarithmic reading charts that can be considered tobe calibrated in accordance to the standards of the ICO and ENISO 8596.
Historical aspects of reading charts
In the second half of the nineteenth century, the ophthalmol-ogists Küchler, Jaeger, Donders, Snellen, Green, Landolt,Monoyer, Nieden, Parinaud, and Pflüger developed the cur-rent standards for visual acuity measurements. In 1843,Küchler developed distance acuity charts using single words,and in 1854 Jaeger published the BSchrift-Scalen^ (JaegerCharts) [33, 34]. Such developments sparked interest in theidea of the necessity for standardization in visual acuity mea-surements. Inspired by a formula of Donders (1861), Snellenpublished the principle of optotype construction in 1862 [20],and in 1867 and 1868, Green introduced the idea of logarith-mic progression of optotype sizes [35, 36].
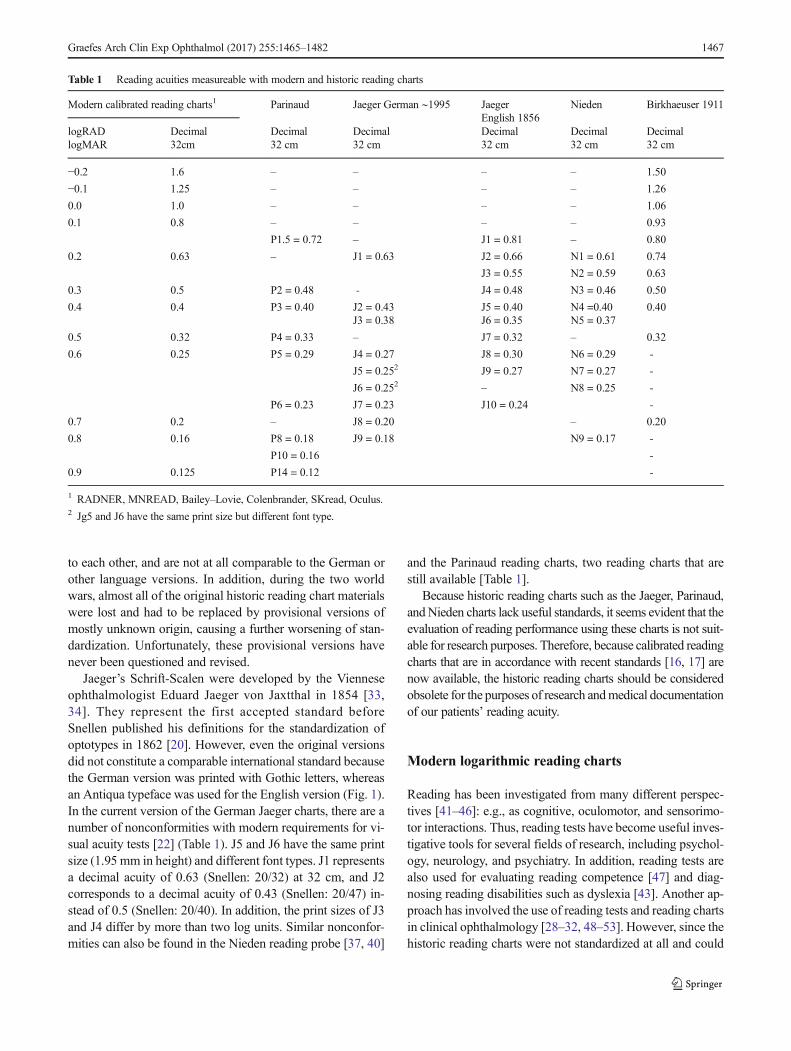
However, similar standards have not been applied to read-ing charts. Therefore, the historic reading charts, such as theJaeger [34], Nieden [37], and Parinaud charts, suffer from aconsiderable lack of standardization (Table 1). Accordingly,their print sizes (letter heights) are not standardized and do notlogarithmically progress, most likely because of the limita-tions of earlier printing techniques.
An exception to these non-standardized charts is the read-ing chart developed by Birkhaeuser in 1911 [21, 38].Birkhaeuser, who was an ophthalmologist and the son of theowner of the Birkhaeuser Printing House, used a photochem-ical printing technique that allowed him to print logarithmi-cally progressing print sizes of notable accuracy (Table 1).Although he tried to develop a font type for lower-case lettersthat was in accordance with the principles postulated bySnellen for optotypes [38], he finally abandoned this ideaand used an Antiqua typeface that appeared to be closest tothe Snellen principle. Interestingly, the typeface he chose isvery similar to the Helvetica typeface that has been chosen (inaccordance with the same idea) for the RADNER ReadingCharts.
With recent printing techniques, it is possible to print letterheights with an accuracy between 0.00 and 0.03 mm [18, 30,31], whereas the historic reading charts have often beenprinted only with the limited print sizes available for hot-lead typesetting [22]; this limitation is responsible for the lackof comparability and standardization of the historic readingcharts. It is also an explanation for the many different versionsof the English Jaeger charts [39], which are barely comparable
1466 Graefes Arch Clin Exp Ophthalmol (2017) 255:1465–1482
to each other, and are not at all comparable to the German orother language versions. In addition, during the two worldwars, almost all of the original historic reading chart materialswere lost and had to be replaced by provisional versions ofmostly unknown origin, causing a further worsening of stan-dardization. Unfortunately, these provisional versions havenever been questioned and revised.
Jaeger’s Schrift-Scalen were developed by the Vienneseophthalmologist Eduard Jaeger von Jaxtthal in 1854 [33,34]. They represent the first accepted standard beforeSnellen published his definitions for the standardization ofoptotypes in 1862 [20]. However, even the original versionsdid not constitute a comparable international standard becausethe German version was printed with Gothic letters, whereasan Antiqua typeface was used for the English version (Fig. 1).In the current version of the German Jaeger charts, there are anumber of nonconformities with modern requirements for vi-sual acuity tests [22] (Table 1). J5 and J6 have the same printsize (1.95 mm in height) and different font types. J1 representsa decimal acuity of 0.63 (Snellen: 20/32) at 32 cm, and J2corresponds to a decimal acuity of 0.43 (Snellen: 20/47) in-stead of 0.5 (Snellen: 20/40). In addition, the print sizes of J3and J4 differ by more than two log units. Similar nonconfor-mities can also be found in the Nieden reading probe [37, 40]
and the Parinaud reading charts, two reading charts that arestill available [Table 1].
Because historic reading charts such as the Jaeger, Parinaud,andNieden charts lack useful standards, it seems evident that theevaluation of reading performance using these charts is not suit-able for research purposes. Therefore, because calibrated readingcharts that are in accordance with recent standards [16, 17] arenow available, the historic reading charts should be consideredobsolete for the purposes of research andmedical documentationof our patients’ reading acuity.
Modern logarithmic reading charts
Reading has been investigated from many different perspec-tives [41–46]: e.g., as cognitive, oculomotor, and sensorimo-tor interactions. Thus, reading tests have become useful inves-tigative tools for several fields of research, including psychol-ogy, neurology, and psychiatry. In addition, reading tests arealso used for evaluating reading competence [47] and diag-nosing reading disabilities such as dyslexia [43]. Another ap-proach has involved the use of reading tests and reading chartsin clinical ophthalmology [28–32, 48–53]. However, since thehistoric reading charts were not standardized at all and could
Table 1 Reading acuities measureable with modern and historic reading charts
Modern calibrated reading charts1 Parinaud Jaeger German ∼1995 JaegerEnglish 1856
Nieden Birkhaeuser 1911
logRADlogMAR
Decimal32cm
Decimal32 cm
Decimal32 cm
Decimal32 cm
Decimal32 cm
Decimal32 cm
−0.2 1.6 – – – – 1.50
−0.1 1.25 – – – – 1.26
0.0 1.0 – – – – 1.06
0.1 0.8 – – – – 0.93
P1.5 = 0.72 – J1 = 0.81 – 0.80
0.2 0.63 – J1 = 0.63 J2 = 0.66 N1 = 0.61 0.74
J3 = 0.55 N2 = 0.59 0.63
0.3 0.5 P2 = 0.48 - J4 = 0.48 N3 = 0.46 0.50
0.4 0.4 P3 = 0.40 J2 = 0.43 J5 = 0.40 N4 =0.40 0.40J3 = 0.38 J6 = 0.35 N5 = 0.37
0.5 0.32 P4 = 0.33 – J7 = 0.32 – 0.32
0.6 0.25 P5 = 0.29 J4 = 0.27 J8 = 0.30 N6 = 0.29 -
J5 = 0.252 J9 = 0.27 N7 = 0.27 -
J6 = 0.252 – N8 = 0.25 -
P6 = 0.23 J7 = 0.23 J10 = 0.24 -
0.7 0.2 – J8 = 0.20 – 0.20
0.8 0.16 P8 = 0.18 J9 = 0.18 N9 = 0.17 -
P10 = 0.16 -
0.9 0.125 P14 = 0.12 -
1 RADNER, MNREAD, Bailey–Lovie, Colenbrander, SKread, Oculus.2 Jg5 and J6 have the same print size but different font type.
Graefes Arch Clin Exp Ophthalmol (2017) 255:1465–1482 1467

not be used as reliable tools for research purposes (Table 1),the value and potential of standardized reading acuity mea-sures are still underestimated.
About four decades after Birkhaeuser’s reading charts of1911 [21], the logarithmic progression of the print sizes becameagain a subject of interest for reading charts. Aiming to over-come the questionable Jaeger standard, Law published in 1951[54] and 1952 [55] the idea of the N-notation, which is basedupon the point (pt) system. However, between N5 and N10, therecommended progression of print sizes is only approximatelylogarithmic, and between N12 and N48, it definitely is not log-arithmic. This approach was followed in the early 1960s by thelogarithmic Sloan Reading Cards [49], and then in 1980 by thelogarithmic Bailey–Lovie Word Reading Charts [28]. In 1988,the Visual Function Committee of the ICO [16] published stan-dards for reading acuity measurements. These standards stipu-late, in short: (a) by analogy to the standards of visual acuitymeasurements, the print sizes of reading charts have to progresslogarithmically, (b) it is desirable that the test conditions,optotypes, and chart design used are calibrated, (c) the test dis-tance has to be specified in all instances, (d) for reading charts,continuous text materials are desirable, and (e) the typeset ma-terial should be based upon the distance at which the height oflower-case letters such as Bo^, Bm^, and Bx^ subtends five mi-nutes of arc. In addition, the mathematical backgrounds of theEN ISO 8596 standard [17] explain and tighten the conceptualrequirements of calibrated reading charts.
All of the modern logarithmic reading charts mentioned inthis article (ordered by the year of publication) are in confor-mity with the standards established by the ICO [16] and arealso in accordance with the mathematical backgrounds of EN-ISO 8596 [17].
The Sloan Reading Cards
In the early 1960s, Sloan developed reading cards in orderto determine the required power of reading aids [49].
These cards used continuous text paragraphs of differentlengths. The font type used for the cards was a reproduc-tion of that used on a standard typewriter at the time. Thesmallest print size was 1.0 M, which represents a decimalacuity of 0.4 at a reading distance of 40 cm (1.0 M = theoverall dimension of the lower-case letters subtending avisual angle of 5 minutes of arc at a distance of 1 meter).The complete series of print sizes was 1.0 M, 1.5 M, 2.0M, 2.5 M, 3.0 M, 4.0 M, 5.0 M, 7.0 M, and 10 M, ap-proximately representing a logarithmic progression(3.0 M should be 3.2 M and 7.0 M should be 6.3 M;8.0 M is missing).
The Bailey-Lovie Word Reading Charts
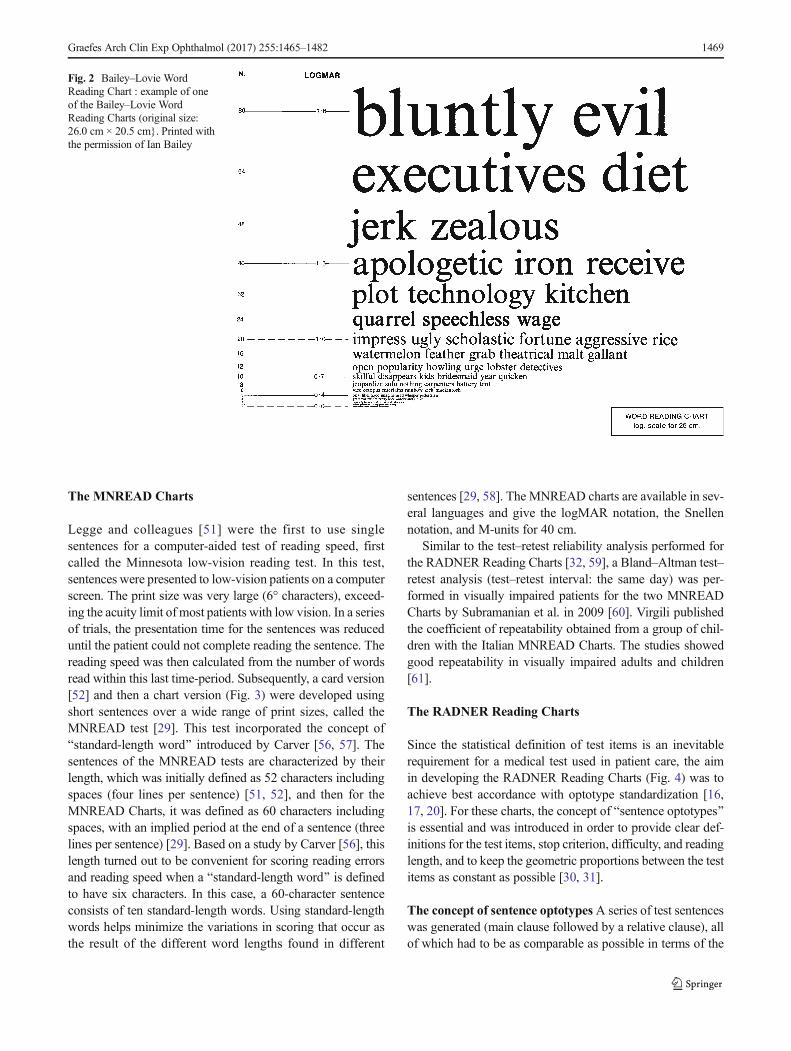
In 1980, Bailey and Lovie developed the Bailey–Lovie WordReading Charts (Fig. 2), which were designed to determinereading acuity and speed in one simultaneous examinationwith a reading chart [28]; this principle has also been appliedto theMNREAD [29] and RADNERReading Charts [30–32].Bailey and Lovie designed a word-reading chart with a loga-rithmic size progression and used unrelated words. Followingthe recommendat ions of the Br i t i sh Facul ty ofOphthalmologists, [54, 55], they used the Times Roman type-face. They further decided to use four-, seven-, and ten-letterwords at each size level, based on the observation that inpatients with age-related macular degeneration (AMD), theword length can affect the readability (some patients preferlonger words, others shorter ones). The words and word orderwere selected with the intention of having the first letters ofthe words evenly distributed over the whole alphabet. Thefrequency of word use also became a selection criterion, andcare was taken to avoid obvious syntactic associations be-tween adjacent words [23, 28]. On the charts, print sizes werelabeled in N-notation (points), M-units, VAR, and logMARvalues given for 25 cm.
Fig. 1 Jaeger Schrift-Scalen 1856: (a) German J1 compared with (b) theEnglish J1. (a) Photographic representation of J1 of the German para-graph and (b) J1 of the English paragraph taken from the original JaegerSchrift-Scalen from 1856 (magnification: 65×). Note that the German
version was printed with Gothic letters, while an Antiqua typeface wasused for the English version, indicating that even the original version didnot represent a comparable international standard
1468 Graefes Arch Clin Exp Ophthalmol (2017) 255:1465–1482
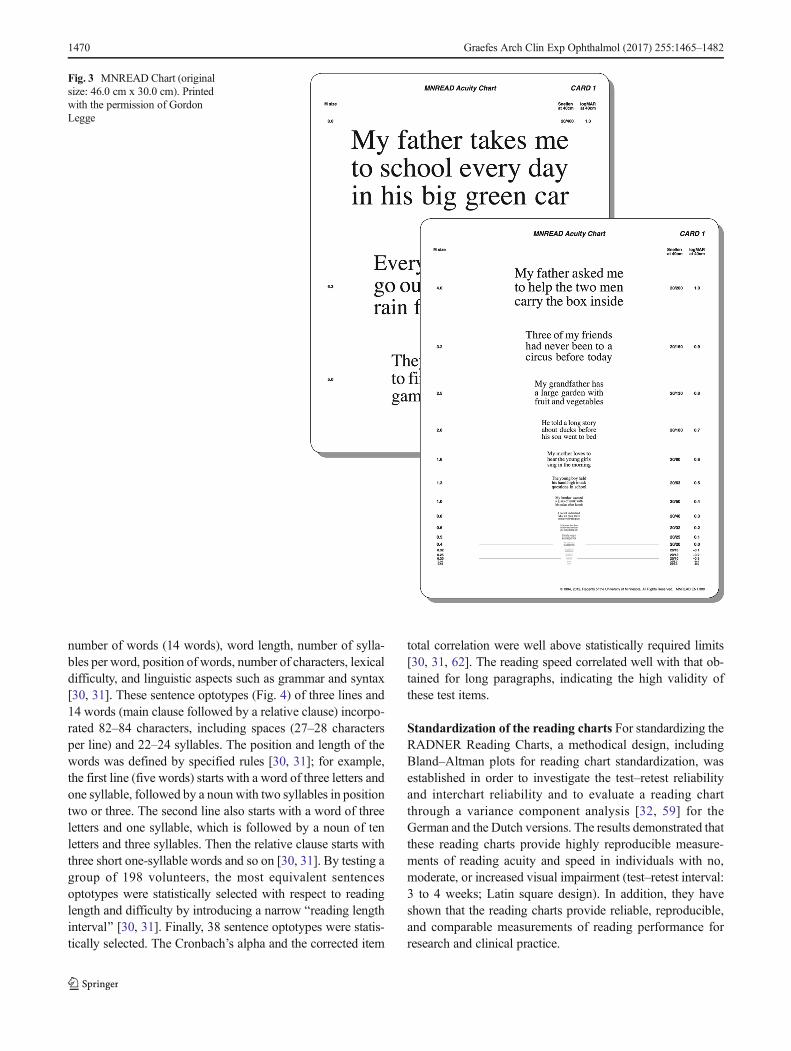
The MNREAD Charts
Legge and colleagues [51] were the first to use singlesentences for a computer-aided test of reading speed, firstcalled the Minnesota low-vision reading test. In this test,sentences were presented to low-vision patients on a computerscreen. The print size was very large (6° characters), exceed-ing the acuity limit of most patients with low vision. In a seriesof trials, the presentation time for the sentences was reduceduntil the patient could not complete reading the sentence. Thereading speed was then calculated from the number of wordsread within this last time-period. Subsequently, a card version[52] and then a chart version (Fig. 3) were developed usingshort sentences over a wide range of print sizes, called theMNREAD test [29]. This test incorporated the concept ofBstandard-length word^ introduced by Carver [56, 57]. Thesentences of the MNREAD tests are characterized by theirlength, which was initially defined as 52 characters includingspaces (four lines per sentence) [51, 52], and then for theMNREAD Charts, it was defined as 60 characters includingspaces, with an implied period at the end of a sentence (threelines per sentence) [29]. Based on a study by Carver [56], thislength turned out to be convenient for scoring reading errorsand reading speed when a Bstandard-length word^ is definedto have six characters. In this case, a 60-character sentenceconsists of ten standard-length words. Using standard-lengthwords helps minimize the variations in scoring that occur asthe result of the different word lengths found in different
sentences [29, 58]. The MNREAD charts are available in sev-eral languages and give the logMAR notation, the Snellennotation, and M-units for 40 cm.
Similar to the test–retest reliability analysis performed forthe RADNER Reading Charts [32, 59], a Bland–Altman test–retest analysis (test–retest interval: the same day) was per-formed in visually impaired patients for the two MNREADCharts by Subramanian et al. in 2009 [60]. Virgili publishedthe coefficient of repeatability obtained from a group of chil-dren with the Italian MNREAD Charts. The studies showedgood repeatability in visually impaired adults and children[61].
The RADNER Reading Charts
Since the statistical definition of test items is an inevitablerequirement for a medical test used in patient care, the aimin developing the RADNER Reading Charts (Fig. 4) was toachieve best accordance with optotype standardization [16,17, 20]. For these charts, the concept of Bsentence optotypes^is essential and was introduced in order to provide clear def-initions for the test items, stop criterion, difficulty, and readinglength, and to keep the geometric proportions between the testitems as constant as possible [30, 31].
The concept of sentence optotypesA series of test sentenceswas generated (main clause followed by a relative clause), allof which had to be as comparable as possible in terms of the
Fig. 2 Bailey–Lovie WordReading Chart : example of oneof the Bailey–Lovie WordReading Charts (original size:26.0 cm × 20.5 cm}. Printed withthe permission of Ian Bailey
Graefes Arch Clin Exp Ophthalmol (2017) 255:1465–1482 1469
number of words (14 words), word length, number of sylla-bles per word, position of words, number of characters, lexicaldifficulty, and linguistic aspects such as grammar and syntax[30, 31]. These sentence optotypes (Fig. 4) of three lines and14 words (main clause followed by a relative clause) incorpo-rated 82–84 characters, including spaces (27–28 charactersper line) and 22–24 syllables. The position and length of thewords was defined by specified rules [30, 31]; for example,the first line (five words) starts with a word of three letters andone syllable, followed by a noun with two syllables in positiontwo or three. The second line also starts with a word of threeletters and one syllable, which is followed by a noun of tenletters and three syllables. Then the relative clause starts withthree short one-syllable words and so on [30, 31]. By testing agroup of 198 volunteers, the most equivalent sentencesoptotypes were statistically selected with respect to readinglength and difficulty by introducing a narrow Breading lengthinterval^ [30, 31]. Finally, 38 sentence optotypes were statis-tically selected. The Cronbach’s alpha and the corrected item
total correlation were well above statistically required limits[30, 31, 62]. The reading speed correlated well with that ob-tained for long paragraphs, indicating the high validity ofthese test items.
Standardization of the reading charts For standardizing theRADNER Reading Charts, a methodical design, includingBland–Altman plots for reading chart standardization, wasestablished in order to investigate the test–retest reliabilityand interchart reliability and to evaluate a reading chartthrough a variance component analysis [32, 59] for theGerman and the Dutch versions. The results demonstrated thatthese reading charts provide highly reproducible measure-ments of reading acuity and speed in individuals with no,moderate, or increased visual impairment (test–retest interval:3 to 4 weeks; Latin square design). In addition, they haveshown that the reading charts provide reliable, reproducible,and comparable measurements of reading performance forresearch and clinical practice.
Fig. 3 MNREAD Chart (originalsize: 46.0 cm x 30.0 cm). Printedwith the permission of GordonLegge
1470 Graefes Arch Clin Exp Ophthalmol (2017) 255:1465–1482

A sans-serif Helvetica typeface was used for the readingcharts. All notations (decimal, Snellen, M-units, and logRAD)are given for 40 cm and 32 cm (in the German version also for1 meter). Except for logRAD, which is given in all languageversions, the notations shown on the charts depend on thetradition of reading acuity determinations of the countries inwhich the particular language is spoken. A logRAD adjust-ment scale for different reading distances is provided on everychart (range: 4 cm to 50 cm). In addition, a page with numbersand one with Landolt rings are included in the booklet.
The concept of sentence optotypes has been applied to 12different languages (a total of 1,323 volunteers have beentested in order to standardize the sentence optotypes in the12 languages). The Radner Reading Charts are available inGerman, Spanish, English, French, Dutch, Italian, Swedish,Danish, Portuguese, Turkish, Hungarian, and Romanian, andfurther languages are in progress.
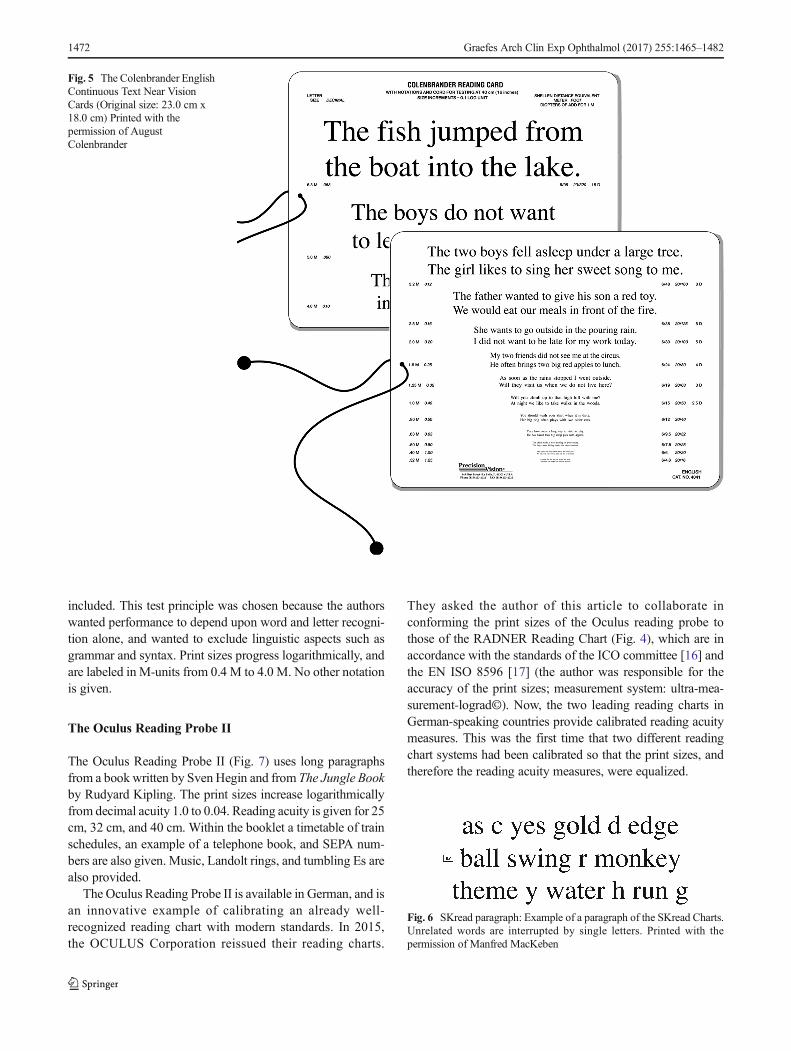
The Colenbrander Continuous Text Near Vision Cards
The Colenbrander Continuous Text Near Vision Cards(Precision Vision, Woodstock, IL, USA; Fig. 5) are also log-arithmically scaled; they are available in 12 languages. For useat 40 cm, they cover decimal acuities from 0.063 to 1.25 and
also give the Snellen notation and M-units; logMAR notationis not given. To maintain the correct reading distance, a 40-cmcord is mounted on the cards, and for use in low vision, thecards come with a ruler to facilitate use at shorter distances forlower acuity levels. The test sentences have 44 charactersincluding spaces and a different number of words (nine to 11words). For decimal acuities from 0.063 to 0.1, one sentence ispresented per print size, and for 0.12 and smaller, twosentences are presented. These reading cards are also availableas mixed-contrast cards on which high and low contrast (20%Weber) are presented side-by-side on the same card.
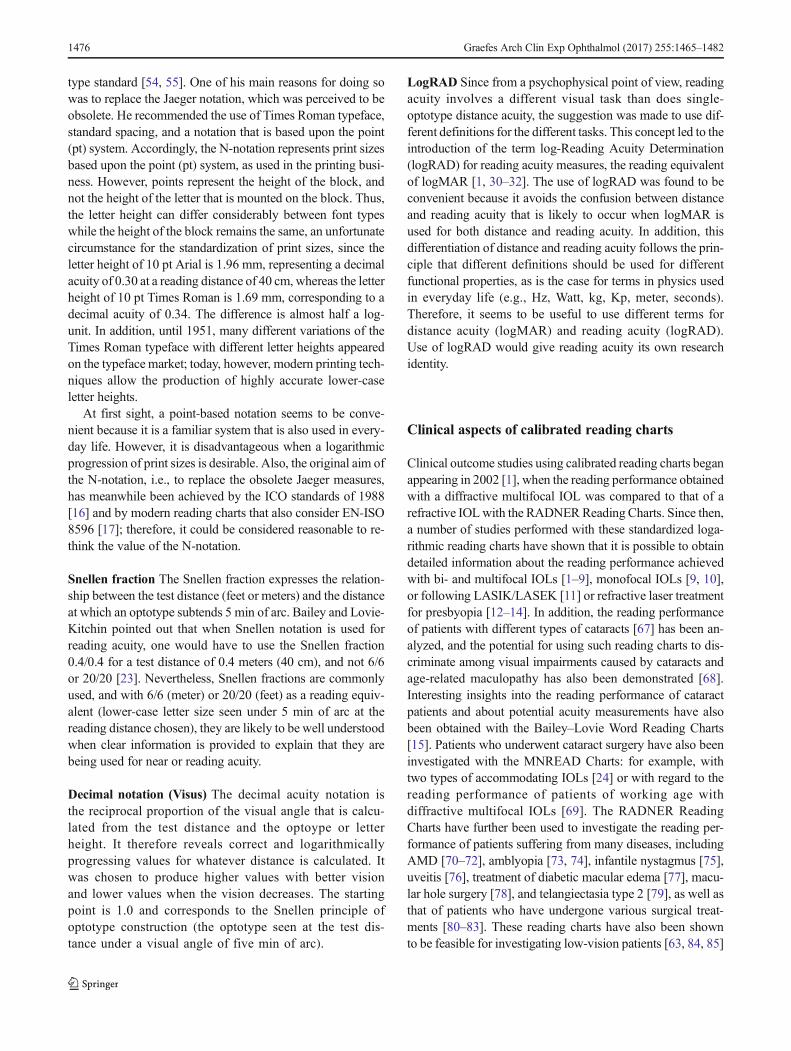
The Smith–Kettlewell Reading Test (SKread)
The SKread Test (Precision Vision,Woodstock, IL, USA) wasdeveloped to assess the reading performance of low-visionpatients and simultaneously allow estimation of the locationof scotomas [50]. It can also be used to determine the magni-fication needs of such patients. Each test paragraph containssix single letters and ten unrelated, randomly chosen words(60 characters including spaces; 47 letters, Fig. 6). The num-ber of words with two, three, four, five, and six letters is equalin all paragraphs. Words that can stand alone with letters miss-ing from the beginning or the end of the word were especially
Fig. 4 RADNER Reading Charts: Radner Reading Charts, asexemplified by the German version. Four text reading charts, a pagewith Landolt rings, and a page with numbers are provided in the
booklet (original size: big issue, DIN A4 29.7 cm × 21.0 cm; smallissue, DIN A5 21 cm × 14.8 xm)
Graefes Arch Clin Exp Ophthalmol (2017) 255:1465–1482 1471
included. This test principle was chosen because the authorswanted performance to depend upon word and letter recogni-tion alone, and wanted to exclude linguistic aspects such asgrammar and syntax. Print sizes progress logarithmically, andare labeled in M-units from 0.4 M to 4.0 M. No other notationis given.
The Oculus Reading Probe II
The Oculus Reading Probe II (Fig. 7) uses long paragraphsfrom a book written by Sven Hegin and from The Jungle Bookby Rudyard Kipling. The print sizes increase logarithmicallyfrom decimal acuity 1.0 to 0.04. Reading acuity is given for 25cm, 32 cm, and 40 cm. Within the booklet a timetable of trainschedules, an example of a telephone book, and SEPA num-bers are also given. Music, Landolt rings, and tumbling Es arealso provided.
The Oculus Reading Probe II is available in German, and isan innovative example of calibrating an already well-recognized reading chart with modern standards. In 2015,the OCULUS Corporation reissued their reading charts.
They asked the author of this article to collaborate inconforming the print sizes of the Oculus reading probe tothose of the RADNER Reading Chart (Fig. 4), which are inaccordance with the standards of the ICO committee [16] andthe EN ISO 8596 [17] (the author was responsible for theaccuracy of the print sizes; measurement system: ultra-mea-surement-lograd©). Now, the two leading reading charts inGerman-speaking countries provide calibrated reading acuitymeasures. This was the first time that two different readingchart systems had been calibrated so that the print sizes, andtherefore the reading acuity measures, were equalized.
Fig. 5 The Colenbrander EnglishContinuous Text Near VisionCards (Original size: 23.0 cm x18.0 cm) Printed with thepermission of AugustColenbrander
Fig. 6 SKread paragraph: Example of a paragraph of the SKread Charts.Unrelated words are interrupted by single letters. Printed with thepermission of Manfred MacKeben
1472 Graefes Arch Clin Exp Ophthalmol (2017) 255:1465–1482

Other ophthalmic reading tests
The present review article is focused on standardized readingcharts for measuring reading acuity and speed, and thereforeon aspects of standardized print size, print-size progression,and test-item definition. Such reading charts are meant toachieve an international standard for reading acuity measuresand permit standardized investigations of further aspects ofreading performance. Nevertheless, other reading tests thatcannot be considered calibrated still deserve a brief mention.
Eschenbach and Zeiss reading tests
The Eschenbach and Zeiss reading tests use long paragraphsand also provide a logarithmic progression of the print sizes.These reading tests are thought to determine the magnificationneeds of low vision patients. No visual acuity notation is
given. The test distance is 25 cm, and the print sizes rangebetween a decimal acuity of 0.2 to 0016 (Eschenbach) and 0.2to 0.001 (Zeiss).
Keeler Reading Test Types
The Keeler Reading Test Types use long paragraphs. The printsizes range from N5 cm to N48, and do not progress logarith-mically. The smallest print size is N5. For N5, the lower-caseletter height of the typeface used was found to be 0.973 mm,representing a decimal acuity of only 0.60 at 40 cm. A recom-mended reading distance is not provided. Between N5 andN10, logarithmic scaling is almost, but not completely accu-rately, achieved. From N12 (the log-scale would requireN12.6) to N 48, the progression of N-sizes cannot be consid-ered logarithmic, since, for example, N14 should be N15.8,and N36 should be N31.5.
Fig. 7 Oculus Reading Probe:(Original size: 21.0 cm× 14.8 cm)Printed with the permission of theOculus Corporation
Graefes Arch Clin Exp Ophthalmol (2017) 255:1465–1482 1473

IReST
The IReST (Precision Vision, Woodstock, IL, USA) [53] is alow-vision reading test and not a reading chart. It comes as abooklet, and uses long paragraphs for analyzing speed andfluency of reading in low-vision patients. Ten long paragraphswith different word counts have been developed for each ofthe 17 languages. By testing 25 normally sighted subjects (36for Japan), the mean reading speed ±SD is calculated for eachparagraph and is given, together with the word count, next toeach paragraph. There is evidence that significant differencescan occur between paragraphs [63].
Radner paragraph optotypes
Recently, a more elaborate concept for the standardization oflong paragraphs (paragraph optotypes) used for reading chartsand reading speed analysis has been published [56]. Sevenlong paragraphs were developed, each consisting of 111words, 179 syllables, and 660 characters (710, includingspaces). These paragraphs were also constructed so that wordswith the same number of syllables were in exactly the sameposition in the text in all paragraphs. Statistical analysisshowed good reliability and validity for these paragraphs.However, it was found that a statistically significant differencein reading speed could appear between long paragraphs, evenwhen the construction of the paragraphs was highly equiva-lent. Ultimately, two sequences of three paragraphs each, aswell as eight of 21 pairs of paragraphs, were statistically se-lected for which the reading speed was not significantlydifferent.
Reading parameters
In addition to reading acuity, the reading acuity score, themaximum reading speed, and the mean reading speed, severalother reading parameters can be analyzed, such as the readingspeed based upon reading acuity (Fig. 8) and the logMAR/logRAD ratio (Fig. 9). The reading score [10] (Fig.10) whichwas developed to compare the reading acuity based uponreading speed obtained under different reading conditions,can also provide useful information about functional vision.
An interesting parameter of clinical value is the criticalprint size (CPS) [29–32, 60, 64]. The CPS can either be de-fined by the examiner as the smallest print size that was readwith normal reading speed or, as given by Subramanian et al.[60], Bthe smallest print that supports the maximum readingspeed and is identified based on the criterion that all the fol-lowing (smaller) sentences are read at a speed that is 1.96times the standard deviation below the average of the largestpreceding sentences.^ However, the variant component anal-ysis for the examiner-based CPS determination [32] revealed
that the patients accounted for only 31% to 54% of the entirevariance, whereas for reading acuity, the patients accountedfor 85% to 94% of the whole variance (the higher this percent-age, the more likely it is that the test is dependent on theperson’s reading ability). In comparison to the other variables,the variance component analyses revealed that, for the CPS, aconsiderable proportion of the variability came from uniden-tified sources. One explanation for this difference might bethat the CPS is not a measurement in the same way as thereading acuity or speed, since it has to be set by the examinerat the smallest print size the patient can read with normalreading speed [32]. For the statistical definition of the CPS[60], it was also found that the coefficient of repeatability wasconsiderably weaker than that for reading acuity and readingspeed. In 2011, Patel et al. [65] reported even weaker coeffi-cients of repeatability for the CPS obtained with the
Fig. 9 logMAR/logRAD ratio: the logMAR/logRAD ratio shows thereading acuity (logRAD) as a percentage of the distance acuity(logMAR). In this figure, it is exemplified by the logMAR/logRAD ratioof a normally sighted person with healthy eyes and that of patients suf-fering from AMD. The logMAR/logRAD ratio is considerably lower inAMD patients
Fig. 8 Reading speed based upon reading acuity: The figure shows themean reading speed based upon reading acuity and the mean critical printsize for three different age groups. Note the difference in themean readingspeed between the two groups of ages 25 to 38 years and 40 to 53 yearsand the group of older readers aged 55 to 78 years
1474 Graefes Arch Clin Exp Ophthalmol (2017) 255:1465–1482

MNREAD Charts, and using different methods to determinethe CPS did not lead to an improvement in the coefficient ofrepeatability of the CPS. In the author’s opinion, the weakstatistical repeatability is a result of limited flexibility, becausethe CPS is strictly given in full 0.1 log units [60]. However,the reading speed at the CPS varies considerably betweenpatients, and it is likely that the real CPS would be somewherebetween log units (the closer the reading acuity is to the CPS,the faster reading speed will be). Such variations are not rep-resented within the CPS values. Nevertheless, the CPS pro-vides valuable information for clinical purposes.
Stop criteria
Reading charts using single sentences, sentence optotypes, orsequences of unrelated words also permit the introduction of astop criterion (the length of time that the subject is allowed toread before that individual trial is stopped). This criterion canbe freely chosen with regard to the requirements of clinicalroutine or a particular study design.
For the RADNER Reading Charts we suggest a stop crite-rion of 20 seconds [30, 31]. This corresponds to a readingspeed of about 40 wpm (reading speeds of 40 wpm or lowersuggest the reading of single words, i.e., spot reading [41]).The lower limit for fluent, sense-capturing reading has beenfound to be at about 80 wpm [41]. However, although it is ofinterest to know how many patients of a study group readfaster than 80 wpm, using 80 wpm for a stop criterion doesnot seem to be acceptable: 80 wpm represents a reading time
of just about 7 seconds per sentence for the MNREAD Chartsand 10 seconds per sentence for the RADNER ReadingCharts. In normal-sighted persons, these speeds per sentenceare too close to the reading speeds at the CPS. Using this limit,the patient’s full visual potential (i.e., best reading acuity)cannot be shown. However, best reading acuity is a result thatis as important as is the best distance acuity. Thus, readingacuity should be determined by procedures analogous to thoseused for single-optotype distance acuity [16, 17, 19, 20].Accordingly, stop criteria have to be chosen in a way thatguarantees the ability to deduce information about the bestreading acuity.
Notation
In 1874 Snellen and Landolt mentioned in their chapter [35]:BIt is regrettable, that for the determination of visual acuitythe consistency of scaling has not been more considered.Whereas the world vigorously pursues a uniformity for mint-age, weight and measure of length, it seems to be the otherway around in our field, trying to make the notations as di-versified as possible.^ Just a few years later, logarithmic pro-gression and the decimal notation as well as the Snellen nota-tion became the accepted standards in clinical routine world-wide. For reading charts, however, it seems that the statementof Snellen and Landolt is still true. Jaeger, Nieden, Parinaud,Decimal, Snellen, M-size, the N notation, line numbers,logMAR, logRAD, and VAR notations are currently in use,depending on the users’ location and educational background.It is not within the bounds of this review to present and discussall of this notation in detail. However, to mention a few types:
M-Size Sloan introduced the M-unit notation [66]. The M-unit is the letter height that corresponds to a visual angle of5 min of arc at a distance of 1 meter. The other print sizesderive from upwards and downwardsmultiplication, with dec-imal logarithmic steps of 100.1 starting from 1.0 for 1 meter.The notation is given in terms of the factor used to modify theprint size, multiplying it by the letter height at 1 meter (=1 M-unit). An advantage of the M-unit notation is that is equal tothe distance in meters at which a letter is seen under 5 min ofarc (analogous to a decimal acuity of 1.0, or Snellen 20/20).Although it implies a relationship to the print size, a disadvan-tage of the M-unit notation is that from the point of view ofusers of the decimal system, it is upside-down and is notcalculated using the real test distance used. The M-unit nota-tion is related to a fixed test distance of 1 meter but is also usedfor 40 cm and other reading distances. Another disadvantageis that for statistical analyses −logM has to be used.
N-Notation In 1951, Law published, on behalf of the BritishFaculty of Ophthalmology, a recommendation for a reading
Fig. 10 Reading score: the figure exemplifies the reading score per printsize obtained from patients with monofocal IOLs reading binocularly,either with best corrected reading acuity or without reading glasses (20patients were investigated). Although some of the patients could readnewspaper-sized print without reading glasses under good light condi-tions, their reading performance was significantly reduced. The gray areaindicates the range of print sizes, from newspaper (left edge) to high-glossjournals (right edge)
Graefes Arch Clin Exp Ophthalmol (2017) 255:1465–1482 1475
type standard [54, 55]. One of his main reasons for doing sowas to replace the Jaeger notation, which was perceived to beobsolete. He recommended the use of Times Roman typeface,standard spacing, and a notation that is based upon the point(pt) system. Accordingly, the N-notation represents print sizesbased upon the point (pt) system, as used in the printing busi-ness. However, points represent the height of the block, andnot the height of the letter that is mounted on the block. Thus,the letter height can differ considerably between font typeswhile the height of the block remains the same, an unfortunatecircumstance for the standardization of print sizes, since theletter height of 10 pt Arial is 1.96 mm, representing a decimalacuity of 0.30 at a reading distance of 40 cm, whereas the letterheight of 10 pt Times Roman is 1.69 mm, corresponding to adecimal acuity of 0.34. The difference is almost half a log-unit. In addition, until 1951, many different variations of theTimes Roman typeface with different letter heights appearedon the typeface market; today, however, modern printing tech-niques allow the production of highly accurate lower-caseletter heights.
At first sight, a point-based notation seems to be conve-nient because it is a familiar system that is also used in every-day life. However, it is disadvantageous when a logarithmicprogression of print sizes is desirable. Also, the original aim ofthe N-notation, i.e., to replace the obsolete Jaeger measures,has meanwhile been achieved by the ICO standards of 1988[16] and by modern reading charts that also consider EN-ISO8596 [17]; therefore, it could be considered reasonable to re-think the value of the N-notation.
Snellen fraction The Snellen fraction expresses the relation-ship between the test distance (feet or meters) and the distanceat which an optotype subtends 5 min of arc. Bailey and Lovie-Kitchin pointed out that when Snellen notation is used forreading acuity, one would have to use the Snellen fraction0.4/0.4 for a test distance of 0.4 meters (40 cm), and not 6/6or 20/20 [23]. Nevertheless, Snellen fractions are commonlyused, and with 6/6 (meter) or 20/20 (feet) as a reading equiv-alent (lower-case letter size seen under 5 min of arc at thereading distance chosen), they are likely to be well understoodwhen clear information is provided to explain that they arebeing used for near or reading acuity.
Decimal notation (Visus) The decimal acuity notation isthe reciprocal proportion of the visual angle that is calcu-lated from the test distance and the optoype or letterheight. It therefore reveals correct and logarithmicallyprogressing values for whatever distance is calculated. Itwas chosen to produce higher values with better visionand lower values when the vision decreases. The startingpoint is 1.0 and corresponds to the Snellen principle ofoptotype construction (the optotype seen at the test dis-tance under a visual angle of five min of arc).
LogRAD Since from a psychophysical point of view, readingacuity involves a different visual task than does single-optotype distance acuity, the suggestion was made to use dif-ferent definitions for the different tasks. This concept led to theintroduction of the term log-Reading Acuity Determination(logRAD) for reading acuity measures, the reading equivalentof logMAR [1, 30–32]. The use of logRAD was found to beconvenient because it avoids the confusion between distanceand reading acuity that is likely to occur when logMAR isused for both distance and reading acuity. In addition, thisdifferentiation of distance and reading acuity follows the prin-ciple that different definitions should be used for differentfunctional properties, as is the case for terms in physics usedin everyday life (e.g., Hz, Watt, kg, Kp, meter, seconds).Therefore, it seems to be useful to use different terms fordistance acuity (logMAR) and reading acuity (logRAD).Use of logRAD would give reading acuity its own researchidentity.
Clinical aspects of calibrated reading charts
Clinical outcome studies using calibrated reading charts beganappearing in 2002 [1], when the reading performance obtainedwith a diffractive multifocal IOL was compared to that of arefractive IOLwith the RADNERReading Charts. Since then,a number of studies performed with these standardized loga-rithmic reading charts have shown that it is possible to obtaindetailed information about the reading performance achievedwith bi- and multifocal IOLs [1–9], monofocal IOLs [9, 10],or following LASIK/LASEK [11] or refractive laser treatmentfor presbyopia [12–14]. In addition, the reading performanceof patients with different types of cataracts [67] has been an-alyzed, and the potential for using such reading charts to dis-criminate among visual impairments caused by cataracts andage-related maculopathy has also been demonstrated [68].Interesting insights into the reading performance of cataractpatients and about potential acuity measurements have alsobeen obtained with the Bailey–Lovie Word Reading Charts[15]. Patients who underwent cataract surgery have also beeninvestigated with the MNREAD Charts: for example, withtwo types of accommodating IOLs [24] or with regard to thereading performance of patients of working age withdiffractive multifocal IOLs [69]. The RADNER ReadingCharts have further been used to investigate the reading per-formance of patients suffering from many diseases, includingAMD [70–72], amblyopia [73, 74], infantile nystagmus [75],uveitis [76], treatment of diabetic macular edema [77], macu-lar hole surgery [78], and telangiectasia type 2 [79], as well asthat of patients who have undergone various surgical treat-ments [80–83]. These reading charts have also been shownto be feasible for investigating low-vision patients [63, 84, 85]
1476 Graefes Arch Clin Exp Ophthalmol (2017) 255:1465–1482

and have provided insights into the correlation between sco-toma size and reading performance [86].
With the MNREAD Charts, patients with retinitispigmentosa [87], AMD [88, 89], macular pucker and macularhole surgery [90], diabetic macular edema [91], and albinism[92] have been investigated, and further studies about thereading performance of low-vision patients have been per-formed [93–98]. In one study, the reading acuity was exam-ined with the Bailey–Lovie Word Reading Cards, and readingspeed was investigated with the MNREAD test [89].
In a study presenting a new way of standardizing longparagraphs as a functional vision test, it was shown that thereading speed in normally sighted persons changes with age,in terms of reading both long paragraphs and sentenceoptotypes [48]. The group aged 55 years or greater (mean:62.90 ± 7.36 years) read significantly more slowly than didthe groups aged 20 to 35 years (mean: 26.60 ± 3.72 years) or36 to 51 years (44.25 ± 4.76 years). This observation thatreading performance changes with age was recently con-firmed in a retrospective analysis of data obtained with theMNREAD Charts [99]. In that analysis, a break-point for de-creasing reading speed was detected at age 40. However, nosignificant difference was found between the groups aged 20to 35 and 36 to 51 [48]. A possible explanation for this differ-ence could be related to the retrospectively obtained data thatwere used: The participants in the study of Calabrese et al.[99] who served as the controls in the previous studies merelyread with their Bhabitual^ near refractive corrections [99] anddid not read with their best-corrected near vision, evaluateddirectly before the examination.
Since 2002, a considerable range of clinical studies hasshown that calibrated reading charts allow standardized andcomparable analysis of reading performance and, thus, of animportant aspect of functional vision. Results obtained withcalibrated reading charts allow comparison of research studiesand are more accurate than less standardized charts in terms ofcomparing clinical outcomes at different stages of follow-up.
Discussion
Bailey and Lovie–Kitchin concluded that Breading of wordsor sentences is clearly a more complex function than is readingthe widely spaced letters of a distance acuity chart^ [28]. Theyfurther stated that, as Bcompared to isolated letters, the indi-vidual letters within words are more difficult to recognizebecause of interactions with closely packed neighboringletters^ [25, 100]; the more important element in readingwas found by Bouma to be the recognition of letter and wordsequences [101, 102]. It therefore is not surprising that routinesingle-optotype visual acuity tests have been shown to be poorpredictors of reading performance and, thus, cannot elucidate
the full functional impairment of many ophthalmic diseases[26, 27, 70].
Accordingly, the appearance of calibrated reading chartshas initiated an increasing interest in a standardized investiga-tion of reading performance in patients with visual functionfrom normal to low vision. Reading parameters such as read-ing speed evaluation based upon reading acuity, the readingacuity score, the critical print size, and the mean and maxi-mum reading speeds have provided interesting insights intothe near functional performance of patients prior to and fol-lowing therapy [1–15, 79–83, 90].
For medical tests used in patient care, substantial statisticalanalyses of test items are conventionally required. Thus, it isevident that such analyses using adequate statistical methodsshould also be applied to test items used for reading charts.Different variants of test items have been chosen for readingcharts: (a) long paragraphs (Jaeger, Nieden, Oculus,Eschenbach, Zeiss), (b) unrelated words (Bailey–Lovie,SKread), (c) single sentences (MNREAD), and (d) so-calledBsentence optotypes^ that represent single sentences of mainclause followed by a relative clause construction (RADNER).However, statistical parameters have been analyzed and pub-lished in detail only for the sentence optotypes of theRADNER Reading Charts [30, 31]. Other test items are de-fined by the number of characters and/or by the word length[28, 29, 50]. For the RADNERReading Charts, the aimwas tocontrol linguistic aspects by statistically selecting the testitems (sentence optotypes), which had been developed to begrammatically equal, using words of equal or similar length inthe same positions in the sentences [30–32]. Particular carewas taken to avoid anticipation of the sentence’s content thatcould artificially increase the reading fluency [30, 31, 103].By introducing tight limits on reading length and the numberof errors, inclusion criteria were established [30, 31]: To beselected, the mean reading speed and error score of a sentenceoptotype had to be within these limits. Furthermore, theCronbach’s alpha, corrected item total correlation, and inter-item correlations were investigated and found to bewell abovestatistically required limits [30, 31, 62].
However, statistical test-item definitions such as the read-ing length interval, the Cronbach’s alpha, or the corrected itemtotal correlation are not available for the other calibrated read-ing charts. For the MNREAD Charts [29], the principle ofstandard word length as proposed by Carver [57, 58] wasadopted in order to achieve comparability between sentenceswith different numbers of words. Ahn and Legge [104] vali-dated the computerized MNREAD test in low-vision patientsby comparing the reading speed obtained with singlesentences presented on a computer screen to those obtainedfrom the same patients when they read long paragraphs withtheir Bpreferred^ magnifiers. Ahn and Legge found that theMNREAD score is a good predictor of magnifier-aided read-ing speed, and that distance visual acuity is not. In a further
Graefes Arch Clin Exp Ophthalmol (2017) 255:1465–1482 1477

study, Ahn et al. [52] presented a printed card version usingthe same set of sentences and display format. In order to findthe simplest method of test presentation, they compared threedifferent methods (hand-held; mounted on a board; insertedinto a self-supporting stand) to each other in 23 low-visionpatients. No significant differences were found among thethree methods. However, the sentences used in these studiesconsisted of four lines and 52 characters/spaces (13 character/spaces per line) and were different in length from those usedfor the MNREAD Charts (three lines and 60 characters/spaces) [29].
Another approach to reducing linguistic concerns such asgrammar and syntax has been used in the Bailey–Lovie WordReading Chart [28] and the SKread Charts [50]. Both tests useunrelated words which, in the case of the SKread, are alsointerrupted by single letters. With such tests, it is thought thatlinguistic aspects are widely excluded because reading perfor-mance depends on word and letter recognition alone. TheEnglish SKread charts [50] were compared to the MNREADcharts, and the German SKread charts [105] were compared tothe German version of the RADNER Reading Charts; thereading speed and number of errors were compared to theMNREAD charts at a print size of 8M (decimal: 0.05 at 40cm) and with the RADNER Charts at 5M (decimal: 0.08 at 40cm). With the SKread test, the reading speed was significantlyslower, and the number of errors was considerably higher fornormally sighted subjects as well as for patients with amaculopathy, when compared to those obtained with theMNREAD and RADNER charts. This result indicates thatparagraphs using unrelated words are more difficult to read,because performance relies on visual criteria alone, withoutthe help of the linguistic aspects of the text. The repeatabilityof the maximum reading speed was found to be high for bothversions of SKread (test–retest with an interval of 1 to 2 mi-nutes), when the mean reading speed of five paragraphs abovethe CPS was calculated in normally sighted subjects.However, the repeatability was not given for other readingparameters, such as reading acuity. Not all SKread paragraphsfrom the whole set were included in these comparativestudies.
Reliability and validity analyses of reading charts wereintroduced into ophthalmology in 2004 [32] with the investi-gation of the test–retest reliability (test interval: 3 to 4 weeks),interchart reliability, and variance component analysis for sev-eral reading parameters obtained with the RADNER ReadingCharts (using a Latin square design). This study also includedBland–Altman analyses. For the reading acuity, reading acuityscore, maximum reading speed, and logMAR/logRAD ratio,good repeatability was demonstrated. The Pearson correla-tions were high between the reading parameters and charts.The Bland–Altman plots showed a high degree of agreementbetween the two test sessions and among the three readingcharts. In addition, a variance component analysis was
performed [32, 59]. These analyses revealed that the individ-uals (patients) were predominantly responsible for the vari-ability of the results. The testing procedure had only a minorinfluence on the whole variance, indicating that the test ishighly reproducible.
Some months later, Virgili et al. [61] investigated a groupof children with the Italian version of the MNREAD Charts,and demonstrated a good coefficient of repeatability (test in-terval: same day) for the reading acuity, reading speed, andCPS. In 2009, Subramanian et al. [60] reported the coefficientof repeatability in visually impaired patients for the Englishversion of the MNREAD Charts (test interval: the same day).As in the study of the RADNER Reading Charts [32], aBland–Altman analysis was again performed. In 2011, Patelet al. [65] reported a considerably weaker coefficient of re-peatability in visually impaired AMD patients investigatedwith the MNREAD Charts than had been found bySubramanian et al. [60]. The difference in the coefficient ofrepeatability for reading acuity was 0.3 vs 0.1 logMAR; fordifferent methods of calculating the maximal reading speed,the coefficients of repeatability were 0.22 to 0.25 vs 0.1logwpm, and for the CPS, the coefficients of repeatabilitywere 0.44 to 0.67 vs 0.3 logMAR. Patel et al. [65] concludedthat in addition to patient-related aspects of variability, the factthat many different examiners investigated the patients duringa clinical research trial may have been another factor (a variantcomponent analysis to test this hypothesis has not yet beenperformed). It therefore cannot be fully excluded that the timeperiod between the test and the retest examinations had ahigher influence on the coefficient of repeatability than ex-pected (test interval: the same day in the study ofSubramanian et al., and 6 weeks in the study of Patel et al.).
Although single sentences or short paragraphs of unrelatedwords have become the preferred choice for test items used inmodern calibrated reading charts, the question of whether longparagraphs or single sentences should be used is still a matterof interest. One of the reasons a single-sentence constructionwas used for the RADNERReading Charts was that it allowedthe introduction of a stop criterion, enabling an examiner toanalyze the reading performance from fully read test items andnot just from partially read long paragraphs, as can occurwhen reading the full paragraph would be too time- consum-ing in a busy patient care unit. Another reason was that singlesentences are less susceptible to subjective influences such asmotivation, interest, and mind-wandering or difficulty in con-centrating [42, 44–46, 48, 106]. In addition, single sentencesmade it possible to control linguistic aspects such as grammarand syntax and to keep the geometric proportions of the testitems constant throughout the whole reading chart [30, 31, 59,62]. This consistency makes it easier to control the reliabilityand accuracy of a reading chart with respect to research andclinical purposes [30–32, 56, 57]. When long paragraphs areused for reading charts, they have to be reduced in length
1478 Graefes Arch Clin Exp Ophthalmol (2017) 255:1465–1482

when the text length exceeds the space limits because of in-creasing print size, reducing their comparability to paragraphsin smaller print size. In addition, it is difficult to develop longparagraphs that are statistically comparable [48, 63], sincesignificant differences can appear between long paragraphseven when the construction of the paragraphs is equal in termsof grammar, syntax, word length, number of syllables perword, and number of characters [48]. On the other hand, longparagraphs are advantageous when the reading fluency of apatient has to be optimized, as for low-vision care when read-ing aids are prescribed. Longer paragraphs can also be advan-tageous for fitting multifocal contact lenses in order to exam-ine how the near addition works over a longer reading period.
Nevertheless, the answer to the question of whether singlesentences or long paragraphs should be used for reading testsdepends on the patient’s needs, because reading speed de-pends on many different factors, including the visual proper-ties of the eye, the difficulty of the text, the length of the wordsused, interest, motivation, and mind-wandering [42, 44–46,48, 106]. In addition, as noted previously, we have shown thatreading speed changes with age [48], and this finding hasrecently been confirmed by Calabrese et al. [99]. Thus, thereading fluency and speed of a person varies within a range ofreading speeds, confined by several subjective and objectivecircumstances that include linguistic aspects of the readingmaterial, such as difficulty, word length, grammar, and syntax[46, 48, 50, 58, 100, 107, 108]. In other words, there is not justone reading speed for a person; the person’s reading speed isdependent on the characteristics of the test items used [46, 48,50, 56, 57, 108].
In summary, it seems to be evident that calibrated, stan-dardized reading charts such as the Bailey–Lovie ReadingWord Reading Charts [28], the Colenbrander Cards, theMNREAD Charts [29], the Oculus Reading Probe II, theSKread Charts [50], and the RADNER Reading Charts[30–32] facilitate international and clinical communicationin the field of reading performance and functional vision.Calibrated reading charts are available in many languagesand have become a valuable tool for comparative analysesof reading performance.
Acknowledgments The author would like to thank Prof. Ian Bailey,PhD, Prof. August Colenbrander, PhD, Prof. Gordon Legge, PhD, andDir. Manfred MacKeben, PhD, for their valuable contribution in writingthe paragraphs explaining their reading charts and for their factual inputwith regard to the context of the scientific backgrounds. I would also liketo thank Deborah McClellan, PhD, for editorial assistance.
Compliance with ethical standards Not necessary for a review article.
Funding No funding was received for this article.
Conflict of interest W. Radner receives royalties for the RadnerReading Charts and the Oculus Reading Probe II and has served as con-sultant for the Oculus Cooperation during the development of this reading
probe. The author has no further affiliation with or involvement in anyorganization or entity with any financial interest (such as honoraria; edu-cational grants; participation in speakers’ bureaus; membership, employ-ment, consultancies, stock ownership, or other equity interest; and experttestimony or patent licensing arrangements) or non-financial interest(such as personal or professional relationships, affiliations, knowledge,or beliefs) in the subject matter or materials discussed in this manuscript.
Open Access This article is distributed under the terms of the CreativeCommons At t r ibut ion 4 .0 In te rna t ional License (h t tp : / /creativecommons.org/licenses/by/4.0/), which permits unrestricted use,distribution, and reproduction in any medium, provided you give appro-priate credit to the original author(s) and the source, provide a link to theCreative Commons license, and indicate if changes were made.
References
1. Richter-Mueksch S, Weghaupt H, Skorpik C, Velikay-Parel M,Radner W (2002) Reading performance with a refractive multifo-cal and a diffractive bifocal intraocular lens. J Cataract RefractSurg 28:1957–1963
2. Huetz WW, Eckhardt HB, Rohrig B, Grolmus R (2006) Readingability with 3 multifocal intraocular lens models. J CataractRefract Surg 32:2015–2021
3. Huetz WW, Eckhardt HB, Röhrig B, Grolmus R (2008)Intermediate vision and reading speed with array, Tecnis, andReSTOR intraocular lenses. J Refract Surg 24:251–256
4. Huetz WW, Jäckel R, Hoffman PC (2012) Comparison of visualperformance of silicone and acrylic multifocal IOLs utilizing thesame diffractive design. Acta Ophthalmol 90:530–533
5. Alio JL, Simonov A, Plaza-Puche AB, Angelov A, Angelov Y,van Lawick W et al (2016) Visual outcomes and accommodativeresponse of the Lumina accommodative intraocular lens. Am JOphthalmol 164:37–48
6. Pallikaris I, Kontadakis G, Portaliou D (2011) Real andpseudoaccommodation in accommodative lenses. J Ophthalmol2011:284961. doi:10.1155/2011/284961
7. Alió J, Plaza-Puche A, Montalban R, Ortega P (2012) Near visualoutcomes with single-optic and dual-optic accommodating intra-ocular lenses. J Cataract Refract Surg 38:1568–1575
8. Alió J, Plaza-Puche A, Piñero D et al (2011) Optical analysis,reading performance, and quality-of-life evaluation after implan-tation of a diffractivemultifocal intraocular lens. J Cataract RefractSurg 37:27–37
9. Radner W, Radner S, Raunig V, Diendorfer G (2014) Readingperformance of monofocal pseudophakic patients with and with-out glasses under normal and dim light condition. J CataractRefract Surg 40:369–375
10. Lehmann R, Houtman D (2012) Visual performance in cataractpatients with low levels of postoperative astigmatism: full correc-tion versus spherical equivalent correction. Clin Ophthalmol 6:333–338
11. Richter-Mueksch S, Kaminski S, Kuchar A et al (2005) Influenceof laser in situ keratomileusis and laser epithelial keratectomy onpatients’ reading performance. J Cataract Refract Surg 31:1544–48
12. Baudu P, Penin F, ArbaMosquera S (2013) Uncorrected binocularperformance after biaspheric ablation profile for presbyopic cor-neal treatment using AMARIS with the PresbyMAXmodule. AmJ Ophthalmol 155:636–647
Graefes Arch Clin Exp Ophthalmol (2017) 255:1465–1482 1479

13. Luger M, Ewering T, Arba-Mosquera S (2013) One-year experi-ence in presbyopia correction with biaspheric multifocal centralpresbyopia laser in situ keratomileusis. Cornea 32:644–652
14. Uthoff D, Pölzl M, Hepper D, Holland D (2012) A newmethod ofcornea modulation with excimer laser for simultaneous correctionof presbyopia and ametropia. Graefes Arch Clin Exp Ophthalmol250:1649–1661
15. Elliott D, Patel B, Whitaker D (2001) Development of a readingspeed test for potential-vision measurements. Invest OphthalmolVis Sci 42:1945–1949
16. Colenbrander A (1988) Consilium OphthalmologicumUniversaleVisual Functions Committee, Visual Acuity MeasurementStandard. Ital J Ophthalmol 11:5–19
17. CEN European Committee of Norms (1996) Europäische NormSehschärfenprüfung EN ISO 8596. Beuth, Berlin
18. Radner W (2015) Ophthalmic reading charts: Part 2: Current log-arithmically scaled reading charts. Ophthalmologe 113(12):1029–1035. doi:10.1007/s00347-015-0175-7
19. Holladay J (2004) Visual acuity measurements. J Cataract RefractSurg 30:287–290
20. Snellen H (1862)Optotypi ad visum determinandum. P.W. van derWeijer, Utrecht
21. Birkhäuser R (1911) Leseproben für die Nähe aus derUniversitäts-Augenklinik Bern. Julius Springer, Berlin
22. Radner W (2016) Ophthalmic reading tests : Part 1: historicalaspects. Ophthalmologe 113:918–924
23. Bailey I, Lovie-Kitchin J (2013) Visual acuity testing. From thelaboratory to the clinic. Vis Res 90:2–9
24. Brown D, Dougherty P, Gills JP, Hunkeler J, Sanders D, SandersM (2009) Functional reading acuity and performance:Comparison of 2 accommodating intraocular lenses. J CataractRefract Surg 35:1711–1714
25. FlomM,Weymouth F, Kahneman D (1963) Visual resolution andcontour interactions. J Opt Soc Am 53:1026–1032
26. Legge GE, Ross JA, Isenberg LM, LaMay JM (1992)Psychophysics of reading. Clinical predictors of low-vision read-ing speed. Invest Ophthalmol Vis Sci 33:677–687
27. Mc Clure ME, Hart PM, Jackson AJ, Stevenson MR,Chakravarthy U (2000) Macular degeneration: do conventionalmeasurements of impaired visual function equate with visual dis-ability? Br J Ophthalmol 84:244–250
28. Bailey IL, Lovie JE (1980) The design and use of a new near-vision chart. Am J Optom Physiol Opt 57:378–387
29. Mansfield J, Ahn SJ, Legge GE, Luebker A (1993) A newreading-acuity chart for normal and low vision. Opt Soc AmTechn Digest 3:232–235
30. Radner W, Willinger U, Obermayer W, Mudrich C, Eisenwort B(1998) A new reading chart for simultaneous determination ofreading vision and reading speed. Klin Monatsbl Augenheilkd213:174–181
31. Radner W, Obermayer W, Richter-Mueksch S, Willinger U,Eisenwort B (2002) The validity and reliability of short Germansentences for measuring reading speed. Graefes Arch Clin ExpOphthalmol 240:461–467
32. Stifter E, Koenig F, Lang T, Bauer P, Richter-Muksch S, Velikay-Parel M, Radner W (2004) Reliability of a standardized readingchart system: variance component analysis, test–retest and inter-chart reliability. Graefes Arch Clin Exp Ophthalmol 242:31–39
33. Jaeger E (1854) Über Staar und Staaroperationen nebst andererBeobachtungen und Erfahrungen. Seidel und Sohn, Wien
34. Jaeger E (1856) Schrift-Scalen. Verlag: Seidel und Sohn Wien;Victor Masson, Paris
35. Graefe A, Saemisch T (1874) Handbuch der gesamtenAugenheilkunde, Bd 3, Part 1. Engelmann, Leipzig
36. Green J (1868) On a new series of test-letters for determining theacuteness of vision. Trans AmOphthalmol Soc 4thMeeting 1: 4-5
37. Nieden A (1882) Schrift-Proben zur Bestimmung der Sehschärfe.J.F. Bergman, Wiesbaden
38. Birkhäuser R (1918) Ein neuer Weg zur Herstellung vonLeseproben (Sehproben) für die Nähe. Habilitationsschrift.Springer, Berlin Heidelberg
39. Colenbrander A, Runge P (2007) Can Jaeger numbers be stan-dardized? Invest Ophthalmol Vis Sci 48:Abstract 3563
40. Nieden A (1947) Schrift-Proben zur Bestimmung der Sehschärfe.Hummelsheim E (ed) J.F. Bergman Publisher, München
41. Whittaker SG, Lovie-Kitchin J (1993) Visual requirements forreading. Optom Vis Sci 70:54–65
42. Quercia P (2010) Ocular movements and reading: a review. J FrOphtalmol 33:416–423
43. Al-Shidhani T, Arora V (2012) Understanding dyslexia in childrenthrough human development theories. Sultan Qaboos Univ Med J12:286–294
44. Mooneyham B, Schooler J (2013) The costs and benefits of mind-wandering: a review. Can J Exp Psychol 67:11–18
45. Broadway J, Franklin M, Schooler J (2015) Early event-relatedbrain potentials and hemispheric asymmetries reveal mind wan-dering while reading and predict comprehension. Biol Psychol107:31–43
46. Fulcher G (1997) Text difficulty and accessibility: reading formu-lae and expert judgment. System 25:497–513
47. Mullis I, Martin M (2015) PIRLS 2016 Assessment Framework2nd Ed. TIMSS & PIRLS International Study Center, BostonCollege, Chestnut Hill, MA
48. Radner W, Radner S, Diendorfer G (2016) A new principle forstandardizing long paragraphs for reading speed analyses. GraefesArch Clin Exp Ophthalmol 254:177–184
49. Sloan L, Brown D (1963) Reading cards for selection of opticalaids for the partially sighted. Am J Ophthalmol 55(1187):1199
50. MacKeben M, Nair U, Walker L, Fletcher DC (2015) Randomword recognition chart helps scotoma assessment in low vision.Optometry and Vis Sci 924:421–428
51. Legge G, Ross J, Luebker A, LaMay J (1998) Psychophysics ofreading VIII. The Minnesota Low-Vision Reading Test. OptomVis Sci 66:843–853
52. Ahn S, Legge G, Luebker A (1995) Printed cards for measuringlow-vision reading speed. Vision Res 35:1939–1944
53. Trauzettel-Klosinski S, Dietz K, IReST Study Group (2012)Standardized assessment of reading performance: the NewInternational Reading Speed Texts IReST. Invest OphthalmolVis Sci 53:5452–5461
54. Law FW (1951) Standardization of reading types. Br JOphthalmol 35:765–773
55. Law FW (1952) Reading Types. Br J Ophthalmol 36:689–69056. Carver R (1976) Word length, prose difficulty, and reading rate. J
Lit Res 8:193–20357. Carver R (1990) Reading rate: a review of research and theory.
Academic Press, San Diego58. Mansfield JS, Legge G (2007) The MNREAD Acuity Chart
(Chapter 5). In: G. Legge (ed.) Psychophysics of reading in nor-mal and low vision. Lawrence Erlbaum Associates, Mahwah NJ,pp 1–32
59. Maaijwee K, Mulder P, Radner W, Van Meurs JC (2008)Reliability testing of the Dutch version of the radner readingcharts. Optom Vis Sci 85:353–358
60. Subramanian A, Pardhan S (2009) Repeatability of reading abilityindices in subjects with impaired vision. Invest Ophthalmol VisSci 50:3643–3647
61. Virgili G, Cordaro C, Bigoni A, Crovato S, Cecchini P, MenchiniU (2004) Reading acuity in children: evaluation and reliabilityusingMNREAD charts. Invest Ophthalmol Vis Sci 45:3349–3354
62. Radner W, Diendorfer G (2014) English sentence optotypes formeasuring reading acuity and speed—the English version of the
1480 Graefes Arch Clin Exp Ophthalmol (2017) 255:1465–1482
Radner Reading Charts. Graefes Arch Clin Exp Ophthalmol 252:1297–1303
63. Brussee T, van Nispen RM, van Rens GH (2014) Measurementproperties of continuous text reading performance tests.Ophthalmic Physiol Opt 34:636–657
64. Mansfield JS, LeggeGE, BaneMC (1996) Psychophysics of read-ing. XV: font effects in normal and low vision. Invest OphthalmolVis Sci 37:1492–1501
65. Patel P, Chen F, Da Cruz L, Rubin G, Tufail A (2011) Test-retestvariability of reading performance metrics using MNREAD inpatients with age-related macular degeneration. InvestOphthalmol Vis Sci 52:3854–3859
66. Sloan L (1959) New test charts for the measurement of visualacuity at far and near distances. Am J Ophthalmol 48:807–813
67. Stifter E, Weghaupt H, Benesch T, Thaler A, Radner W (2005)Discriminative power of reading tests to differentiate visual im-pairment caused by cataract and age-relatedmacular degeneration.J Cataract Refract Surg 31:2111–2119
68. Stifter E, Sacu S,Weghaupt H, König F, Richter-Müksch S, ThalerA, Velikay-Parel M, Radner W (2004) Reading performance de-pending on the type of cataract and its predictability on the visualoutcome. J Cataract Refract Surg 30:1259–1267
69. Cillino G, Casuccio A, Pasti M, Bono V, Mencucci R, Cillino S(2014) Working-age cataract patients: visual results, reading per-formance, and quality of life with three diffractive multifocal in-traocular lenses. Ophthalmology 121:34–44
70. Richter-Mueksch S, Stur M, Stifter E, Radner W (2006)Differences in reading performance of patients with drusenmaculopathy and subretinal fibrosis after CNV. Graefes ArchClin Exp Ophthalmol 244:154–162
71. Muether PS, Hoerster R, Hermann MM, Kirchhof B, Fauser S(2013) Long-term effects of ranibizumab treatment delay inneovascular age-related macular degeneration. Graefes ArchClin Exp Ophthalmol 251:453–458
72. Koch K, Muether P, Hermann M et al (2012) Subjective percep-tion versus objective outcome after intravitreal ranibizumab forexudative AMD. Graefes Arch Clin Exp Ophthalmol 250:201–209
73. Stifter E, Burggasser G, Hirmann E, Thaler A, Radner W (2005)Evaluating reading acuity and speed in children withmicrostrabismic amblyopia using a standardized reading chart sys-tem. Graefes Arch Clin Exp Ophthalmol 243:1228–1235
74. de Wit D, Diaz J, Moore T, Moore J (2012) Refractive lens ex-change for a multifocal intraocular lens with a surface-embeddednear section in mild to moderate anisometropic amblyopic pa-tients. J Cataract Refract Surg 38:1796–1801
75. Barot N, McLean R, Gottlob I, Proudlock F (2013) Reading per-formance in infantile nystagmus. Ophthalmology 120:1232–1238
76. Kiss C, Barisani-Asenbauer T, Maca S, Richter-Mueksch S,Radner W (2006) Reading performance of patients with uveitis-associated cystoid macular edema. Am J Ophthalmol 142:620–624
77. Finger R, Charbel-Issa P, Fimmers R et al (2009) Reading perfor-mance is reduced by parafoveal scotomas in patients with maculartelangiectasia type 2. Invest Ophthalmol Vis Sci 50:1366–1370
78. Caramoy A, Fauser S, Kirchhof B (2011) Retinal stimuli can berestored after autologous transplant of retinal pigment epitheliumand choroid in pigment epithelium tears. Acta Ophthalmol 9:490–495
79. Joussen A, Joeres S, Fawzy N et al (2007) Autologous transloca-tion of the choroid and retinal pigment epithelium in patients withgeographic atrophy. Ophthalmology 114:551–560
80. Richter-Mueksch S, Sacu S, Osarovsky-Sasin E et al (2009)Visual performance 3 years after successful macular hole surgery.Br J Ophthalmol 93:660–663
81. Joeres S, Heussen F, Treziak T, Bopp S, Joussen A (2007)Bevacizumab (Avastin) treatment in patients with retinal
angiomatous proliferation. Graefes Arch Clin Exp Ophthalmol245:1597–1602
82. Krepler K, Wagner J, Sacu S, Wedrich A (2005) The effect ofintravitreal triamcinolone on diabetic macular edema. GraefesArch Clin Exp Ophthalmol 243:478–481
83. Munk M, Kiss C, Huf W et al (2013) One year follow-up offunctional recovery in neovascular AMD during monthly anti-VEGF treatment. Am J Ophthalmol 156:633–643
84. Burggraaff M, van Nispen R, Hoeben F, Knol D, van Rens G(2012) Randomized controlled trial on the effects of training inthe use of closed-circuit television on reading performance. InvestOphthalmol Vis Sci 53:2142–2150
85. Burggraaff M, van Nispen R, Hoek S, Knol DL, van Rens GH(2010) Feasibility of the Radner Reading Charts in low-visionpatients. Graefes Arch Clin Exp Ophthalmol 248:1631–1637
86. Ergun E, Maár N, Radner W, Barbazetto I, Schmidt-Erfurth U,Stur M (2003) Scotoma size and reading speed in patients withsubfoveal occult choroidal neovascularization in age-related mac-ular degeneration. Ophthalmology 110:65–69
87. Virgili G, Pierrottet C, Parmeggiani F, Pennino M, Giacomelli G,Steindler P, Menchini U, Orzalesi N (2011) Reading performancein patients with retinitis pigmentosa: a study using the MNREADcharts. Invest Ophthalmol Vis Sci 45:3418–3424
88. Calabrèse A, Bernard JB, Hoffart L, Faure G, Barouch F, ConrathJ, Castet E (2011) Wet versus dry age-related macular degenera-tion in patients with central field loss: different effects on maxi-mum reading speed. Invest Ophthalmol Vis Sci 52:2417–2424
89. Cacho I, Dickinson CM, Smith HJ, Harper RA (2010) Clinicalimpairment measures and reading performance in a large age-related macular degeneration group. Optom Vis Sci 87:344–349
90. Cappello E, Virgili G, Tollot L, Del Borrello M, Menchini U,Zemella M (2009) Reading ability and retinal sensitivity aftersurgery for macular hole and macular pucker. Retina 29:1111–1118
91. Edington M, Sachdev A, Morjaria R, Chong V (2016) Structuralfunctional correlation in patients with diabetic macular edema.Retina. doi:10.1097/IAE.0000000000001266
92. Giacomelli G, Virgili G, Giansanti F, Sato G, Cappello E, CrucianiF, Varano M, Menchini U (2013) Clinical and microperimetricpredictors of reading speed in low vision patients: a structuralequation modeling approach. Invest Ophthalmol Vis Sci 54:4403–4408
93. Decarlo DK, McGwin G Jr, Searcey K, Gao L, Snow M, StevensL, Owsley C (2012) Use of prescribed optical devices in age-related macular degeneration. Optom Vis Sci 89:1336–1342
94. Merrill K, Hogue K, Downes S, Holleschau AM, Kutzbach BR,MacDonald JT, Summers CG (2011) Reading acuity in albinism:evaluation with MNREAD charts. J AAPOS 15:29-32
95. Tarita-Nistor L, Brent MH, Markowitz SN, Steinbach MJ,González EG (2013)Maximum reading speed and binocular sum-mation in patients with central vision loss. Can J Ophthalmol 48:443–449
96. Fletcher DC, Schuchard RA, Watson G (1999) Relative locationsof macular scotomas near the PRL: effect on low vision reading. JRehabil Res Dev 36:356–364
97. Matsumoto Y, Oda K, Yuzawa M (2004) Fixation points and ret-inal sensitivity observed in reading text by patients with bilateralmacular atrophy. Nippon Ganka Gakkai Zasshi 108:302–306
98. Calabrèse A, Bernard JB, Hoffart L, Faure G, Barouch F, ConrathJ, Castet E (2010) Small effect of interline spacing on maximalreading speed in low-vision patients with central field loss irre-spective of scotoma size. Invest Ophthalmol Vis Sci 51:1247–1254
99. Calabrèse A, Cheong AM, Cheung SH, He Y, Kwon M,Mansfield JS, Subramanian A, Yu D, Legge GE (2016) Baseline
Graefes Arch Clin Exp Ophthalmol (2017) 255:1465–1482 1481

MNREAD measures for normally sighted subjects from child-hood to old age. Invest Ophthalmol Vis Sci 57:3836–3843
100. Flom M, Heath G, Takahashi E (1963) Contour interactions andvisual resolution: Contralateral effects. Science 142:979–980
101. Bouma H (1970) Interaction effects in parafoveal letter recogni-tion. Nature 226:177–178
102. Bouma H (1971) Visual recognition of isolated lower case letters.Vision Res 11:459–474
103. Hohenstein S, Kliegl R (2014) Semantic preview benefit duringreading. J Exp Psychol Learn Mem Cogn 40:166–190
104. Ahn S, Legge G (1995) Psychophysics of reading XIII. Predictorsof magnifier-aided reading speed in low vision. Vision Res 35:1931–1938
105. Eisenbarth W, Pado U, Schriever S, Schötschel D, Feucht N,MacKeben M (2016) Localization of scotomas in AMD by read-ing test: random series of words in standardized format.Ophthalmologe 113:754–762
106. Unsworth N, McMillan B (2013) Mind wandering and readingcomprehension: examining the roles of workingmemory capacity,interest, motivation, and topic experience. J Exp Psychol LearnMem Cogn 39:832–842
107. Sass SM,LeggeGEet al (2006) Low-vision reading speed: influencesof linguistic inference and aging. Optom Vis Sci 83:166–177
108. Bjoernsson C (1968) Laesbarhet. Liber, Stockholm
1482 Graefes Arch Clin Exp Ophthalmol (2017) 255:1465–1482