ready or not? - accenture or not? creating a world-leading oil ... 3 ibisworld industry report...
TRANSCRIPT

Ready or Not?Creating a world-leading oil and gas industry in AustraliaProduced in association with APPEA

2 Copyright © Accenture 2015 All rights reserved.

Copyright © Accenture 2015 All rights reserved. 3
Contents
4 Copyright © Accenture 2015 All rights reserved.
Executive Summary .............................................................................................................................................................................6
Research Methodology ....................................................................................................................................................................7
Transition from Investment to Production ..........................................................................................................................10
Operating Expenditure Rises as Capital Investment Declines ...................................................................................11
Market Changes Will Force Service Providers to Respond or Disappear ............................................................11
Increasing Demand for Critical Services ................................................................................................................................12
Is the Australian LNG Services Sector Ready to Become a World Leader? ................................................16
Services Sector Readiness Results ............................................................................................................................................16
Capacity: Positive Outlook .............................................................................................................................................................17
Workforce Quantity ......................................................................................................................................................................18
Workforce Quality ..........................................................................................................................................................................18
Workforce Experience .................................................................................................................................................................18
Capability: Confident for the Future ........................................................................................................................................20
Adapting Operating Models .....................................................................................................................................................21
Embracing Technology and Innovation ..............................................................................................................................21
Recognising Leading Practice: Innovation ............................................................................................................................22
Case Study: KT Maritime............................................................................................................................................................22
Case Study: Oceaneering ...........................................................................................................................................................22
Competitiveness: Room for Improvement .............................................................................................................................23
High Labour Cost and Low Productivity ...........................................................................................................................23
Tendering and Contracting Strategies ................................................................................................................................26
Regulatory Framework: Complex and Inconsistent .........................................................................................................26
Recognising Leading Practice: Addressing Regulatory Challenges .........................................................................28
Case Study: Easternwell .............................................................................................................................................................28
Lessons from UK Oil and Gas sector ...................................................................................................................................28
Industrial Relations: Significant Improvement Needed .................................................................................................29

Copyright © Accenture 2015 All rights reserved. 5
Recommendations: How to Achieve World-Leading LNG Production ...........................................................32
Accelerate the Development of Experience .........................................................................................................................32
Integrate Industry Operating Models ......................................................................................................................................32
Case Study: Subsea Energy Australia .................................................................................................................................33
Case Study: South Australian Roadmap for Unconventional Gas Projects ..................................................33
Industry Optimisation through Standardisation ................................................................................................................33
Implementing Accelerators ............................................................................................................................................................33
Adopt Recognised Leading Practices .......................................................................................................................................34
Build Centres of Excellence ......................................................................................................................................................34
Collaborate with Intent ....................................................................................................................................................................34
Operator Collaboration in the Australian LNG Sector ..............................................................................................35
Innovate with Technology ..............................................................................................................................................................36
Case Study: Offshore Unlimited .............................................................................................................................................36
Embrace Digital Technology ..........................................................................................................................................................36
Digital Case Studies ......................................................................................................................................................................37
Special Insert: The Silver Bullet? Turning Around the Turnaround Situation ....................................................40
Conclusion ..................................................................................................................................................................................................44
Glossary ........................................................................................................................................................................................................45
References ..................................................................................................................................................................................................46

6 Copyright © Accenture 2015 All rights reserved.
Executive Summary
The Australian liquefied natural gas (LNG) industry is undergoing a major transition. Australia has dominated global LNG capital expenditure over the past few years – more than $250 billion1 has been invested in what will soon be the world’s largest, most modern and technologically advanced LNG industry. The construction phase of these projects has now peaked, and the sector is transitioning into an exciting new operations phase at a time of increased volatility in the global oil and gas price environment. Despite this uncertainty, it is expected that 13 new LNG trains within seven new plants will come online between 2015 and 2018. The speed, scale and scope of this transition is unprecedented anywhere in the world. If Australia can manage this transition well, and the industry can achieve best-in-class operations, it will mean a win-win for the LNG operators, the Australian oil and gas service sector, the government and the country.
The January 2015 shipment of the first LNG cargo from the Queensland Gas Curtis Island LNG project (QC LNG) marked the beginning of the operations phase of the new generation of LNG facilities. If the LNG plants come online as their operating companies have forecast, Australian LNG production will rise 260% between 2014 and 2018 and the country will overtake Qatar as the world’s largest LNG producer.2
While the investment to date has been massive, this will be overshadowed by the estimated $450 billion of ongoing investment required to sustain the industry for the next 25 years.2 The operations phase offers a remarkable, long-term opportunity and it provides a platform upon which Australia can be recognised as the world’s centre of excellence in LNG production.
If Australia gets the transition right and implements the recommendations described herein, over the next 25 years, in addition to the more than $450 billion of ongoing investment, there is an opportunity to create an estimated additional $50 billion to $70 billion of additional shareholder value for companies. Other tangible opportunities include the chance for Australia to become a leader in the global oil and gas sector, providing innovative and technically advanced services and solutions. Collectively Australia could then secure a large portion of the next wave of oil and gas capital investment.
However, there are challenges ahead, and it is imperative that everything – operations, equipment, workforce, and regulatory and industrial relations regimes – is in place now.
This report asks the question: ‘Is Australia ready to become a world-leading LNG producer?’ The answer has profound implications not only for the global energy mix and the future of energy for the next several decades, but also for the Australian economy overall.
Accenture has attempted to answer that question by conducting primary and secondary research, including gathering input from C-level executives, managing directors and business unit leaders across operating and services companies, industry advisors and government.
This research measured readiness on the part of both the operators and oil and gas service providers along five dimensions:
• Capacity – Whether the services sector has the workforce quantity and quality to match operator demand
• Capability – Whether the services sector has implemented the operating models, technology, capital and innovations that operators require
• Competitiveness – The services sector’s ability to deliver the value, cost, and workforce efficiency and effectiveness operators demand
• Regulatory framework – Whether Australia’s regulatory requirements, environmental regulations and compliance burden can support a competitive oil and gas industry
• Industrial relations – Whether the relationship between employers, employees and their representatives facilitates equitable and productive workplace relations, and whether this supports a competitive oil and gas industry.
Accenture developed a Services Sector Readiness Index (SSRI) with a scale of 0 to 1.0 to measure the degree of confidence in the five key dimensions of readiness. While the operators scored the services sector lower on the SSRI than the members of the services sector scored themselves on all dimensions, in general there was agreement about the readiness of the sector. Overall, out of a maximum score of 1.0:
• Workforce capacity was rated at 0.58
• Workforce capability was rated at 0.68
• Competitiveness was rated at 0.37
• Regulatory framework was rated at 0.40
• Industrial relations framework was rated at 0.32.
The results show relatively strong confidence in capacity, given a relatively high level of workforce skill. Capability also rated highly, due to service providers optimising their operating models, investing in skills development and effectively using operational and information technologies. Efforts to improve capacity and capability would provide a workforce well suited to the demands of LNG operations and the development of a top quartile performance culture.
However, the results show there is considerable room for improvement in competitiveness, regulation and industrial relations (IR). In other words, industry players are looking for greater consistency around regulatory reform and more flexibility within the IR system.

Copyright © Accenture 2015 All rights reserved. 7
This report discusses several recommendations for the transition to operations to be successful. These include:
• Accelerating training and building workforce experience
• Incorporating lessons learned from the construction phase and leveraging leading international practices
• Developing a more collaborative and integrated industry and increasing infrastructure sharing
• Building on innovation – a hallmark of a mature and capable industry
• Continuing to automate and digitise across the industry.
Australia has a real opportunity to use the next few years to become a world-leading LNG producer, delivering long-term returns for all industry parties. If the sector works together to get the transition to the operations phase right, the potential returns would be astonishing.
Research MethodologyWith Australia on the verge of becoming the world’s largest LNG producer, in late 2014 APPEA invited Accenture to research and report on the readiness of the oil and gas services sector to support this major transformation.
This research was designed to address the following questions:
• Is the sector ready for the shift from investing in capital projects to operating world-leading production facilities?
• What are the opportunities and challenges for operators, the services sector and the government during this transition?
Accenture conducted primary and secondary research between January and April 2015.
Figure 1: Is the Australian services sector ready to support the world’s largest LNG industry as it transitions from construction into operations?
Service company
Capability
Competitiveness
Capacity
Regulatory framework
Industrial relations
Ability of the services sector to supply the industry with a skilled workforce…
…and to e�ectively manage and allocate resources…
…to deliver services e�ectively and e�ciently…
…within the context of the regulatory and industrial relations framework.
Source: Accenture Research
What we tested
How we tested it
Primary research Secondary research
Secondary research was conducted to validate and support our primary research findings
75 online survey respondents
37 38 13 19
32 executive interviews
23 9
Subject matter advisors: Input from Accenture leaders and industry advisors from around the world. Additional data provided by Asset Performance Networks.
Survey Audience: C-level executives, general managers, senior managers from Supply Chain, Procurement, Operations, Finance, Commercial, Engineering, Business Development
Operator

8 Copyright © Accenture 2015 All rights reserved.
Economic Impact
Size of Services Market8
Annual Operational Expenditure (Opex)
Contribution to GDP, absolute
+59%
+280%
-21%+29%
+22%
Contribution to GDP (%)
2.5
2.15 +16%
Cumulative Capital Expenditure (Capex)+ Opex Investment
$55
$35
Royalty & Taxes from Oil & Gas Revenue6
Opex Services7
billion
billion
$13.20 billion
$1.3billion
$4.9billion
billion
Based on Australian dollars
$13.9
$11.4 +41%
$363
$258
$29 billion $23
billion
$10.25
All sources not otherwise identified are based on Accenture research and estimates
Key Statistics
+258%8624LNG Production
(mtpa)5
LNG Trains
Liquefaction Plants
+163%821
+150%104
Number of trains measured from 2015 onwards
World 1st: Coal Seam Gas (CSG) to LNG World 1st: Floating LNG World Largest: CO2 Geo-sequestration
Key Statistics
Natural Gas Production (bcm)4
Pipeline (km)3
Wells2
+45%33,00048,000
+418%5,78930,000
+94%12866
1
1
Upstream Processing
+48%2,0303,000
O¡shore Conventional
Onshore Unconventional Domestic Gas Market
The impact of the transition from Construction to Production
1 Australia's rotor industry grows but faces hurdles" Aviation business Asia Pacific, 7 August 2013.
2 Accenture research and operating company reports
3 IBISWorld Industry Report I5021: Pipeline Transport in Australia, October 2014
4 :IEA World Energy Outlook 2014
7 IBIS and Accenture estimates
5 World LNG Report, 2014, International Gas Union (IGU)
8 IBIS and Accenture estimates6 APPEA
Copyright © Accenture 2015 All rights reserved. 9
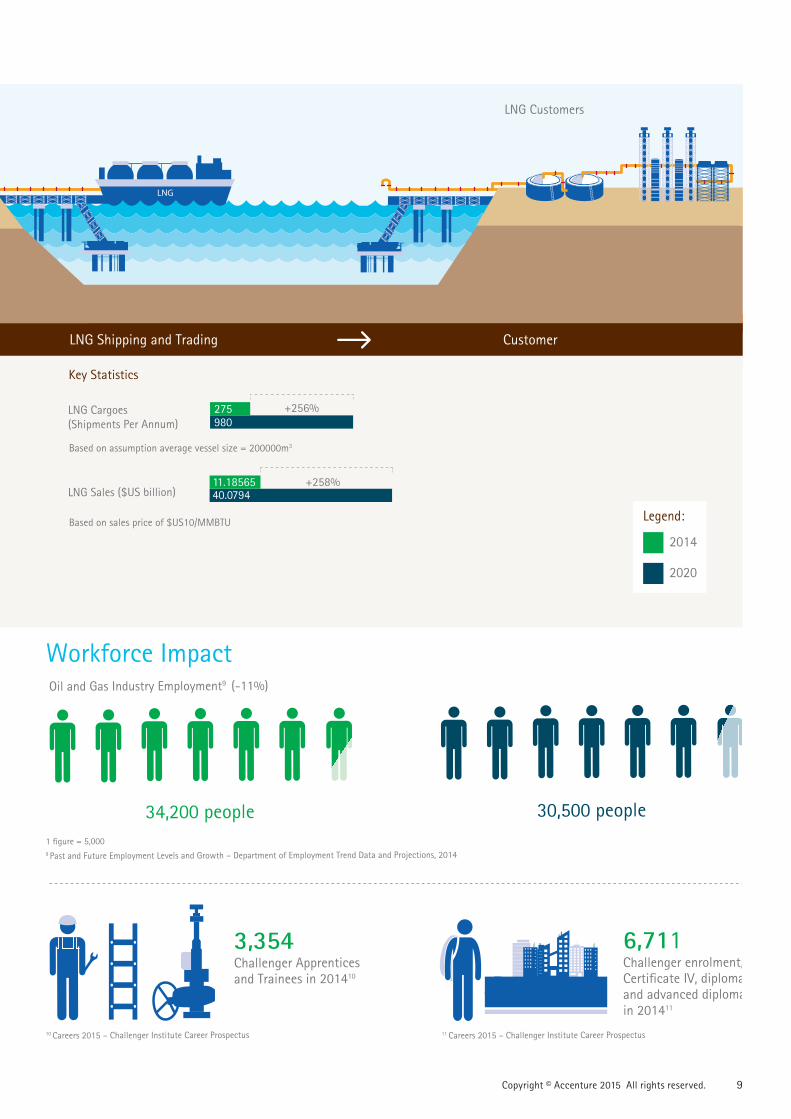
Workforce ImpactOil and Gas Industry Employment9 (-11%)
9 Past and Future Employment Levels and Growth – Department of Employment Trend Data and Projections, 20141 figure = 5,000
10 Careers 2015 – Challenger Institute Career Prospectus 11 Careers 2015 – Challenger Institute Career Prospectus
34,200 people 30,500 people
6,711 Challenger enrolment, Certificate IV, diploma and advanced diploma in 201411
3,354 Challenger Apprentices and Trainees in 201410
Key Statistics
LNG Sales ($US billion)
LNG Cargoes (Shipments Per Annum)
+258%11.1856540.0794
+256%980275
Based on assumption average vessel size = 200000m3
Based on sales price of $US10/MMBTU Legend:
2014
2020
LNG Shipping and Trading Customer
LNG Customers
The impact of the transition from Construction to Production
10 Copyright © Accenture 2015 All rights reserved.
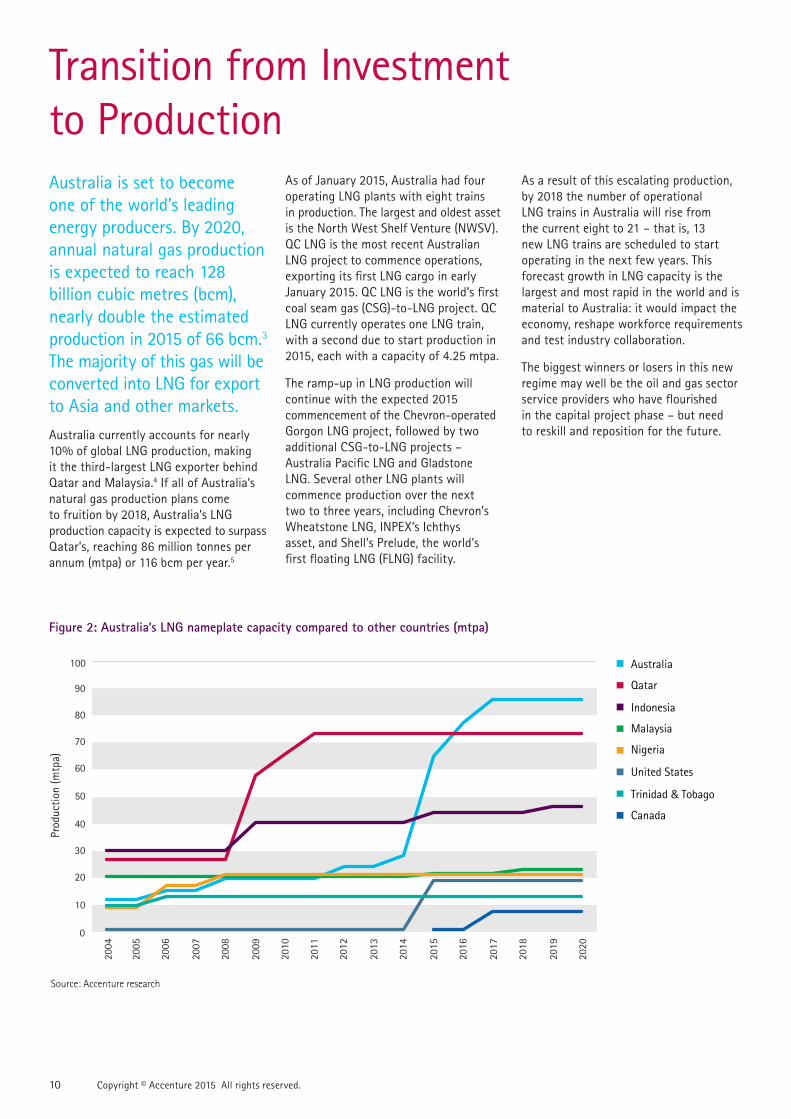
Transition from Investment to ProductionAustralia is set to become one of the world’s leading energy producers. By 2020, annual natural gas production is expected to reach 128 billion cubic metres (bcm), nearly double the estimated production in 2015 of 66 bcm.3 The majority of this gas will be converted into LNG for export to Asia and other markets.Australia currently accounts for nearly 10% of global LNG production, making it the third-largest LNG exporter behind Qatar and Malaysia.4 If all of Australia’s natural gas production plans come to fruition by 2018, Australia’s LNG production capacity is expected to surpass Qatar’s, reaching 86 million tonnes per annum (mtpa) or 116 bcm per year.5
As of January 2015, Australia had four operating LNG plants with eight trains in production. The largest and oldest asset is the North West Shelf Venture (NWSV). QC LNG is the most recent Australian LNG project to commence operations, exporting its first LNG cargo in early January 2015. QC LNG is the world’s first coal seam gas (CSG)-to-LNG project. QC LNG currently operates one LNG train, with a second due to start production in 2015, each with a capacity of 4.25 mtpa.
The ramp-up in LNG production will continue with the expected 2015 commencement of the Chevron-operated Gorgon LNG project, followed by two additional CSG-to-LNG projects – Australia Pacific LNG and Gladstone LNG. Several other LNG plants will commence production over the next two to three years, including Chevron’s Wheatstone LNG, INPEX’s Ichthys asset, and Shell’s Prelude, the world’s first floating LNG (FLNG) facility.
Figure 2: Australia’s LNG nameplate capacity compared to other countries (mtpa)
As a result of this escalating production, by 2018 the number of operational LNG trains in Australia will rise from the current eight to 21 – that is, 13 new LNG trains are scheduled to start operating in the next few years. This forecast growth in LNG capacity is the largest and most rapid in the world and is material to Australia: it would impact the economy, reshape workforce requirements and test industry collaboration.
The biggest winners or losers in this new regime may well be the oil and gas sector service providers who have flourished in the capital project phase – but need to reskill and reposition for the future.
0
10
20
30
40
50
60
70
80
90
100 Australia
Qatar
Indonesia
Malaysia
Nigeria
United States
Trinidad & Tobago
Canada
2004
Prod
uctio
n (m
tpa)
2005
2006
2007
2008
2009
2010
2014
2015
2016
2017
2018
2019
2020
2011
2012
2013
Source: Accenture research

Copyright © Accenture 2015 All rights reserved. 11
Operating Expenditure Rises as Capital Investment DeclinesAt its peak in 2013, LNG capital expenditure reached more than $50 billion.6 While this spending has now begun to decline, operating expenditure will steadily increase over the next few years.
According to Accenture estimates, annual LNG sector operating expenditure will increase from close to $1.3 billion in 2014 to $4.9 billion by early 2020. Furthermore, the total investment including capital and operating expenses would rise to over $750 billion by 2040, significantly overshadowing the investment in the capital project phase to date. This transition offers an opportunity for the Australian services sector to capitalise on a period of sustainable long-term growth, as maintenance and support contracts tend to last significantly longer than construction phase contracts, sometimes as long as decades.
Market Changes Will Force Service Providers to Respond or DisappearThe total size of the Australian oil and gas services market is expected to decline from its high of $29.3 billion in 2014 to $23.1 billion by 2020.7 Strong growth in demand for operational services would offset some of the decline in oil and gas construction services; however service companies face the reality of having to reshape their core offerings and workforces to take advantage of new opportunities.
Apart from a greater need for ongoing maintenance, there would be more demand for operational services associated with turnarounds and shutdowns. Brownfield investment, which is expected to continue due to debottlenecking and ongoing minor expansion projects, would also support the continued growth of operational services.
Figure 3: Australian LNG sector projected capital and operating expenditure ($ billion)
Figure 4: Australian oil field services sector demand in 2014 and 2020 ($ billion) and growth rate (CAGR)
11.3Engineering, Procurement and Construction (EPC)
Logisitics
O�shore drilling
O�shore exploration
Site preparation
5.2
1.4
0.6
2.2
1.1
0.8
0.4
2.3
1.8
*Other services markets analysed included HSE; waste management; electricity, gas and water; and specialty chemical services
Sector size (2014) Forecast sector size (2020)
14.3%
13.9%
12.1%
11.7%
5.13%
Source: Accenture estimates based on IBIS data
(%, CAGR)
Onshore exploration
Well-completion services
Pipeline transportation
O&M services
Onshore drilling
0.4
0.4
3.2
3.7
0.8
1.0
2.5
2.1
4.6
3.5
3.3%
3.3%
5.5%
4.1%
3.7%
Other*1.6
1.3 3.3%
0
100
200
300
400
500
600
Capital expenditure (cumulative) Operating expenditure (cumulative)
2008 2016 2024 2032 2040
Source: Accenture estimates based on industry data
700
800
($ b
illio
n)
2015

12 Copyright © Accenture 2015 All rights reserved.
Annual revenues from construction services in Australia’s oil and gas sector are expected to decline by 50% between 2014 and 2020 (from around $18 billion to $9.2 billion), while operations service demand would add $2.5 billion in total, reaching $13.9 billion by 2020 – a growth rate of around 4 % per year.8 Over the next five years, the focus of drilling services would shift from western to eastern Australia and from offshore to onshore.
In addition to the growth in operational services required to support Australia’s new LNG assets, a significant amount of natural gas infrastructure – including wells and pipelines – will be in need of ongoing maintenance. By 2020 an estimated 15,000 km of new gas pipeline will have been built, in addition to the 33,000 km already in operation today.9 From a logistics perspective, by 2018 there should be more than 3,000 helicopters operating in Australia, compared to 2,030 in 2013.10
The growth of the LNG industry is also expected to create significant demand for certain supplies associated with plant operations, such as production chemicals (e.g. corrosion inhibitors and water treatment chemicals), catalysts and gases. An example of a production chemical that would be subject to LNG-driven demand growth is ethylene, which is used in the ‘optimised cascade’ LNG liquefaction process, to be used by eight of the new LNG trains. Transporting and storing ethylene is also a challenging and expensive exercise, requiring specialist services, equipment and skills.
Increasing Demand for Critical Services As the operations phase ramps up over the next five years, demand for operations and maintenance services is expected to grow substantially. Survey respondents specifically said they were gearing up for growth in reliability testing and inspection, electrical and instrumentation, and drilling and well maintenance.
Australia also faces the challenge of multiple LNG plants coming online simultaneously, meaning maintenance services, equipment and products would be required in approximately the same timeframes. This confluence of peak demand for services would be compounded by:
• Equipment manufacturer warranty inspection and maintenance requirements on brand new equipment like gas turbines
• Federal and state regulations stipulating that in the first four years of operation, new LNG plants must be open for inspection of high-pressure vessels
• Future turnarounds and shutdowns, as most of the new LNG plants would reach 50,000 hours of operational run time at more or less the same time, and would need to be shut down for complex maintenance. This is difficult to plan for and would require the industry to have the necessary skills, spare parts and replacement equipment on hand.
The 37 operators surveyed in this research identified well completion; maintenance and repair; and drilling services as most critical to supporting current and future oil and gas operations.
Figure 5: Percentage of Operators who cited a particular service as being most critical to supporting their future operations
81%
73%
73%
54%
51%
49%
46%
41%
38%
35%
32%
30%
27%
27%
27%
24%
22%
5%
Well and completion services
Maintenance and repair services
Drilling services
Geophysical services
Engineering services
Air, road and rail transportation
O�shore and marine transportation
Waste management services
Project management services
Construction services
Procurement services
Specialty chemical services
Plant management services
HSE services
Pipeline transportation
Site preparation services
Electricity, gas and water supply
Other
Source: Accenture survey data

Copyright © Accenture 2015 All rights reserved. 13
Figure 6: Percentage of Operators who expected their demand for a particular service to increase or decrease during operations phase
Over the next five years, operators expect increased demand for key operational services including maintenance and repair; electricity, gas and water supply; speciality chemical services; pipeline transportation; plant management; air, road and rail transportation; HSE; and waste management. However, they expected demand for drilling, construction, site preparation and project management services to decline. Service providers held similar views; their demand forecasts aligned with the operators’ expectations.
The long-run operations phase for Australian LNG plants offers the services sector an opportunity to become truly world leading. This more predictable phase gives service providers the opportunity to develop specialised skills and services, invest in people and training, build capability, adopt new technologies and drive innovation. In the operations phase, operators and service providers will both require technically competent, specialised workers, and the Australian gas industry as a whole will rely on innovation, technology and increased collaboration to achieve world-leading operations and global competitiveness.
-52.3%
-44%
-30%
33%
35%
41%
47%
60%
61%
70%
70%
73%
75%
85%
Engineering, Procurement and Construction (EPC)
Site preparation services
Drilling
Well and completion services
Geophysical services
O�shore and marine transportation
Waste management services
HSE services
Air, road and rail transportation
Pipeline transportation
Plant management services
Specialty chemical services
Electricity, gas and water supply
Maintenance and repair services
Note: EPC includes procurement services, construction services, engineering services and project management servicesSource: Accenture survey data
0

14 Copyright © Accenture 2015 All rights reserved.

Copyright © Accenture 2015 All rights reserved. 15

16 Copyright © Accenture 2015 All rights reserved.
There is now a real opportunity for Australia to develop a sustainable, globally competitive services industry for LNG operations.If Australia can manage the transition well and set up the industry to deliver world-class operations, it will mean a win for LNG operators, the Australian services sector, the government and the economy:
• Operators win. A competitive, healthy services market would translate into lower operating costs, helping to make Australian LNG globally competitive.
• Service providers win. The transition from construction to operations marks the beginning of a new growth cycle focused on operations and maintenance, creating the opportunity for innovative, services-oriented companies to achieve increased revenue and market share by offering a competitive set of services delivered by capable and qualified personnel.
• Governments win. The increase in oil and gas production has the knock-on effect of increased tax and royalty revenue, and lower unemployment. Secondary benefits include helping to make Australia a world leader in the global LNG market, which would drive additional investment from operating companies, and increased recognition of Australia’s expertise in innovation and the fields of science, engineering and technology.
To specifically address the question of Australia’s readiness to realise these potential wins, Accenture measured readiness along five dimensions:
1. Capacity – Whether the services sector has the workforce quantity and quality to match operator demand
2. Capability – Whether the services sector has implemented the operating models, technology, capital and innovations that operators require
Is the Australian LNG Services Sector Ready to Become a World Leader?
3. Competitiveness – The services sector’s ability to deliver the value, cost, and workforce efficiency and effectiveness operators demand
4. Regulatory framework – Whether Australia’s regulatory requirements, environmental regulations and compliance burden can support a competitive oil and gas industry
5. Industrial relations – Whether the framework of the relationship between employers, employees and their representatives facilitates equitable and productive workplace relations, and whether this supports the development of a competitive oil and gas industry.
To quantitatively measure the readiness of the services sector, surveys were sent to both operators (demand) and service providers (supply) asking a series of questions about the five dimensions
Figure 7: Service Sector Readiness Index (SSRI)
0.00
0.25
0.50
0.75
1.00Capacity
Capability
CompetitivenessRegulatory framework
Industrial relationsframework
OperatorsService providers
Source: Index score derived from Accenture survey data
Readiness dimension SSRI - Operators SSRI - Service providers
Capability
0.46 0.70
Capability 0.57 0.80
Competitiveness 0.28 0.47
Regulatory framework 0.31 0.50
Industrial relations framework 0.27 0.37
Capacity
of readiness described above. Results were normalised to create the SSRI. On the SSRI, a score of zero means the industry is completely unready in that area, while a score a 1.0 means the industry is completely ready.
Services Sector Readiness ResultsThe survey results show operators and service providers have a relatively aligned opinion of the sector’s strengths and weaknesses, and its ability to meet demand for LNG operational services. Operators and service providers both rated the capability dimension highest (that is, most ready), followed by capacity, regulatory framework and competitiveness. Both sides ranked industrial relations as the dimension that was least ready for the transition.

Copyright © Accenture 2015 All rights reserved. 17
However, a consistent gap was noted when comparing the results from operators to those from service providers. Interestingly, operators scored the services sector as less ready than the services sector scored itself. A possible reason for this gap may be that the actions service providers have undertaken to prepare for the transition are not well understood by operators, primarily due to the limited collaboration and dialogue on industry challenges between operators and service providers today.
Capacity: Positive OutlookThe first dimension of readiness evaluated the ability of the services sector to supply the scale and quality of workforce the industry requires. Operators scored the services sector 0.46 on the SSRI, while the service providers scored themselves as more ready, at 0.70. Workforce capacity was rated at an industry average of 0.58 on the index, which is a positive outlook.
To understand the differences between operator and service provider results, Accenture analysed responses to key capacity-related survey questions, as shown in Figure 9. Service providers were less concerned than operators about the availability of skilled labour, technical skills, and leadership and management skills. In interviews, many service provider executives noted that they have seen an increase in the availability of these key skills in recent months, giving them more confidence they would not be constrained in this key dimension.
The operators who expressed concerns about the technical skills of service providers were particularly concerned about skills relating to production engineering; diagnostics; maintenance services (especially electrical instrumentation maintenance); marine vessel and helicopter operations; infrastructure (including gas pipelines); testing LNG plant turbines and valves (operations and inspections); and compression and rotating equipment. In other words, operators are concerned about general maintenance, inspection, engineering, hazard and risk, and reliability services. However, some operators commented that these technical skills could be filled by the international contractor base if needed.
Figure 8: Service Sector Readiness Index (SSRI) score – Capacity
Figure 9: Percentage of survey respondents who were either concerned or very concerned about the capacity of the workforce
Source: Accenture survey data
1.00
0.750.70
0.58
0.46
Service providers
Industry average
Operators0.50
0.25
0.00
Capability
Competitiveness
Capacity
Regulatory framework
Industrial relations
60%
52%
49%
34%
25%
31%
The availability of skilled labour in the market to meet demand
The availability of specialist technical skills in the market to meet demand
The availability of leadership and management skills
Operators Service providers
Source: Accenture survey data
Some service providers responded by saying that for certain operational areas like maintenance and engineering, there is a crossover between the mining and the oil and gas sectors, and that skilled workers in regions like Western Australia and Queensland can work in both industries, effectively increasing workforce capacity and availability.
“Six months ago we didn’t have the capacity but it is better now. There will be some reskilling, but we now have more capacity than we have ever had given the amount of people involved in the oil and gas phase – but the skills are different.” – Service provider
Service providers were generally less concerned than operators about their ability to effectively allocate resources to meet LNG operational demands – although many recognise there are skills gaps in specific operational areas. Some service providers are taking steps to increase their operational readiness by enhancing the technical skills of their workforce, investing in centres of excellence and/or forming joint ventures and alliances to better serve the market.

18 Copyright © Accenture 2015 All rights reserved.
“It’s more a question of ‘is the sector ready’ – not just ‘is the contractor sector ready’? The root cause goes back to the contracting strategies of the operators. They still pick the contractors on price, not skills or capacity. It’s just talk about developing capabilities, but they don’t really do anything about it.” – Service provider
Workforce QuantityService providers expect the quantity of available labour to be less of an issue than during the construction phase. Recent Australian resources sector data supports this view, with the shortages in capacity that marked the last five years now moving into surplus. Department of Employment trend data from 2014 shows an estimated decline in demand for mining workers, from 207,800 in 2014 to 170,800 workers by 2019, with demand for oil and gas workers also declining, from 34,200 in 2014 to 30,500 by 2019.11
Furthermore, recent data from the Australian Bureau of Statistics (ABS) shows that key trades required in the operations phase – including metal fitters and machinists, electricians, production managers, structural steel and welding trades workers; and contract, program and project administrators – are now in plentiful supply in Australia.
This supply surplus is reflected in the increase in applicants per vacancy for resources sector–related occupations in Western Australia (WA) and Queensland (primarily mining, and oil and gas), from just over 20 per vacancy in 2012–13, to over 35 per vacancy in 2013–14.12 The percentage of vacancies filled and the average number of applicants for resource-related occupations in these resource-intensive states have both risen significantly since 2007.13
Even if all the players in the industry don’t yet realise it, the oil and gas sector is expected to have an ample supply of skills and resources to support the operations phase of Australia’s new LNG projects.
Despite this, some re-training and upskilling will likely be required. While some skills are not directly transferable, most electrical, instrumentation and overall operations workers’ skills can be
transferred into oil and gas operations. Therefore, unlike previous years, there should not be capacity constraints within the workforce for service providers or the LNG operators themselves.
Workforce QualityGiven the increase in supply of workforce resources in Australia, companies now have the opportunity to select from a talent pool to support their new world-class facilities.
“The maintenance phase is all about long-term investment. You can’t expect to get the skill levels up by the boom and bust mentality – lowest bids, changing contractors. Production operations are different – you might be there for 25–50 years. If you want to build world-class performance, you need an integrated team that doesn’t approach it with a construction mindset.” – Service provider
Australia offers education specifically focused on training skilled workers in the oil and gas, mineral and chemical processing industries. The Australian oil and gas sector has built a number of leading technical institutions and centres including:
• Australian Centre for Energy Process Training (ACEPT), WA
• North Australian Centre for Oil and Gas, Northern Territory
• Onshore Petroleum Centre of Excellence, South Australia.
The Challenger Institute of Technology (the institute governing ACEPT training) conducts training and offers apprenticeships in oil and gas skills. It offers over 350 nationally accredited courses.14 In 2013, there were 6,771 course enrolments in certificate IV, diploma and advanced diploma levels, and 3,354 apprentices and trainees enrolled. Both these figures represent increases over previous years.
Many Australian service providers are already focused on improving the quality of their workforce to better service the transition to LNG operations. Companies such as Thiess and Bechtel are providing various employee training programs –
including a Project Management Academy and specific skills-building programs delivered by industry organisations such as the Chamber of Commerce and Industry of Western Australia (CCIWA).
In August 2014, Thiess signed a contract with Careers Australia to deliver training to around 120 apprentices in the diesel-fitting, electrical, auto-electrical and fabrication trades.15 Also in 2014, Bechtel announced it had employed 400 apprentices during the construction phase of the three LNG plants in Gladstone. Bechtel has been working closely with the federal government’s National Apprenticeships Program and local training organisations to help develop Australia’s construction workforce.16
“We are trying to build a relationship with the University of Western Australia which gives us access to students and postgrads to do industry-related work … This provides access to smart, capable people, and clients get access to a low-cost resource.” – Service provider
Workforce ExperienceOne key reason for the difference in the operator and services sector perspectives could be the experience of the oil and gas workforce in Australia, especially in comparison to other, more mature regions. In general, the Australian workforce has less experience than other oil and gas producing regions globally. Australia has a lower proportion of professional workers with 10 or more years of industry experience (48.7%) compared with countries such as the US (51.5%) and Norway (56.4%).17
Survey interviews also confirmed that operators in particular are concerned that the Australian workforce has limited experience in hydrocarbon operations management and a larger number of younger and relatively inexperienced workers. Thus, the need to accelerate experience through training and innovative programs is critical.

Copyright © Accenture 2015 All rights reserved. 19

20 Copyright © Accenture 2015 All rights reserved.
Capability: Confident for the FutureThe second dimension of readiness evaluated the capability of the services sector to effectively support the LNG sector’s operations phase. This dimension evaluated operating models, access to and implementation of technology, research and development (R&D), capital investment, and the ability to drive innovation.
In the capability dimension, the operators scored the services sector at 0.57 on the SSRI, while the services sector scored itself higher, at 0.80. The overall average was 0.68 – a high score, supporting a confident outlook.
Based on the survey responses, operators and services companies are both confident the services sector has adequate access to industry technology, capital and R&D. Figure 11 shows that neither operators nor services providers are overly concerned about access to technology and capital, or the capital required to support R&D.
However, as Figure 12 shows, a minority of operators agreed or strongly agreed that local service providers compared well with their international peers in terms of cost and quality. This finding should be of concern to the service providers, and requires immediate action to address.
By contrast, Figure 13 shows that service providers are very confident in their operating models, their use of enterprise technology to provide technical skills in remote areas, and their investment in operational and information technology. They were more concerned about strategic sourcing strategies and the readiness of their own integrated supply chains.
Figure 10: Service Sector Readiness Index – Capability
1.00
0.75
0.80
0.68
0.57
Service providers
Industry average
Operators0.50
0.25
0.00
Source: Accenture survey data
Capability
Competitiveness
Capacity
Regulatory framework
Industrial relations
Figure 11: Percentage of survey respondents who were either concerned or very concerned about their ability to access technology and capital to build capability
Figure 12: Percentage of survey respondents from operator sample who either agreed or strongly agreed with statements related to service sector capability
22%
22%
19%
14%
Local service providers tend to be competitive with global or international service providers on a cost basis
Local service providers tend to be competitive with global or international service providers in terms of the quality
When selecting a service provider from the market it is hard to di�erentiate on quality
The market o�ers a wide range of service providers to choose from
Source: Accenture survey data
24%
25%
31%
36%
Access to industry technology
Access to capital to support research and development
Operators Service providers
Source: Accenture survey data

Copyright © Accenture 2015 All rights reserved. 21
A major theme that emerged from the executive interviews across both operators and service providers is that the industry must focus collectively to achieve best-in-class LNG operations. Many services industry representatives said they require the confidence and support of operators to invest in new technology and innovations. For example, one respondent said that to build an offshore support vessel requires a long-term commitment of ideally 10 years, yet many operators only enter into short-term contracts for such projects.
Many of the operators and service providers interviewed said innovation is crucial if the LNG sector wants to reduce costs and improve efficiency. They also believe Australia should support innovation by setting up centres of excellence for natural gas production, and LNG and FLNG operations.
“Innovation is important. It takes a long time to access technology for onshore activities in Australia (more than offshore) and we are 10 years behind the US in the equipment and designs available. And even when the technology is available here we still fail to adapt it to make it relevant. With things like wells and pipeline monitoring we are starting to get there, but we need to improve innovation.” – Service provider
Executives interviewed believe there is room for more collaboration on key services such as turnarounds and logistics, with emerging opportunities to share operational infrastructure such as pipelines, logistics services and supply vessels, and warehouses.
Many also commented that because the industry had not done enough sharing and collaboration during the construction phase, the opportunity to capture these synergies and cost savings is even more important as the industry enters the 40-plus year operations phase.
Adapting Operating ModelsIn addition to opening new facilities, service providers are expanding their operations to better serve the industry, often by entering mergers and acquisitions, joint ventures or alliances. This increases their geographic reach and expands their services portfolios.
Some service providers are already expanding their offerings in response to the growth and transition of the LNG sector. One notable example is Clough Limited’s August 2014 acquisition of CH-IV LNG, an engineering and consulting service provider. This acquisition allows Clough to build a globally competitive business and expand its services to oil and gas clients in Australia and beyond.18 In January 2013, also Clough purchased e20, an electrical and instrumentation services company, as part of a strategy to strengthen its commissioning and asset support business, and to become the pre-eminent commissioning contractor in Australia.19
The service providers that adapt their business models and offer competitive services are ideally positioned to capture increased market share and find success.
Embracing Technology and InnovationAccording to recent studies, service providers tend to be the originator of much of the deployed industry innovation in the oil and gas sector. One study recently reported that 80% of the oil and gas technology patents and over 63% of the deployed innovations originated with service providers.20
This commitment to innovation is also evident in our survey research, with 61% of service providers commenting that they have recently invested in new competitive operational and information technologies.
Australia has many good examples of collaborative research centres and incubators for innovation. One example is the Western Australian Energy Research Alliance (WAERA). Established in September 2003 by the Commonwealth Scientific and Industrial Research Organisation (CSIRO), Curtin University and the University of WA, WAERA fosters collaboration and sharing of resources for petroleum and geosequestration related research. Together with industry partners such as Woodside Energy, Chevron Australia and Shell Australia, WAERA conducts R&D to develop innovative solutions for the sector.21
In September 2014, the federal government announced the Industry Growth Centres Initiative, the centrepiece of its new industry policy direction and part of the Industry Innovation and Competitiveness Agenda. It is designed to help Australia transition into smart, high-value and export-focused industries.
Figure 13: Percentage of service companies who either agreed or strongly agreed with the following statements related to capability
Our operating model is optimised for e�ective and e�cient operations
My company makes e�ective use of enterprise technologies to provide remote access to technical skills
My company has invested significantly in new competitive operational and information technologies
My company makes use of strategic sourcing and procurement capabilities to reduce costs of purchases
My company's integrated supply chain capability is industry leading
Source: Accenture survey data
71%
67%
67%
61%
56%
27%
My company makes e�ective use of enterprise technologies to increase workforce productivity

22 Copyright © Accenture 2015 All rights reserved.
Additionally, the Oil, Gas and Energy Resources Industry Growth Centre (OGERIGC) has funding set aside to support industry development in the areas of reducing regulation, increasing innovation and R&D, improving supply chain and export potential, and improving skills and training.22
“There has been good collaboration in the past, especially in the areas of safety and training. However, we need to take it to the next level – to look at commercial operations in a way that opens up opportunities for everyone.” – Survey participant
Initiatives like WAERA and OGERIGC will drive technology and innovation in the Australian LNG industry, working to advance Australia as a global centre for LNG operational excellence.
Executives interviewed in this research highlighted several examples of service providers engaged in significant innovation to improve their services to the industry. Highlighted below are two examples, KT Maritime and Oceaneering.
Case study: KT Maritime23
Shell Australia awarded KT Maritime a major contract for the design, construction and operation of three infield support vessels (ISVs). This will create approximately 80 local jobs and support Shell’s Prelude FLNG project, located 475 km northeast of Broome, WA. Perth-based KT Maritime Services Australia, a joint-venture partnership between KOTUG International BV and Teekay Shipping Australia, will supply three 42m, 100 tonne bollard-pull vessels to help offload products at the FLNG site. The ISVs will operate out of the Port of Broome, on rotation.
Robert Allan Ltd specifically designed the vessels in close collaboration with KT Maritime, to meet the unique requirements of the Prelude FLNG facility including tanker berthing and offshore operations support, and emergency response needs. They will be the world’s first purpose-built FLNG ISVs.
Case study: Oceaneering24
US-based Oceaneering is a global provider of engineered oilfield services and products, primarily targeted towards the offshore oil and gas industry in Africa, the Asia-Pacific region, Norway, the UK and the US. The company specialises in delivering built-to-order subsea hardware, remotely operated vehicles, deep-water intervention services, manned diving services, and non-destructive testing and inspection services. It is a leading example of how a service provider has used innovation and technology to support the industry’s transition into the operations phase, and to help develop world-leading energy producers.
In 2011, recognising a sizeable increase in Asia-Pacific operations and identifying a need for local specialist expertise in the region, Oceaneering built its Asia-Pacific technology hub in Perth. The company decided to relocate its highly skilled team following requests from its Perth-based clients for the same products, services and support they had come to expect in other regions.
Although developing unique solutions and products in Australia is more expensive than in other regions, Oceaneering recognises the value of having a local team available, in the correct time zone. This competitive advantage has allowed Oceaneering to manufacture, assemble and quality-test its engineering tools and solutions in Australia, and export them to China, Indonesia, India, Korea, Malaysia, Singapore and Vietnam.
Oceaneering recently created a solution for a major oil and gas operator, enabling it to make significant cost savings. It also developed a unique remote operated vehicle (ROV) skid-based solution to remotely access and open multiple downhole formation isolation valves without the presence of a work-over rig. What would normally have taken weeks to complete at the high day-rate of a rig can now be performed in just a few days using a more cost-effective multi-service vessel with a work-class ROV. Operators also benefit from Oceaneering’s locally manufactured off-the-shelf subsea products (saving on shipping and import costs), and the local maintenance team’s specific knowledge of local offshore conditions.
Recognising Leading Practice: Innovation

Copyright © Accenture 2015 All rights reserved. 23
Competitiveness: Room for ImprovementThe third dimension of readiness is the competitiveness of the services sector in terms of value, cost, efficiency and workforce effectiveness. Competiveness was measured based on salaries, wages and productivity, compared to international standards.
In the survey, both operator and service providers scored competiveness low: 0.28 for operators and 0.47 for service providers. High levels of concern around competitiveness were reported in the survey resulting in an industry average index of 0.37, indicating that competitiveness is definitely an area for improvement.
As shown in Figure 15, operators are concerned about the services sector’s ability to deliver competitively in some important areas:
• 87% of operators are concerned or very concerned about the services sector’s ability to deliver to remote locations
• 84% of operators are concerned or very concerned about workforce productivity in the services sector.
The challenges around remote operations came up in the interviews, and operators suggested service providers should seriously consider moving closer to the LNG operations.
In the future, given the increasing digitisation of the industry, technology is expected to help overcome some of these challenges of remoteness. However, service company proximity to operations will still be vital. One example of a service company that is doing this is GE, which in March 2015 is opening a Broome facility chosen for its “…proximity to the offshore operations and to complement … existing offshore support infrastructure”.25
Operators and service providers both expressed concern about the increasing cost of labour and purchases.
Figure 14: Service Sector Readiness Index – Competitiveness
1.00
0.75
0.50
0.25
0.00
0.47Service providers
0.37Industry average
0.28Operators
Source: Accenture survey data
Capability
Competitiveness
Capacity
Regulatory framework
Industrial relations
Figure 15: Percentage of survey respondents who were either concerned or very concerned about measures of competitiveness
High Labour Cost and Low Productivity Many of the competitiveness challenges stem from the fact that Australia is generally a high-cost country in which to do business, in any sector. According to the Hays Oil and Gas Global Salary Guide Review of 2013, outlook for 2014, Australia’s oil and gas professionals earn some of the highest salaries in the world – an average of $US163,700 per annum, just behind Norway in first place, at $US179,200. 26
By 2019, analysts expect the wage price index across all industries in Australia to grow by 3.4%.27 WA in particular is home to some of the highest paying
jobs (primarily for technical roles in the resources industry) and continues to show the greatest salary growth.
The World Economic Forum (WEF) Global Competitiveness Report 2014–2015 assesses the competitiveness of 144 countries. The report defines competitiveness as “the set of institutions, policies and factors that determine the level of productivity of a country”.28 The higher the level of productivity, the greater prosperity an economy can achieve.
The WEF Global Competitiveness Index reveals a key area of weakness as Australia’s labour market efficiency. In this overall measure, Australia ranks 56th out of the 144 countries surveyed.29
Costs associated with delivering services at remote locations
87%
48%
Workforce productivity 84%
53%
Increasing cost of labour 62%
59%
Increasing cost of purchases 57%
53%
Operators Service providers
Source: Accenture survey data

24 Copyright © Accenture 2015 All rights reserved.

Copyright © Accenture 2015 All rights reserved. 25

26 Copyright © Accenture 2015 All rights reserved.
Australia also performs quite poorly in terms of pay and productivity (ranked 125th), behind most advanced economies as well as the global average.
“The biggest issue is the cost of labour and the restriction of getting overseas workforce. The Australian workforce … has got an entitlement attitude.” – Service provider
“Productivity is going down while the cost of people is going up; relative talent is not as good as it was in the past.” – Service provider
“There isn’t much competition here in Australia – it’s totally overplayed. Competition is excellence: ‘Can I do better?’ and ‘Can I motivate people and create better solutions?’ If there has to be competition let it be on the global stage – Australia with the rest of the world.” – Service provider
Tendering and Contracting StrategiesMany of the services sector executives said they spend significant time and money tendering and negotiating Australian contracting terms and conditions in Australia. This significantly affects the sector and adds to cost pressures, particularly for smaller contractors. In WA, organisations like CCIWA – which is funded by the government and the energy industry – help service providers manage tendering for various work packages issued by the operators, reducing the time and expense of this process.
Service providers are also concerned about tender process lead times, which are often limited. They would like to have more information about a tender, earlier, and to be more integrated into the upfront planning and scheduling for maintenance and inspection, in particular for key maintenance activities like turnarounds.
Another complication for service providers is operators increasingly using vendor qualification systems. These systems improve tendering timing and efficiency by standardising core competencies, but it can take service providers months to get signed up and qualified in these systems.
Service providers pointed out that although this process worked well in the construction phase, processes for the operational phase are still somewhat undefined.
“One of the main challenges is spending a lot of time negotiating terms and conditions with contractors – maybe it’s our T&Cs. We negotiate at the International Master Agreement level and then they have local lawyers renegotiate it – it’s too time consuming.” – Operator
“There are a lot of inefficiencies and everyone is under a lot of pressure to squeeze prices to reduce margins. There is a far bigger prize in overcoming inefficiencies.” – Service provider
Generally speaking, service providers do want more standardisation around tendering and contracting. More mature oil and gas sectors in the US Gulf of Mexico and the UK North Sea have introduced standardisation around key operational areas to great effect (see ‘Lessons from the UK Oil and Gas Sector’).
Other companies reported that Australian LNG operators are using innovative contracting strategies. One notable evolution is some service providers guaranteeing the uptime of key equipment for contracts focused on long-term maintenance. Interviews found that operators signing these contracts now allow service providers to use measuring technologies to monitor key LNG equipment and guarantee its performance. This technology-enabled monitoring can help balance maintenance scheduling for operators as well as improve uptime, and has the added reward of better integrating the service provider into operational strategy and planning processes.
Given the global nature of the industry, nations importing LNG will have increasing options from which to source LNG supplies. Therefore, competitiveness must be a key focus in Australia, with a goal of achieving leading LNG operations. Increasing competitiveness would require companies to ‘pull all available levers’, including optimising operating models, leveraging technology and identifying innovative ways of working.
LNG operations of the future must also perform well under key operational stresses, like turnarounds, which have been identified in this research as the single most important opportunity for increased productivity, lower costs and higher output, and improved safety performance.
Regulatory Framework: Complex and InconsistentThe fourth dimension of readiness evaluated was Australia’s regulatory framework and its ability to support the operations phase of the LNG industry. This dimension also evaluated environmental regulations and the burden of compliance.
Operators and service providers were well aligned on the regulatory framework measure, both scoring the services sector relatively low or unready (0.31 for the operators and 0.50 for service providers), for an average score of 0.40.
As shown in Figure 17, Australia needs to reduce complexity and inconsistency to support a world-leading LNG industry. Operators and service providers both reported a strong desire to improve the LNG regulatory framework. The majority were concerned about ambiguous, changing and/or inconsistent regulatory requirements, and the time and money spent complying or dealing with government regulation licensing processes and bureaucracy.
The WEF places Australia 124th out of 144 countries in terms of the burden of government regulations.30 A WEF executive opinion survey of over 14,000 business leaders in 148 countries found that doing business in Australia was difficult due to:31
• Restrictive labour regulations
• Tax rates and regulations
• Inefficient government bureaucracy
• Inadequate infrastructure supply.

Copyright © Accenture 2015 All rights reserved. 27
Figure 17: Percentage of survey respondents who were either concerned or very concerned about elements related to the regulatory framework
Figure 16: Service Sector Readiness Index – Regulatory Framework
1.00
0.75
0.50
0.25
0.50
0.00
Service providers
0.40Industry average
0.31Operators
Source: Accenture survey data
Capability
Competitiveness
Capacity
Regulatory framework
Industrial relations
Cumbersome or ambiguous regulatory requirements
Changing and/or inconsistent application of regulatory requirements
Environmental regulations
Time spent on cost of complying or dealing with government regulation licensing and bureaucracy
79%
55%
78%
53%
51%
33%
70%
58%
Operators Service providersSource: Accenture survey data
These results echo the views of the operators and service providers we surveyed, regarding the difficulties of working within Australia’s regulatory framework. These factors are out of the direct control of the operators and service providers; however, the LNG sector would potentially benefit if the local regulatory environment were to incorporate some guidance from around the world:
• In Canada, approval processes are conducted on average three months quicker than in Australia.32
• In Norway, the government adjusts its fiscal regime to meet industry needs – for example, it implemented profit-based taxes in the late 1980s. Tax concessions for capital investments reduce the tax base by 30% of the investment value, and allowances for exploration and R&D reduce those costs by 78%.33
• The UK Government set up an independent offshore regulator to promote collaboration between government and the industry, extending operational field life and generating significant additional production.34
Many companies are concerned about the complexity and delays experienced when bringing new equipment to Australia. Different regulations between states cause problems for operators and service providers alike. Inconsistent rules and regulations – particularly around hazardous area requirements and Australian standards for electrical wiring – add complexity and cost, and contribute significantly to delays in activities and equipment deployment.
Service providers commented that they had to spend millions of dollars to make equipment such as drilling rigs compliant for operations in multiple states, having learned the lessons on state-by-state regulatory differences the hard way. Operators and service providers are both keen to standardise regulations for their sub-contractors. One company recounted having to spend significant time working with its transportation providers, bringing them all into one room to discuss how to agree a standard approach, as they were all interpreting regulations in different ways.
“It’s different depending on what state you are in. A country-wide approach would be better for Australia. The whole government approach to the oil and gas industry is very fragmented and inconsistent, both from a time and state basis. If you have certainty on what you are facing, the oil and gas industry works better. Consistency just helps.” – Service provider
Many of the companies interviewed highlighted approaches taken by other oil and gas regions around the world to streamline and standardise processes, and reduce the impact of regulations on the competitiveness of the sector.

28 Copyright © Accenture 2015 All rights reserved.
Lessons from the UK Oil and Gas SectorAustralia can learn from other oil and gas sectors that have been through similar growth transitions. One such sector is the UK offshore oil and gas industry, which has created forums that promote collaboration and growth by improving regulatory efficiencies and costs. This allowed the industry to respond effectively to oil price declines and competiveness concerns. In the very early days of operations in the UK North Sea, operators actively supported small domestic service providers that subsequently became global service companies like AMEC, McDermott and Wood Group.
One of the earliest collaboration and cost reduction initiatives in the UK North Sea was the so-called CRINE initiative (Cost Reduction in the New Era), established in 1992 specifically to reduce the capital costs of developing oil and gas fields (by a target of 30%), which had become particularly pressing under the low oil prices of that era. The 1994 CRINE Report recommended shared working practices, a sole industry body for prequalification and a reduction in paperwork during the procurement process. Acting on these objectives, the industry was able to reduce costs by 40%. CRINE evolved into the CRINE network, which had a wider focus on increasing the global competitiveness of the UK North Sea, and introduced model contracts documents for use in the UK oil industry.36
Eventually, the UK oil industry set up organisations like LOGIC (Leading Oil and Gas Industry Competitiveness, established in 1999) to further encourage collaboration and improve the competitiveness of the UK North Sea industry. The formation of LOGIC was one of the key deliverables of the UK’s Oil and Gas Industry Task Force (OGTF, now PILOT), which looked at cost-reduction initiatives and how to improve the productivity of the North Sea.
Case study: Easternwell35
Toowoomba-based drilling and wells services company Easternwell is innovating to address regulatory challenges. A subsidiary of Sydney-headquartered Transfield Services since 2011, Easternwell has recently found an innovative way to tackle the issues and frustration of importing drill rigs. The result is the most technologically advanced rig ever delivered to Australia.
Strict import standards often mean that off-the-shelf, American-built rigs are not compliant for use in Australia. Companies spend large amounts of time and money attempting to gain compliance and sign off by local governments, only to have projects shelved. However, Easternwell has been able to land, rig and start the modified, Australian-compliant Ideal Prime Rig, built by National Oilwell Varco (NOV), in the Surat Basin. This success can be attributed to a number of factors:
• Easternwell adopted an outcomes-based strategy and followed set criteria before selecting the rig and adapting it to Australia-specific standards – including the use of IEC-rated equipment and the correct wiring recognised in Australia.
• Australian drillers, rig managers, mechanics and electricians were trained to operate the equipment at NOV in Houston, Texas in the US.
• Easternwell used an innovative design to enable the rig to perform many different tasks and fit into many different markets – for example, increasing the floor height to allow extra BOP equipment to be kept underneath it when pressure drilling; and incorporating the ability to drill six wells from a single pad, comparatively reducing the number of coal seam gas wells that need to be drilled.
• Safety efficiencies were achieved through the use of high-tech, interlocking protocols designed to avoid major catastrophes during drilling operations.
• Cost efficiencies were derived from a number of features incorporated into the design, for example, the use of specialised software to smooth out the harmonics of the drill string and improve the rate of penetration. This improves the life of the drill bit, meaning less down-time for maintenance or repair.
• Transportation efficiencies will be created with fewer loads, bigger equipment and fewer cranes.
This innovative combination of technologies has collectively never been seen in Australia. While there was increased initial capital outlay, the effort and premium to specify the rig upfront for Australian standards has ensured that the rigs are ready to go as soon as they land.
Recognising Leading Practice: Addressing Regulatory Challenges

Copyright © Accenture 2015 All rights reserved. 29
LOGIC was funded by the UK Government and by the six leading oil- and industry-orientated UK trade associations. CRINE has since became a wholly owned subsidiary of LOGIC and, as a result, LOGIC now has responsibility for standard and model contracts in the UK offshore oil industry, with an active, cross-industry committee to review them. All operators and service providers share forecast service and labour requirements, and use a common structure for contracts and invitations to tenders. Operators and suppliers also both use standard LOGIC services including:
• Supply Chain Code of Practice: 142 signatories
• Vantage POB (personnel on board): 46 corporations
• Achilles First Point Assessment (FPAL): 2,500 suppliers and 95 buyers.
More recently, the UK has refocused on collaboration and competitiveness under the Wood Review. Data shows that production efficiency on the UK Continental Shelf (UKCS) fell to a record low of 60% in 2013, down from 80% only seven years before. The government-commissioned Wood Review in 2014 recommended changes such as creating a new arm’s-length regulator, and increased collaboration among industry stakeholders in key areas like regulations.
Industrial Relations: Significant Improvement NeededThis dimension evaluates the framework of the relationship between employers, employees and their representatives, how well it facilitates productive workplace relations, and how appropriate it is for supporting the development of a competitive sector. IR was measured by labour regulations, flexibility of wage determination, hiring and firing practices, and cooperation.
In the IR dimension, the operators scored the overall industry at 0.27, while the services sector scored itself as 0.37. Overall, respondents averaged a very low readiness score of 0.32 – the lowest in the research – indicating that the current IR framework is not ready to support the operations phase and requires significant improvement for the Australian oil and gas industry.
In the survey, operators and service providers both revealed significant concerns over inflexible IR frameworks in the industry. Nearly three-quarters (73%) of operators agreed or strongly agreed that Australia has an inflexible framework, while 63% of service providers felt the same way.
Out of 144 countries, the WEF places Australia:
• 132nd in terms of flexibility of wage determination
• 136th in terms of hiring and firing practices and cooperation
• 109th on labour–employer relations.37
These results echo opinions from operators and service companies regarding the challenges of IR in Australia.
In addition to cost and productivity issues, Australia’s oil and gas labour market is also seen to be relatively inflexible. In 2014, workplace laws meant companies had to negotiate ‘greenfield agreements’ with unions before work could start on any new projects, and the lack of set time limits often delayed the start of work.
“Industrial relations are a big issue in Australia … everyone is blaming everyone else, but we’re all in it together.” – Service provider
Figure 18: Service Sector Readiness Index – Industrial relations
1.00
0.75
0.50
0.25
0.37
0.00
Service providers0.32Industry average0.27Operators
Source: Accenture survey data
Capability
Competitiveness
Capacity
Regulatory framework
Industrial relations

30 Copyright © Accenture 2015 All rights reserved.

Copyright © Accenture 2015 All rights reserved. 31

32 Copyright © Accenture 2015 All rights reserved.
It seems certain that Australia will soon become the world’s largest LNG producer. However, the nation also has the opportunity to be the leading LNG operator, and along the way, develop a world-leading oil and gas services industry. This research shows operators and service providers believe Australia has the capacity and capability to support this leading position – but acknowledge there is significantly more work to be done to set up the competitiveness, and regulatory and industrial relations frameworks required to hold that position for the next 25 years. To achieve this goal, Australian operators and service providers should develop a shared vision for the future – to be recognised globally for expertise in LNG operations.
Should the industry choose to achieve this vision, there is substantial opportunity to develop and deploy new technologies and services, and create and build new innovative and enduring Australian companies that could compete at a global scale.
This section outlines recommendations for the industry around three key themes to help it become a world-leader in LNG operations. These recommendations include the application of accelerators across each of the themes to speed the journey ahead.
Accelerate the Development of ExperienceWhile capacity and capability are less likely now than in the construction phase to constrain the transition to operations, the industry will require more experience in operating hydrocarbon processing plants. Following the traditional path to build experience takes time, often decades. However, this time is not available, creating an imperative to accelerate experience. This report recommends a focus on the rapid adoption of global leading practices and learnings from other regions and also sharing operational experience across the industry as effectively and efficiently as possible.
Australia should apply lessons learned from other areas, including leading practice
initiatives like LOGIC and CRINE from the UK North Sea. Furthermore, continued upskilling and cross training of the technical workforce specifically for LNG operations is recommended, through the use of training centres like ACEPT in WA. Finally, applying digital technologies like social media, knowledge sharing tools and crowdsourcing to tap into global subject matter expertise could further accelerate experience in the oil and gas sector.
Integrate Industry Operating Models Many of the companies interviewed are already engaged in business readiness and operating model optimisation programs focused on building capacity and capability, and driving effectiveness and efficiency across their organisation.
An opportunity exists to extend these efforts beyond the boundaries of individual companies and to focus on streamlining the interfaces between industry participants. Put simply, the industry as a whole could improve overall competitiveness by making it easier for organisations to do business with one another.
The industry should collaborate through stronger services sector/operator integration and end-to-end supply chain optimisation. The focus should be on improving communication and creating forums where operators, service providers, regulators and government can frequently come together to discuss key topics including turnaround planning and execution, standardisation and shared infrastructure. Operators should recognise the pivotal role the services sector plays in research, technology and innovation, and how critical this is to the wider industry’s success. Joint approaches to innovation and R&D would give the services sector the confidence to make important technology investments.
Examples of industry integration and collaboration that can be referred to as models include Subsea Energy Australia and the South Australian Roadmap for Unconventional Gas Projects.
Figure 19: Roadmap to a world-leading LNG industry
Recommendations: How to Achieve World-Leading LNG Production
Digital industry
Innovation
Accelerators:
Key Focus Areas:
Ambition:
Industry collaboration
Lessons learned and leading practice
Source: Accenture research
Industry operating model integration
Industry optimisation
• Become the world’s leading LNG operator• Capture $50-70 billion of increased shareholder value• Position for next wave of capital investment
Accelerate experience

Copyright © Accenture 2015 All rights reserved. 33
Industry Optimisation through StandardisationIndustry optimisation is the application of well-known and common company-focused optimisation practices at an industry level. Industry optimisation requires standardising industry processes and practices and driving cross-industry continuous improvement across the value chain. The concept extends to the development of industry-wide shared services to drive economies of scale across processes.
Initial candidates for process standardisation could include supplier qualification processes, contracting terms and conditions, personnel on board, integrated activity planning, and turnaround planning and execution.
Implementing AcceleratorsIn addressing the themes outlined above, there are four key accelerators that could enable the sector to make the transition to world-class LNG production faster and more efficiently:
1. The industry can apply lessons learned and global leading practices that have helped accelerate excellence in operations. Understanding what ‘good’ looks like is a starting point, but learning from the journey that other parts of the industry have taken will help Australia leapfrog in performance. One leading practice that is occurring in Australia is the development of centres of excellence, which help industry players combine their resources and key strengths to achieve economies of scale and ensure industry-wide commitment to change (see ‘Adopt Recognised Leading Practices’).
2. Operators, service providers, government and regulators should collaborate to make the transition smoother and the rewards of LNG operations greater. Based on learnings from other parts of the world, cross-industry collaboration drives significant value regardless of whether the driver is necessity or opportunity (see ‘Collaborate with Intent’). Improving industry competitiveness in Australia is imperative to ensure that the nation is
Case Study: Subsea Energy AustraliaSubsea Energy Australia (SEA) is a not-for-profit industry association aimed at championing the Australian subsea industry and promoting Australian capabilities to the wider regional and global markets. SEA is modelled on Subsea UK, which is “the industry body and focal point for the entire British subsea industry and aims to increase business opportunities at home and abroad for the sector”.38
SEA has over 90 members including operators, service providers, suppliers, SMEs and universities, engaged in activities across the subsea oil and gas supply chain. It is a forum for networking and the advancement of industry, and helps organise, develop and export Australia’s capabilities. It also seeks to be marketing group for the Australian subsea industry, provides an avenue to discuss accelerated technology commercialisation, and surveys operator needs in Australasian and Southeast Asian export markets. SEA is a guide to sources of government support as well as a communicator between the Australian subsea industry and government.
SEA achieves these objectives by coordinating overseas missions, global trade shows, exhibitions, social events, and networking lunches and breakfasts with keynote speakers to share and exchange global technologies and innovations. SEA also organises operator meetings and workshops to assist in industry issues.39
Given SEA’s cross-industry involvement and wide range of members, it is a leading model for driving collaboration and sharing ideas to help advance the overall industry.
Case Study: South Australia Roadmap for Unconventional Gas Projects40
The Roadmap for Unconventional Gas Projects is another model that could be replicated more broadly across Australia to encourage cross-industry collaboration.
In October 2010, the South Australian Government initiated the formation of a consultative group to advise on unconventional gas resources. This collaborative cross-industry group consists of 390 members, including operating and service companies, government representatives, environmental conservationists, Indigenous people and other stakeholders.
The group is working together to address the challenges within the South Australian oil and gas industry. These include:
• Licences for exploration, retention and production
• Increasing public understanding by providing more reliable information such as on hazard and risk management
• Providing better training facilities and education programs for professionals and skilled tradespeople
• Enabling programs, regulations, legislation and policies to provide attractive licences that encourage environmentally sustainable land access, regulation certainty and efficiency
• Encouraging effective stakeholder consultation by project managers and regulators
• Providing incentives through royalty and/or tax reductions to accelerate unconventional gas reserves bookings and delivery.

34 Copyright © Accenture 2015 All rights reserved.
well positioned to attract the next wave of capital investment. This will require effective collaboration by all industry participants and associated forums.
3. Innovation is a key accelerator to achieve world-class operations. In this research, many examples surfaced demonstrating how the Australian oil and gas industry is growing substantial businesses through innovative solutions to common industry challenges (see ‘Innovate with Technology’). For companies with imagination, the opportunity to develop innovative new services and solutions is unprecedented. Never before have so many new technologically sophisticated assets been deployed in such a short time frame. Furthermore, operators should recognise and leverage the innovation being driven by the services sector and continue to build on this through joint R&D efforts.
4. The global shift towards using more digital technology creates a huge opportunity for Australia’s LNG sector to capture increased efficiency and value. The application of digital technology potentially represents the largest opportunity, depending on the extent to which the industry is willing to experiment with it. These technologies include the ‘Industrial Internet of Things’, big data, predictive analytics, mobility solutions, social media and 3D printing (see ‘Embrace Digital Technology’). These technologies can be applied to improve integrity and reliability, workforce productivity and overall operating efficiency, and drive down operational costs.
If Australia’s LNG sector embraces these accelerators, it can create real value and help to ensure that the next several decades are exciting and prosperous. Recommendations on how to implement these accelerators are described below.
Adopt Recognised Leading PracticesThere are many examples of global leading practices that Australia can learn from, in addition to those in the North Sea, described previously. In the US, a collaborative, cross-industry approach to developing hydraulic fracking and horizontal drilling has been the catalyst for the explosive growth of the shale gas industry. Continuous improvement in technologies for unconventional natural gas receives federal support and the benefit of collaborative innovation by many independent US oil companies.
In Canada, the government is involved in associations that encourage collaboration between operators in technology development, environmental performance and shared leading practices, such as Canada’s Oil Sands Innovation Alliance (COSIA).
Build Centres of ExcellenceThe LNG industry in Australia has hubs to support both the capital project and operations phase. A good example is the Australian Marine Complex (AMC), a centre of excellence for technology development, maintenance, assembly, fabrication and manufacturing. AMC services the marine, defence and resources sectors and has more than 150 businesses located at its complex near Perth.
AMC also specialises in fabricating and assembling offshore oil and gas modules. AMC’s services have been very important to the oil and gas industry – since opening in 2003 AMC has generated $1.4 billion from 368 projects, and created more than 9,900 industry jobs.41
Many international service providers have opened new facilities and technology centres in Australia to support the oil and gas industry, including Halliburton, Baker Hughes, GE Oil & Gas, Oceaneering and Schlumberger. These new facilities provide management, engineering and operations support across Australia.
In November 2010, Baker Hughes opened a new facility in Welshpool, WA. In February 2015, Oceaneering opened its new Jandakot, WA facility, which has a 100-tonne high-bay overhead crane, an inspection facility, ROV services, a
mobilisation warehouse and on-site integration testing facilities, as well as Australia’s only subsea first response toolkit (for any loss-of-well-control emergencies). Oceaneering Australia Managing Director Brett Smith expects this facility to become a world-class oil and gas industry services hub, and specifically a centre of subsea expertise.42
Service providers like GE Oil & Gas are introducing remote monitoring technologies into LNG (and other) plant operations in Australia, to drive productivity and reduce the time spent delivering operational services. Maintenance activities on power turbines and compressors for the LNG plants will take place at the GE Oil & Gas facilities in Jandakot and in Florence, Italy. Monitoring and diagnostics will be provided from GE Oil & Gas’ global iCentres. These centres house teams that track and advise on the performance of installed equipment, enabling customers to optimise plant availability and the life cycle of parts, reducing downtime as well as maintenance costs.43
Collaborate with IntentIn addition to looking at leading practices in other countries, one specific recommendation in the area of collaboration is for Australia to introduce a ‘services sector to operator’ collaboration forum. Our research showed that currently, there are limited opportunities for operators and service providers to come together to address key issues, and to seek and implement opportunities for improving LNG operations.
“This operational phase is now screaming out for synergies for these plants which are next door to each other. Same workforce, equipment, turnarounds – all sort of sharing to be done. All the service companies would have the same comment, they all want to get skin in the game, not just be just a body shop.” – Service provider
“The best models work when there is a full integration of operators and contractors – one team only, so the contractors are involved in executing and planning the work. I have seen it happen, where the contractors are part of the core team.” – Service provider

Copyright © Accenture 2015 All rights reserved. 35
Increased collaboration is an essential element of a mature and capable industry. In Australia, there are some good examples where the industry is coming together to address key challenges of the transition to operations. LNG operators are, for example, starting to look at turnaround demand and how they can manage the peaks in demand for key services associated with shutdowns.
A good example of collaboration is the Subsea First Response Toolkit (SFRT), built in 2013 by Oceaneering in Stavanger, Norway and stored in Jandakot, WA. The SFRT is a complete subsea incident response package of well-capping equipment for use anywhere in the world. APPEA coordinated the program, and companies including Apache, BHP Billiton, BP, Chevron, ConocoPhillips, ENI, ExxonMobil, Hess, INPEX, PTTEP Au,
Santos, Shell and Woodside financed it through the Australian Marine Oil Spill Centre (AMOSC). AMOSC’s spill response capability has in turn expanded, increasing its investment in equipment and doubling the size of the trained oil spill response team.44
Australia also has a good track record of industry collaboration in safety. One example is the Stand Together for Safety forum established in 2009. This event is now held annually and aims to reinforce safety by providing an opportunity for industry engagement on the topic. Most Australian oil and gas companies are actively involved in the forum.45
We recommend that the LNG industry extends these successes by leveraging existing forums such as APPEA and the newly announced OGERIGC to improve overall sector readiness and enable Australia to become the world’s largest, most efficient and most productive LNG industry.
Operator Collaboration in the Australian LNG Sector46
INPEX and Shell, together with Nextgen Group, have joined forces to deliver critical infrastructure through the construction of a subsea optical fibre cable system. The cable will provide the INPEX Ichthys LNG and Shell Prelude FLNG projects with access to high-speed data and voice communication services for the life of their operations. Work is scheduled to be completed in 2016. The Prelude and Ichthys projects will contribute equally to the construction of the system, which the Nextgen Group will build, own and operate. The system will stretch approximately 2,000 km between Darwin and Port Hedland.
In a joint statement, INPEX and Shell said the cable would offer superior reliability and quality compared with other available communication options such as satellite technology. The system will provide an initial design capacity of 3.2 terabits per second (Tbps) and has the potential to scale well beyond that as technology matures. Ichthys project Managing Director Louis Bon said constructing subsea infrastructure of this kind for private customers on the mainland was an Australian first. Shell Prelude Asset Manager Jim Marshall said Prelude FLNG’s proximity to Ichthys represented a significant opportunity for INPEX and Shell to achieve a better technical and commercial outcome.
The cable system also has significant capability to service other oil and gas operators in the region, including resource companies in the Pilbara.

36 Copyright © Accenture 2015 All rights reserved.
Case Study: Offshore Unlimited48
Offshore Unlimited (OU), headquartered in Hobart, Tasmania, is an example of successful innovation and entrepreneurialism within the oil and gas services sector. OU uses local capabilities and traditional Tasmanian shipbuilding technologies to deliver superior offshore support vessels and services. Developing strong relationships with operators across the country and adapting services to support the move to operations will ensure OU remains one of the industry’s major service providers during and after the industry’s transition to the operations phase.
Supplying Bass Strait, the Great Australian Bight and the North West Shelf, OU has built a competitive business based on a number of success factors. Using Tasmania’s local superior aluminium boat-building capability enables the company to develop fit-for-purpose, high-speed vessels suited to rough Australian waters. Local ship building also means stricter controls on quality, and a workforce with decades of marine experience helps vessels operate efficiently and effectively.
While OU builds vessels for the ‘spot’ market, it does so with the confidence that is has worked closely with operators during the design phase of their projects. Robust discussions on specialisation and the technology to support precise operator requirements enable OU to build vessels that ultimately service multiple clients’ needs. This collaboration early on facilitates the building of long-lasting relationships and often leads to longer-term post-construction contracts.
Tasmanian shipbuilder Incat developed the world’s fastest ship. It is through the use of innovative technology such as this that OU is able to build practical and capable high-speed vessels. With a large power-to-weight ratio, these vessels can better service challenging remote offshore facilities in the exploration and new FLNG market – a competitive advantage and good example of a service provider adapting to manage the transition to operations. This type of technology will become progressively more relevant in the global market as the world looks to operate in more isolated locations.
Innovate with TechnologyMany of Australia’s new LNG projects are of a scale and magnitude not seen in the past. In addition to the various leading technical features of the assets, service providers have been applying new technologies to the gas fields that feed the plants. For example, in 2013, oil and gas company Santos developed a world-class remote operations centre to change the way gas fields in the Bowen and Surat basins are operated.47 Working with service company Emerson, it introduced new process automation technology, giving it the ability to centrally monitor the production and progress of its intelligent assets up to 1,000 km apart.
Interviews with executives highlighted that service providers are using innovation and technology as a key driver to ensure they are ready for the operations phase. One example of this is Offshore Unlimited.
“The role of the service providers – bring more ideas to be more efficient as well as innovation – that is going to be critical … The companies that can bring the skills and abilities for the sustain phase are now needed.” – Operator
Embrace Digital TechnologyPerhaps the accelerator with the greatest potential to impact the LNG sector’s performance is digital technology. Accenture estimates there is $US14.4 trillion of value at stake globally between now and 2022, which all companies together could realise by integrating more digital technologies into their businesses. This value would come from a combination of increased revenues and lower costs between companies and industries from 2013 to 2022.49
Australia could also benefit from other more general digital advances. The ‘Industrial Internet of Things’ – the combination of big data analytics and the internet – has the potential to add $US10 trillion–$US15 trillion to the world’s GDP through efficiency gains over the next two decades, and its capability and uptake are accelerating rapidly.50
Resources companies today are increasing their use of digital technologies by integrating processes and solutions used to build, operate and maintain assets more efficiently and more safely. Integrating data, applications and processes that have been historically managed by horizontal silos will be essential for companies wanting to take advantage of the digital revolution in their maintenance and operations businesses. For example, in the refining industry, 36% of the advantage of ‘best-in-class’ refineries is due to effective maintenance.51 Refineries that are defined as best-in-class have 40% lower operating (non-maintenance) costs than the industry average,52 with only 5% of annual production lost for unplanned asset downtime. It is estimated that 80% of plant losses are preventable and can be avoided by implementing technology-based maintenance systems.53
The next generation of digital or ‘intelligent’ plants will integrate real-time information to deliver insights and foresight regarding operational performance, and will help the industry optimise plant operation, availability, costs and safety. This would result in improved efficiency, reduced non-productive time and re-work, and shorter decision-making processes.
Plant employees may also benefit directly in terms of reduced travel time, enhanced training experiences or the ability to move more freely around the plant, supported by better identification and tracking systems. However, the biggest win might be in reducing downtime.

Copyright © Accenture 2015 All rights reserved. 37
Transitioning digital technologies from the periphery to the core of LNG operations involves blurring the boundary between physical and digital. This offers energy companies a model for using digital technologies to not just augment or tweak existing processes, but to radically improve them. Many oil and gas companies are already using digital technologies – including sensors, unmanned aerial vehicles or drones, wearable computing devices and 3D printing – in their operations, but many are failing to really embed them into their operating models.
“Automation gives you more information and the application of that allows you to increase efficiency. That is a larger prize than any reduction in labour costs.” – Service provider
Companies can also derive far greater value out of data when it is supported by the right technology. Many are now embracing the concept of the data supply chain to change the way they source, modify and deliver data to the business. For example, an LNG operator monitoring pressure data could connect to a central analytics tool in real time, see the immediate effect of increased pressure and react accordingly.
Other companies are using digital technology to specifically enhance turnarounds. One company has invested in a turnaround maintenance solution that can track and monitor 2,500 contractors and their equipment for safety and productivity, in real time. The technology has the potential to access scheduling and risk data, allowing for further advanced analytics during shutdown operations, in turn creating a historical record for future turnarounds.
Digital Case StudiesIndustrial Internet of Things54
As an example of the Internet of Things, GE has created a new software platform called Predix, which runs industrial-scale analytics and connects machines, data and people over the industrial internet. It helps to improve asset performance management and business operations by connecting industrial assets from any vintage or vendor to the cloud and to each other. By analysing data from billions of sensors installed in locomotives, jet engines, blowout preventers and other intelligent machines, the system provides more insight and visibility to reduce unplanned downtime, increase predictability and improve productivity. The versatility of the solution makes it especially applicable to the oil and gas sector and can drive increased uptime and production.
3D Printing55
FMC Technologies provides subsea systems, technologies and services to the oil and gas industry. It supports its customers in improving shale and subsea infrastructures and operations to reduce cost, maintain uptime, and maximise oil and gas recovery.56 As one as one of the ‘World’s Most Innovative Companies’ according to Forbes Magazine, FMC is leading the way in developing and using new technologies in the oil and gas industry.
One such example is its use of 3D printing in the visualisation of prototypes for subsea systems, such as well heads. In the past, FMC has developed one-off, expensive, metal-based and/or time consuming 3D graphical models to demonstrate new products to customers. With the addition of 3D printing technologies, it has been able to develop these models using plastics at a fraction of the cost and time. Prototypes are easy to replicate and can be mass-produced for customer demonstrations, training and education, replacing traditional poster methods. In Brazil, its teams are now developing full-size prototypes. At several feet tall and wide, with a real weight of around 50 tonnes, these plastic models allow for a much richer learning and prototyping experience prior to development of the actual product.
FMC is now actively pursuing developing metallic prototypes, building up layers of metals to showcase and examine more complex equipment in real form. Building layers of expensive alloys as opposed to removing them from a large metal block in final product creation not only removes waste, but reduces time to build and cost – an efficiency gain for FMC and customers in the future.
Given the subsea environment is an incredibly technically difficult place in which to work, technologies must dramatically evolve and the ability to test modified materials and processes must improve prior to 3D printing parts for production.
Crowdsourcing57
Crowdsourcing is another niche digital area becoming more mainstream and showing considerable potential for a number of industries. Crowdsourcing is the process of obtaining services, ideas or content by soliciting contributions from a large group of people, especially from an online community, rather than from traditional employees or suppliers. In January 2015, Statoil and GE launched an open innovation challenge looking for ways to replace or reduce the amount of sand and water used in hydraulic fracturing operations. The challenge had a specific timeline and monetary rewards for five technologies that could be commercialised within five years and could reduce the environmental impact of fracking. Innovations developed via social media are becoming very effective ways for industry to quickly access particular expertise without increased time, effort or R&D expenditure.

38 Copyright © Accenture 2015 All rights reserved.

Copyright © Accenture 2015 All rights reserved. 39

40 Copyright © Accenture 2015 All rights reserved.
If operators and service providers are looking for tangible evidence of the additional value that can be delivered from true collaboration – they should start with turnarounds. This topic was raised in over 80% of executive interviews conducted. As a result of this feedback, Accenture worked with Asset Performance Networks to conduct an analysis of turnaround benchmark data and identify opportunities to improve turnaround planning and execution.
The near simultaneous ramp up of 13 new and geographically dispersed LNG trains and associated offshore and onshore assets across Australia over the next few years has the potential to be very challenging, especially when these facilities undergo planned turnarounds. This may result in difficult to manage activity peaks in which hundreds to thousands of skilled workers, including electricians, instrumentation contractors, pipefitters, boilermakers and turbine specialists are required across Australia, all within a relatively short period of time.
If LNG operators were to collaborate on the timing of turnarounds to optimise resource demands and availability for each plant, Accenture in collaboration with Asset Performance Networks estimates that the industry could save around $74-$84 million per annum. Analysis shows that each turnaround would conservatively be on average two days shorter, resulting in an up to $40 million per annum reduction in unplanned deferment across the industry58 and could save between $34- $44 million59 in turnaround execution costs60.
Given the peak energy demand periods in importing countries, weather conditions, and commercial and supply constraints, LNG operators in Australia are likely to
execute the majority of turnarounds within the April to September period. Asset Performance Networks has estimated that peak periods for LNG plant turnarounds could demand up to 10,000 contractors at a given time. In busy years, over 3 million contractor man-hours may be condensed into a short less than two month period for LNG alone, excluding demand for services associated with utilities, mining and refining turnarounds.61
Over the next three to five years, the Australian LNG industry will attempt to achieve global competitiveness in especially difficult times given the anticipated low oil price environment. If every LNG operator attempts to secure the best resources for their individually planned turnarounds, there would likely be periods of low availability and high resource costs. Service providers, already suffering from rate and staff reductions, will have little incentive to invest in building up a skilled resource pool. LNG operators will likely suffer as this translates into longer turnarounds, compromised asset integrity, poor reliability, higher costs and potentially more capital investment in the long run.
The oil and gas industry consistently struggles to deliver successful turnarounds. As the complexity of the turnaround increases, the overrun in both cost and schedule increases as well. According to Asset Performance Networks benchmarks, 68% of all turnarounds fail to satisfy all performance goals – defined as +/-10% of budget, +/-10% of planned schedule and no trips after start-up. Some 42% of all turnarounds grossly exceed one or more success criteria and can be classified as a ‘train wreck’ – defined as schedule and/or budget targets missed by 30% or more.
On top of the already challenging picture of turnaround performance, in Australia it is anticipated that this situation would worsen if collaborative actions are not taken at the industry-wide level. Australia is now in a unique position to adopt a more collaborative approach, which would ideally include an industry-wide
integrated planning effort, allowing all operators to optimise their individual and collective turnaround plans.
“It’s about smoothing out the demand peaks and getting the operators working together. They need to phase the work for turnarounds and collaborate. It will be the same maintenance crews moving between operators, so they should get smart by coordinating planning activity. There was no collaboration in the construction phase and it didn’t work well.” – Operator
Publishing the durations of planned turnarounds would also help contractors forecast future demand, giving them more incentive to invest in training additional resources. Collaboration on turnaround planning would result in a win-win for operators and service companies alike.
Analysis by Asset Performance Networks clearly shows the negative effect of turnarounds performed with limited availability of skilled resources, and without collaboration and coordination. Not only does the overall industry suffer from lower productivity due to the limited opportunity for service providers to invest in building skilled teams, but language and cultural barriers due to imported resources can also increase the risk of safety incidents. On top of already poor performance in turnarounds, the analysis indicated a 60% increase in the reportable incident rate, as defined by the US’s Occupational Safety and Health Administration (OSHA). Furthermore, the industry would be subject to limited resource availability, which already has a potential negative effect on turnaround duration, resulting in an additional schedule overrun of 6% paired with a cost overrun of 7%.
A collaborative approach to turnarounds would help smooth out the demand peaks, allowing companies to invest in hiring and training workers to optimise turnaround management. Long-term service contracts for turnarounds with individual operators will not resolve turnaround peaks; these
The Silver Bullet? Turning Around the Turnaround Situation

Copyright © Accenture 2015 All rights reserved. 41

42 Copyright © Accenture 2015 All rights reserved.
contracts merely shift the problem to the service provider, which does not have a view of the wider market demand and can only hope to level its resources under the known conditions instead of investing in additional resources.
The cases below show two scenarios for turnarounds in Australia (all LNG plants):
The Base Case Scenario (Figure 20) assumes each LNG operator schedules its own turnaround execution window. The outcomes of this scenario are:
• A shortage in craft resources (i.e. mechanical/civil, instrumentation, electrical, rotating/machinery, insulation/painting, scaffolding)
• Lower quality and skill sets of crafts (i.e. lower productivity, imported resources)
• Additional schedule slip of 6% (all other factors being equal)
• Additional cost growth of 7%.
• Worse safety performance (i.e. more green hats at facility)
• 60% increase in the Reportable Incident Rate (based on OSHA definition).
The Collaborative Scenario (also shown in Figure 20) assumes LNG operators collaborate on the timing of the turnarounds to optimise resource demands and availability per region. The outcomes of this scenario are:
• Levelled demand of craft resources (i.e. mechanical/civil, instrumentation, electrical, rotating/machinery, insulation/painting, scaffolding)
• Higher quality and skillsets of crafts (i.e. higher productivity, non-imported resources)
• Lower crafts wage rates and thus cost (as resource demand is more controlled).
“Collaboration is considered as one of the strategies to reduce costs. There are current discussions between the operators to avoid clashing of turnarounds. Collaboration started with safety by sharing best practices for an industry perspective. Potential sharing of water facility and pipelines as a way to reduce cost are in consideration. Service providers can also provide information about turnaround information from other proponents, helping optimise workload for critical services.” – Operator

Copyright © Accenture 2015 All rights reserved. 43
1,000
2,000
3,000
4,000
5,000
6,000
7,000
8,000
9,000
10,000
FTE
0
2015 2016 2017 2018 2019 2020 2021 2022 2023 2024 2025
Note: FTE is Full Time EquivalentNote: Turnaround duration assumed to be 35 daysSource: Asset Performance Networks
0
Mechanical/civilElectricalInstrumentationRotating/machineryInsulation & PaintingSca�olding
1,000
2,000
3,000
4,000
5,000
6,000
7,000
8,000
9,000
10,000
FTE
2015 2016 2017 2018 2019 2020 2021 2022 2023 2024 2025
Base Case – Assumes each LNG operator schedules their own turnaround execution window
Collaboration Case – LNG operators collaborate and optimise the timing of turnarounds to balance resource demand and availability
Figure 20: Turnaround scenario analysis

44 Copyright © Accenture 2015 All rights reserved.
Having invested over $250 billion since 2009 in the Australian LNG industry, operators are eager to smoothly and efficiently transition their newly built, state-of-the-art assets into the operations phase. They have been eagerly anticipating this shift, and most have had internal business and operational readiness initiatives underway for several years – hiring their teams, building operating organisations and preparing for the change.
Service providers have also been busy preparing. Their strategies have included investing in capabilities, services and new facilities (often representing investments of tens of millions of dollars), embarking on acquisitions, entering joint ventures, extending their geographical scope, training their workforces, and investing in new technologies and advanced systems. Others have been taking steps to adjust their business models, improving internal processes and implementing new enterprise and operational technologies.
What is striking is that these readiness activities have mainly taken place within industry siloes and not in a collaborative or coordinated fashion. To date, operators and service providers have not had sufficient dialogue regarding their preparations. As a result, there is a lack of understanding and often an underestimation of what each party is doing to prepare. What is also evident, and is well supported through the survey research data, is a lack of insight into what each party needs from the other to succeed – or even a definition of that success. Operators and service providers must improve their dialogue to help ensure the industry maximises productivity in this new phase.
Conclusion
Two areas where the operators and service providers are completely aligned is their concern at changing, inconsistent and complex regulations, and their belief that the industrial relations framework needs to change. Here, the industry can look to international leading practices in the UK North Sea, the US, Canada and Norway for examples of practical solutions.
It is expected that there would be no shortage of skilled resources in most key areas required for the operations phase. This means operators and service providers would have good access to skilled people. However, while Australia has workforce capacity now, this workforce lacks hydrocarbon operations experience. The industry will have to work together to develop the skills needed to operate effectively.
Furthermore, the executive interviews clearly identified that turnaround management will be a critical area for industry collaboration. As shown in the report, there are significant opportunities to reduce downside risks and improve the overall efficiency and safety performance of turnarounds – all compelling reasons to support this as an immediate area for increased industry collaboration.
The report recommends the application of global lessons learned and leading practices, increased industry collaboration, innovation and the embracing of digital technology as key to moving the industry toward world-class performance.
One specific recommendation in the area of collaboration is for the introduction of a services sector–to-operator collaboration forum. The research showed that currently, there is limited opportunity for operators and service providers to communicate and address key challenges to improvement in LNG operations. We recommend that a forum of this nature be formalised based on shared objectives of overall industry improvement.
Australia has a real opportunity to use the next few decades to create world-leading LNG production industry, where long-run returns could be achieved by all parties – operators, the services sector and citizens. Removing the frictional losses and prejudices in this ecosystem and minimising the boundaries between operators, service providers, government, regulators and employees would provide an ideal advantage for Australia.
The extent to which the industry is able to act upon these recommendations is dependent on many factors. However, there are significant benefits which could be gained if industry participants organise and collaborate to improve industry capacity, capability and competitiveness, and if the regulatory framework is made more consistent and the industrial relations framework more flexible. Collectively, Accenture estimates the industry could unlock between $50 billion and $70 billion of additional shareholder value over the next 25 years, adding materially to Australia’s prosperity and economic development. So, perhaps the question should now be: ready, why not?
The journey to becoming the world’s largest LNG producer started some time ago. The journey to becoming the world’s leading LNG producer starts today.

Copyright © Accenture 2015 All rights reserved. 45
Glossary
ABS Australian Bureau of Statistics
ACEPT Australian Centre for Energy and Process Training
AMOSC Australian Marine Oil Spill Centre
APLNG Australia Pacific LNG
APPEA Australian Petroleum Production and Exploration Association
bcm billion cubic metres
CAGR compound annual growth rate
CCIWA Chamber of Commerce and Industry of Western Australia
CSG coal seam gas
CRINE Cost Reduction in New Era
CSIRO Commonwealth Scientific and Industrial Research Organisation
EPC engineering procurement and construction
FLNG floating LNG
FPA First Point Assessment
GDP gross domestic product
HSE health, safety and environment
IR industrial relations
ISV infield support vessel
LNG liquefied natural gas
LOGIC Leading Oil and Gas Industry Competitiveness
MMbpd million barrels of oil per day
MMcfpd million standard cubic feet per day
mtpa (MTPA) million tonnes per annum
NOV National Oilwell Varco
NWSV North West Shelf Venture
OPCE Onshore Petroleum Centre of Excellence
OSHA Occupational Safety and Health Administration
OU Offshore Unlimited
p.a. per annum
POB Personnel on Board
QC LNG Queensland Curtis Gas LNG project
R&D research and development
ROV remote operated vehicle
SFRT Subsea First Response Toolkit
SMEs Small to Medium Enterprises
SSRI Services Sector Readiness Index
Tbps Terabits per second
UKCS UK Continental Shelf
WA Western Australia
WAERA Western Australian Energy Research Alliance
WEF World Economic Forum

46 Copyright © Accenture 2015 All rights reserved.
References
1 ‘LNG To Overtake Coal As Australia’s 2nd Biggest Export In 2018’, International Business Times, 3 November 2014; Accenture Estimates.
2 Accenture estimates.
3 IEA World Energy Outlook 2014.
4 World LNG Report, 2014, International Gas Union (IGU).
5 IEA World Energy Outlook 2014
6 Accenture estimates.
7 IBIS and Accenture estimates.
8 Ibid.
9 IBISWorld Industry Report I5021: Pipeline Transport in Australia, October 2014.
10 ‘Australia’s rotor industry grows but faces hurdles’ Aviation business Asia Pacific, 7 August 2013.
11 Past and Future Employment Levels and Growth – Department of Employment Trend Data and Projections, 2014.
12 Ibid.
13 Australian Bureau of Statistics (ABS), Australian System of National Accounts, 2012-13, ABS, Labour Force Survey, May 2014.
14 Careers 2015 – Challenger Institute Career Prospectus.
15 ‘Careers Australia becomes Thiess’ national apprenticeship training provider’, Thiess press release, 26 August 2014.
16 ‘LNG giant Bechtel employs 400 apprentices at Central Queensland plants’, ABC News, 10 November 2014.
17 LinkedIn Research.
18 ‘Clough acquires US LNG engineering firm’, Clough press release, 8 August 2014.
19 ‘Clough acquires leading commissioning contractor’, Clough press release, 31 January 2013.
20 How innovation and R&D happen in the upstream oil & gas industry: Insights from a global survey, Queensland University of Technology & University of Cambridge, United Kingdom.
21 About us, West Australian Energy Alliance 27 April 2015.
22 ‘Industry growth centres advice and support’, www.business.gov.au.
23 ‘Shell Awards Infield Support Vessel contract for Prelude FLNG’, Shell media release, 12 February 2014.
24 Company interviews.
25 ‘GE Opens Broome Facility’, The West Australian, 6 March 2015.
26 Hays Oil & Gas Global Salary Guide Review of 2013, outlook for 2014.
27 Real Labour Cost Escalation Forecast 2018/2019 – Australia & NSW, BIS Shrapnel.
28 The Global Competitiveness Report 2014-2015, World Economic Forum, September 2014.
29 Ibid.
30 Ibid.
31 Ibid.
32 Accenture research.
33 Ibid.
34 Ibid.
35 Company interviews and Oil and Gas Investor Australia, March 2015, pages 81-82.
36 ‘Cost reduction, CRINE, and the UK Continental Shelf’, The Energy Boardroom, 23 April 2014.
37 The Global Competitiveness Report 20-14-2015, World Economic Forum, September 2014.
38 About Subsea UK, www.subseauk.com, Subsea UK 27 April 2015.
39 About Subsea Energy Australia, www.subseaenergyaustralia.com/about-us, Subsea Energy Australia 27 April 2015.
40 ‘South Australia’s roadmap to progress’, Gas Today, June 2014.
41 Overview of AMC, www.australianmarinecomplex.com.au/About-the-AMC/Overview-of-the-AMC/, Australian Marine Complex, 27 April 2015.
42 ‘Oceaneering opens Jandakot facility’, Oil and Gas Australia, February 2015.
43 ‘GE Centre and Remote Monitoring Diagnostic Services’, GE website.
44 Australia’s Subsea first response toolkit, www.amosc.com; ‘Unprecedented industry investment in spill response system’, APPEA media release, 12 May 2012.
45 History – Stand Together for Safety, Stand Together for Safety, 2015.
46 ‘Australian LNG receives communications boost’, lngindustry.com, 14 May 2014; ‘Inpex, Shell to partner with Nextgen to build subsea cable’, Yahoo News, 12 May 2014; ‘$100m cable to support LNG projects’, The West Australian, 12 May 2014.
47 ‘Emerson technology helps Santos manage vast Gladstone LNG project in Australia’, Emerson press release, 4 July 2013.
48 Company interviews and ‘Innovation’, www.incatcrowther.com/company/innovation, Incat Crowther, 27 April 2015.
49 Accenture Innovation in Maintenance.
50 “GE Opens Predix Software Platform to Softbank Telecom in First Licensing Deal”, December 11, 2014, GE Press Release, http://www.genewsroom.com/press-releases/ge-opens-predixsoftware-platform-softbank-telecomfirst-licensing-deal-279328.
51 Accenture Innovation in Maintenance.
52 Ibid.
53 ARC Advisory Group, Paula Hollywood, “Passing the Insurance Acid Test with APM”, March 18, 2011, http://www.arcweb.com/strategyreports/2011-03-18/passing-theinsuranceacid-test-with-apm.aspx.
54 Industrial Internet Insights Report for 2015 – GE and Accenture.
55 Company interviews.
56 Company interviews and About us, www.fmctechnologies.com/AboutUs.aspx, FMC Technologies, 27 April 2015.
57 ‘GE, Statoil: Final Call for Open Innovation Challenge’, Subsea World News, April 2015.
58 Assumptions for unplanned deferment are listed below:
• 6% Reduction in schedule slippage (conservative)
• 4 trains/year (average)
• 3.5 MTPA per train (conservative)
• $US10/ MMBTU (conservative)
• 30 day turnaround window
• 12 hrs/ day.
59 Assumptions for execution costs include loaded costs per person- $200/hour and 7% increase in cost overruns (no collaboration).
60 Australian Forecast on LNG Turnaround Resource Demand, Asset Performance Networks, 14 April 2015.
61 Ibid.

Copyright © Accenture 2015 All rights reserved. 47

Copyright © 2015 Accenture All rights reserved.
Accenture, its logo, and High Performance Delivered are trademarks of Accenture. 15-1531
AuthorsBernadette Cullinane, Managing Director leading Accenture’s Energy Industry Group across Asia Pacific. Bernadette is based in Perth, Australia. Contact [email protected].
Rowan Fenn, Senior Manager in Accenture’s Energy Strategy Practice. Rowan is based in Perth, Australia.
Julie Adams, Senior Principle in Accenture Research, specialising in the oil and gas sector. Julie is based in London, UK.
For more information visit: accenture.com/energy
Follow us: @AccentureEnergy
AcknowledgementsAccenture thanks the many oil and gas services providers, operators, government and industry leaders who contributed to this study.
Accenture would like to thank John Alkemade, Director EMEA, Asset Performance Networks, and Asset Performance Networks for their contribution to the research into LNG plant turnaround management.
About AccentureAccenture is a global management consulting, technology services and outsourcing company, with more than 323,000 people serving clients in more than 120 countries. Combining unparalleled experience, comprehensive capabilities across all industries and business functions, and extensive research on the world’s most successful companies, Accenture collaborates with clients to help them become high-performance businesses and governments. The company generated net revenues of US$30.0 billion for the fiscal year ended Aug. 31, 2014. Its home page is www.accenture.com.