readying michigan to make good energy decisions: renewable energy
TRANSCRIPT

DEPARTMENT OF LICENSING & REGULATORY AFFAIRS
MICHIGAN PUBLIC SERVICE COMMISSION JOHN D. QUACKENBUSH, CHAIRMAN
MICHIGAN ECONOMIC DEVELOPMENT CORPORATION
MICHIGAN ENERGY OFFICE STEVE BAKKAL, DIRECTOR
Readying Michigan to Make Good Energy Decisions:
Renewable Energy
November 4, 2013
Presented by
John D. Quackenbush, Chairman
Michigan Public Service Commission
Licensing and Regulatory Affairs
Steve Bakkal, Director
Michigan Energy Office
Michigan Economic Development Corporation

2
Table of Contents
Preface .......................................................................................................................................................... 3
Executive Summary ...................................................................................................................................... 5
Readying Michigan to Make Good Energy Decisions – Renewable Energy Report ................................... 9
Michigan’s Renewable Portfolio Standard (RPS) ...................................................................................... 10
Comparison of Michigan’s Current RPS to Other States............................................................................ 15
Defining Various Technologies as Renewable ............................................................................... 18
Carve-Outs / Preferences ............................................................................................................... 27
Compliance Approaches ................................................................................................................ 29
Availability of Renewable Energy .............................................................................................................. 30
Possible Future Demand Under Several Scenarios ....................................................................... 32
Key Non-Technical Factors Limiting Feasibility ........................................................................... 33
Program Adaptability .................................................................................................................................. 38
Generation Costs ........................................................................................................................................ 39
Alternative Comparisons (Existing) .............................................................................................. 43
Summary of Costs ......................................................................................................................... 45
Generation Cost Comparison Methods ......................................................................................... 46
Other Decision Making Tools ....................................................................................................... 51
Capacity Factors ........................................................................................................................... 51
Diversity of Generation / Impact on Reliability ......................................................................................... 56
Planning ..................................................................................................................................................... 60
Fuel Price and Energy Price Volatility ...................................................................................................... 64
Grid Integration .......................................................................................................................................... 68
Local Impact .............................................................................................................................................. 73
Net Metering Basics ................................................................................................................................... 75
Net Metering Program Changes ................................................................................................................ 83
Back-up Provisions .................................................................................................................................... 85
Electric Choice / Retail Markets / REC Markets ....................................................................................... 89
How Much Renewable Energy is Available Under Current Surcharge Limits ......................................... 90
Summary .................................................................................................................................................. 102
APPENDIX A: Summary of State Renewable Portfolio Standards ...................................................... 104
APPENDIX B: Summary of Renewable Energy Compliance Approaches ............................................ 106
APPENDIX C: MISO Response Letter .................................................................................................. 109

3
Preface
The initial draft of the Renewable Energy Report was released for comment on
September 20, 2013. Comments on the draft report were accepted through October 16, 2013. A
total of 373 comments, multiple attached documents, and over 1,000 emails commenting or
providing feedback on the report were received prior to the deadline. All of the comments were
reviewed and considered in preparation of this final draft. However, hundreds of the comments
advocated for a particular policy and those comments have not been incorporated because this
report is intended to be informative and intentionally stops short of making policy
recommendations. Based upon the comments received, many revisions have been made
throughout the report. Several significant revisions that have been made are described below,
and many other comments received are addressed throughout the body of this report.
Many comments were received regarding which types of resources qualify as renewable.
Responding to those comments, RPS eligibility for biomass, ground source heat pumps, and
solar thermal have been incorporated in the section titled Comparison of Michigan’s Current
RPS to Other States (Questions 7, 9, 12, 19, 33).
Several documents were received from commenters regarding the pricing of wind energy.
In response to those comments, more background on wind energy pricing referencing reports
received is incorporated in the section titled Generation Costs (Questions 3, 4, 5, 10).
A description of California’s energy storage requirements has been added in the section
titled Generation Costs (Questions 3, 4, 5, 10) as part of the discussion under the subheading
Capacity Factors, addressing comments that were received surrounding the combination of
energy storage with renewables.

4
Comments were received regarding the capacity credit applicable to wind generation. In
response to comments received, a description of the MISO Independent Market Monitor’s
recommendation to change the wind capacity credit calculation has been incorporated in the
section titled Generation Costs (Questions 3, 4, 5, 10) as part of the discussion under the
subheading Capacity Factors.
The EIA natural gas Henry Hub spot price graph has been updated to reflect the most
recent data and is shown as Figure 13 in response to comments.
Several comments were received regarding generation resource mix and evaluating the
costs, benefits, and use of different types of generation. Responding to those comments, this
final report contains an added section titled Planning that describes energy planning and provides
background on the history of energy planning in Michigan. The Planning section may be found
within the Diversity of Generation/Impact on Reliability (Questions 6, 39) portion of the report.
Comments were received regarding the renewable energy surcharges in Michigan. The
various incremental renewable energy scenarios shown in Tables 10, 11, and 12 have been
updated to include Consumers Energy’s supplemental testimony in its most recent Renewable
Energy Plan that reduces the surcharges to $0 for all customer classes. Additionally, updated
numbers reflect that nine municipal utilities reduced surcharge collections to zero.
An additional scenario has been added as Table 13 including the new incremental
renewable energy potential assuming that the current Commission-approved 2012 renewable
energy surcharge levels are frozen.
In addition many other less significant revisions have been incorporated throughout the
body of this report.

5
Readying Michigan to Make Good Energy Decisions – Renewable Energy
Executive Summary
The 40 renewable energy questions posted on the Ensuring Michigan’s Energy Future website
garnered 425 responses. The comment summary pie chart presents an overview of comments
received at the website. Many additional renewable energy comments were given at the public
energy forums.
Where Michigan Is Today: Michigan’s current Renewable Portfolio Standard (RPS) requires
electric providers to ramp up
their use of renewable energy in
order to obtain 10% of their
electricity sales from renewable
resources in 2015. Those goals
are expected to be met in nearly
all cases, and the exception has
announced plans to wind down
service. The RPS has resulted
in approximately 1,400 MW of
new renewable energy projects
operating or currently under
development in our state (94%
of these new projects are wind energy projects and approximately half are non-utility owned).
By the end of 2013, in total, Michigan consumers will have paid approximately $675 million in
surcharges supporting this expansion. Due to decreases in renewable energy costs, surcharge
collections are expected to be significantly reduced or even eliminated for some electric
providers beginning in 2014, because project costs are in some cases essentially equivalent to
conventional generation under current conditions.
Comparison of Michigan’s Current RPS to Other States
There are 29 states, Washington DC and 2 territories with renewable portfolio standards.
There are 8 states and two territories with renewable goals.
When comparing RPS requirements, there is a simple way of doing so (simply “year” and
“number”), which is often used. Michigan’s RPS is one of the less aggressive RPS
programs when compared to others based solely on the target number. With the
exception of Michigan and Wisconsin, all other states with renewable energy portfolio
standards include targets higher than 10%.
This type of simple comparison does not take into account differences in the way
renewables are defined, the percent of renewables already in a state’s supply portfolio,
whether the requirement is uniformly mandated, the annual rate of increase to meet the
requirement, or the percent of RPS in comparison to load growth.
o There is no single scale now broadly available that attempts to “normalize” and
compare these different RPS standards in apples-to-apples ways, however UCS
attempts to show a comparison between states that has been incorporated. In
2008, when the RPS took effect, Michigan had a very low percentage of
10%
45% 27%
11%
2%
5% Siting
RPS Design
Cost
Grid Integration
Availability
Other

6
renewables in its portfolio (assuming more traditional definitions of renewable
power that would exclude nuclear, unlike some states including Ohio). It did
choose to apply the standard uniformly (unlike Illinois, for example), and it
mandated building new generation even if overall demand for electricity was
falling.
Theoretical Technical Feasibility of Increased Renewable Energy Generation
In the scenarios discussed in the report, from a theoretical technical perspective, it would
be possible to meet increased RPS targets of as much as 30% (or perhaps higher) from
resources located within the State.
Michigan is part of two multi-state markets, so from a purely technical perspective,
Michigan utilities could build or purchase renewable energy generated in a very large
geographic area. However, depending on the amount of energy needed, improvements in
infrastructure to move that energy could be necessary. Therefore, there is no scenario in
which, as a purely technical matter, even very aggressive renewable energy goals could
not be met, but more aggressive goals increase the potential need for additional
infrastructure improvements.
Non-technical factors could limit the amount that is available in-state, or could restrict the
ability to require generation from in-state regardless of technical feasibility. Two of
those factors are legal in nature.
o From a legal perspective, Michigan’s local governments address siting of all types
of electrical generation, including renewables, so local governmental rules
restricting such items could reduce the available sites.
o Also as a legal matter, Michigan’s current RPS limits on where renewable energy
could be located was characterized as unconstitutional in a federal circuit court of
appeals decision issued on June 7, 2013. To date, no party has directly challenged
the constitutionality of Michigan’s current law.
Cost
The most commonly cited cost estimates for renewables come from the Energy
Information Administration’s (EIA) levelized cost data from its Annual Energy Outlook
2013 for renewable and conventional generation.
Under the current RPS, overall costs have been calculated using levelized cost data
methods similar to those used by the U.S. Energy Information Administration.
During the years Michigan’s RPS has been in place, the price of the lowest-cost
renewable resource, wind, has declined from over $100 per MWh in 2009 to $50 - $60
per MWh now. The predominant reason for the drop is the significant increase in wind
farm capacity factors from the high 20s in 2008 to the mid-40s more recently.
EIA reports current levelized costs for other generation characterized as renewable under
Michigan’s current RPS:

7
o Wind - $87 per MWh
o Hydro - $90 per MWh
o Biomass - $111 per MWh
o Solar - $144 per MWh
o Wind (Offshore) - $222 per MWh
EIA reports current levelized costs for some generation not characterized as renewable
under Michigan’s current RPS:
o Natural gas conventional combined cycle plant is $67 per MWh.
o Advanced nuclear is $108 per MWh.
o Advanced coal with carbon capture and sequestration is $136 per MWh.
Even the entity that develops these estimates notes that levelized cost estimates are not
the only way to estimate costs and does not attempt to quantify other costs and benefits
that may be applicable. For instance, the EIA has noted that comparing costs only on a
levelized basis does not reflect the system value and operational profiles, and others have
noted that costs/benefits of reduced emissions may not be reflected. Assumptions
regarding the costs/benefits of these and other factors can often lead to disputes regarding
the “true cost” of renewables. The report discusses alternatives to levelized cost
estimates, none of which have been widely adopted to date.
Another reason cost comparisons of renewables vary is because different commenters
may use a different basis for comparison. For instance, if renewable generation is
compared to replacing existing generation, it will often appear more expensive.
However, if renewable generation is compared as an alternative to building new types of
generation, it will often appear to be less expensive.
Many assumptions regarding future tax treatments, carbon regulations, need for building
additional supporting generation and the expected rate of technical improvements can
also change cost estimates.
o One of the most important variables that accounts for different cost estimates for
solar and wind generation in the future is estimated fuel costs for other types of
generation. Approximately half of the renewable energy in Michigan under the
current RPS will come from contracts with prices locked in for 20 years. These
prices are not subject to fuel or market price volatility, like other types of
generation ranging from biomass to coal to natural gas.
o The higher the future cost of various fuels is projected to be, the better renewable
energy costs will be estimated to be in comparison. Thus, recent estimates of
very low natural gas prices are key in the estimated levelized cost of new natural
gas generation; usually lower than that of the least expensive renewable, onshore
wind.

8
Grid Reliability (Integration & Generation Diversity)
Broadly speaking, there is agreement that a diverse generation supply portfolio is a way
to minimize risk.
In general, Michigan’s grid reliability is assured by transmission system operators (MISO
and for some of Michigan’s southwest, PJM), who work with local operators, who in turn
work with the utilities that provide retail power.
To date, the MISO system portfolio has added more wind power than any other
renewable resource. MISO reports that to date, wind has not been a factor in any system-
wide reliability problems and has not resulted in any significant reliability concerns, due
in part to its ability to manage the system to provide flexibility when resources (both
renewable and non-renewable) do not behave as predicted.
It is difficult at this time to calculate the additional costs that have been undertaken to
assure that reliability vs. general reliability. MISO reports that it is not aware of backup
capacity costs specifically attributable to the intermittent nature of wind power.
However, there has been significant transmission built and planned that has helped
facilitate the introduction of wind power where it might not otherwise have been
supported. An example of this is the large build in the Michigan Thumb.
Various Scenarios for Comparison Sake
For purposes of comparison, the report describes a number of possible scenarios for
various increased renewable portfolio standards in various years. All scenarios are reliant
on a number of assumptions that could change outcomes and would require long range
planning and modeling analysis to determine further feasibility.
In order to work in a context familiar to policy makers, the scenarios assume a
continuation of PA 295 policies as a general matter, and assumed electric demand growth
of between 0% and 1.2% (both scenarios were run to show the range of impact).
Additional key assumptions included:
o Renewable energy costs would be at EIA’s current average estimates, however,
given Michigan’s recent experience with wind contracts coming in at lower prices
than EIA estimates, this assumption is considered to be conservative.
o Costs would be capped at current limits on monthly surcharges (not at current
charges, which are typically lower); and an additional scenario considered
reducing current surcharge caps by 50%. Freezing renewable energy surcharges
at the 2012 currently approved levels was also modeled.
o Current renewable generation costs relative to each other would continue (i.e.,
wind would continue to be less expensive than solar).
Under these assumptions, all evaluated scenarios (ranging from 15% by 2020 to 30% by
2035) are achievable.

9
Readying Michigan to Make Good Energy Decisions – Renewable Energy Report
In 2008, the Michigan Legislature passed Public Act 295 (PA 295). The purpose of PA
295 is "to promote the development of clean energy, renewable energy, and energy optimization
through the implementation of a clean, renewable, and energy efficient standard that will cost-
effectively do all of the following: (a) Diversify the resources used to reliably meet the energy
needs of consumers in this state. (b) Provide greater energy security through the use of
indigenous energy resources available within this state. (c) Encourage private investment in
renewable energy and energy efficiency. (d) Provide improved air quality and other benefits to
energy consumers and citizens of this state." MCL 460.1001. The Act requires Michigan electric
providers to ramp up their use of renewable energy in order to obtain 10% of their electricity
sales from renewable resources in 2015.1 The most recent report prepared by the Michigan
Public Service Commission discussing the status of renewable energy in Michigan is Report on
the Implementation of the P.A. 295 Renewable Energy Standard and the Cost-Effectiveness of
the Energy Standards (MPSC RPS Report).
1 PA 295 defines a renewable resource to include biomass, solar and solar thermal energy, wind energy, hydro, wave
energy, geothermal energy, municipal solid waste, and landfill gas. In addition, there is a category called “Clean
Energy” provided for within PA 295 via Advanced Cleaner Energy Resources that can qualify for Advanced
Cleaner Energy Credits and include gasification facilities, industrial cogeneration facilities, coal-fired electric
generating facilities if 85% or more of the carbon dioxide emissions are captured and permanently geologically
sequestered, and electric generating facilities or systems that use technologies not in commercial operation on the
effective date of the act. PA 295 also includes provisions to allow for excess Energy Optimization Credits to be
used to meet the renewable portfolio standard.

10
As Michigan approaches 2015, policymakers will be considering Michigan's energy
future. Governor Snyder asked all of Michigan’s citizens to provide input into this critical
process. The 40 renewable energy questions posted on the Ensuring Michigan’s Energy Future
website garnered 425 responses. Figure 1 presents an overview of comments received at the
website. In addition, many people addressed renewable energy at the 7 public forums held
throughout the state. This report attempts to provide a look at the current and future possibilities
for renewable energy and to address the questions and concerns that were raised by respondents.
Figure 1: Summary of Website Comments
Michigan’s Renewable Portfolio Standard (RPS) (Questions 1, 2, 7, 12, 20, 21, 22, 24, 34)
Introduction
Michigan’s RPS has been in place four years and has resulted in significant growth in
renewables for the State. In addition to the final 10% renewable requirement in 2015, the RPS
10%
45% 27%
11%
2%
5% Siting
RPS Design
Cost
Grid Integration
Availability
Other

11
includes interim compliance steps for 2012 – 2014. For 2016 and each year thereafter, electric
providers are required to maintain the same amount of renewable energy credits (RECs) needed
to meet the standard in 2015. Compliance with the renewable energy credit portfolio will be
demonstrated with renewable energy credits (RECs). RECs are granted under PA 295 Sections
39 and 41 on a ratio of one REC to one MWh of eligible renewable energy. Additionally,
Michigan incentive renewable energy credits are granted for solar power, on-peak renewable
energy generation, advanced electric or hydroelectric pumped storage technology, and for
renewable generation facilities constructed using Michigan equipment and/or a Michigan
workforce. Renewable energy credits may be sold separately from the energy.
Electric provider compliance reports for 2012 have been submitted in 2013. All electric
providers expect to meet the standard’s 2012 interim step requirement. The 2015 goals are
expected to be met in nearly all cases, and the exception, the City of Detroit’s system, has
announced plans to wind down service.
The RPS has resulted in approximately 1,400 MW of new renewable energy projects
operating or currently under development in our state (94% of these new projects are wind
energy projects and approximately half are non-utility owned). By the end of 2013, in total,
Michigan consumers will have paid approximately $675 million in surcharges supporting this
expansion. Due to decreases in renewable energy costs, surcharge collections are expected to be
significantly reduced or even eliminated for some electric providers beginning in 2014, because
project costs are in some cases essentially equivalent to conventional generation under current
conditions. More detail on this can be found in the MPSC RPS Report, which was the most
common data source cited by commenters on these topics.2
2 Unless otherwise referenced, this report is the basic information source informing the statements in this section.

12
How Compliance Was and Likely Will Be Achieved
A projection of Michigan’s renewable energy credits is shown in Figure 2 for 2012
through 2015 (along with the annual REC compliance requirement and quantity of accumulated
RECs). In order to reflect only renewable energy generated or acquired in each year,
accumulated RECs from previous years are not included in the renewable energy totals but are
shown separately in the line representing accumulated RECs. The projected renewable energy
includes baseline renewable energy (renewable energy that was operational prior to the passage
of PA 295); an estimate of RECs from PA 295 approved contracts for company-owned
renewable energy projects, power purchase agreements and REC-only contracts; and a projection
of other RECs from non-rate regulated providers and contracts that do not require Commission
approval under PA 295. For 2015, Michigan’s renewable energy percentage is projected to reach
nine percent based on renewable energy generated during that year and the associated incentive
renewable energy credits. Accumulated RECs from previous years that may be banked for up to
36 months and energy optimization credit substitutions for RECs provide additional resources to
fill in the gap between annual renewable generation and REC requirements to ensure meeting the
10 percent renewable portfolio standard. The amount of renewable energy generated during each
year is expected to continue increasing after 2015 because electric providers’ current renewable
energy plans show continued development of additional renewable energy projects. The
renewable energy projections shown for 2012 through 2015 clearly indicate that providers are on
track to meet the renewable portfolio standard.

13
Figure 2: Status of Michigan Renewable Energy3
As noted above, Michigan law is structured to create Renewable Energy Credits (RECs)
that satisfy the requirements for generation, and to allow trading in these credits. In general, this
has created a common valuation scheme for various objectives being pursued (e.g., installation of
cost effective renewables projects in Michigan, incentives for the development of renewables
technologies not yet known to be at cost parity, use of Michigan content, cost-effective import of
renewable power from outside Michigan when allowed by the statute). Michigan’s law includes
a provision in its RPS to address possible interactions with a potential future federal RPS (there
is not one at this time). MIRECS, Michigan’s registry established to track and certify energy
credits, is able to import and export RECs to other registries. However, users report that due to
the tailored nature of the Michigan RECs, that market has not, as a practical matter, extended to
other market jurisdictions.4
3 Report on the Implementation of the P.A. 295 Standard and the Cost Effectiveness of the Energy Standards,
Michigan Public Service Commission, February 15, 2013, Figure 3.
http://www.michigan.gov/documents/mpsc/implementation_of_PA295_renewable_energy_411615_7.pdf?20130729
150432 4 See e.g. Joint response from Consumers and MEGA).

14
As of January 2013, 49 renewable contracts and amendments have been filed with the
Commission and all have been approved.5 Figure 3 shows the expected commercial operation
dates for renewable energy projects. The breakdown by renewable energy technology type for
all renewable energy projects based on contracts and solar programs approved by the
Commission through 2012 is shown in Figure 4. Several renewable energy projects included in
Figure 4 have commercial operation dates beyond 2013.
Figure 3: Cumulative Renewable Energy Capacity by Commercial Operation Date6
5 For current contract information please see
http://www.michigan.gov/documents/mpsc/ContractSummary_405658_7.pdf?20130723114510 6 Report on the Implementation of the P.A. 295 Standard and the Cost Effectiveness of the Energy Standards,
Michigan Public Service Commission, February 15, 2013, Figure 4; amended to include 2014 and 2015..
http://www.michigan.gov/documents/mpsc/implementation_of_PA295_renewable_energy_411615_7.pdf?20130729
150432
17 MW 48 MW 69 MW
964 MW
1182 MW
1462 MW 1468 MW
0.0
200.0
400.0
600.0
800.0
1000.0
1200.0
1400.0
1600.0
2009 2010 2011 2012 2013 2014 2015
Cap
acit
y (M
W)
Hydro
AD.Biomass
Landfill
Solar
Wind

15
Figure 4: Renewable Energy Capacity by Technology Type7
Comparison of Michigan’s Current RPS to Other States (Questions 7, 9, 12, 19, 33)
There are currently 29 states, Washington DC and two territories (Puerto Rico and North
Mariana Islands) that have Renewable Portfolio Standards. There are eight states and two
territories (Guam and United States Virgin Islands) that have renewable energy goals in place.
Across the country, there is a large variation in RPS compliance requirements. Many states have
higher renewable percentages but with longer time periods to achieve compliance than
Michigan’s 2015 date for the mandate. The 10% requirement, however, is the lowest stated
percentage for an RPS in the country, save those states that lack an RPS altogether. Figure 5
shows a graphical representation of renewable portfolio standards in the U.S. and tabular data is
included as Appendix A.
7 Report on the Implementation of the P.A. 295 Standard and the Cost Effectiveness of the Energy Standards,
Michigan Public Service Commission, February 15, 2013, Figure 5.
http://www.michigan.gov/documents/mpsc/implementation_of_PA295_renewable_energy_411615_7.pdf?20130729
150432

16
Figure 5: DSIRE Renewable Portfolio Standard Policies Map-March 20138
That said, an “apples to apples” comparison of RPSs is difficult. Variations in how a standard is
structured (what resources are included; is standard expressed as % of peak, % of total kwh, % of
installed capacity or specific installed MW goal; and the overall timeline for meeting the
standard) make state to state comparisons difficult. Some states have established separate
compliance requirements for different types of electric providers (municipal utility, cooperative
utility, large and small utilities). Many of the state RPS requirements define what qualifies as
8 DSIRE Website: http://dsireusa.org/summarymaps/index.cfm?ee=1&RE=1

17
renewable energy to meet the standard differently as well. Figure 6 includes a state by state
comparison of what technologies are eligible to meet renewable portfolio standards.
Figure 6: Eligibility to Meet Renewable Requirements: State by State Comparison
AZ
CA
CO
CT
DE
DC
HI
IL
IA
ME
MD
MA
MI
MN
MO
MT
NV
NH
NJ
NM
NY
NC
OH
OR
PA
RI
TX
WA
WI
Wind
Solar
Photovoltaic
Solar Thermal
Hydroelectric
Biomass
Landfill Gas
Geothermal
Ocean/Wave/T
idal
Fuel Cells -
Renewable
Energy
Fuel Cells -
Non-
Renewable
Energy
Combined Heat and Power
Conservation/
Energy
Efficiency
Co-firing
Municipal Solid
Waste
Other
Technologies
Comments / Details
For explanations of these icons, click through to UCS Renewable Electricity Toolkit

18
Defining Various Technologies as Renewable
The National Resources Defense Council (NRDC) commented that Michigan’s current
biomass definition is too broad. It says that over the past two years, emerging scientific evidence
has discredited certain forms of bioenergy from forests as a clean, renewable fuel. Specifically,
burning whole trees to produce electricity increases carbon emissions compared with fossil fuels.
Short rotation crops, wood waste and reclaimed wood, and timber harvest residues (tops and
branches) have net lifecycle emissions that are far lower than those from fossil fuels. NRDC
further commented that based on pollution hazards, Waste-to-Energy should be considered
ineligible for Michigan’s RPS. Conversely, Covanta and Kent County both commented that the
limitation on new waste-to-energy facilities in the current RPS should be eliminated. Covanta
points out that there are no limitations on the eligibility of landfill gas under the current RPS.
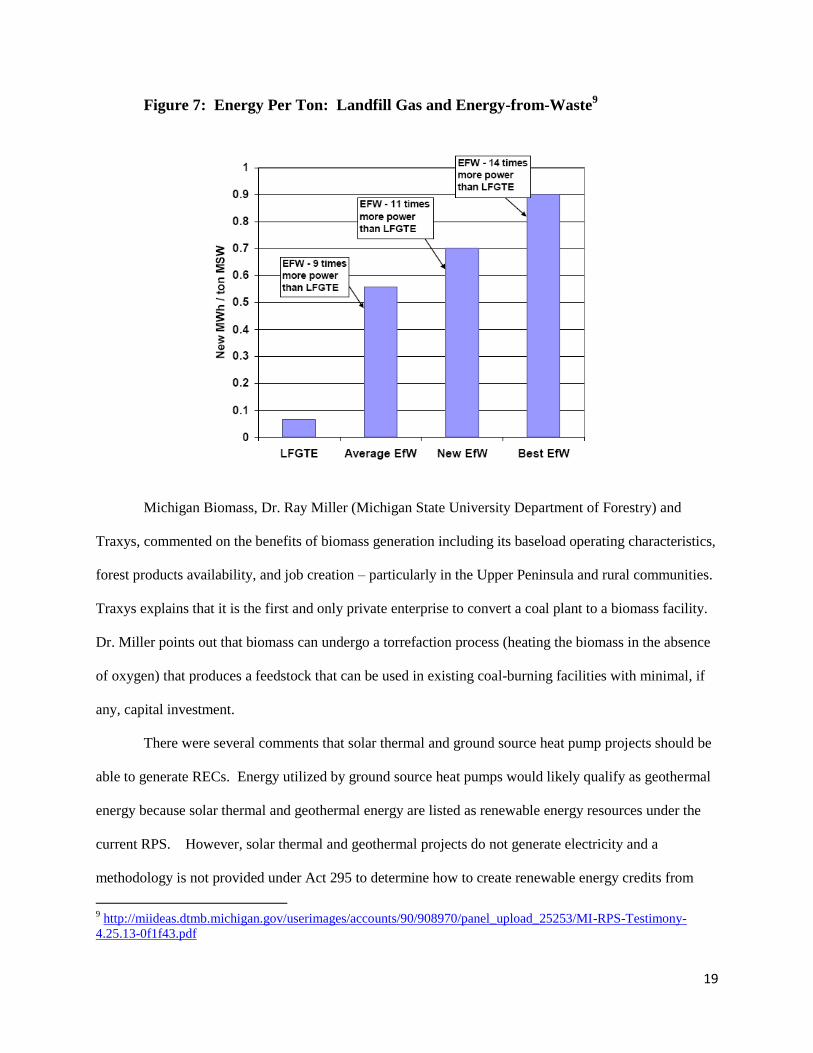
Covanta included a chart, Figure 7, showing the amount of power per ton from landfill gas and
various levels of Energy-from-Waste plants.
19
Figure 7: Energy Per Ton: Landfill Gas and Energy-from-Waste9
Michigan Biomass, Dr. Ray Miller (Michigan State University Department of Forestry) and
Traxys, commented on the benefits of biomass generation including its baseload operating characteristics,
forest products availability, and job creation – particularly in the Upper Peninsula and rural communities.
Traxys explains that it is the first and only private enterprise to convert a coal plant to a biomass facility.
Dr. Miller points out that biomass can undergo a torrefaction process (heating the biomass in the absence
of oxygen) that produces a feedstock that can be used in existing coal-burning facilities with minimal, if
any, capital investment.
There were several comments that solar thermal and ground source heat pump projects should be
able to generate RECs. Energy utilized by ground source heat pumps would likely qualify as geothermal
energy because solar thermal and geothermal energy are listed as renewable energy resources under the
current RPS. However, solar thermal and geothermal projects do not generate electricity and a
methodology is not provided under Act 295 to determine how to create renewable energy credits from
9 http://miideas.dtmb.michigan.gov/userimages/accounts/90/908970/panel_upload_25253/MI-RPS-Testimony-
4.25.13-0f1f43.pdf

20
their use. Under Ohio’s Alternative Energy Portfolio Standard, solar thermal systems that generate
electricity qualify. For Wisconsin, in May 2010, the RPS was amended to allow certain resources that
produce a measurable and verifiable displacement of conventional electricity resources to also qualify as
eligible resources (i.e., non-electric resources which displace electricity) including: solar water heaters;
solar light pipes; and ground source heat pumps.
In general, states that implemented higher standards have historically had higher energy
prices than Michigan had (Northeast and California) and/ or higher endemic renewables
resources (Western states: more hydro and solar; Plains states: more wind). Taking a closer look
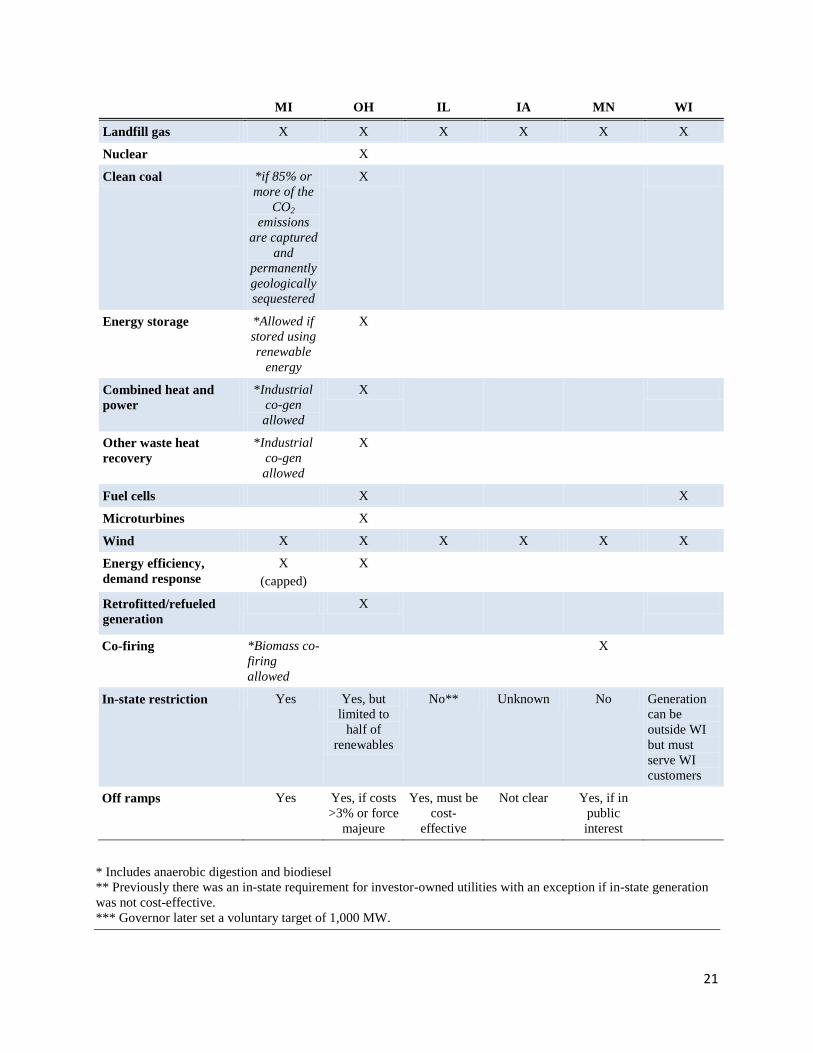
at the Midwest, the following data shown in Figure 8 was supplied in a joint response from the
Michigan utilities, with updates made by MPSC Staff shown in italics. It’s worth noting that,
particularly for Michigan and Ohio, differing sources have presented differing data (Figures 6
and 8).
Figure 8: Comparison of Midwest States
MI OH IL IA MN WI
Standard 10% by 2015 12.5% by
2024 (also
12.5%
“alternative
energy
resources”
by 2025 for
total of 25%)
25% by 2025 105 MW*** 25% by 2025
(30% by
2020 for
Xcel)
10% by 2015
Applicability by Utility
Type
All Municipal
and
cooperatives
exempt
Municipal
and
cooperatives
exempt
Municipal
and
cooperatives
exempt
All All
Eligible technologies
Biomass X X X* X X* X
Solar PV X X X X X X
Solar Thermal X X X X X X
Solid waste Limited X X X X
Geothermal X X X
Hydro Limited X X X X X
21
MI OH IL IA MN WI
Landfill gas X X X X X X
Nuclear X
Clean coal *if 85% or
more of the
CO2
emissions
are captured
and
permanently
geologically
sequestered
X
Energy storage *Allowed if
stored using
renewable
energy
X
Combined heat and
power
*Industrial
co-gen
allowed
X
Other waste heat
recovery
*Industrial
co-gen
allowed
X
Fuel cells X X
Microturbines X
Wind X X X X X X
Energy efficiency,
demand response
X
(capped)
X
Retrofitted/refueled
generation
X
Co-firing *Biomass co-
firing
allowed
X
In-state restriction Yes Yes, but
limited to
half of
renewables
No** Unknown No Generation
can be
outside WI
but must
serve WI
customers
Off ramps Yes Yes, if costs
>3% or force
majeure
Yes, must be
cost-
effective
Not clear Yes, if in
public
interest
* Includes anaerobic digestion and biodiesel
** Previously there was an in-state requirement for investor-owned utilities with an exception if in-state generation
was not cost-effective.
*** Governor later set a voluntary target of 1,000 MW.

22
Broadly speaking, Michigan’s RPS is firmly in the middle of states in terms of
renewables policy and investment (including those states that have no RPS), with no major
issues where Michigan’s current policy is out of line with other states’ approaches. Reference
data from Sandia National Lab (SNL) and Energy Information Administration (EIA) included by
the Union of Concerned Scientists noted that in their comparisons, in 2012, Michigan ranked 34th
among 50 states in terms of renewables (including hydro) as a percentage of installed capacity
(11%) and 37th
in terms of renewables as percentage of total GWh generation (4%).10
The following list of considerations was identified by Lawrence Berkeley National Lab
as typical considerations in design of renewables portfolio standards, and helps underscore the
challenge of simple state to state comparisons (Source: Union of Concerned Scientists comments
in response to Question 7):
o Renewable energy targets and timeframes
o Electric service providers obligated to meet the standard, and use of exemptions
o Eligibility of different renewable energy technologies
o Qualification of existing renewable energy projects
o Treatment of out-of-state renewable energy projects
o Whether technology set-asides or other tiers are used
o Use of credit multipliers
o Allowance for renewable energy credits (RECs), and REC definitions
o Methods to enforce compliance
o Existence and design of cost caps
o Compliance flexibility and waivers
10 Few comments referenced non-US markets, suggesting that stakeholders primary frame of reference is others
states/ regions in the US, rather than global energy markets.

23
o Contract requirements
o Compliance filing and approval requirements
o Compliance cost recovery
o Role of state funding mechanisms.
To address the difficulties associated with comparing RPSs among states, the Union of
Concerned Scientists (UCS) suggested using support for new renewable energy generation as a
meaningful metric. UCS found that “…Michigan ranks 11th
among RES11
states in support for
new renewable generation in 2015.” This metric measures the size of the state’s power load,
number of utilities obligated to meet the requirement, the amount of existing resources available
and eligible to meet the requirements and the pace of progress towards the standard. UCS
ranked Michigan higher than it otherwise would have due to the required pace to meet the 2015
standard. Figure 9 shows UCS’s comparison of RPS states for 2015.
11
RES stands for Renewable Energy Standard and the term may be used interchangeably with Renewable Portfolio Standard (RPS).

24
Figure 9: UCS New Renewable Energy Generation Support (2015)
UCS found that Michigan will fall from 11th
to 18th
place, as shown on Figure 10, by 2025 under
the current RPS.

25
Figure 10:: UCS New Renewable Energy Generation Support (2025)
A comparison of new renewable capacity and the accompanying generation expected in
2035 according to current RPS laws prepared by Lawrence Berkeley National Laboratory is
shown in Figure 11.

26
Figure 11: New Renewable Capacity and Generation by 2035 for RPS States12
The National Renewable Energy Lab report: Including Alternative Resources in State
Renewable Portfolio Standards: Current Design and Implementation Experience published
November, 2012 has a summary of state programs that include alternative resources (e.g., non-
renewables, energy efficiency, and thermal technologies) in state renewable portfolio standards.
Michigan is highlighted as one of 16 states that includes alternative resources. Michigan is one of
12
See Galen Barbose, “Renewables Portfolio Standards in the United States: A Status Update,” a
presentation to the National Conference of State Legislatures, May 2, 2013, available at
http://www.cleanenergystates.org/assets/2013-Files/RPS/Barbose-RPS-Presentation-NCSL-Spring-
2013.pdf.

27
four states that includes non-renewables (coal with >85% sequestration and gasification qualifies
for alternative cleaner energy credits), one of nine states that includes energy efficiency, and one
of 13 states that includes combined heat and power (industrial cogeneration qualifies for
alternative cleaner energy credits) in the state RPS.
Seven of the 29 states with a renewable electricity standard allow energy efficiency to
comingle with renewable energy in meeting compliance obligations.13
In Pennsylvania, up to
10% of the 18% standard can be met with energy efficiency. Connecticut, Nevada and Ohio also
permit the use of energy efficiency to meet their goals. Both DTE Electric Company and
Consumers Energy Company, Michigan’s two largest electric providers, have substituted excess
energy optimization (energy efficiency) credits for renewable energy credits to meet the
renewable standard.
Some commenters suggest reviewing renewable energy programs in other countries as
examples Michigan should consider or take care to avoid. Other countries often have very
different market, government, tax, and regulatory structures that make comparisons very
challenging. Some countries use feed in tariffs, which provide more direction as to the type of
generation constructed and price paid. An RPS generally provides a target for the amount of
renewable energy, but allows electric providers to use market decisions to meet that target in the
most cost effective manner. Michigan’s RPS has resulted in 94% wind and less solar and
biomass.
Carve-Outs/Preferences
Michigan’s RPS does not include a “carve-out” to require any particular type of
renewable generation, but it does contain “REC multipliers” that give certain types of renewable
generation more weight than others. Michigan’s REC multipliers provide extra RECs for
13
See Union of Concerned Scientists Response to Question 2.

28
electricity generated from solar, on-peak generation, use of Michigan materials and Michigan
labor in the construction of generating facilities, and advanced storage charged with renewable
generation. A number of states (Nevada, Oregon, Delaware, Utah, Texas, West Virginia, and
Washington) have credit multipliers for solar similar to that found in Michigan law, or for
specific renewable energy mandates such as non-wind or distributed generation.14
Assuming that policy makers wish to stimulate particular types of renewable generation
over others, the Michigan legislature could establish carve outs or provide additional incentive
credits. At least one commenter suggested Michigan amend its RPS to include a methane
digester carve out while other commenters suggested the RPS be amended to include a 10% new
renewable baseload carve-out and to incentivize dispatchable renewable energy generation.
There is some disagreement about the best method for doing so: some advocate carve-outs, and
others multipliers. The two approaches are discussed below.
The major advantage of carve-outs is that they provide very tailored and specific ways to
achieve a policy goal or recognize the value of natural resource assets. The major disadvantage
of carve-outs is that they do not necessarily allow sufficient flexibility should the cost of meeting
the carve-out become excessive, or the net benefit of meeting the policy goal through carve-outs
is not apparent. However, if the value of RECs is very low, then REC multipliers do not
incentivize development. Utility market players tend to support REC multipliers because it gives
the investors/program developers flexibility in how best to meet the overall standards. Specific
technology supporters and/ or affected market segments tend to favor carve-outs because they
are likely to have more direct, predictable impact. Table 1, from the Union of Concerned
Scientists’ answer to Question 24, shows carve-outs in other state RPSs. The majority of the
14
MPSC Renewable Energy Section Staff response to Question 24.

29
carve-outs are related to solar while several incentivize distributed and customer-sited
generation. A carve-out increases demand for a particular type of generation which could lead to
higher prices in the near term and caps the particular generation type at the carve-out
requirement. The advantage of a carve-out is increased diversity and growth in the specified
generation type.
Table 1: RPS Carve-Out Summary15
Compliance Approaches
Across states, compliance approaches fall into five broad categories: Alternative
Compliance Payments (ACPs) with automatic cost recovery, ACPs with possible cost recovery,
explicit financial penalties with no automatic cost recovery, discretionary financial penalties with
no cost recovery, and enforcement at PUC discretion. A summary of renewable portfolio
standard compliance approaches is included as Appendix B. According to data from the
15
Union of Concerned Scientists Response to Question 24,
http://www.michigan.gov/documents/energy/UCS_Compiled_Responses_on_Michigans_Energy_Future_--_4-25-
13_420080_7.pdf

30
Lawrence Berkeley National Laboratory (LBNL), states currently monitoring compliance report
that utilities are meeting about 96 percent of their renewable energy requirements overall. In
2009 and 2010, all but three of the states that had an annual compliance requirement achieved
greater than 90 percent compliance, with most states reporting full compliance.
Availability of Renewable Energy (Questions 8, 13, 14, 15)
The National Renewable Energy Laboratory (NREL) issued a report estimating
renewable energy potentials for each state. For offshore wind, the Great Lakes Offshore Wind
Council estimated Michigan’s potential. These estimates are provided in Table 2. The greatest
amount of potentially available renewable energy is solar, followed by offshore wind. The
Estimated Michigan Potential attempts to recognize developmental constraints. For a statewide
analysis, it is not possible to consider site specific information to determine where and how much
renewable energy generation could actually be developed. The Estimated Michigan Potential
shown in Table 2 reflects wind and solar potential reductions from the Theoretical Maximum
Potential and attempts to recognize the significant constraints that could impact development
which include local site-specific concerns, community acceptance, technical interconnection and
grid integration issues, generation costs, etc.

31
Table 2: Estimated Renewable Energy Potential
NREL Theoretical
Maximum Potential for
Michigan1
GW
Estimated Michigan
Potential
GW
Solar
(rural – utility scale) 3,444 34
2
Solar
(urban-utility scale) 34 0.34
2
Solar
(rooftop) 22 0.22
2
Onshore Wind 59 11-203
Biomass 2 2
Hydro 1 1
Michigan Great Lakes
Offshore Wind Council4
GW
Estimated Michigan
Potential4
GW
Offshore Wind -
30 Meter Depth 97 0-7
Offshore Wind –
45 Meter Depth 131 0-16
Total5 3,700 61
1U.S. Renewable Energy Technical Potentials, NREL, July 2012,
http://www.nrel.gov/docs/fy12osti/51946.pdf 2The solar theoretical potential is reduced by 99% due to lack of siting experience
in Michigan. 3The theoretical maximum potential for onshore wind is reduced by 66% and 81%
to estimate the maximum and minimum Michigan potential. The reduction
percentages are based on the analysis done by the Michigan Wind Energy Resource
Zone Board described in the Board’s final report. http://www.dleg.state.mi.us/mpsc/renewables/windboard/werzb_final_report.pdf 4To estimate the offshore wind potential, only the “Most Favorable Area” as
described in the Great Lakes Wind Council’s September 1, 2009 was included in
the estimated Michigan potential.
http://michiganglowcouncil.org/GLOWreportOct2010_with%20appendices.pdf 5Offshore Wind 45 Meter Depth potentials were included in the Totals.
The theoretical utility scale (rural) solar potential NREL estimated for Michigan is 3,444
GW. To install this quantity of solar, NREL estimates an area of 72,000 square kilometers

32
would be needed, which is approximately half of Michigan’s land area.16
The minimum quantity
offshore wind is assumed to be zero in Table 2, as this technology is still in the research stages
for the Great Lakes.
Possible Future Demand Under Several Scenarios
Renewable energy targets, like all types of generation planning, are often informed by
estimates of future load levels or future sales levels. In particular, it is important to ensure
enough energy is available to satisfy the “peak” demand, or widespread instability can result.
Michigan’s peak load tends to occur during the hottest weekday of the summer. That is based on
the confluence of several factors that increase load. First, in a daily cycle, load is higher during
the day than at night. Second, load is lower on the weekends. Third, there are also seasonal
cycles. Load in Michigan is highest in the summer and lower in the spring and fall. Electricity
load is also influenced by the weather.
Table 3 shows estimates of Michigan’s peak load at various growth rates, using at the
high end the 1.2% rate of load growth that was projected before the most recent recession, as
well as lower growth rates. The 0.5% rate was used by Consumers Energy in a recent certificate
of need application for a natural gas plant.
16
Michigan Information Center, 1990 Land and Water Area by County,
http://www.michigan.gov/documents/1990_Land_and_Water_Area_by_County_32916_7.pdf?20130729160147

33
Table 3: Peak Load Estimates (GW)
Year
Peak Load Growth Estimate
Percentage
1.2% 1.0% 0.5%
2006 23.8 23.8 23.8
2010 24.9 24.7 24.2
2015 26.4 26.0 24.8
2020 28.1 27.3 25.4
2025 29.8 28.7 26.1
2030 31.6 30.2 26.8
Comparing these numbers to the potential numbers for each type of renewable energy in
Table 2, shows that there is adequate renewable energy available within the state from a
technical perspective to support a wide range of renewable targets.
Therefore, there are no technical or reliability issues that place a hard limit on the amount
of renewable energy that could be generated. However, higher levels of requirements may
require additional infrastructure to maintain reliability. While from a purely technical view
there are no hard limits, non-technical factors could limit the amount that is feasible in-state, or
could restrict the ability to require generation from in-state regardless of technical feasibility.
Key Non-Technical Factors Limiting Feasibility
Two key issues were identified during the process that could limit the feasibility of
implementing any law that required siting generation within the State, even if the target were
technically possible as discussed above.
First, from a legal perspective, Michigan’s local governments address siting of all types
of electrical generation, including renewables, so local governmental rules restricting such items

34
could reduce the available sites. In Michigan, local governments have siting authority for
generation. Recently, likely due to concerns like those expressed in some of the public forums
regarding possible impacts from large turbines on nearby residents (noise and visual impacts
being some of the most common cited), some local governments have restricted siting in ways
that reduces the number of turbines that may be able to be sited in certain locations. With the
increase in wind farm development in Michigan, a number of counties and townships have
developed ordinances and approved special land use permits that are intended to protect
residents, historical sites and wildlife from improper wind farm siting practices, yet are not so
restrictive that wind farms cannot be developed.
The special land use permit approved by Mason County for the Lake Winds Energy Park
included a requirement for a detailed bird and bat study. Consumers Energy Company
conducted a Phase I Avian Risk Assessment, a bird migration and breeding survey for 2009 and
2010, a survey of bat species in the area, a study involving acoustic monitoring of bat activity in
the area, a map of known eagle nests, a map of endangered species, surface water map, and other
natural features in the area. All of the above were reviewed by County officials prior to the
approval of the permit. An additional consideration is lighting the turbines to the minimum FAA
requirements. Appropriate lighting reduces annoyance to the residents and reduces attraction of
flying insects that could draw bats. Also, some ordinances require monopole construction of the
turbine towers as opposed to lattice frame construction to mitigate avian nesting.
Columbia Township is conducting a similar permitting process for the Consumers Energy
Cross Winds Energy Park. There were a number of comments submitted about the negative
impacts of siting utility scale wind turbines near structures, particularly near homes. Health and
nuisance issues relating to viewscape interference, flickering, audible noise, inaudible noise and

35
vibration were described. One study, Noise and Health Report from Inter-disciplinary
International Journal concludes “our results suggest that utility-scale wind energy generation is
not without adverse health impacts on nearby residents”(page 338) and recommends that “on
the basis of our data, suggest that setback distances need to be greater than 2 km in hilly
terrain” (page 339). To achieve higher levels of renewable energy in Michigan, one commenter
suggested addressing the concerns that citizens may have about ensuring the establishment of
adequately protective wind turbine setback and siting guidelines at the local level.
Another commenter compared coal-fired power plant siting decisions to wind turbine
siting and suggested that greater set-backs may address the siting concerns of adjacent property
owners for wind turbines in much the same way as setbacks or buffer zones that are typically
used for coal-fired power plants. A 2011 report prepared under a National Association of
Regulatory Utility Commissioners grant, Assessing Sound Emissions from Proposed Wind
Farms & Measuring the Performance of Completed Projects, found that “…it would be advisable
for any new project to attempt to maintain a mean sound level of 40 dBA or less outside all
residences as an ideal design goal.” (page 2)
There was limited discussion about the tension between the desire for standard setback
and other siting requirements vs. the desire for, and essential reality of, home rule and local
zoning decisions. Comments were limited to stating preferences rather than a thorough review
of relevant statutes and regulations that would enable or inhibit state-wide siting requirements
and/or standards.
Property value impacts caused by the proximity of wind farms to homes and real estate is
a concern mentioned by commenters. A number of comments were submitted addressing the
issue with studies supporting statements that wind farms negatively affect property values,

36
positively affect property values or have no impact.17 Lawrence Berkeley National Laboratory
recently conducted a study that analyzed more than 50,000 home sales near 67 wind facilities in
27 counties across nine U.S. states, yet was unable to uncover any impacts to nearby home
property values.18
Second, Michigan’s current RPS provisions regarding where renewable energy could be
located were characterized as unconstitutional in a federal circuit court of appeals decision issued
on June 7, 2013. The court’s rationale was that such restrictions fall afoul of the Commerce
Clause of the U.S. Constitution. That decision was not in a case that directly challenged the
constitutionality of Michigan’s current law. To date, no such direct challenge has been brought.
At least one other state’s preferences for in-state renewable generation are before the courts in
direct challenge, but no decisions have yet been rendered: Colorado’s in American Tradition
Institute v. Colorado. To date, there has not yet been any RPS overturned based on this issue.
Additionally, one commenter suggests renewable energy standards may be distinguished, and
thus defended differently, from (non-RPS) laws that have been overturned and for which the
dormant Commerce Clause would have affect.
17
Carter, Jason, “The Effect of Wind Farms on Residential Property Values in Lee County, Illinois”, Illinois State
University (Spring 2011), available at:
http://renewableenergy.illinoisstate.edu/downloads/publications/2011%20Wind%20Farms%20Effect%20on%20Pro
perty%20Values%20in%20Lee%20County.pdf
Hinman, Jennifer L., “Wind Farm Proximity and Property Values: A Pooled Hedonic Regression Analysis of
Property Values in Central Illinois” Illinois State University (May 2010), available at:
http://renewableenergy.illinoisstate.edu/downloads/publications/2010%20Wind%20Farm%20Proximity%20and%20
Property%20Values.pdf
Hoen, Ben, Ryan Wiser, Peter Cappers, Mark Theyer and Gautum Sethi “The Impact of Wind Power Projects on
Residential Property Values in the United States: A Multi-Site Hedonic Analysis,” Ernest Orlando Lawrence
Berkeley National Laboratory, Berkeley, CA (Dec. 2009) funded by the Office of Energy Efficiency and Renewable
Energy of the U.S. Department of Energy under contract No. DE-AC02-05ch1123. It can also be found on Berkeley
Labs website: http://eetd.lbl.gov/sites/all/files/publications/report-lbnl-2829e.pdf
Hientzelman, Martin D., Tuttle, Carrie M., “Values in the Wind: A Hedonic Analysis of Wind Power Facilities”
Economics and Financial Studies, School of Business, Clarkston University (March 3, 2011), available for
download at: http://papers.ssrn.com/sol3/papers.cfm?abstract_id=1803601 18
http://emp.lbl.gov/sites/all/files/lbnl-6362e.pdf

37
Additionally, some states have opted to amend their renewable energy statutes rather than
risk having their RPSs declared unconstitutional. When the constitutionality of Massachusetts’
RPS was challenged, the Massachusetts Department of Public Utilities removed the in-state
locational requirement for long-term renewable energy contracts and the case was settled before
a court could rule on the statute’s constitutionality. Similarly, Minnesota amended its RPS
statute to provide the state’s program “shall not give more or less credit to energy based on the
state where the energy is generated.” California removed location classifications from its RPS
in 2006. The Commerce Clause and Implications for State Renewable Portfolio Standards report
published by Clean Energy States Alliance provides a summary of various approaches for
encouraging local economic activity while remaining in compliance with U.S. Constitution. In
contrast, some commenters argued that the ability to import renewables from other areas that
may be cheaper would have economic benefits overall by lowering the cost of power, and that
these broad benefits could outweigh the direct economic development benefits of restricting
generation.
In Wisconsin, renewable energy generated outside of the state is eligible, but the
electricity must be used to meet a provider's retail load obligation in Wisconsin (i.e., it must be
delivered to Wisconsin customers). Additionally a commenter suggested that the concern over
the constitutionality of the Michigan RPS would be mitigated by specifying that the “location
requirement is to ensure that the power is deliverable to Michigan.”
No single source provides a net benefits summary of increased renewable investments in
Michigan that addressed the full list of issues identified in this report such as relative costs (with
and without consideration for carbon and other environmental impacts), relative risks, regional
market approach, or other benefits, so these are unavailable for comparison of various scenarios.

38
Program Adaptability (Questions 29,32)
Michigan’s RPS includes several items that are intended to increase its adaptability. Two
key elements that add adaptability is a list of criteria for adjusting or delaying the 10%
requirement and a cost cap. Additionally, Michigan’s RPS has some provisions regarding how it
might fit into a federal RPS were one to be enacted, although not every possible adaptation can
be foreseen or addressed through a state law. Other states have employed a variety of provisions
to provide alternatives to limit costs under unforeseen circumstances, and some of the more
popular provisions are described below, along with the states employing them.19
o Alternative compliance payments. These are payments that can be made in lieu of
purchasing RECs or building new generation in order to meet RPS requirements.
They can serve as an alternative to a cost cap.
(CT,DC,DE,IL,MA,MD,ME,NH,NJ,OR,OH,PA,RI,TX)
o Rate impact or revenue cap. These provisions are similar to the per customer cost
cap that Michigan employs, but are instead structured as a limit on the overall
revenue that can be dedicated to compliance, or the overall rate impact.
(CO,DE,IL,KS,MD,MO,NM,OH,OR,WA)
o Per customer cost cap. This limits the amount that can be charged to each customer
to fulfill the mandate. (MI,NC,NM)
o Renewable Energy fund cap. Under this mechanism, a pre-determined amount of
available funding limits the cost of achieving the RPS. (NY, formerly CA)
o Renewable Energy contract price cap. This limits the amount that can be charged
per MWh of renewable power in a contract, essentially a way of limiting costs for
19
Seven states with RPSs employ none of these cost limitation provisions. (AZ,CA,HI,IA,MN,NV,WI).

39
renewables that is “upsteam” of revenue caps or per customer rate caps. (MT,
formerly NM)
An evaluation of the performance of many of these ways of restricting costs can be found at:
http://climatepolicyinitiative.org/wp-content/uploads/2012/06/Limiting-the-Cost-of-Renewables-Lessons-for-
California.pdf.
Generation Costs (Questions 3, 4, 5, 10)
Levelized Cost of Energy (LCOE) for New Build Comparison
The Energy Information Administration (EIA) makes projections of levelized costs for
various types of electric generation shown in Table 4.

40
Table 4: EIA Estimated Levelized Cost of New Generation Resources, 201820
The EIA costs are provided in 2011 dollars for plants entering service in 2018, are
overnight cost estimates and do not reflect the production tax credit (PTC) for wind, solar and
biomass. The PTC is a $ per kWh federal tax credit for qualifiying renewable energy projects.
Table 5 shows the current value of the PTC for various renewable energy resource types.
20
http://www.eia.gov/forecasts/aeo/pdf/electricity_generation.pdf

41
Table 5: PTC Credit Amounts21
The Utilities provided renewable energy tax incentives in dollars per MWh for wind,
solar PV and biomass in their comments for informational purposes. It is not known whether
these tax incentives will be available for projects going into service during the 2018 time period
which corresponds to the levelized cost numbers in the most recent EIA levelized cost data used
in Table 5. Table 6 shows the impact of these tax incentives on the 2018 EIA Levelized Cost of
Energy data.
21
See http://dsireusa.org/incentives/incentive.cfm?Incentive_Code=US13F

42
Table 6: Renewable Energy Tax Incentive Impacts, $/MWh22
Published 2013
EIA Levelized Cost of
Energy Estimate
(2018 In-service date with
no tax incentive)
$/MWh
Tax
Incentive
$/MWh
Adjusted EIA
Levelized Cost of
Energy Estimate
(with Tax Incentive)
$/MWh
Wind $86.60 $29.20 $57.40
Biomass $111.00 $14.60 $96.40
Solar PV $144.30 $36.00 $108.30
The $/MWh amounts for the tax incentive are based on the current PTCs (at the time the Utilities
filed their comments) of $22/MWh for wind energy and $11/MW for biomass and landfill gas
and are adjusted for inflation, levelized, and grossed up for taxes. The solar tax incentive is
based on Lazard’s analysis of the subsidized and unsubsidized levelized cost of energy for two
different utility-scale solar PV technologies crystalline and thin film. The subsidized amount is
based on the 30% investment tax credit for solar.
EIA provided the levelized cost of renewable and non-renewable energy in its Annual
Energy Outlook 2013 Early Release. EIA projects an advanced coal plant levelized cost range of
$123.00 per MWh to $135.50 per MWh23
and a natural gas combined cycle plant cost range of
$65.60 per MWh to $67.10 per MWh.
Carbon regulation is expected to increase the cost of coal and natural gas generation, but
to date has not occurred. EIA levelized cost data shows approximately a $12.50 per MWh cost
difference between an advanced coal plant and an advanced coal plant with carbon sequestration
technology. The Commission Staff, with input from a group of electric providers, developed a
22
See
http://www.michigan.gov/documents/energy/Renewable_Energy_Question_4_response_from_DTE_Consumers_an
d_MEGA_419489_7.pdf 23
With carbon capture and sequestration.

43
combined cycle natural gas plant levelized cost of $66.23 per MWh in 2013 dollars for a plant
entering service in 2016.24
The EIA’s 2012 and 2013 reference case for estimating the levelized costs of different
sources of new generation makes an adjustment for greenhouse gas intensive technologies.
Specifically, the EIA increases the cost of capital by 3% for coal-fired power and coal-to-liquids
plants without carbon capture and sequestration (CCS). The EIA clarified that this 3% is based
on a $15 per ton cost of carbon dioxide, which translates to $16 per MWh for new pulverized
coal plant and $18 per MWh for Integrated Gas Combined Cycle (IGCC). Recent work on the
subject of carbon tax and regulation by the Brookings Institution, Congressional Research
Service, MIT, NERA Economic Consulting, and others use a higher estimate in the range of $20
per ton. This would suggest slightly higher levelized cost of energy than the EIA estimates.25
However, if no carbon tax or equivalent is enacted, then the cost of capital would need to be
adjusted accordingly.
Alternative Comparisons (Existing)
Using the most recently approved cost of service data for Consumers Energy and DTE
Electric, the weighted average overall power supply cost for both companies is $64 per MWh.
This cost includes all existing generated and purchased power with transmission costs removed.
Therefore, when comparisons are made to the existing fleet, no new generation of any kind is
likely to be lower, with the exception of lower priced wind contracts.26
Because new builds of any type are likely to be more expensive than the existing, very
mature fleet, comparing the cost of new renewable energy resources to the cost of existing
24
http://efile.mpsc.state.mi.us/efile/docs/15800/0036.pdf. See also staff answer to question 23. 25
See: (Utility answer to Q4). 26
See: http://www.michigan.gov/documents/mpsc/ContractSummary_405658_7.pdf?20130918173106.

44
generation has been criticized. Further, even comparing the cost of new renewables to other
types of new generation should be done with caution.
There is debate about the appropriate methodology for how best to compare the cost of
renewables to existing generation and to the cost of new non-renewables generation. For
instance, the EIA estimates show only the projected cost of energy. However, planning by
utilities and grid operators to ensure long-term supply of generation is done on a capacity basis,
meaning taking into account the availability of that energy. Certain types of renewable energy,
namely wind and solar, have less capacity value due to their intermittency (although solar is
often available at “peak” times), as discussed further below. Additionally, the EIA methodology
omits some costs (such as transmission upgrades necessary to integrate new generation resources
that will be higher for new resources that are farther from customer load centers).27
Other factors
it omits that some believe should be included are the cost of backup generation and spinning
reserves, essentially to “offset” some of the costs of integrating resources with comparatively
high intermittency, though this is disputed by others.28
Similarly, the EIA methodology also
omits some pricing benefits that may be available. For instance, the federal production tax
credits are not included, which give a credit for 10 years of 2.3¢/kWh for wind, geothermal,
closed-loop biomass, and 1.1¢/kWh for other eligible technologies, which can noticeably impact
pricing. The EIA methodology also does not attempt to quantify potential health benefits from
alternative generation. Levelized costs are presented as “overnight” costs without the cost of
27
Whether additional transmission costs should be allocated to renewables or whether the infrastructure actually
reduces costs overall is an area of debate. There is little debate that non-utility-scale solar does not require
transmission, and thus may save cost relative to other intermittent generation, but no quantification of such a figure
was provided. 28
Compare the IICCUSA response to ISO/RTO Variable Energy Resources White Paper.

45
interest incurred during construction.29
Generation types with long construction periods such as
nuclear and coal would have higher levelized costs if these interest costs were included in the
calculation. Finally, EIA costs are only estimates and can vary based on the assumptions and
timeframe are used.
Summary of Costs
In general, there is broad agreement that there is significant theoretical technical potential
for renewables to provide significant supply in Michigan because it’s technically possible to
meet all of Michigan’s needs through renewables. That said, there is significant difference
between theoretical technical feasibility of aggressive renewables and the practical ability to
deploy it at very high levels within the State. It is also clear that since the Michigan RPS was
enacted, the costs of renewable energy, particularly onshore wind and solar, have dropped
noticeably.30
The most common way to estimate the relative cost for renewables is to compare new
renewable builds to new types of other generation. In doing so, natural gas co-generation is one
of the only types of conventional fuel generation that might be more economical than the lower-
cost forms of renewable energy. However, if compared to existing generation, renewables will
often appear more expensive because many of the fixed costs relating to existing generation have
already been paid.
While levelized cost is by far the most commonly cited methodology for determining
costs, it has drawn criticism from a wide variety of quarters for what it does not include. A long
29
Levelized cost: The present value of the total cost of building and operating a generating plant over its
economic life, converted to equal annual payments. Costs are levelized in real dollars (i.e., adjusted to
remove the impact of inflation). See EIA website: http://www.eia.gov/tools/glossary/index.cfm?id=L
30
Solar cost decreases have been reported by electric providers as part of solar pilot programs.

46
list of potential factors potentially impacting cost estimates and comparisons are not part of the
levelized cost calculations, including the system value and operational profiles, the costs/benefits
of reduced emissions, future tax treatments, future fuel costs, carbon regulations, the need for
supporting generation, and the expected rate of technical improvements. The next section
discusses various alternatives, none of which have been widely adopted.
Generation Cost Comparison Methods
The Levelized Cost of Energy (LCOE) is a methodology for determining an estimated
cost of energy from a given generation technology and is often used for screening generation
resource options. The following basic input assumptions are required: fixed cost, variable cost,
financing costs and expected energy production. The last item is related to how the resource is
expected to be dispatched and is the most difficult to estimate. According to EIA, LCOE should
not be used to compare renewable and conventional generation options beyond a simple
screening comparison because they have different operational profiles and system value. 31
Instead, EIA is developing a new methodology called Levelized Avoided Cost of Energy
(LACE). EIA describes LCOE as the revenues required for a type of resource and LACE as the
revenues available to a type of resource. When LACE is greater than LCOE, a project is
considered to have a positive net economic value. LACE is based on the system value of a
generation resource and derived from the cost of displaced energy and capacity which EIA says
would be a better value to use for resource selection. EIA’s LACE net economic value forecasts
are shown in Figures 12a and 12b.
31
EIA Presentation, Assessing the Economic Value of New Utility-Scale Renewable Generation Projects,
http://www.fbcconferences.com/e/eia/presentations/c-namowicz.pdf, Jun 17, 2013, Chris Namovicz, U.S. Energy
Information Administration, 2013 EIA Energy Conference.

47
Figure 12a: EIA Net Economic Value Forecasts (LACE – LCOE)
Figure 12b: EIA Net Economic Value Forecasts (LACE – LCOE)
(Assuming Continuation of Current Tax Credits)

48
Forecasting the value of the avoided energy and capacity into the future for the life of the
resource option being considered requires many assumptions – including assumptions that are
forecasted for very long-term time periods. To determine LACE for a particular resource, long-
term generation re-dispatch modeling information must be incorporated. This adds a level of
complexity beyond LCOE which requires an estimate of expected generator output. The
accuracy of LCOE can be improved by fine-tuning the expected generator output. The price of
natural gas is a factor in evaluating the advanced combined cycle generation option. Figure 13
shows EIA’s forecast of natural gas prices.
Figure 13: EIA Natural Gas Price Forecast32
EIA uses the National Energy Modeling System to generate LCOE and LACE numbers
and points out that resource characteristics reflect average values for each region, and may not
32
http://www.eia.gov/oiaf/aeo/tablebrowser/#release=AEO2013ER&subject=3-AEO2013ER&table=13-
AEO2013ER®ion=0-0&cases=early2013-d102312a

49
reflect characteristics at all locations, especially in large, geographically diverse regions. Both
LCOE and LACE values are only approximations of model decision making criteria. Similarly,
the model on which both LCOE and LACE is based is itself is an approximation of real-world
conditions. EIA is expected to begin reporting LACE data in addition to LCOE in the near
future.
An example of comparing baseload and intermittent generation is presented by MIT
professor Paul Joskow.33
This methodology is more detailed than LCOE and less detailed than
LACE and does not require an integrated resource plan (IRP).34
It also requires good historical
data for on-peak and off-peak generation and, like many methods, may be very sensitive to
forecasted on-peak and off-peak market prices. Joskow concluded that the extension and use of
levelized cost comparisons to intermittent generation has been a mistake and tends to implicitly
overvalue intermittent generating technologies compared to dispatchable alternatives. The paper
says that this problem is easily remedied by integrating generation output profiles for each
technology with the associated expected market value of the output that will be supplied by each
technology along with their respective lifecycle productions costs.
Several reports were provided that considered the cost of wind as “wind added to natural
gas fired generation” or “wind added to coal fired generation” and discuss the integration
challenges related to wind because it is an intermittent resource.”35, 36
Integration challenges
33
Comparing the Cost of Intermittent and Dispatchable Electric Generation Technologies, Paul L. Joskow , July
2011http://miideas.dtmb.michigan.gov/userimages/accounts/90/908970/panel_upload_25253/Joskow-MIT.pdf 34
An integrated resource plan is a plan developed by an electric power provider, sometimes as required by a public regulatory commission or agency, that defines the short and long term capacity additions (supply side) and demand side management programs that it will undertake to meet projected energy demands. 35
The Hidden Costs of Wind Electricity, American Tradition Institute, December 2012.
http://miideas.dtmb.michigan.gov/userimages/accounts/90/908970/panel_upload_25253/Hidden-Cost.pdf 36
The True Cost of Electricity From Wind is Always Underestimated and its Value is Always Overestimated, Glenn
R. Schleede, February 10, 2010,
http://miideas.dtmb.michigan.gov/userimages/accounts/90/908970/panel_upload_25253/High_Cost_and_Low_Valu
e_of_Electricity_from_Wind1.pdf

50
such as the low capacity credit associated with wind generation, its distance from population
centers, and its impact on other generators on the system are presented in the reports. The
underlying theme among these submitted reports is that most “cost of electricity” comparisons
have significantly understated the cost of electricity generated by wind because they failed to
take its indirect and infrastructure costs into account, including the cost of keeping available the
other generation plants that balance wind’s variations, the higher fuel consumption (per unit of
output) that wind imposes on those other generation plants, the cost of additional long-distance
transmission that wind typically requires, and the losses that come with it.
Conversely, the Lawrence Berkeley National Laboratory’s 2012 Wind Technologies
Report found that wind integration costs in an ISO or RTO are lower than costs for projects that
do not interconnect in large balancing areas such as an ISO or RTO. The Lawrence Berkeley
report also found that with one exception, “…wind integration costs estimated by the studies
reviewed are below $12/MWh—and often below $5/MWh—for wind power capacity
penetrations up to and even exceeding 40% of the peak load of the system in which the wind
power is delivered.”37
The levelized cost of wind varies by region throughout the U.S. The Great Lakes region
is less expensive than some regions of the country such as the Western and Northwestern regions
of the U.S., and is often more expensive than the Interior region of the U.S. that includes states
such as Iowa. . In general, for Michigan to utilize the benefit of the lowest priced wind located
in the Interior Region, additional transmission likely will be necessary. It is possible that the cost
of the additional transmission to enable the deliverability of wind from the Interior region to
37
See http://emp.lbl.gov/sites/all/files/lbnl-6356e-ppt.pdf Wiser, Ryan H., and Mark Bolinger. 2012 Wind
Technologies Market Report, Edited by Galen L. Barbose, Naïm Darghouth, Ben Hoen, Andrew D. Mills, Samantha
Weaver, Kevin Porter, Michael Buckley, Sari Fink, Frank Oteri and Suzanne Tegen., 2013, page 64.

51
Michigan may reduce the attractiveness of the lower-priced Interior region wind compared to
Michigan wind.
Other Decision-Making Tools
In addition to generalized estimates like those discussed above, when making specific
decisions regarding generation at a point in time, integrated resource planning modeling is often
undertaken. Michigan’s current law requires such planning as part of a certificate of need
application for any new generation not mandated as part of the RPS. Such activities may use
Michigan-specific or utility-specific modeling. Some advocate creating a continual modeling
process, so that integrated assessments are constantly informing potential decisions that may be
considered privately.
Capacity Factors
The capacity factor is a measure of how often an electric generator runs for a specific
period of time; typically one year.38
A capacity factor compares how much electricity a
generator actually produces with the maximum it could produce at continuous full power
operation during the same period. For example, if a 1 MW generator produced 5,000 MWh over
a year, its capacity factor would be 0.57 because 5,000 MWh equals 57% of the amount of
electricity the generator could have produced if it operated the entire year (8,760 hours) at full
capacity and produced 8,760 MWh of electricity. Generators with relatively low fuel costs are
usually dispatched to supply baseload power, and typically have average annual capacity factors
of 0.70 or more. (No generator has a capacity factor of one, because all types of generation must
cease running at times for a variety of reasons, including fuel availability and required
38
Capacity factor: The ratio of the electrical energy produced by a generating unit for the period of time
considered to the electrical energy that could have been produced at continuous full power operation
during the same period. http://www.eia.gov/tools/glossary/index.cfm?id=C

52
maintenance.) Generators with lower capacity factors may indicate they are in operation during
peak demand periods and/or have high fuel costs, or their operation depends on the availability
of the energy source, such as hydro, solar, and wind energy.39
The US DOE 2011 Wind Technologies Market Report presents capacity factors for 397
wind power plants built between 1983 and 2010, totaling 37,606 MW (94% of U.S. installed
wind generation at the end of 2010). The report found that capacity factors for wind have
improved over time, from 25% in 1999 to a high of nearly 34% in 2008. Although factors
slipped back to the 30% range during 2009 and 2010, they rebounded to 33% in 2011. The
improvement can be credited to the substantial increase in average hub height and rotor diameter.
Two factors likely played a role in the 2009 and 2010 decrease: annual wind resource variations
(wind speeds) and wind power curtailment. Curtailment of wind generation can occur due to
inadequate transmission and/or minimum generation limits which can result in low or negative
wholesale electricity prices. Forecasted capacity factors for Michigan’s newer wind farms
located in the Thumb area are above 40%.40
Certain types of renewable energy, namely wind and solar, have less capacity value than
most other kinds of generation due to their greater intermittency. This means that system
operators cannot count on them during peak periods of high electricity consumption in the same
manner as other types of generation. An on-peak “capacity credit” differs from the capacity
factor in that on-peak is a specific snapshot in time, usually much shorter period of time, such as
peak hour. The peak hour of the year occurs when the demand for electricity is at the highest
point for the entire year. Capacity credits reflect the amount of expected capacity that is
expected to be available during the specified peak and may be a very different number from the
39
http://www.eia.gov/tools/faqs/faq.cfm?id=187&t=3 40
http://www.windpoweringamerica.gov/filter_detail.asp?itemid=3207
http://www.windpoweringamerica.gov/pdfs/2011_annual_wind_market_report.pdf
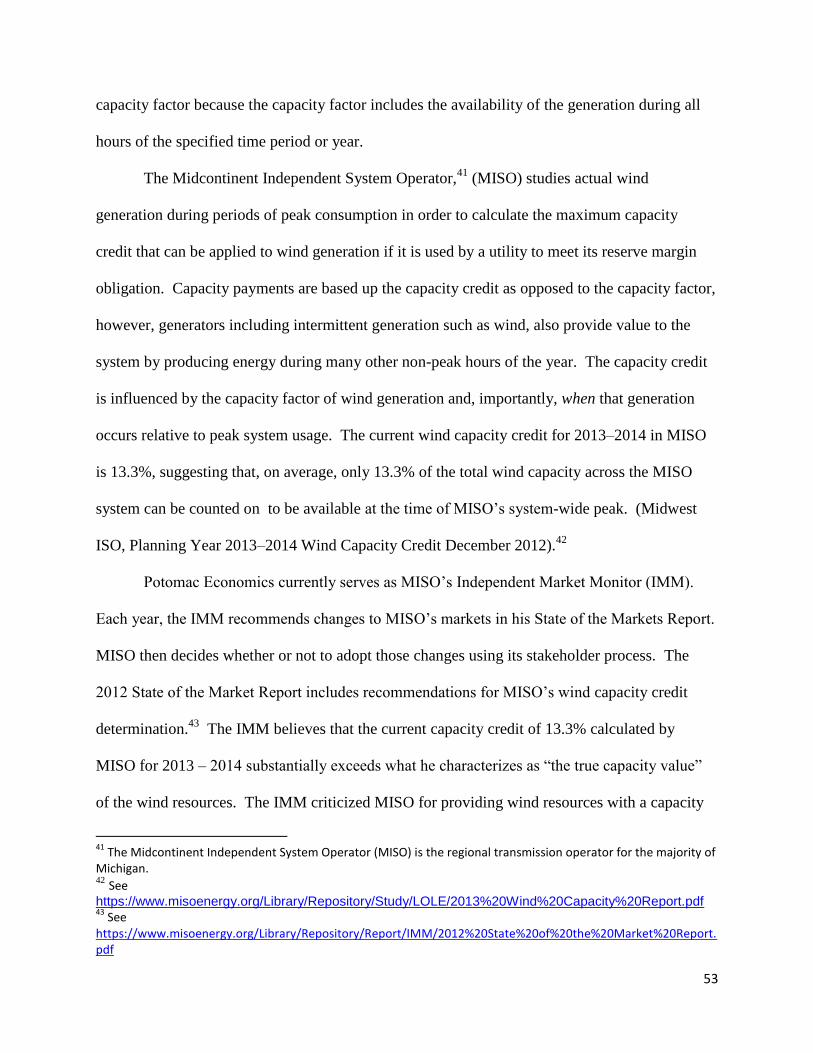
53
capacity factor because the capacity factor includes the availability of the generation during all
hours of the specified time period or year.
The Midcontinent Independent System Operator,41
(MISO) studies actual wind
generation during periods of peak consumption in order to calculate the maximum capacity
credit that can be applied to wind generation if it is used by a utility to meet its reserve margin
obligation. Capacity payments are based up the capacity credit as opposed to the capacity factor,
however, generators including intermittent generation such as wind, also provide value to the
system by producing energy during many other non-peak hours of the year. The capacity credit
is influenced by the capacity factor of wind generation and, importantly, when that generation
occurs relative to peak system usage. The current wind capacity credit for 2013–2014 in MISO
is 13.3%, suggesting that, on average, only 13.3% of the total wind capacity across the MISO
system can be counted on to be available at the time of MISO’s system-wide peak. (Midwest
ISO, Planning Year 2013–2014 Wind Capacity Credit December 2012).42
Potomac Economics currently serves as MISO’s Independent Market Monitor (IMM).
Each year, the IMM recommends changes to MISO’s markets in his State of the Markets Report.
MISO then decides whether or not to adopt those changes using its stakeholder process. The
2012 State of the Market Report includes recommendations for MISO’s wind capacity credit
determination.43
The IMM believes that the current capacity credit of 13.3% calculated by
MISO for 2013 – 2014 substantially exceeds what he characterizes as “the true capacity value”
of the wind resources. The IMM criticized MISO for providing wind resources with a capacity
41
The Midcontinent Independent System Operator (MISO) is the regional transmission operator for the majority of Michigan. 42
See https://www.misoenergy.org/Library/Repository/Study/LOLE/2013%20Wind%20Capacity%20Report.pdf 43
See https://www.misoenergy.org/Library/Repository/Report/IMM/2012%20State%20of%20the%20Market%20Report.pdf

54
credit equal to the mean (average) output of the wind generation during the previous year’s peak.
Instead, the IMM suggests that the capacity credit for wind should be based upon the previous
year’s lowest quartile wind generation output. The IMM’s recommendation for calculating
capacity credits for wind would have resulted in a 2.7% wind capacity credit for 2013 - 2014.
This recommendation is now before MISO and its stakeholders. MISO recently responded and
said that it disagrees with the IMM and stands by its current method (utilizing the previous year’s
mean output at peak). MISO said that its “current methodology accurately reflects expected
output levels during annual peak system conditions.44
”
While intermittent generation typically receives a relatively low capacity credit, other
types of generation such as coal, nuclear, or natural gas may have values in the range of 80–95
percent. The capacity credit given to nuclear and fossil generators is unit-specific and based
upon the individual unit’s historical actual performance taking things like forced outages and de-
rates into account.45
As a technical matter, electricity can be stored for use at a later time, which could
theoretically alleviate intermittency concerns. As a practical matter, however, not much
electricity storage has been developed due to its relatively high cost. Michigan is a leader in one
of the only large storage technologies used, pumped hydro (located in Ludington, MI). Pumped
hydro is essentially an artificial dam, in which water is pumped into the reservoir during times
when power is plentiful, and released later when it is needed. Other technologies are not yet
ready for full implementation due to technology, economic and operational considerations, such
as battery storage and flywheels. If these technologies progress and costs decrease, these
44
https://www.misoenergy.org/_layouts/MISO/ECM/Redirect.aspx?ID=161936 45
See, e.g., graph on slide 7 of the presentation at:
https://www.misoenergy.org/Library/Repository/Meeting%20Material/Stakeholder/SAWG/2009/20091210%20SAWG/20091210%20SAWG%20Wind%20Capacity%20Credit.pdf and Utility answer to Q3.

55
technologies may change the calculations regarding intermittency as well as creating other
benefits for reliability. At this time, however, they are unlikely to be able to be used at enough
scale to influence decision making regarding renewable deployment.
Following the directive of a state law passed in 2010, the California Public Utilities
Commission (CPUC), in October 2013, established an energy storage target of 1,325 MW for
each of the state’s three investor owned utilities and a lesser target of one percent of the annual
2020 peak load for the state’s community choice aggregators and electric service providers. The
CPUC states meeting the targets will encourage optimization of the grid, including peak
reduction, contribution to reliability needs or deferment of transmission and distribution upgrade
investment, expand integration of renewable energy and support the reduction of greenhouse gas
emissions.46
While intermittent, wind output changes tend to be gradual and predictable. When wind
turbines are spread over large areas, it typically takes an hour or more for a significant change in
wind output to occur. Wind energy forecasters can predict what wind output will be hours and
days in advance with a high level of accuracy through the use of advanced computers and
weather models.47
Therefore, while it has required new tools and management, the integration of
intermittent generation has taken place without a loss of reliability to the overall system.48
In summary, the integration of wind and other intermittent renewable energy does require
system changes. All types of generation have unique operating characteristics that affect system
operations and economics. For example, nuclear and coal plants operate most efficiently at a
46
http://docs.cpuc.ca.gov/PublishedDocs/Published/G000/M078/K912/78912194.PDF 47
http://www.awea.org/Issues/Content.aspx?ItemNumber=4544&navItemNumber=680 48
See: Appendix D; MISO’s response letter

56
fairly constant output – i.e., there may be technical and/or economic disincentives49
to turn the
plants “off” and “on.” The generation output may exceed electricity demand at night and in low-
demand seasons (spring/fall). This characteristic provided an impetus to build Ludington storage
to take advantage of that excess generation and store it to be later released at times of higher
usage. This improved the capacity factor for baseload units and improved system reliability.
Generation diversity and related issues that affect reliability are discussed next.
Diversity of Generation/Impact on Reliability (Questions 6, 39)
A number of factors will require adaptability in the electric utility world: aging electric
infrastructure and generation plants, increasing costs for new generation, stricter environmental
controls, water usage, energy density, evolving technologies, and uncertain load growth. In
order to understand the wide range of possible adaptation that may be needed, it is important to
understand the current landscape of energy generation.
America's electric companies rely on a variety of (largely domestic) fuels to generate
electricity. Fuel diversity helps to protect electric companies and their customers from
contingencies such as fuel unavailability, fuel price fluctuations, and changes in regulatory
practices that can drive up the cost of a particular fuel. Fuel diversity also helps to ensure
stability and reliability in electricity supply and strengthens national security.
Some generation types require access to a body of water for cooling purposes.
Renewable fuels use relatively less, and sometimes no water for cooling compared to thermal
technologies, but it is also true that Michigan is not as relatively water constrained as other parts
49
Conventional coal and nuclear plants often take several days to start up after they have been shut down, and there
usually are associated start-up costs.

57
of the country. The proposed Consumers Energy natural gas combined cycle turbine at Thetford
will be air cooled if built.
Energy density is usually defined as how much space a generation source needs to
produce a fixed amount of electricity. Nuclear and fossil sources are regarded as dense, and
renewables are much less dense. In other words, renewables like wind and solar need more
space to produce the same amount of energy. The Public Utilities Regulatory Policy Act of 1978
was enacted to diversify America’s electric generation industry. Under PURPA, utilities are
required to purchase renewable energy at their “avoided cost” from small hydroelectric, landfill
gas and biomass generation qualifying facilities. Michigan’s pre-Act 295 generation portfolio
included about 3% renewables of which a signification portion was derived from PURPA
facilities. Many PURPA contracts were signed in the 1980s and will expire in the coming years.
Current avoided costs are very low making it difficult for these existing facilities to continue
operation. Act 286 included a provision allowing PURPA facilities using wood or solid wood
wastes, to recover, subject to monthly caps, the difference in actual fuel and actual variable
operation and maintenance costs and the amount the generator was paid for electricity production
under contract with an electric provider. A similar provision for other types of PURPA facilities
could be established, but the costs will likely be higher than average costs.
Similarly, Michigan’s fuel generation mix shows a diversity of fuels, although it is more
heavily weighted toward coal and has fewer renewables (even with the RPS) than the national
average. Michigan’s mix, however, is more diverse than many surrounding states. Figure 14
below shows the fuel mix by generation for Midwestern states compared to Michigan and the
United States as a whole.

58
Figure 14: 2012 EIA Generation Fuel Mix for Midwestern States Compared to the US50
That fuel mix has been considered actively in recent years because it is likely to change or at
least require reassessment in the near future: more than half of Michigan’s coal plants are older
than 40 years (built before 1970), nearly a third began operation more than 50 years ago. Many
of these older plants are scheduled to be mothballed or retired in the coming years. For instance,
Consumers Energy estimates that it will need 1,000 MW of new generating capacity due to
suspension of operations at seven of its oldest coal-fueled electric generation plants.
50
http://www.eia.gov/electricity/state/ ; This is based on 2012 data as this is the most recent Energy Information
Agency data available..
0%
10%
20%
30%
40%
50%
60%
70%
80%
90%
100%
MI OH IN IL WI MN US
Wood Fuels
Wind
SolarThermal/PV
Petroleum
Other Gases
OtherBiomass
Other
Nuclear
Natural Gas
Hydroelectric
Geothermal
Coal

59
A diversity of fuels can help the overall reliability of the electric grid. Grid operators are
adept at dealing with variability and uncertainty on the power system. Factories turning large
equipment on and off and millions of people changing their air conditioning and electric heating
use can cause large and often unpredictable changes in the demand for electricity. Large changes
in electricity supply also occur when large generating plants experience sudden outages due to
mechanical or electrical failures and go offline. The loss of a large power plant can happen at
any time, forcing grid operators to have reserve generation available 24/7. Therefore, there are
advantages to having a mix of plants – some that generate steady amounts of power for long
periods of time, some that can turn off and on quickly, and overall, a variety of fuels.
In addition to technical considerations of adaptability, there are considerations of
regulatory adaptability. For example, the federal government has enacted a series of emissions
rules that have required significant investments in current coal plants and significantly increased
the cost of new coal plants. There is also future uncertainty related to climate change and other
current and future environmental laws and regulations. Therefore, a diversity of fuels that
includes renewable resources could help mitigate rate impacts in the future in the event of
increased environmental requirements at the national level. Notwithstanding these benefits,
there are attributes to renewable energy that may decrease its value relative to other sources.
These may include lower capacity value associated with the intermittent power resources,
additional transmission costs, integration costs, and the large land footprint necessary for utility-
scale wind or (to a lesser extent) solar projects. As with the benefits, these factors can be
difficult to quantify and are not typically addressed in economic evaluation of renewable energy
projects. Moreover, even when costs or benefits are estimated, they are likely to change over

60
time given the long lifespan of the investments and uncertainty surrounding energy and
commodity prices and public policy.
Outside of the context of utility-scale projects, renewable energy sources, primarily solar
and (to a lesser extent) wind, as well as combined heat and power projects, can increase overall
reliability due to the “distributed” nature of the technologies. In other words, these technologies
generally feed power directly to the user on-site and do not require a large transmission structure
to operate. Therefore, a large catastrophic weather event is less likely to affect distributed
generation as it could with centralized generation.
By the end of 2013, the MPSC RPS Report projects that approximately 1,200 MW of new
renewable energy capacity will be operating with just over 1,100 MW in Michigan. According
to EIA, during the 2012 – 2016 time period, U.S. planned generator additions are 952 generators
with a net summer capacity of 76,616 MW. Renewables comprise about 35% of the planned
new capacity.51
Ceres, a sustainability leadership advocacy group formed in response to the Exxon
Valdez spill, has identified seven essential strategies for minimizing risk: diversify utility supply
portfolios; utilize robust planning processes; employ transparent ratemaking practices; use
financial and physical hedges; hold utilities accountable; operate in active “legislative mode”;
and reform and reinvent ratemaking policies.52
Planning
Numerous comments were received regarding evaluating the costs and benefits of various
types of generating resources and suggest that high level long-range planning is needed in the
51
http://www.eia.gov/electricity/annual/html/epa_04_05.html 52
Practicing Risk-Aware Electricity Regulation: What Every State Regulator Needs to Know, Ron Binz, Richard
Sedano, Denise Furey & Dan Mullen, A Ceres Report, April 2012
http://www.ceres.org/resources/reports/practicing-risk-aware-electricity-regulation/view0

61
State of Michigan. The Association of Businesses Advocating Tariff Equity commented, “The
State should engage in a robust IRP process before any major new capacity commitments are
made or there are changes in the renewable energy mandates. The key driver in all of these
considerations is whether the State needs new capacity and, given the high Michigan retail rates
that currently exist, how any new capacity additions can help reduce the future retail cost of
electricity in Michigan. Michigan cannot afford to look at the various energy-related issues
“piecemeal” and make decisions on less than comprehensive data.53
”
In order to determine the best mix of options to meet future electric needs, utilities
typically engage in long-range planning activities and consider a variety of supply and energy
management options over a period of ten to twenty years. This process traditionally would
include a detailed forecast of future energy and demand. The plan typically would consider all
generation and demand-side resources available during the planning period. In most cases a
sophisticated computer based planning model would be used to select the optimal mix of future
resources. Other factors that may be considered are state requirements, such as renewable or
energy efficiency standards, transmission constraints, and risks such as variable fuel costs or
different forecasts.
The advantage of a long range plan is that it takes into consideration many factors and
leads to a current view of a least-cost course of action. The utility or planning entity typically
does a thorough review of available options and takes a hard look at the future. The key to a
thorough planning process is the development and analysis of a set of scenarios coupled with
sensitivities surrounding the scenarios that allow the development of a rigorous, least-cost plan
for resource expansion. Typically, consideration would be given to resource persistence in the
53
http://miideas.dtmb.michigan.gov/userimages/accounts/90/908970/panel_upload_25253/COMMENTS-re-Renewable-Energy-of-the-Association-fo-Businesses-Advocating-Tariff-Equity-on-draft-Repo.pdf

62
modeling activity and the selection of resources that provides low-cost solutions under multiple
scenarios.
While long-range planning activities are intended to produce a robust plan regarding
future resource expansion and selection under multiple future scenarios, the process may be long,
drawn out and complex. This complex type of analysis is typically resource intensive with
regards to staff time and other resources and may take a full year to complete. The inputs to the
analysis include several assumptions about the future that may be already outdated when the
long-range plan is finally complete.
Thirty nine of the 50 states have a rule or requirement for some type of long-term
resource planning or procurement, either through statute, or from the direction of the public
service commission. The vast majority of those states require that the utilities look at a 10-20
year period. Most of them require that the plan be updated every 2-3 years. The plans must
consider all feasible supply, demand and transmission options. Some states emphasize the use of
“clean” options such as renewable generation and energy efficiency. There may also be
additional requirements such as modeling a specific number of scenarios, utilizing certain types
of resource cost tests and including defined externalities.54
Long-range planning activities may be required by statute, or may be directed by public
service commissions. Michigan has gone through periods of time in the past when these types of
planning activities were undertaken. While not required by law at the time, on April 20, 1989,
the Michigan Public Service Commission issued a minute action encouraging electric utilities to
prepare integrated resource plans in accordance with pre-determined guidelines and to make
those plans available for public review. The Commission recommended that utilities utilize the
54
A Brief Survey of State Integrated Resource Planning Rules and Requirements, Synapse
Energy Economics Inc., Rachel Wilson & Paul Peterson, April 28, 2011.

63
results of these plans in cases filed with the Commission such as rate and PSCR cases.
Subsequent orders supported this effort. On October 12, 1994, the Commission issued an order
in Case No. U-10574 stating that Michigan utilities should continue to use integrated resource
planning principles. During the mid-1990’s, following a change in the administration, integrated
resource planning in Michigan ceased for a period of time as there was not any requirement in
current statutes directing the activity at that time. While the public review process was not
sustained, the Commission encouraged utilities to evaluate their long term needs and options on
a regular basis. Utilities still incorporate long term planning in their decision making.
In 2004, a statewide long-range planning activity, the Capacity Needs Forum (CNF), was
initiated by the Commission.55
In order to refresh the assumptions made in the CNF, the
statewide long-range planning activity continued. In 2006 and in 2007, the Commission
completed reviews of the future energy needs and available options in Michigan. Numerous
parties participated in these reviews. The 2007 21st Century Energy Plan
56 recommended that
Michigan's future energy needs be met through a combination of renewable resources and the
cleanest generating technology, with significant energy savings achieved by increased energy
efficiency. Many of the recommendations made in the 21st Century Energy Plan were
incorporated into the energy laws passed by the Michigan Legislature in 2008.
Public Act 286 of 2008 includes provisions for utilities to apply for a certificate of need
(CON) for new generation or purchases that meet certain criteria. The current law provides that
an integrated resource plan accompany the application for a CON, should the utility choose to
seek a CON. Beyond the accompaniment of a CON application, there are no requirements in
statute requiring utilities to submit long-range plans to the Commission at this time.
55
http://www.dleg.state.mi.us/mpsc/electric/capacity/cnf/ 56
http://www.dleg.state.mi.us/mpsc/electric/capacity/energyplan/

64
MISO coordinates short and long term planning in its footprint, which consists of a major
portion of the Midwest United States. Advanced modeling and thorough research results in a
plan that helps to ensure reliable and efficient transmission. MISO employs a regional process
that is transparent, coordinated and equitable. Each year, MISO and its members release a
MISO Transmission Expansion Planning Report (MTEP); this report is approved by MISO’s
board of directors. MTEP 2012 takes the planning horizon through 2022. The report also
identifies least cost generation portfolios to meet resource adequacy requirements in the future.
In addition to generation, MISO considers demand response and energy efficiency in its
modeling.57
PJM, the RTO covering the Mid-Atlantic region of the country, including a
southwest portion of Lower Michigan also undertakes a similar planning process for its region.
PJM’s Regional Transmission Expansion Plan (RTEP)58
is a 15-year plan that identifies
transmission system upgrades and enhancements to provide for the operational, economic and
reliability requirements of PJM customers.
Fuel Price and Energy Price Volatility (Questions 3, 4, 6, 18)
Renewable energy proponents often point to the volatility and uncertainty of fuel prices
as rationale to increase reliance on renewable energy. Approximately half of the renewable
resources in Michigan will come from independent power producers who sell their energy to
utilities through purchased power agreements (PPA). These contracts are generally for 20 years
and lock in the price paid by the utility for that period of time. Moreover, the price of renewable
generation does not depend on fuel costs and, therefore, considered to be more predictable. In
comparison, while natural gas prices are expected to continue at fairly low levels, the future
57
MISO website, https://www.misoenergy.org/Planning/Pages/Planning.aspx 58
http://www.pjm.com/planning/rtep-development.aspx

65
curve of natural gas prices is sloped upward, making it difficult to lock in a low price for an
extended period of time. Thus, wind provides a long term fuel contract with known prices that,
when available, can be an attractive alternative to other sources of energy.59
The United States has the largest reserves of coal in the world and is a net exporter of
coal. Coal has been used to produce electricity for over 60 years but the percentage of total
electric generation from coal decreased from 49% in 2007 to 42% in 2011. The cost of
generating electricity from coal has historically been less expensive than using natural gas. This
changed in 2007, when previously untapped shale deposits led to a decrease in the price of
natural gas.60
In Michigan, coal must be transported to the plant. While the cost of coal tends to remain
relatively stable, transportation costs are dependent on market pricing and the cost of diesel fuel,
which is used to power the modes of delivery. The national efforts to reduce the environmental
effects of burning coal will also have an effect on the cost of coal generation.
During the late 1960s, emission concerns about coal plants and stable crude oil prices
resulted in an increase in petroleum generation. Oil price shocks in the 1970s, and the
Powerplant and Industrial Fuel Use Act of 1978 (PIFUA) led generators back to coal use. By
1990, repeal of the PIFUA and deregulation of natural gas resulted in more opportunities for
interchanging petroleum and natural gas in peaker plants. And, more recently, changes in the
production and use of natural gas have seen a heavier reliance on natural gas for electric
generation.61
59
Valuing Renewables as a Long-term Price Hedge, Even in an Era of Low Natural Gas Prices, Mark Bolinger,
Lawrence Berkeley National Laboratory, June 17, 2013 http://www.fbcconferences.com/e/eia/presentations/m-
bolinger.pdf 60
http://www.eia.gov/energy_in_brief/article/role_coal_us.cfm 61
http://www.eia.gov/todayinenergy/detail.cfm?id=7090

66
In 2009, Michigan produced about 148 billion cubic feet (4.2 billion cubic meters) of
natural gas. Most of Michigan's gas production is purchased by Michigan utilities for their
customers, but some is also sold to gas marketing companies that sell gas outside of Michigan.
Natural gas produced in Michigan represents about 15 - 20% of the total gas consumed in
Michigan. Michigan is a net importer of natural gas.62
The recent increase in the generation of electricity by natural gas power plants is a result
of an increase in the supply of natural gas, focus on reducing power plant emissions and short
construction times for natural gas plants. The upsurge in the supply of natural gas is due to gas
production from unconventional sources, such as shale gas and tight gas. Natural gas has much
lower emissions of sulfur dioxide and carbon dioxide than coal. Natural gas plants also have
much shorter construction times than coal plants.63
A recent article discussed the shift from coal to natural gas as a generation fuel source: 64
"Most of the people I know in the electric power industry are building natural
gas" plants, said Jay Apt, a professor of technology at Carnegie Mellon University
in Pittsburgh. That's because of low prices over the last few years and the
relatively low cost of building such plants, compared with coal-fired or nuclear.
But Apt cautions that the trend could stall because the basics of supply and
demand mean that if too many plants embrace cheap gas, it won't stay cheap.
"The surest route to $6 or $8 gas is for everybody to plan on $4 gas," Apt said,
and if prices do rise, coal will again be the most cost-effective fuel. Natural gas is
priced per million BTU.
Apt noted that there was a "huge building boom" in natural gas plants from the
late 1990s to 2004, because utilities thought they would get rich from the
combination of cheap fuel and plants that were highly efficient and relatively
cheap to build. There were predictions that prices would stay low over the long
term, too.
62
http://www.dleg.state.mi.us/mpsc/gas/about1.htm 63
http://www.aep.com/about/IssuesAndPositions/Generation/Technologies/NaturalGas.aspx 64
http://www.huffingtonpost.com/2012/01/16/electric-plants-coal-natural-gas_n_1208875.html

67
But natural gas prices spiked, and the new gas-fired plants around the nation
stayed idle much of the time. That trend was also driven by another irony: The
gas-fired plants are easier to start and stop compared with coal or nuclear, so
many utilities used them just for peak electric demand periods.
In Michigan, fifteen natural gas plants were planned to begin operation around 2004.
Most of those plants were never built due to the increasing price of natural gas. Now, primarily
because of the discovery of new gas supplies and technologies that allow for drilling in places
that could not be accessed before, natural gas plants are again at the forefront. However, natural
gas prices have not been stable and an increase in the cost of natural gas could make these plants
uneconomic.65
Coal inventories at power plants dropped below the monthly five-year average in April
2013, the first time this has happened since December 2011. The decline in stockpiles occurred
as coal burn increased across much of the nation during a winter that was colder than the
previous winter. In addition, rising natural gas prices prompted some gas-fired power plants to
run less and some coal-fired power plants to run more to generate electricity. Total coal
consumption was up 11% in first-quarter 2013, compared to the same period in 2012. Last
spring, when natural gas prices were near ten-year lows, coal consumption for electricity
declined and stockpile levels increased. Coal consumption has since increased, but most power
plants are burning down the record stockpile levels rather than increase purchases of coal.
Because electric power plants appear set to burn down the record coal stocks rather than buy new
supply, the weak domestic market for coal producers is expected to continue throughout 2013.66
Average on-peak, day-ahead wholesale electricity prices rose in every region of the
Lower 48 states in the first-half of 2013 compared to the first-half of 2012. The most important
factor was the rise in the price of natural gas (the marginal fuel for generation in much of the
65
http://www.dleg.state.mi.us/mpsc/electric/restruct/merchantplants.htm 66
http://www.eia.gov/todayinenergy/detail.cfm?id=12151

68
nation) in 2013 compared to 10-year lows in April 2012. However, the increase in power prices
was not uniform across electric markets as regional natural gas supply issues drove larger
increases in the Northeast and Pacific Northwest.67
Average spot natural gas prices at most major trading points increased 40% to 60%
during the first half of 2013 compared to the same period in 2012, as demand for natural gas rose
faster than increases in supply. Price increases were relatively uniform throughout the country,
with the exception of New England and New York, where supply constraints caused spot prices
to spike when demand peaked this winter. Price differences between Henry Hub and most
western trading hubs averaged less than 10 cents per million British thermal units (MMBtu).68
Grid Integration (Question 6, 25, 35, 37)
The function of managing the reliability of Michigan’s electric system is a complex
activity spread across a number of entities. The reliability of the distribution system is the
responsibility of the individual utility physically providing service to the customer (in other
words, this will typically be the entity to which the customer writes their monthly check). The
reliability of the transmission portion of the bulk power system primarily falls to the transmission
operator. The reliability of the generation portion of the bulk power system is managed by the
generator owners, which in some cases are unregulated private entities. The acquisition and
maintenance of adequate energy and capacity to meet the customer’s energy and capacity
requirements is the responsibility of the “Load Serving Entity” or LSE.
The Federal Energy Regulatory Commission (FERC) regulates interstate transmission
and wholesale sales of electricity. Regulation of the bulk power system is the responsibility of
67
http://www.eia.gov/todayinenergy/detail.cfm?id=12211 68
http://www.eia.gov/todayinenergy/detail.cfm?id=12191

69
the North American Electric Reliability Corporation (NERC) a not-for-profit entity (subject to
oversight by the FERC) which ensures the reliability of the bulk power system through the
development and enforcement of reliability standards.
Entities in Michigan are members of regional transmission operators or RTOs which
operate under FERC tariffs and provide reliability coordination for the bulk power system
including an energy and ancillary services market and regional transmission planning. MISO is
responsible for bulk power system reliability and day to day system operation for the majority of
Michigan while PJM has similar responsibilities for a portion of Southwest Michigan.
The Michigan Public Service Commission regulates the reliability of the distribution
system through its rate making and order issuing process and through the promulgation and
enforcement of various rules for the regulated utilities. The reliability of the member-regulated
cooperatives and the municipal utilities is the responsibility of their various boards. The
Commission participates with FERC, NERC and the RTOs in the process of ensuring the
reliability of the Bulk Power System. The Commission also is responsible for the certificate of
need process for the regulated entities.
Renewable energy resources interact with ISOs or RTOs when they interconnect with the
electric grid system. Because generators operate at high voltage levels, connecting to the
transmission system is necessary. Generators must meet requirements established by the
regional transmission operator. Regional transmission operators also oversee the energy markets
in many areas of the United States, including Michigan. Markets include wholesale energy
markets, capacity markets and ancillary services markets. Most generators, including renewable
energy resources, are actively pursuing participation in some or all of these markets.

70
Integrating renewable energy into the electric grid is the primary responsibility of
ISOs/RTOs. In Michigan, the Midcontinent Independent System Operator (MISO) oversees
most of the state. (AEP, which includes Indiana Michigan Power Co., is a member of PJM LLC.)
There have been questions and concerns about how renewable resources would interconnect with
the electric grid and how some of the unique aspects of renewable energy could impact the
electric grid. But ISOs, including MISO, have been working to adjust their process and
protocols to facilitate the inclusion of renewable energy resources into the generation mix.
MISO has taken several actions over the last few years to facilitate the integration of
renewable energy. In 2008, MISO made its interconnection queue process more consistent and
predictable for new generators, which have largely been wind resources. This provides
developers with more certainty as they seek to finance and build their projects. MISO developed
a multi-value project category for transmission projects that meet reliability needs, provide
economic benefits and enable public policy goals such as meeting a state-mandated RPS. A new
resource designation, Dispatchable Intermittent Resources (DIR), was created by MISO to allow
for transparent, timely and precise constraint mitigation, to provide flexibility during minimum
load situations and to reduce the need for manual curtailments. Wind owners are able to sell
more energy into the MISO market, thus providing buyers with more options for their customers.
Some types of renewable resources are considered to be intermittent because they are not
able to run consistently due to needing a resource that is not always available such as wind or
sun. This aspect of renewable energy has caused some entities to be concerned about how this
will affect the reliability of the electric system. Reliability is a primary concern of the regional
transmission operators. MISO indicates that most of the renewable resource generation on its
system is wind generation. It is MISO’s finding that wind has not been a factor in any system-

71
wide reliability problems. Contingency reserves have never been deployed due to a drop in wind
output. The increase in wind has presented localized congestion issues, which have been
effectively managed by MISO and have not resulted in any significant reliability concerns.
Planned transmission projects such as the Michigan Thumb Loop Expansion are expected to
resolve these constraints.
Future growth in renewable resources, particularly wind resources, on the MISO system
will be addressed by the multi-value project portfolio that was developed by MISO. The
portfolio includes 17 projects across the MISO footprint that are designed to work together to
give maximum value. The portfolio will relieve congestion, decrease operating reserve
requirements, lower planning reserve requirements, lessen transmission line losses and decrease
future transmission investment. MISO projects benefit to cost ratios of 1:7 to 3:0 for the Lower
Peninsula of Michigan and 2:0 to 3:3 for Michigan’s Upper Peninsula and eastern Wisconsin.69
MISO declared DTE’s Harbor Beach plant an SSR (system support resource) for reliability and
DTE is receiving SSR payments to keep the 95 MW Harbor Beach coal plant operational for
Thumb area reliability needs until the Thumb Loop Expansion transmission line is operational.
An additional benefit of the Michigan Thumb Loop Expansion, beyond interconnecting wind
energy resources, is that it is considered to be the transmission solution to reliability concerns in
the Thumb area. Because the Harbor Beach coal plant will no longer be required for reliability
purposes when the transmission project is operational, the SSR payments will end which will
result in a reduction to rates for Michigan’s customers.70
MISO’s DIR became mandatory on March 1, 2013 and all wind farms in MISO, except
for some older or smaller ones, registered and became DIRs. As a result, 78% are now
69
See Appendix D: MISO’s response to Valerie Brader’s Letter. 70
See http://elibrary.ferc.gov/idmws/doc_info.asp?document_id=14140655

72
dispatchable by MISO. Manual curtailment of wind has decreased with the DIR tariff allowing
more efficient dispatch of resources in the MISO market. The impact of dispatching renewable
energy on rates in Michigan has not been quantified, but in theory MISO's DIR tariff may lessen
the integration costs attributable to new intermittent resources (i.e., wind) in Michigan's electric
rates. (utilities answer to Q35)
Questions 6, 35, and 37` concern the impact of renewables and distributed generation on
reliability, cost and MISO dispatch operations. Comments suggest that incremental cost of
transmission/ operational impacts of renewables is in the order of $2-$9 per MWh with cited
references in the $4.11-$5 range, and that the benefits of these incremental investments more
than outweigh costs. The MISO Dispatchable Intermittent Resource Tariff is viewed as effective
in reducing the amount of manual or automatic curtailment of wind, and several studies are cited
that provide approaches for estimating cost of intermittency, and actual cost impact in different
regions of the country (Illinois) or the world (UK). ICCUSA comments suggest that wind
intermittency is a major cost and reliability issue, but these comments are contradicted by
references provided in comments from Union of Concerned Scientists, the DTE/ CMS/ MEGA
joint comments, the Michigan Environmental Council and MISO’s July 1, Answers to Questions
(Attached as Appendix D). Examples of references include:
Midwest ISO Report describes the first package of 17 Multi-Value Projects as “having
benefits in excess of the portfolio cost under all scenarios studied. These benefits are
spread throughout the system, and each zone receives benefits of at least 1.6 and up to 2.8
times the costs it incurs.” MISO Transmission Expansion Plan 2011, page 1. And an
NREL Wind reference report concludes from a scenario where 20% of the Eastern
Interconnect electric energy is supplied from wind resources “that although significant

73
costs, challenges, and impacts are associated with a 20% wind scenario, substantial
benefits can be shown to overcome the costs”.
Wind generation has increased by 30 percent to 3 GW throughout the MISO footprint.
MISO’s energy market pricing, combined with tax incentives, allowed wind resources to set
market prices as low as negative $20.00 per MWh in certain circumstances. Michigan’s wind
generation continues to contribute to MISO’s overall wind capacity with 986 MW of operational
wind generation currently. This is expected to increase to over 1,000 MW of operational wind
generation in the state by the end of 2013. (2013 MPSC RPS Report)
Recently, PJM conducted an analysis of the potential impact of adding a significant
amount of renewable generation within its footprint and released key findings from its PRIS
(PJM Renewable Integration Study).71
The study found that even at 30% penetration, results
indicate that the PJM system could handle the additional renewable integration with sufficient
added reserves and transmission build out.
Local Impact (Question 13)
Section 29 of Public Act 295 (PA 295) requires that most of the renewable energy needed
to meet the requirements of the act be constructed and/or sourced from within Michigan. The
MPSC Staff submitted that Michigan companies like Barton Malow, Aristeo, and Nova
Consultants have been selected to construct and provide parts for utility scale wind farms and
solar PV projects. A coal plant in the Upper Peninsula was converted to use locally sourced
biomass fuel. There are manufacturing companies located in Michigan that have obtained
certifications to provide utility-scale wind towers and turbine blades. A joint response from the
71
http://www.pjm.com/~/media/committees-groups/committees/mic/20131028-impacts/20131028-pjm-renewable-integration-study.ashx

74
Michigan utilities states that this requirement has yielded economic and environmental benefits
to the state.
1. The renewable energy investments of Consumers Energy and DTE Energy to date
have created approximately 2,500 jobs, the large majority of which are temporary
construction jobs.
2. Communities hosting renewable energy facilities receive increased revenues in
industrial personal property taxes. These revenues benefit, among other entities,
schools and libraries. Ongoing royalty payments to project participants also
contribute additional community benefits and economic activity.
3. Renewable energy manufacturers, suppliers, and service providers have developed in
Michigan and created jobs to meet the growing demand for renewable energy. It is
estimated that there are over 200 companies now in Michigan's renewable energy
supply chain.
4. The owned and contracted renewable energy projects of Consumers Energy and DTE
Energy, once fully operational, will displace 4-5 million tons of CO2 annually.
5. These economic benefits do not represent a "net" calculation-that is, they do not
factor in the jobs and economic benefits that would have otherwise been created if
these expenditures had been made elsewhere in Michigan or saved by utility
customers. Any economic benefit resulting from Michigan's current renewable
portfolio standard (RPS) does not imply that an increase in the target would result in
comparable benefits in the future.
While several comments were received outlining benefits to Michigan of the in-state
requirement, as previously discussed in this report, many other commenters found the in-state
requirement to be restrictive. Some commented that relaxing Michigan’s locational requirement
would allow cheaper renewable generation from the Northern Plains states to qualify to meet
Michigan’s RPS. However, data was not submitted detailing the amount of savings that could be
expected from sourcing wind from the west.

75
Net Metering Basics (Question 28)
Net metering enables customers to develop on-site renewable energy electric generation
projects to meet some or all of their electric energy needs and reduce their electric bills. Net
metering customers may install an on-site renewable energy electric generation project, such as a
wind turbine or solar photovoltaic panels. The project must be sized small enough so that it
produces no more than what is needed to meet a customer's electric energy needs. The customer
will be able to reduce its electricity purchases from the electric provider by using its generated
electricity "behind the meter". Any excess energy generated by the customer’s net metering
project is sent to the electric provider’s distribution system and the customer receives net
metering credits. Figure 15 illustrates net metering energy flows between the customer’s
generator, the customer’s on-site usage and the electric provider’s distribution system.
Figure 15: Net Metering Description
Michigan is one of 42 states with some form of a net metering program. Its current statewide net
metering program was enacted under Part 5 of Act 295 and administered under the MPSC’s
Electric Interconnection & Net Metering Standards. The program is offered by all alternative
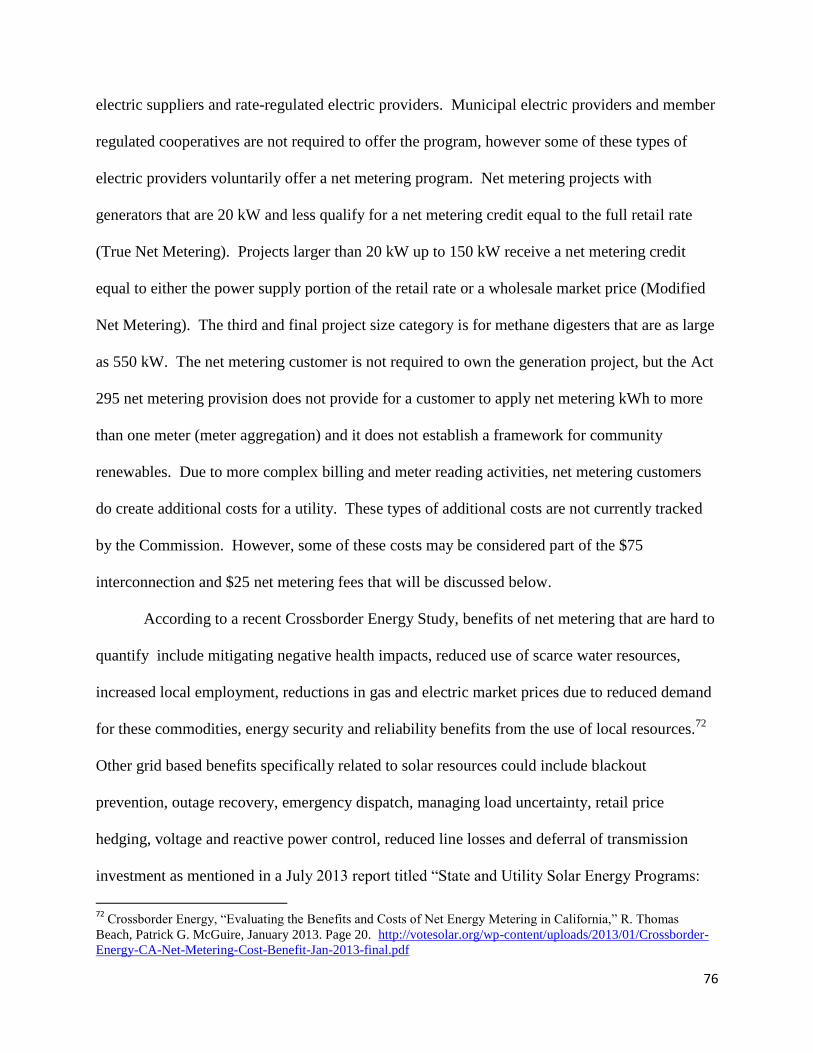
76
electric suppliers and rate-regulated electric providers. Municipal electric providers and member
regulated cooperatives are not required to offer the program, however some of these types of
electric providers voluntarily offer a net metering program. Net metering projects with
generators that are 20 kW and less qualify for a net metering credit equal to the full retail rate
(True Net Metering). Projects larger than 20 kW up to 150 kW receive a net metering credit
equal to either the power supply portion of the retail rate or a wholesale market price (Modified
Net Metering). The third and final project size category is for methane digesters that are as large
as 550 kW. The net metering customer is not required to own the generation project, but the Act
295 net metering provision does not provide for a customer to apply net metering kWh to more
than one meter (meter aggregation) and it does not establish a framework for community
renewables. Due to more complex billing and meter reading activities, net metering customers
do create additional costs for a utility. These types of additional costs are not currently tracked
by the Commission. However, some of these costs may be considered part of the $75
interconnection and $25 net metering fees that will be discussed below.
According to a recent Crossborder Energy Study, benefits of net metering that are hard to
quantify include mitigating negative health impacts, reduced use of scarce water resources,
increased local employment, reductions in gas and electric market prices due to reduced demand
for these commodities, energy security and reliability benefits from the use of local resources.72
Other grid based benefits specifically related to solar resources could include blackout
prevention, outage recovery, emergency dispatch, managing load uncertainty, retail price
hedging, voltage and reactive power control, reduced line losses and deferral of transmission
investment as mentioned in a July 2013 report titled “State and Utility Solar Energy Programs:
72
Crossborder Energy, “Evaluating the Benefits and Costs of Net Energy Metering in California,” R. Thomas
Beach, Patrick G. McGuire, January 2013. Page 20. http://votesolar.org/wp-content/uploads/2013/01/Crossborder-
Energy-CA-Net-Metering-Cost-Benefit-Jan-2013-final.pdf

77
Recommended Approaches for Growing Markets” issued by the National Regulatory Research
Institute (NRRI) includes a chart summarizing net metering and value of solar studies.73
These
benefits can all contribute to downward pressure on wholesale energy prices.
A net metering customer’s bill, under a True Net Metering billing arrangement, is based
on net usage for the month. A kilowatt hour (kWh) generated by the customer’s net metering
project is exactly equivalent to a kWh delivered by the utility. When the customer’s net
metering project is sending excess generation to the grid, the excess kWh are “banked” as net
metering credits for later usage by the customer. Modified Net Metering bills charge customers
the full retail rate for all energy delivered to the customer and provide a credit equal to the power
supply portion of the retail rate or a wholesale rate. For methane digester projects that are larger
than 150 kW, the customer pays distribution charges for each kWh they generate and use on site.
The value of the banked net metering credits is determined by the customer’s utility rate
schedule and whether the customer participates in True Net Metering or Modifed Net Metering.
There are three ways the customer’s bill is reduced: 1) Utility purchases are reduced by
generating and using kWh on-site, 2) Customer generates more kWh than needed at any instant
during the month which are delivered to the utility, 3) KWh credits from previous month’s
excess generation are applied to the bill.
Some electric providers have voiced concern that net metering transfers electric system
costs from participating to non-participating ratepayers. For True Net Metering customers, the
net metering credit includes the variable components (charges billed on a per kWh basis) for
both Energy and Delivery Charges. Under the net metering program, the customer always pays
the monthly System Access Charge. The credit is less for Modified Net Metering because
distribution charges are not included and even lower for customers on a demand-based rate
73
http://www.nrri.org/documents/317330/f1c96d7d-83ac-4fe3-bf0f-ef8ed343efe8

78
schedule because those customers pay more of their bill through a demand charge and less in the
per kWh charge. Therefore, these net metering customers still contribute toward usage of the
electric grid – even if the customer offsets all or more of their monthly kWh usage.
Rates charged by electric providers are established in general rate cases under the
ratemaking authority of the MPSC. 2008 PA 286 requires that rates must be equal to the cost of
serving each customer class - residential, commercial and industrial. Each rate class’s
contribution to the utility’s peak usage is one factor used to determine cost of service at the
customer class level. After costs are allocated to each rate class, individual rate schedules are
developed for different types of customers within the rate class.
Rates are designed to recover costs and encourage desired electricity usage characteristics
including conservation and reduced on-peak usage. Table 7 describes some basic rate schedules
for Consumers Energy and shows for different groups of customers the net metering credit and
the different charges that are combined to make their total rates.

79
Table 7: Utility Rate Schedule Example
Utility Rate Schedule Example
Energy Charges
Delivery Charges
Rate
Schedule
Net
Metering
Credit
Capacity
Charge
Energy
Charge
Power
Supply
Cost
Recovery
Factor
System
Access
Charge
Capacity
Charge
Distribution
Charge
$ per kWh $ per kW $ per kWh $ per kWh
$ per
Month $ per kW $ per kWh
Residential
RS $0.1295 NA $0.0838 $0.0019
$7 NA $0.0438
Secondary
GS - energy
only
$0.1341
(Modified
NM Credit
= $0.0971
or
wholesale)
NA $0.0952 $0.0019
$20 NA $0.0370
Secondary
GSD -
demand
$0.108
(Modified
NM Credit
= $0.071 or
wholesale)
$9 $0.0691 $0.0019
$30 $1 $0.0267
Primary GP
- energy
only
Modified
NM Credit
= $0.088 or
wholesale
NA $0.0861 $0.0019
$50 NA $0.0136
Based on Consumers Energy’s rate schedules.
To simplify the rate information, summer/winter price differentials and higher cost rate blocks for high usage
customers are averaged together and surcharges are not reflected in the rates.
Typically, for residential and small commercial customers, utility costs are recovered
using a fixed monthly system access charge (sometimes called customer charge) and a per kWh
rate that is applied to each kWh used by the customer. Larger customers may have a demand
charge. Fixed costs include costs that are incurred by the utility even if the customer does not
use any kWh during the month. These types of costs include the distribution system wires, poles
and substations, utility administrative costs, meter reading, billing system, customer call center,
capacity charges the utility pays under power purchase contracts, company-owned generation
80
plant costs. If all fixed costs were allocated to customers using a system access charge or
demand charge and only variable costs (coal and natural gas fuel costs for example) were
recovered using a per kWh charge, the system access charge/demand charge would be
significantly higher and the per kWh charge would be significantly lower. One of the key
reasons that a rate schedule would be designed to recover fixed costs using a variable charge is to
promote conservation. A higher per kWh charge is expected to encourage customers to use less
energy to lower their bills.
Within each rate class, there are many factors that influence the cost to serve each
customer: high electricity usage (air conditioning), number of miles from the substation,
customer density on the distribution system and the type of distribution equipment needed to
provide power to larger customers, whether electricity usage is constant or varies. It is not
possible to design rate schedules to precisely recover costs from every customer within a rate
class that exactly match the cost to serve each individual customer. Instead, costs are averaged
and spread over all customers in the rate class with some variations in rate design for more
precise recovery.
The cross-ratepayer subsidy question is raised because when a customer reduces monthly
kWh usage, they avoid paying some of the utility’s fixed costs that the rate design for the
customer’s rate schedule has placed in the monthly kWh charge. This doesn’t impact other
customers until the utility files for recovery of these costs in a rate case. The rate design
establishes how much of the fixed costs will be recovered in the per kWh charge for a particular
rate schedule. The new fixed cost amount is divided by the expected number of kWh which has
been reduced because a net metering customer purchases less kWh from the utility.

81
Participation in a net metering program in which the customer generates some or all of
their monthly kWh usage is one of several reasons a customer might purchase less kWh from the
utility. Other reasons for less customer kWh consumption include vacations, conservation,
energy efficiency, and fuel switching from an electric appliance to another fuel such as natural
gas. Customers within a rate class that reduce on-peak kWh usage could contribute to less costs
being allocated to the rate class since costs are allocated based on each customer class’s
contribution to the utility’s peak usage periods. In the long term, lower on-peak usage will lead
to lower fixed cost due to a decreased need for production plant. A net metering customer with a
solar project would be expected to reduce the rate class peak. When a non-net metering
customer reduces kWh usage, cross-subsidy issues are not typically raised. Reducing energy
usage through energy efficiency and conservation is looked at favorably by policy makers.
However, some utilities have developed seasonal residential rates to recover more costs in the
system access charge if seasonal customers make up a significant part of the customer base.
While Michigan’s current net metering program is not large enough to have a significant impact
on utility rates, the program is continuing to grow. Solar net metering projects are 87% of the
total.
Table 8 shows the key parameters and current participation information for Michigan’s
net metering program based on the MPSC’s August 2013 Net Metering &Solar Pilot Program
Report.

82
Table 8: Michigan’s Net Metering Program
Maximum
Program
Size As a %
of Peak Load
Net Metering Credit Number of
Customers
Participating
Projects
MW
Small
Projects up to
20 kW
0.5% Full Retail Rate
(per kWh charges) 1,310 8
Projects >20
kW and up to
150 kW
0.25% Power supply component
of retail rate or wholesale 19 1
Methane
Digesters up
to 550 kW
0.25%
Power supply component
of retail rate or wholesale
(customer must pay a
standby rate)
1 0.5
Net metering project size is limited to no more than annual kWh usage or maximum demand in
kW during the previous 12-month period.
Net metering excess generation rolls over month to month, indefinitely.
Renewable energy credits belong to the customer.
One option that may be used to address the cross subsidy concern is to limit the total size
of the net metering program and the size of eligible generators. The net metering program
credits net metering excess generation at the full per kWh component of the retail rate which
includes both energy and delivery charges. Table 7 shows that the residential customer net
metering credit is about 13 cents per kWh.
A draft white paper by the National Renewable Energy Laboratory (NREL) found that the
value of solar in Michigan was 13.8 cents per kWh.74
The study considered seven main
components of solar value:
Energy and Generation
Capacity
Transmission and Distribution
Loss Savings
Reactive Power Support
74
White Paper: The Value of Grid-Connected Photovoltaics in Michigan, Preliminary Draft, January 2012, Sean
Ong. http://www.michigan.gov/documents/mpsc/120123_PVvaluation_MI_394661_7.pdf

83
Environmental Benefits
Other (includes hedge value, disaster recovery)
Recent studies evaluating cross subsidy concerns related to net metering programs in other states
have compared the value of solar to the net metering credit. The “State and Utility Solar Energy
Programs: Recommended Approaches for Growing Markets” includes a chart summarizing net
metering and value of solar studies.75
The chart highlights the many factors that must be
considered to fully evaluate net metering and the value of solar considering its unique generation
characteristics such as coincidence with peak-demand times. Determining an updated value of
solar for Michigan would provide additional information to assist in evaluating possible changes
to the net metering program. The Crossborder Energy study compared the amount of the net
metering credit to the value of solar. 76
For rate schedules where the net metering credit was less
than the value of solar, net metering was considered to provide a benefit to all ratepayers and
some researchers characterize this as a cross subsidy from net metering participants to non-
participants. A value of solar analysis could be performed for Michigan’s net metering program.
Net Metering Program Changes (Question 28)
The net metering question on the Ensuring Michigan’s Future website asked for
comments on how small and large-scale renewable projects are handled by other states and about
policies to encourage community renewables and meter aggregation.
75
http://nrri.org/research-papers/-
/document_library_display/3stN/view/0/7627?_110_INSTANCE_3stN_redirect=http://communities.nrri.org/home;j
sessionid=F70B19EFF7321BBF352A0EFF7D96FE31?p_p_id=nrrilatestresearch_WAR_nrrilatestresearchportlet_I
NSTANCE_F9Le&p_p_lifecycle=0&p_p_state=normal&p_p_mode=view&p_p_col_id=column-
2&p_p_col_pos=1&p_p_col_count=4 76
Crossborder Energy, “Evaluating the Benefits and Costs of Net Energy Metering in California,” R. Thomas
Beach, Patrick G. McGuire, January 2013. http://votesolar.org/wp-content/uploads/2013/01/Crossborder-Energy-
CA-Net-Metering-Cost-Benefit-Jan-2013-final.pdf

84
The design simplicity of net metering for small generators is a benefit and could be
considered for larger projects. For residential and commercial customers without a demand
charge, the net metering credits are approximately 13 cents. The net metering credits for
customers on large usage rate schedules are lower because rate schedules tend to be designed to
collect more costs in system access and demand charges. Because of this rate design element
where the net metering credit is less for larger generators, there may not be any cross subsidy and
full retail rate net metering may be a more accurate value of the generation. In cases where the
net metering credit is less than a value of solar (or other type of renewable generation) that
would be determined in the future, a discussion should be held to determine the appropriate
accounting methodology and whether there is a cross subsidy issue going either way between net
metering participants and non-participants.
The NRRI study found that 16 states offer some kind of group net metering provisions.
Under a recent Michigan Energy Office Grant, the Great Lakes Renewable Energy Association
studied community solar and prepared “Feasibility of Community Solar in Michigan: A
Guidebook for Community Solar” which will be issued in September 2013. A draft of the report
defines Community Solar:
Under a Community Solar program, the actual generation of renewable energy
does not occur at the customer’s home or business site. Instead, the customer
subscribes to a portion of a shared renewable energy facility (much like a resident
may invest in a community garden) located elsewhere in the community and the
power generated results in each subscriber receiving their portion of the benefit
based on their investment.
It has lots of names; community based renewable energy, solar gardens, shared
solar, virtual net-metering, community shared solar gardens, and more.
There are 14 states with Community Solar projects – including Michigan. Cherryland
Electric Cooperative and Traverse City Light and Power are the first electric providers in

85
Michigan to offer a joint community solar program – Solar Up North (SUN) Alliance Program.
The framework for this program comes from the energy optimization standard of Act 295 and
not net metering or the renewable energy standard. Cherryland Electric Cooperative members
and Traverse City Light and Power customers can purchase solar shares for a one time
investment of $470.00 each. The participants receive a $75.00 Energy Optimization rebate per
panel. The electric providers use the wholesale electric market prices to determine the amount of
monthly bill credit to provide to the participants. It is estimated that the credit will be an average
of $2.00 per month. This amount will be based on total monthly array output and will vary based
on weather conditions. The Community Solar program has been very successful initially and is
continuing to grow.
Back-up Provisions (Questions 25, 26, 27)
Questions 25, 26, and 27 asked whether Michigan or other jurisdictions included
incentives for dispatchable renewables, energy storage or flexible fast ramping non-renewable
generation as part of or a complement to the renewable or clean energy standard. The majority of
the comments in response to these questions treated all three of these technologies as grid
stabilizing technologies to compensate for increased renewables, and provided a number of
studies that indicate that these technologies are probably not necessary.
UCS refers to an ISO/RTO Variable Energy Resource (VER) White Paper from NREL
from August 2011 that draws the primary conclusions that “integrating renewable
resources is challenging due to the intermittent nature of the fuel source. However ISOs
and RTOs are working towards meeting these challenges by developing and
implementing tools such as forecasting methodologies and services such as incorporating

86
VERs into the bidding and dispatch process and developing additional product offerings
in the ancillary services markets which will help integrate these resources effectively and
efficiently into both system operations and wholesale markets.” The white paper
specifically concludes specialized technologies are not necessary, and that forecasting
and including renewables more broadly into the scheduling protocol will enable
ISO/RTOs to effectively manage grid operations with intermittent renewables.
CMS comments “In 2010, the Independent Market Monitor (IMM), the independent
entity responsible for assessing the competitive performance of the Midwest Energy
Markets administered by Midwest ISO, recommended a ramp capability product be
introduced by Midwest ISO to address the volatility of renewable resources. The ramp
capability product consists of establishing ramp capability targets along with economic
values for the ramp capability (e.g., a ramp capability demand curve). Midwest ISO
agreed with the IMM’s concept and has been working on a conceptual design. The
current schedule calls for conceptual design to be completed by the second quarter of
2013”. This comment suggests that defining ramp capability product and demand curve
will provide sufficient option for MISO control so that specific requirements for ramping
technologies, energy storage, or dispatchable renewables are not necessary.
In a letter from MISO responding to questions, (Appendix D), MISO explains that
contingency reserves have never been deployed due to a drop in wind output. MISO does
not believe the level of fast-ramping generation in our footprint is currently a driver of
significant operational issues, but is working with stakeholders on exploring this issue
and potential solutions.

87
For energy storage, DTE/CMS/MEGA submitted comments that seven states, including
Michigan, consider certain types of energy storage technologies eligible to meet their
Renewable Portfolio Standard (RPS) requirements: California, Maine, Massachusetts,
Michigan, Montana, Ohio and Pennsylvania. Among the seven states, California, Maine,
Michigan and Pennsylvania limit the eligible energy storage technology to pumped hydro
storage; Massachusetts limits the eligible technology to flywheel storage (an economic
policy priority); Montana limits the technology to compressed air storage; and Ohio
permits any storage technology that promotes the better utilization of a renewable energy
resource that primarily generates during off peak periods.
NREL white paper "The Role of Energy Storage with Renewable Electricity Generation"
provides a review of energy storage options and concludes “the question (of energy
storage) is an economic issue: It involves the integration costs of variable generation and
the amount of various storage or other enabling technologies that are economically viable
in a future with high penetrations of variable generation. To date, integration studies of
wind to about 20% on an energy basis have found that the grid can accommodate a
substantial increase in variable generation without the need for energy storage, but it will
require changes in operational practices, such as sharing of generation resources and
loads over larger areas. Beyond this level, the impacts and costs are less clear, but 30% or
more appears feasible with the introduction of “low-cost” flexibility options such as
greater use of demand response.”
MISO Energy Storage Study Phase 1 Report “has allowed MISO to become familiar with
challenges inherent in modeling energy storage technology in a complex nodal market
with an ASM. The study group has gained a good understanding about storage modeling

88
using EGEAS, which is the primary MISO tool for transmission resource planning. The
study results demonstrate that there is economic potential for energy storage in the MISO
footprint. Benefits were observed in cases using both EGEAS and PLEXOS. These
benefits will be explored in greater depth during Phase 2.” And, per UCS comments, a
July 2011 review by MISO staff Ramp Capability for Load Following in the MISO
Markets provides a summary of the market’s ability to provide the ramping capability
associated with growing wind energy on the system. Per UCS comments, “Where a large
concentration of wind development creates challenges for balancing, and curtailments are
used, a more common solution has been to increase the transmission in the area. This
allows the export of wind energy, and the import of additional reserves that provide grid
operators the balance of power they need to maintain system reliability.” Per National
Renewable Energy Laboratory’s Renewable Electricity Futures Study, “there is an
expectation that at the level of 80 percent renewable energy in the year 2050, a moderate
amount of energy storage will be economic and useful”.
There is one example of a state, Massachusetts, including storage in a clean energy
standard that includes resources other than renewable resources. Massachusetts’
Alternative Energy Portfolio Standard includes flywheel energy storage along with
alternative technologies such as fossil fuel gasification with capture and permanent
sequestration of carbon dioxide, and combined heat and power. To address the challenge
of describing the equivalent energy benefits that come from a technology that is
providing capacity, the Massachusetts manufacturer of flywheel storage successfully
promoted a formula to make an estimate of the benefits of energy passing in and out of
the storage, based on the expected use of flywheels for short-term balancing of supply

89
and demand. Assumptions about the intended use of new storage are one of the key
factors for defining the benefits of new storage investment.
UCS comments estimate that the impact of the variability introduced by intermittent
renewables appears to be approximately half a cent per kilowatt-hour of wind energy.
And additional transmission costs needed to increase wind generation to 20-30 percent of
electricity use in the Eastern half the country by 2024 would be 2-5 percent of total
annual costs (EnerNex 2010). However, the study also showed that most or all of the
additional transmission and integration costs would be offset by lower costs for operating
coal and natural gas plants.
Electric Choice/ Retail markets/ REC markets (Questions 30, 31, 40, 15)
In general, comments indicate that electric choice and requirements for renewables are
compatible, and there is little difference in the magnitude of the renewable standard between
jurisdictions with choice and those without retail choice. The average renewable standard for
retail choice states is 22.4% vs. 21.1% for states without retail choice. Similarly, there seems to
be no difference in renewables standard compliance between retail choice states and those
without retail choice. Michigan law is consistent with other jurisdictions with retail choice in
requiring all energy providers to comply with the same renewable requirements and establishing
Renewable Energy Certificate (REC) Systems to issue, track, and enable retirement and trading
of RECs. All 15 jurisdictions with retail choice have renewable standards, and the remaining 15
jurisdictions with renewable standards do not allow retail choice. There is some debate about the
cost impact and ultimate market fairness for Alternative Energy Suppliers that meet their
renewable obligation by purchasing RECs and, according to The MPSC’s 2012 RPS Report,

90
have “incurred little or no costs associated with complying with the statute.” Utilities are
meeting their obligation through purchase power agreements, owning and operating renewable
facilities and buying RECs and say that “third parties can benefit by buying cheap renewable
energy credits generated by Michigan utilities.” Utilities comment that “the limit in the level of
deregulation in Michigan (the 10% cap) has made it possible for the state’s utilities to be
confident that the significant investments made in renewable energy will serve the needs of the
state and its customers fairly,” while major customers in Michigan comment that renewable
standards, when combined with caps on retail choice, limit utilities and/ or retail customers from
accessing lowest cost supply, though these comments do not include supporting data from
Michigan or other jurisdictions.
How Much Renewable Energy is Available Under Current Surcharge Limits
(Questions 8, 16, 38)
Since the implementation of Act 295 in 2008, there has been a consistent and
considerable decline in renewable energy prices as seen in the figure below. Early contracts for
wind were well above $100 per MWh on a levelized basis, while the most recent contracts filed
with the Michigan Public Service Commission have been in the $49 per MWh to $59 per MWh
range. The contract prices are shown on Figure 16.

91
Figure 16: Levelized Cost of MPSC Approved Contracts Over Time77
These cost decreases have led to significant reductions in electric provider’s customer
surcharges as the declining prices have created decreased pressure on revenue requirements.
Section 45 (2) of Act 295 provides that electric providers will recover incremental costs of
compliance with the Act via surcharges applied to each customer’s meter on a monthly basis.
Act 295 states that surcharges are not to exceed: $3.00 per month per residential customer meter;
$16.58 per month per commercial secondary customer meter; and $187.50 per month per
commercial primary or industrial customer meter.
As of the filing of the MPSC 2013 RPS Report, a total of 5 electric providers were
utilizing the statutory surcharge caps for recovery of the incremental cost of compliance with the
Act. With the continued decrease in renewable energy costs, based on recently filed renewable
energy plans, only Detroit Public Lighting and Lowell Power and Light still plan to recover
77
Updated
http://www.michigan.gov/documents/mpsc/implementation_of_PA295_renewable_energy_411615_7.pdf?20130717
172545

92
incremental cost of compliance via capped surcharges, while eighteen providers are below the
cap and thirty-nine electric providers charge customers no surcharges at all.78
Under the current renewable surcharge on meters, about 68% of the money collected is
from residential customers. If renewables costs were recovered through traditional ratemaking,
then the money collected would be at cost of service for each customer class, and not set by the
surcharge. For both Consumers Energy and DTE Electric, about 44% of total revenue is
collected from residential customers in base rates. Changing from a renewable energy surcharge
on meters to a volumetric surcharge based on kWh usage could shift costs from residential
customers onto commercial and industrial customers.
Act 295 renewable energy costs are recovered in two ways;. the energy and capacity
portion of the renewable energy is recovered pursuant to Sections 47 and 49 of the Act through
the Power Supply Cost Recovery (PSCR) mechanism utilizing a transfer price schedule while
the remaining or incremental portion of the renewable generation costs is recovered through a
surcharge.. The incremental cost of compliance represents the cost of renewable energy above
and beyond the costs defined by transfer price schedules and recovered through the PSCR
process. PSCR recovery is generally reserved for power purchase agreement recovery, fuel
purchases and some Environmental Protection Agency regulation compliance costs. Sections 47
and 49 of the Act expanded the use of the PSCR mechanism to include the projected capacity,
energy, and maintenance and operation costs, which is now called the transfer price. Transfer
price schedules are representative of what a Michigan electric provider would pay had it obtained
the energy and capacity (the non-renewable market price component) through a new long term
power purchase agreement for traditional fossil fuel electric generation. To best determine the
value of the non-renewable component of Act 295 compliant generation, Commission Staff
78
Does not include Alternative Electric Suppliers

93
determined, for purposes of developing a uniform Transfer Price Schedule, that the levelized cost
of a new natural gas combined cycle (NGCC) plant would likely be analogous to the market
price mentioned above.79
The transfer price used for the scenario analysis is shown in Table 9.
Table 9: Transfer Price
Year
Transfer
Price
Year
Transfer
Price
2016 $66.23
2026 $78.05
2017 $66.39
2027 $79.39
2018 $67.55
2028 $80.68
2019 $68.94
2029 $82.19
2020 $70.29
2030 $81.23
2021 $71.18
2031 $82.62
2022 $73.14
2032 $84.00
2023 $74.45
2033 $86.09
2024 $75.59
2034 $88.31
2025 $76.81
2035 $90.02
Below is a high-level calculation that compares various renewable energy requirements;
in order to have an apples-to-apples comparison with uniform, well-understood assumptions, the
scenarios below assume the following:
Retail rate impacts would not exceed limits in current law;
79
For more detailed information on the Staff Transfer Price Schedule see:
http://efile.mpsc.state.mi.us/efile/docs/15800/0036.pdf

94
Rates were assumed as a statewide average and not on a provider-by-provider
basis;
The basic elements of PA 295 would apply to the increased renewables build
(including in-state provisions, same allocation among rate classes, and per-meter
charges);
The number of meters would remain stable;
Levelized cost of $86.60 per MWh for wind,80
$144.30 per MWh for solar and
$111.00 per MWh for biomass (with maximum incremental revenue with the
transfer price factored in); 81
and
Annual load growth would be either 1.2% or zero (to give a range).
Table 12 shows the generation mix and capacity given a scenario with 50% of the
current surcharge caps.
All scenarios are reliant on a number of assumptions that could change outcomes and
would require long range planning and modeling analysis to determine further feasibility. More
specific assumptions are detailed prior to the tables showing the various projections.82
The EIA
levelized cost analysis assumes capacity factors of 30% - 39% for wind and it is anticipated that
Michigan wind capacity factors will exceed that. Wind generation technology has advanced
rapidly in the last couple of years. Taller towers and larger blade diameters allow for much
higher capacity factors and optimized operating characteristics given Michigan’s wind resources.
Based on third party and electric provider analysis, Michigan wind farms that utilize these new
80
Starting in 2034, all of the costs for wind will be recovered through the PSCR via the transfer price. 81
The U.S. Energy Information Agency (EIA) has stated an average levelized cost for generation entering the
market in 2018 of $86.60 per MWh for wind, $144.30 per MWh for Solar and $111.00 per MWh for biomass. The
levelized costs assumed for wind, solar, and biomass are based on an assumption that there will be no federal tax
extensions starting in 2015, but that these technologies will continue to benefit from learning curve cost reductions. 82
http://www.eia.gov/forecasts/aeo/electricity_generation.cfm

95
technologies, are anticipated to produce capacity factors well over 40%, meaning that the
levelized cost of $86.60 per MWh is probably inflated and actual levelized costs will be lower.
Commenters suggested that biomass facilities, particularly wood-fired facilities and co-
generation facilities (generators that use a mixture of renewable biomass fuels such as wood,
black liquor, and/or soap and combine it with non-renewable fuels such as coal and tire derived
fuels)83
can support capacity factors that exceed 90% which in turn would reduce the levelized
cost. These facilities are particularly valuable as they can provide base load generation. For
simple modeling purposes 65% continues to seem reasonable as biomass in the model
encompasses an average of many different biomass technologies such as wood fired biomass
boilers, anaerobic digesters and landfill methane gas generators. For long range planning
purposes, it could be more appropriate to split each of the mentioned technologies out and assign
a capacity factor to each for individual analysis.
Although EIA states an average levelized cost of $144.30 per MWh for solar, the EIA
maximum of $244.40 per MWh.is most likely a more reasonable approximation of Michigan’s
large utility scale solar photovoltaic build-out as it is still in its infancy and while solar is viable
in Michigan, capacity factors are not as high as in Southern states. Based on Michigan contracts
for Biomass energy, the EIA average levelized cost of $111.00 per MWh seems reasonable. For
consistency this analysis uses the EIA averages for all three technologies.
For simplicity, the methodology assumes that recovery for all the renewable energy will
be conducted in a manner similar to current electric provider power purchase agreement recovery
that is paid for through a schedule of transfer prices for the generation from the plant and a
renewable energy surcharge for the incremental cost beyond the transfer price, if any.
83
Under the renewable standard, co-fired facilities receive renewable energy credits only for the portion of
generation produced by the renewable energy fuel generally on a BTU basis.

96
Additionally, it is assumed that cost recovery through these renewable mechanisms will continue
through the twenty year planning period only, which does not account for the electric provider’s
commitment to company-owned resources after the planning period or obligations to developers
for contract terms that extend beyond 2035. Similar to the current renewable standard under the
Act, it is assumed that costs beyond the renewable planning period would be recovered utilizing
traditional rate making procedures. The modeling also assumes that new capacity will be
necessary as current fossil fueled generation will be moth-balled or retired due to age and
environmental requirements. These compliance obligations would make renewable generation a
much more economical choice when compared to the continued capital investment in generating
plants that are close to or already beyond their operational lives.
In developing the scenarios, the sum of the current forecasted renewable energy
surcharge revenue is subtracted from the maximum potential surcharge revenue to determine the
incremental revenue available each year. This calculation provides the maximum potential
renewable capacity by type shown in Tables 10 and 11. The same methodology is used to
develop the scenarios in Table 12 with, but a 50% reduction in surcharge revenues is utilized.
Two different models are presented for each scenario in Table 10 and 12. The base scenario
adds mostly wind generation because onshore wind generation is cheaper than the other
renewable sources. The maximized solar and biomass scenario is added to show that additional
amounts of biomass and solar (reducing the amount of wind) could be added while still adhering
to the assumption that the current PA 295 renewable energy surcharge cap remained in place.
Additionally, a sensitivity to load growth is also provided. Table 10 shows that lower amounts
of new renewables would be required if there is no load growth, as opposed to higher amounts of
new renewables that would be required if there was a very robust annual load growth of 1.2%.

97
The scenarios presented in Table 12 include a 50% reduction in surcharge revenues and show
that a 30% renewable standard by 2035 is possible in both the no load and 1.2% load growth
scenarios, however the portfolio would have to be primarily wind as this represents the lowest
levelized cost source of renewable generation. The scenarios presented in Table 13 include the
Commission-approved actual surcharge levels currently being paid by customers and assumes
that those surcharges would be frozen. Similar to the 50% surcharge cap revenue scenario,
Table 13 also shows that a 30% renewable standard by 2035 is possible in both the no load and
1.2% load growth scenarios, however the portfolio would have to be primarily wind as this
represents the lowest levelized cost source of renewable generation.
Table 10: Incremental Renewable Energy Constrained by PA 295 Surcharge Caps84
Model 1: Base Scenario (No Load Growth)
Renewable Percentage
Wind Percentage
Wind Capacity MW
Solar Percentage
Solar Capacity MW
Biomass Percentage
Biomass Capacity MW
Incremental Renewables MW
15% by 2020 85.0% 1,246 7.5% 338 7.5% 68 1,651
20% by 2025 85.0% 2,491 7.5% 676 7.5% 135 3,303
25% by 2030 85.0% 3,737 7.5% 1,014 7.5% 203 4,954
30% by 2035 85.0% 4,982 7.5% 1,353 7.5% 271 6,605
Model 2: Maximized Solar and Biomass (No Load Growth)
Renewable Percentage
Wind Percentage
Wind Capacity MW
Solar Percentage
Solar Capacity MW
Biomass Percentage
Biomass Capacity MW
Incremental Renewables MW
15% by 2020 34.0% 498 33.0% 1,488 33.0% 298 2,284
20% by 2025 61.0% 1,788 19.5% 1,758 19.5% 352 3,898
25% by 2030 71.0% 3,121 14.5% 1,961 14.5% 392 5,475
30% by 2035 73.0% 4,279 13.5% 2,435 13.5% 487 7,200
84
Assumptions: Wind capacity factor of 40% and levelized cost of $86.60 per MWh; Solar capacity factor of 13%
and levelized cost of $144.50 per MWh; Biomass capacity factor of 65% and levelized cost of $111.00 per MWh

98
Table 11: Incremental Renewable Energy Constrained by PA 295 Surcharge Caps85
Model 1: Base Scenario (1.2% Load Growth)
Renewable Percentage
Wind Percentage
Wind Capacity MW
Solar Percentage
Solar Capacity MW
Biomass Percentage
Biomass Capacity MW
Incremental Renewables MW
15% by 2020 85.0% 1,544 7.5% 419 7.5% 84 2,047
20% by 2025 85.0% 3,125 7.5% 848 7.5% 170 4,143
25% by 2030 85.0% 4,687 7.5% 1,273 7.5% 255 6,214
30% by 2035 85.0% 6,249 7.5% 1,697 7.5% 339 8,285
Model 2: Maximized Solar and Biomass (1.2% Load Growth)
Renewable Percentage
Wind Percentage
Wind Capacity MW
Solar Percentage
Solar Capacity MW
Biomass Percentage
Biomass Capacity MW
Incremental Renewables MW
15% by 2020 34.0% 618 33.0% 1,844 33.0% 369 2,831
20% by 2025 68.0% 2,500 16.0% 1,810 16.0% 362 4,672
25% by 2030 76.0% 4,191 12.0% 2,036 12.0% 407 6,634
30% by 2035 78.0% 5,735 11.0% 2,488 11.0% 498 8,721
85
Assumptions: Wind capacity factor of 40% and levelized cost of $86.60 per MWh; Solar capacity factor of 13%
and levelized cost of $144.30 per MWh; Biomass capacity factor of 65% and levelized cost of $111.00 per MWh

99
Table 12: Incremental Renewable Energy 50% of PA 295 Surcharge Caps86
Model 1: 50% Surcharge Scenario (No Load Growth)
Renewable Percentage
Wind Percentage
Wind Capacity MW
Solar Percentage
Solar Capacity MW
Biomass Percentage
Biomass Capacity MW
Incremental Renewables MW
15% by 2020 77.0% 1,128 11.5% 518 11.5% 104 1,750
20% by 2025 93.0% 2,725 3.5% 316 3.5% 63 3,104
25% by 2030 96.0% 4,220 2.0% 271 2.0% 54 4,545
30% by 2035 96.0% 5,627 2.0% 361 2.0% 72 6,060
Model 2: 50% Surcharge Scenario (1.2% Load Growth)
Renewable Percentage
Wind Percentage
Wind Capacity MW
Solar Percentage
Solar Capacity MW
Biomass Percentage
Biomass Capacity MW
Incremental Renewables MW
15% by 2020 82.0% 1,489 9.0% 503 9.0% 101 2,093
20% by 2025 95.0% 3,492 2.5% 283 2.5% 57 3,832
25% by 2030 98.0% 5,404 1.0% 170 1.0% 34 5,608
30% by 2035 98.0% 7,205 1.0% 226 1.0% 45 7,477
86
Assumptions: Wind capacity factor of 40% and levelized cost of $86.60 per MWh; Solar capacity factor of 13%
and levelized cost of $144.30 per MWh; Biomass capacity factor of 65% and levelized cost of $111.00 per MWh

100
Table 13: Incremental Renewable Energy at Current (2012) Surcharges87
Model 1: Current (2012) Surcharge Levels (No Load Growth)
Renewable Percentage
Wind Percentage
Wind Capacity
MW Solar
Percentage
Solar Capacity
MW Biomass
Percentage
Biomass Capacity
MW
Incremental Renewables
MW
15% by 2020 67.0% 982 16.5% 744 16.5% 149 1,874
20% by 2025 87.0% 2,550 6.5% 586 6.5% 117 3,253
25% by 2030 91.0% 4,000 4.5% 609 4.5% 122 4,731
30% by 2035 92.0% 5,392 4.0% 721 4.0% 144 6,258
Tables 10 and 11 show the potential capacity increases by technology for a Base
Scenario that assumes 85% wind, 7.5% solar and 7.5% biomass and a Maximized Solar and
Biomass Scenario that varied the two technologies to determine the maximum amount of
capacity potential. Table 10 and 11 assume zero and 1.2% annual load growth, respectively,
with the current surcharge caps, while Table 12 assumes a no load growth and a 1.2% growth
rate, but only 50% of the current surcharge caps. Table 13 also assumes a no load growth and a
1.2% growth rate, but with the current Commission approved renewable energy surcharges
frozen. It does not include any pending surcharge reductions currently before the Commission.
87
Assumptions: Wind capacity factor of 40% and levelized cost of $86.60 per MWh; Solar capacity factor of 13%
and levelized cost of $144.30 per MWh; Biomass capacity factor of 65% and levelized cost of $111.00 per MWh
Model 1: Current (2012) Surcharge Levels (1.2% Load Growth)
Renewable Percentage
Wind Percentage
Wind Capacity MW
Solar Percentage
Solar Capacity MW
Biomass Percentage
Biomass Capacity MW
Incremental Renewables MW
15% by 2020 73.0% 1,326 13.5% 754 13.5% 151 2,231
20% by 2025 90.0% 3,309 5.0% 566 5.0% 113 3,987
25% by 2030 94.0% 5,183 3.0% 509 3.0% 102 5,794
30% by 2035 95.0% 6,985 2.5% 566 2.5% 113 7,663

101
Each scenario was run under four compliance goals based on generation of: 15% renewable
energy by 2020; 20% renewable energy by 2025; 25% renewable energy by 2030; and 30%
renewable energy by 2035. Similar to the current compliance standard, the scenarios above
assumed a 20 year planning period in which cost recovery would take place through 2035.88
The
incremental capacity numbers provided reflect the amount needed beyond the current 10%
standard.
Utilizing the surcharge caps in the current RPS as a maximum allowable cost, and under
the assumptions discussed above, it would be possible to increase the renewable portfolio
standard by as much as 8,721 MW through 2035, equivalent to approximately a 30% RPS.89
Additionally, utilizing a 50% reduction in surcharge revenue still allows Michigan as a whole to
meet a 30% renewable standard by 2035 as shown in Table 12. The scenarios in Table 12 are
only valid if the percentage of wind in the renewable portfolio increases to 96% or above in
2030 and 2035 due to its lower cost with respect to solar and biomass.90
Similarly, the scenarios
in Table 13 are only valid if the percentage of wind in the renewable portfolio is relatively
higher due to its lower cost with respect to solar and biomass.
These scenarios assume approximately a 1% increase in renewable energy per year which
is on par with the pace of Michigan’s current standard and several other Midwest states such as
Wisconsin, Pennsylvania, Illinois, and Minnesota that all have percentage increase per year of
0.8% to 1.3%.
88
30% by 2035 assumes a 21 year plan period while the other scenarios assume a 20 year plan period 89
Other constraints need to be further analyzed when determining the amount of renewable energy potential such as:
available land suitable for renewable development when setbacks are considered; and that do not disrupt migratory
fly zones or have other negative effects on flora and fauna; effects on the transmission system; availability of
transmission in a particular area; etc. 90
Under the current renewable standard of 10% by 2015, Michigan will see an increase of approximately 1,500 MW
of renewable capacity with over 95% from wind resources.

102
Some have commented that all of the renewable energy costs should be considered
incremental cost (and therefore recovered entirely through surcharge) in cases where a utility
does not need new generation but for the RPS. This approach is inconsistent with the PA 295
framework and would require detailed utility-specific analyses to determine the projected impact.
Each utility is situated differently with projected load growth rates, the amount of existing
utility-owned generation, purchased generation capacity and projected retirements due to aging
fleets. If this projected policy change was enacted, the amounts of renewables that are identified
in Tables 10, 11, 12 and 13 to meet the various potential future targets would be reduced, but at
the same time, it’s likely that the renewable requirements would vary utility by utility. In
addition, PA 295 already includes "off ramps" in the event the requirements exceed the cost caps
in the statute for an individual provider. Thus, flexibility is built into the statute to ensure cost
effectiveness, although other approaches could be taken to achieve the same goal.
Summary
This report discusses the current situation for renewable energy in Michigan and offers a
glimpse into the potential for the future inclusion of renewable energy in Michigan’s energy
policy. Michigan is on track to meet its current legislated RPS of 10% by 2015. Electric
Providers have been working diligently to make this happen. As more renewable resources have
been added, the prices of these resources has decreased, particularly for wind energy, and are
now competitive with some new sources of non-renewable energy. Renewable energy has also
increased the diversity of Michigan’s energy sources, adding to the usual mix of coal, natural gas
and nuclear. Michigan’s RPS has improved the transmission system in Michigan, especially in
the Thumb region; led to a more transparent and efficient grid integration methodology; and

103
made people reconsider the way that they analyze new generation alternatives. The statewide net
metering program has encouraged net metering in Michigan, particularly for residential and
small commercial customers.

104
APPENDIX A: Summary of State Renewable Portfolio Standards
State RPS Requirements
Standard Date % Load
Adjusted Standard - State
Equivalent
Arizona 15% 2025 58.5% 8.8%
California 33% 2020 98.2% 32.4%
Colorado 2020 21.2%
IOUs 30% 2020 58.7% 17.6%
Co-ops and large munis 10% 2020 35.6% 3.6%
Connecticut 27% 2020 93.4% 25.2%
Delaware 25% 2026 70.0% 17.5%
District of Columbia 20% 2020 100.0% 20.0%
Hawaii 40% 2030 100.0% 40.0%
Illinois 2025 16.5%
IOUs 25% 2025 43.2% 10.8%
AES 1 12.5% 2025 45.7% 5.7%
Iowa2 1% 2000 75.7% 0.8%
Kansas 20% 2020 81.5% 16.3%
Maine3 10% 2017 98.3% 9.8%
Maryland 20% 2022 93.4% 18.7%
Massachusetts4 22.1% 2020 86.0% 19.0%
Michigan 10% 2015 100.0% 10.0%
Minnesota 2020/2025 27.4%
Xcel 30% 2020 47.8% 14.3%
Other 25% 2025 52.2% 13.1%
Missouri 15% 2021 70.0% 10.5%
Montana 15% 2015 66.6% 10.0%
Nevada 25% 2025 88.2% 22.1%
New Hampshire 24.8% 2025 98.2% 24.4%
New Jersey 20.4% 2021 98.3% 20.0%
New Mexico 2020 15.6%
IOUs 20% 2020 67.7% 13.5%
Co-ops 10% 2020 20.8% 2.1%
New York 29% 2015 84.7% 24.6%
North Carolina 2018/2021 11.9%
IOUs 12.5% 2021 75.2% 9.4%
Co-ops and munis 10% 2018 24.8% 2.5%
Ohio 12.5% 2024 88.6% 11.1%
Oregon 2025 20.4%
Large utilities 25% 2025 74.6% 18.7%
Small utilities 10% 2025 10.2% 1.0%

105
Standard Date % Load
Adjusted Standard - State
Equivalent
Small utilities (<1.5% state's load) 5% 2025 15.2% 0.8%
Pennsylvania 18% 2021 97.3% 17.5%
Rhode Island 16% 2020 99.3% 15.9%
Texas5 5% 2015 n/a 5.0%
Washington 15% 2020 84.7% 12.7%
Wisconsin 10% 2015 100.0% 10.0%
SOURCE: Public Sector Consultants, 2013, based on data from Database of State Incentives for Renewables and Efficiency, January 2013. NOTES: 1 AESs are only required to meet 50% of standard but can elect to do 100%.
2 Electricity sales in Iowa are 45,445,269 MWh; 105 MW in high-quality wind area (40% capacity factor) would be expected to
produce 367,960 MWh per year, equivalent to 1% renewable energy. Iowa has over 4,000 MW of installed capacity, far exceeding the 105 MW minimum. 3This applies only to new renewable energy projects. Maine had standard of 30% by 2020, which included existing renewable
resources. Maine had large percentage of existing hydro-electric that qualified. 4 Massachusetts has goal of 15% by 2020 for new renewable resources, and this increases 1% annually thereafter.
5 Texas' requirement of 5,880 MW by 2015 equates to approximately 5% of the state's electric load. Texas has already surpassed
this goal with over 10,000 MW installed.
*Provided in a joint response from Michigan utilities

106
APPENDIX B: Summary of Renewable Energy Compliance Approaches
State Type of Enforcement Description of Penalty/Alternative Compliance Payments
Arizona Discretionary Financial Penalties with no cost Recovery
California Explicit Financial Penalties with no automatic cost recovery
Connecticut Explicit Financial Penalties with no automatic cost recovery
$55/MWh
Colorado Discretionary Financial Penalties with no cost recovery
Delaware Alternative Compliance Mechanisms with possible cost recovery
Hawaii Discretionary Financial Penalties with no cost recovery
Kansas Explicit Financial Penalties with no automatic cost
Failure to comply with the renewable energy requirements results in a minimum penalty equal to
Recovery twice the market value of RECs that would have been required to meet the requirement.
Maine Alternative Compliance Mechanisms with automatic cost recovery
$62.10/MWh
Maryland Alternative Compliance Mechanisms with possible cost recovery
$40/MWh for non-solar Tier 1, $15/MWh for Tier 2, and $45/MWh for solar (declining to $50/MWh in 2023)
Massachusetts Alternative Compliance Mechanisms with automatic cost recovery
ACP is $64/MWh for Class I sources, $27/MWh for Class II sources, and $550/MWh for solar. It is adjusted for upwards inflation each year, and the Department of Energy Resources can adjust it downward based on market conditions.
Michigan Explicit Financial Penalties with no automatic cost Recovery

107
Minnesota Discretionary Financial Penalties with no cost recovery
If the PUC finds a utility is non-compliant, the commission may order the utility to construct facilities, purchase eligible renewable electricity, purchase RECs or engage in other activities to achieve compliance. If a utility fails to comply, the PUC may impose a financial penalty on the utility in an amount not to exceed the estimated cost of achieving compliance.
Missouri Explicit Financial Penalties with no automatic cost recovery
Utilities that do not meet their renewable and solar portfolio are subject to penalties of at least twice the market value of RECs or SRECs.
Montana Explicit Financial Penalties with no automatic cost recovery
$10/MWh
Nevada Discretionary Financial Penalties with no cost Recovery
New Hampshire
Alternative Compliance Mechanisms with automatic cost recovery
Class I: $55.00/MWh, Class I Thermal: $25.00/MWh in 2013, Class II: $55.00/MWh, Class III: $31.50/MWh, Class IV: $26.50/MWh in 2013 (adjusted annually for inflation.
New Jersey Alternative Compliance Mechanisms with automatic cost recovery
ACP is $50/MWh, and the solar ACP was $641/MWh in 2013, declining to $239/MWh in 2028.
New Mexico Enforcement at PUC Discretion
North Carolina Enforcement at PUC Discretion
Ohio Explicit Financial Penalties with no automatic cost recovery
ACP initially set at $45/MWh (with the possibility of upwards adjustment each year). The Solar ACP is set at $450/MWh in 2009, reduced to $400/MWh in 2010 and 2011, and will be reduced by $50 every two years thereafter to a minimum of $50/MWh in 2024.
Oregon Alternative Compliance Mechanisms with possible cost recovery
ACP = $50/MWh
Pennsylvania Explicit Financial Penalties with no automatic cost recovery
ACP of $45 per megawatt-hour for shortfalls in Tier I and Tier II resources. A separate ACP for solar PV is calculated as 200% times the sum of (1) the market value of solar AECs for the reporting period and (2) the levelized value of up-front rebates received by sellers of solar AECs.
Rhode Island Alternative Compliance Mechanisms with automatic cost recovery
$64.02/MWh
Texas Explicit Financial Penalties with no automatic cost recovery

108
Washington Explicit Financial Penalties with no automatic cost recovery
ACP = $50/MWh (adjusted annually for inflation)
Wisconsin Explicit Financial Penalties with no automatic cost recovery
*Provided in a joint response from Michigan utilities

109
APPENDIX C: MISO Response Letter

July 1, 2013
Ms. Valerie Brader
Deputy Legal Counsel and Senior Policy Advisor
Governor Rick Snyder’s Office
George W. Romney Building
111 South Capitol Avenue
Lansing, MI 48909
Dear Ms. Brader,
Thank you for the opportunity to provide information to assist Governor Snyder in developing his energy
plan for Michigan. Attached please find responses to the five questions specifically addressed to MISO.
We are excited about the opportunity to participate in Readying Michigan to Make Good Energy
Decisions. Should you have any further questions, or need additional information, please do not
hesitate to contact me.
On a further note, please know MISO continues to work on addressing transmission issues in the
Northern area of our footprint. On June 17, 2013 MISO conducted a successful first meeting between
policymakers and regulators from the states of Michigan, Wisconsin, Minnesota, South Dakota, North
Dakota and the Province of Manitoba. As a result of this meeting, several issues were identified for
further discussion with this group to continue working on these issues. MISO believes these discussions
will also provide additional information to Governor Snyder as he develops his energy plan.
Again, thank you for the opportunity to participate in the Governor’s plans for Michigan’s energy future.
Sincerely,
Rob Berntsen
Vice President
Government & Regulatory Affairs
cc: Steven Bakkal, Michigan Energy Office
John D. Quackenbush, MPSC Chair
Paul Proudfoot, MPSC Electric Reliability Division Director
APPENDIX C Page 110 of 115

Readying Michigan to Make Good Energy Decisions Renewable Energy Questions for MISO
1. Recognizing that MISO has been actively involved in the integration of renewable
resources throughout the MISO footprint, could you summarize actions MISO has
taken to address the integration of renewable resources?
MISO Response:
Current registered wind capacity in the MISO footprint is approximately 12,200 MW,
which is a 60% increase from just three years ago. MISO anticipates continued
additions of wind capacity as states continue to comply with Renewable Portfolio
Standard (RPS) goals and mandates set by policy makers in the MISO states. Given
the amount of renewable generation in our footprint, MISO has had to make
enhancements in both the planning and operations functions in order to ensure our
ability to effectively integrate these resources. Some of these enhancements are
outlined here.
Queue Reform. In 2008, a significant change was made to the MISO generation
interconnection queue, which is the process that generators use to connect new
generation facilities to the transmission grid. The changes were driven by the
need to have a more consistent and predictable process to integrate new
generation facilities, which have largely been wind generators. The revised
queue process provides a more efficient and transparent process for evaluating
interconnection requests. MISO’s queue process now provides more certainty
for developers as they move to finance their projects and more certainty for
transmission planners.
Multi-Value Projects. RPS goals and mandates set by state policy makers also
drove a need for a more regional and robust transmission system that would
provide many benefits to the MISO system, including enabling the delivery of
renewable resources, which are typically sited in areas that are far away from
customers. In response to this situation, MISO worked with stakeholders to
identify transmission projects (and corresponding cost allocation) that would fulfill
combinations of the following purposes: (1) meet reliability needs; (2) provide
economic benefits, and (3) enable public policy goals to be met. The result of
this process was the development of the first Multi-Value Project (MVP) portfolio
of projects that was approved by the MISO Board of Directors in 2011.
Dispatchable Intermittent Resources. From an operational aspect, integrating
wind generation presents unique challenges. The wind-rich areas in the MISO
system are in rural areas where significant transmission capacity has historically
APPENDIX C Page 111 of 115

not been needed. As significant generation has been developed in these areas,
the transmission system is not always able to handle the full output of these new
resources. To manage this situation, manual curtailments of wind generation
were necessary. To reduce the need for those manual actions, enable more
efficient congestion management, and place wind generation on par with other
generators on the system, MISO created a new resource designation –
Dispatchable Intermittent Resources (DIR). DIRs were implemented in June of
2011, allowing for more transparent, timely and precise constraint mitigation.
DIRs also provide the additional benefit of providing flexibility during minimum
load situations. Wind generation owners have welcomed DIRs as this new tool
benefits the generators by allowing them to sell more energy into the MISO
market without threat of full (manual) curtailment. Energy purchasers in the
MISO market have also recognized the benefit of having more lower-priced wind
generation in the market to purchase for their customers.
2. There has been concern that the integration of renewable resources into the MISO
system could negatively impact reliability of the system. Has MISO experienced
any negative impact to grid reliability caused by the integration of renewable
energy sources and/or distributed generation?
MISO Response:
Reliability of the system is the primary concern of MISO’s planning and operations. To
date, wind has not been a significant contributor to any system-wide reliability issues or
threats, including operating reserve deployments. Wind has historically had a small
impact on the use of regulating reserves. Contingency reserves have never been
deployed due to a drop in wind output. Any issues with wind have primarily been limited
to localized congestion and generation outlet concerns, which have not caused system
reliability issues. Reliability is a primary concern as additional wind resources are
planned for and integrated onto the MISO system.
3. As Michigan nears the 10 percent RPS requirement, there is interest in increasing
the standard. Does MISO have an estimate of how much additional renewable
energy capacity could be added in the Michigan footprint without negatively
impacting system reliability? Have Michigan customers been allocated back-up
capacity/integration costs as a result of the current Michigan renewable standard?
MISO Response:
MISO has not yet worked with Transmission Owners in Michigan to estimate the amount
of renewable capacity that could be added in Michigan without negatively impacting
reliability. A number of factors could impact this determination, thus making an accurate
APPENDIX C Page 112 of 115

prediction very difficult. The incremental increase of wind generation in recent years
has, at certain times and under certain local load and energy supply conditions,
introduced localized congestion on the transmission system. However, these issues
(which have not caused any significant reliability issues) have been effectively managed
through the use of operating guides and congestion management procedures. Also, it is
expected that these constraints would be mitigated or entirely resolved by future
transmission projects, including the Michigan Thumb Loop Expansion project, which is
part of MISO’s Multi-Value Project portfolio.
In terms of costs of backup capacity or integration costs, MISO is not aware of any
backup capacity costs specifically attributable to supporting the increase of wind
generation in Michigan. With respect to integration costs, $74,096,830 of transmission
network upgrades have been made to interconnect wind resources in the state of
Michigan to the MISO system. This figure reflects the costs associated with “in-service”
generators that have a signed interconnection agreement with MISO.
Additionally, as identified in the previous answer, to support the renewable portfolio
standards, to ensure future system reliability, and to make the benefits of an
economically efficient market available to all customers, the MISO Multi-Value Project
(MVP) portfolio was developed. The portfolio includes 17 projects across the MISO
footprint, developed as a portfolio to provide maximum value through the synergies
among and between the projects. The portfolio was approved by the MISO Board of
Directors in 2011, and included the 345kV Michigan Thumb Loop Expansion.
The MVP portfolio is forecasted to provide the following benefits:
Relieve Congestion and fuel savings
Decrease operating reserve requirements
Lower planning reserve requirements
Decrease transmission line losses
Lower future transmission investment
The estimates of savings from the MVP portfolio range from $15,540M - $49,204M ($-
2011). In Michigan these benefits are estimated at $3,072M – 9,952M for Lower
Michigan and $2,124M - $6,580M for Upper Michigan/Eastern Wisconsin1 in net present
value benefits over a 20/40 year period (the ranges of these estimated benefits depend
on the modeling assumptions).
The most recent MVP portfolio cost estimate is approximately $5.5 billion. These costs
would be allocated to Michigan as follows: $8,789M – $16,407M ($-2011) (Lower
Michigan: $1,785M – 3,333M and Upper Michigan/Eastern Wisconsin: $1,067M -
1 Upper Michigan and Eastern Wisconsin are calculated together because they make up a single pricing
zone in the MISO footprint.
APPENDIX C Page 113 of 115
$1,992M). These figures represent the net present value of sum of annual revenue
requirements over a 20/40 year period depending on future assumptions.
When comparing estimated costs to estimated benefits, the MVP portfolio provides
benefit to cost ratios ranging from 1:8 to 3:0. Specific to Michigan, the MVP portfolio
benefit to cost ratio for Lower Michigan is 1:7 – 3:0 and 2:0 – 3:3 for the Upper Peninsula
and Eastern Wisconsin. Additionally, the MVP portfolio provides benefits not reflected in
the quantified benefits including enhanced generation policy flexibility, increased system
robustness, decreased natural gas risk, decreased carbon output, decreased wind
generation volatility, and local investment and job creation.
4. MISO recently introduced an improved Dispatchable Intermittent Resource (DIR)
tariff. Has the dispatch of renewable generation changed since the
implementation of the DIR tariff and has dispatching of renewable energy
impacted locational marginal prices within the MISO footprint? What thoughts do
you have on the benefits of the current DIR tariff since its resent onset?
MISO Response:
DIRs have improved MISO’s ability to respond to and mitigate congestion on the
transmission system – as evidenced by the reduced level of manual curtailments of wind
generation.
In an unconstrained system, we would expect wholesale energy prices to trend lower
with higher wind penetration, since the result would reduce the need to commit higher
cost resources. This outcome would be the result of the changing generation mix rather
than the DIR specifically. When congestion is present, having additional resources,
including intermittent resources, available to set prices and manage congestion allows
for greater transparency and would have the effect of depressing wholesale energy
prices in areas where the amount of generation exceeds the current transmission
capability in the area.
With respect to the benefits of the DIR tariff, operations have become much more
efficient as the monitoring and dispatching of wind generation has become an automated
process, rather than a manual one.
5. Intermittent resources may require flexible, fast-ramping generation, does MISO
believe there are operational issues resulting from the lack of this type of
generation and does the MISO market provide an incentive for this type of
generation?
MISO Response:
APPENDIX C Page 114 of 115

MISO does not believe the level of fast-ramping generation in our footprint is currently a
driver of significant operational issues. Forecasted wind changes are effectively
managed through MISO’s economic dispatch of generation to meet demand.
Unexpected changes in wind output is also be managed through the MISO dispatch, but
could also result in the use of fast-start resources and the utilization of reserve capacity.
A benefit of our large single Balancing Area is that changes in intermittent generation
tend to be relatively small compared to the ability of the system to respond In addition,
the geographical diversity of wind resource locations reduces the impact of a weather
change on the combined output of those units. However, as we integrate additional wind
capacity into our footprint, ramp capability will become increasingly important. MISO is
currently engaged with stakeholders on exploring this issue and potential solutions.
Finally, the MISO market does not incentivize any particular type of generation.
APPENDIX C Page 115 of 115