real 215-724 class 02 01-21-2015 (5)-2
DESCRIPTION
the book of breadTRANSCRIPT

Urban Real Estate EconomicsProfessor Susan Wachter
REAL 215/724Class 2 – January 21, 2015
Why Cities

2
Outline
1. Administration and Introduction2. What is a City?3. Why Cities Develop4. Systems of Cities and Future of Cities5. Next Class: Readings and Topic

Administration and Introduction
3

Administrative information• Professor: Dr. Susan Wachter
• Albert Sussman Professor of Real Estate, Professor of Finance• http://www.wharton.upenn.edu/faculty/wachter.cfm• http://www.upenn.edu/penniur/
• Telephone: 215-898-6355• Office: RM 430 Vance Hall• E-mail: [email protected] • Office Hours: Tuesday 6:00-7:00pm
• TA: Matthew DeGagne • E-mail: [email protected]• Office: Vance Hall, Room 432• Office Hours: Tuesday 10:00 am – 12:00 pm
4

How to Access Readings/Course Material
• Most readings are available on Study Net as a course packet.• Log on to www.study.net (you have been registered if you
are enrolled in this course and you should have already received instructions via e-mail). Your password should be your last name, which you can change upon logging in.
• Additional readings as noted on the syllabus are available on canvas. You should be automatically added to the canvas site.• For assistance, email your name and the name of the
course to [email protected]
5
6
Readings
• Today• Mills and Hamilton, (pp.7-20; rest optional)(BP#3) – KEY READING• O’Sullivan, Ch. 2 & 3, (pp. 17-24) (BP#4) (pp. 45-52, 57-63) (BP#5)• Moretti – The New Geography of Jobs (pp. 121 – 144)(BP#1) (optional)• Lin, Geography, History, Economies of Density, and the Location of Cities
(canvas)(optional)• Duranton, Urban Evolutions: The Fast, the Slow, and the Still (canvas)
(optional)• Glaeser, Why Growth (canvas)(optional – required for Class 21)
• Next Class• DiPasquale and Wheaton, The Property and Capital Markets, Chapter 1
(BP#6)• Wachter and Kroll, Simple Analytics of Equilibrium and Disequilibrium, (pp.
1-17) (BP#7)

7
• Value over space: nation, metro, local (city and neighborhood)• Value over time:(next class) How capital markets
determine prices given rents through cap rates.• Markets do price real estate but importantly real
estate is different : fixed supply, role of government and lack of short selling.• Market analysis- methods and data (later) since
cannot rely on efficiency of markets for build, buy, sell decision
Course Objective: Pricing Real Estate over space and time

8
How markets price real estate: Cap Rates and Rents
Property price is the net present value of expected cash flows –rents – which vary over space. Rents reflect the value of location: what firms and households are willing to pay.
Cap rates vary by metro, reflecting different expectations on market rent growth rates.
When you buy real estate in a metro you are “buying” into market wide expectations of rent growth which depends on the growth or decline of the metro economy (jobs). Buying at the going cap rate, you agree with growth expectations, which can widely depart from fundamentals.
𝑉= 𝑅ሺ1+ 𝑖ሻ𝑡
∞𝑖=1 = 𝑅𝑖

Commercial and Residential Real Estate Bubbles
9
Rent

10
Today• Focus today: Region wide demand for real estate as determined by
urban market—metro– economic activity.
• National economy and macro cycle matter.
•Regional markets driven by demand for regional (metro)output. •GNP= ∑ GMP which determines demand for real estate.
• Jobs and industries are not uniformly distributed. GMP growth depends on growth of underlying regional industry cluster.
• Cities are made up of specific job and industry clusters. Why?• In the age of the internet, why does location matter?
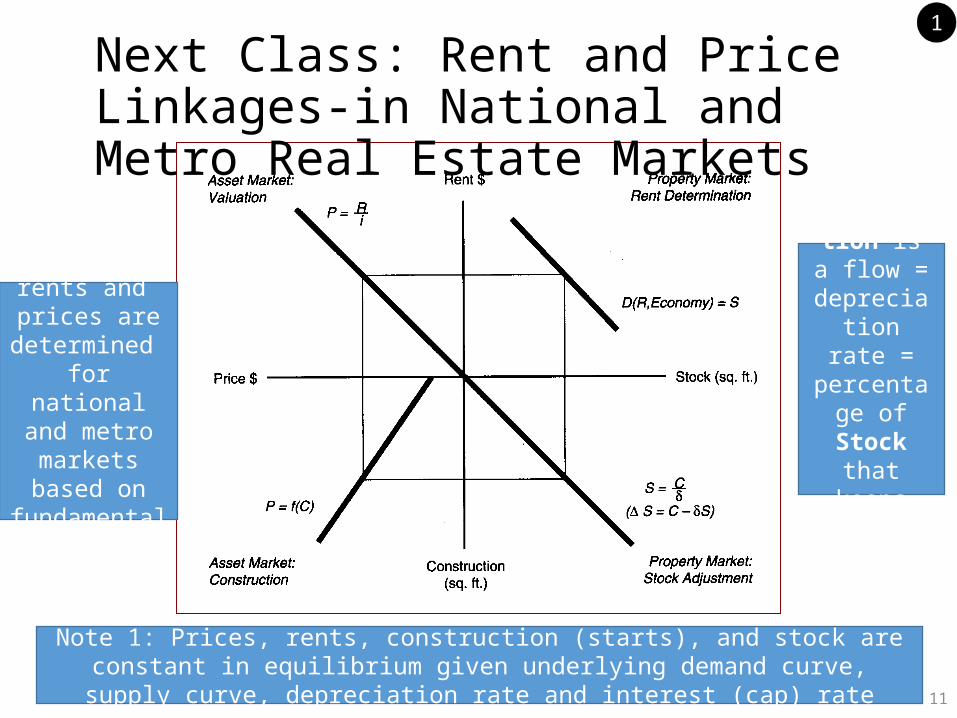
Next Class: Rent and Price Linkages-in National and Metro Real Estate Markets
Equilibrium rents and prices are
determined for national and
metro markets based on
fundamentals.
Note 2: Construction
is a flow = depreciation
rate = percentage
of Stock that keeps Stock
constant
Note 1: Prices, rents, construction (starts), and stock are constant in equilibrium given underlying demand curve, supply curve, depreciation rate and interest (cap) rate
11
12
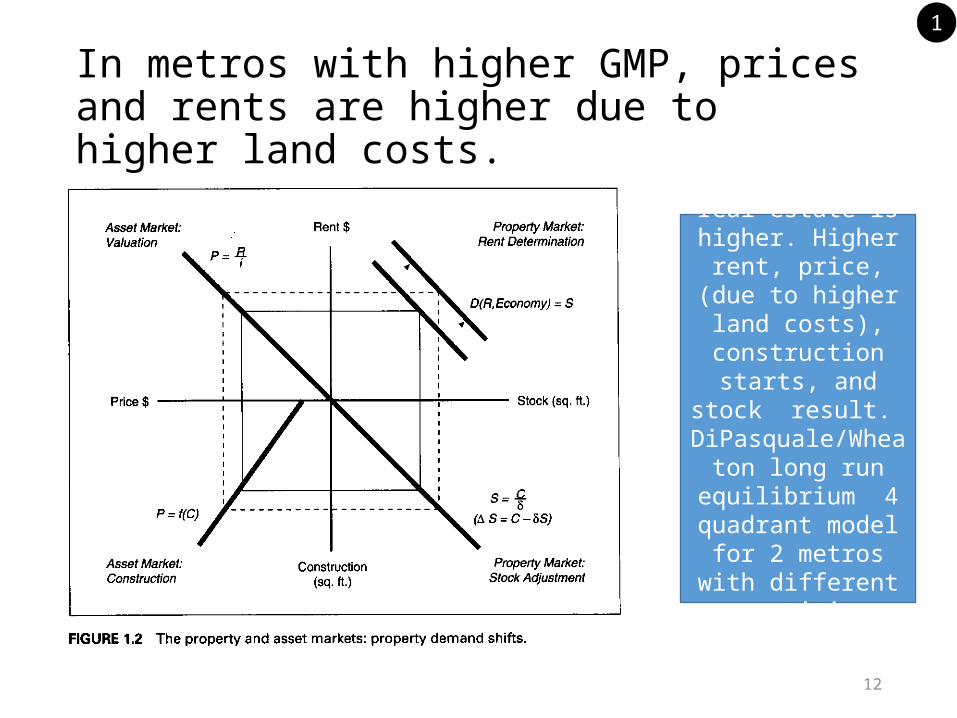
In metros with higher GMP, prices and rents are higher due to higher land costs.
With higher GMP , demand for real estate is higher.
Higher rent, price, (due to higher land costs), construction
starts, and stock result.
DiPasquale/Wheaton long run equilibrium 4 quadrant model for
2 metros with different quantities
(stock) of real estate.
What is a City?
13
2

Cities are Clusters of Population and Jobs – Boston to DC
14
2
http://www.census.gov/geo/reference/gtc/gtc_cbsa.html
DC
PHILA
NYC
NJ Pine Barrens
• Pine Barrens are 2,000 sq. miles; density of 10 people/sq. mile
• NYC (all 5 boroughs) – 300 sq. miles and 9 million people
• 30,000 people/sq. mile
Boston

15
Cities=Where Densities, Rents, and Prices Peak
• Density=ratio of population to land area • Per square mile, hectare or acre.• Square mile=259 hectares. Hectare=about 2 ½ acres
• Population densities vary from 10 people per square mile (rural) to, eg, about 30,000 people in NYC, to 100,000 psm in Manhattan. Tot pop of 20 million in NYC metro. • Per hectare: from 40 in NY metro to 115 in NYC to
300 in Manhattan.• Land values vary, eg in NYC, can vary from
$10,000 at edge to $1 billion per acre or more at center.
2

16
Within Metro Density
2

17
Density Across Metro Areas2
18
Metro Areas are the Economic City
Defined as the market area where real estate prices rise and fall together
Metro areas’ economies are driven by different job/industty clusters, different economic “engines”
Firms choose metros and provide jobs. Within metros, HHs keep prices in line by location decisions
=>metros are defined as commuting sheds. Metros include urban core =central city (and center business
districts) and surrounding suburban counties with significant commuting to the core.
Metros can and often do cross municipal and state borders.
2
19
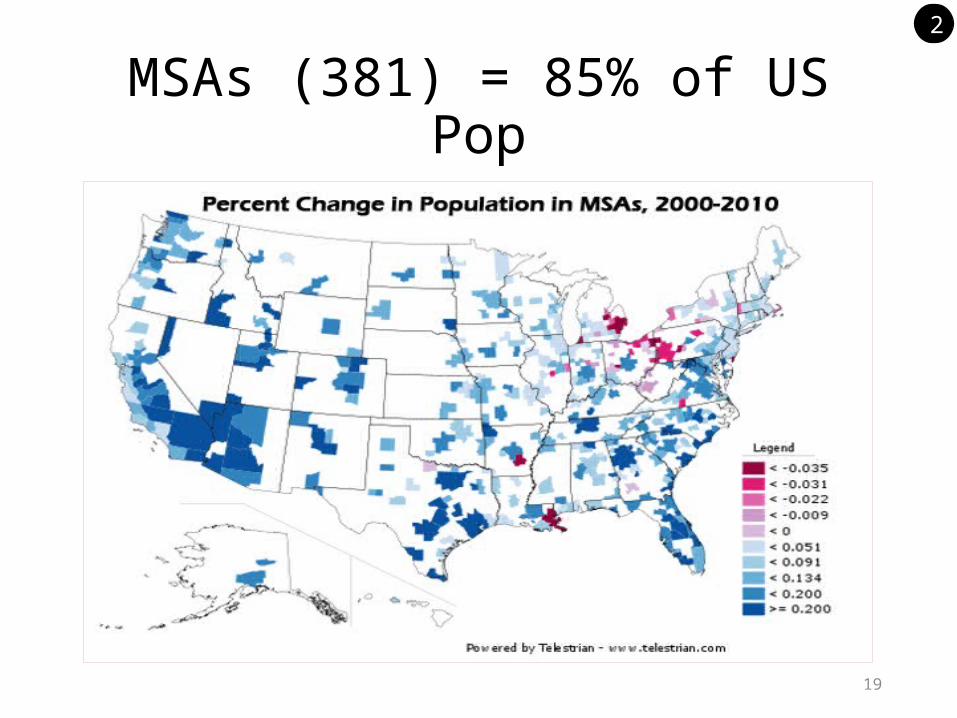
MSAs (381) = 85% of US Pop
2

20
US Metro AreasMetropolitan Statistical Area (MSA):
Core city of more than 50k plus surrounding counties from which there is substantial commuting
3,144 counties, boundaries more or less constant over time Micropolitan Statistical Area:
Urban core (10-50k) + surrounding counties with substantial commuting (541 in the US)
Core-based Statistical Area (CBSA): Refers to both Metro and Micro Statistical Areas – economically
tied to urban center
Combined Statistical Area (CSA): 2+ adjacent CBSAs with substantial employment
interchange
https://www.census.gov/popest/about/geo/terms.html
2

21
Philadelphia: Metropolitan Statistical Area (MSA) & Combined Statistical Area (CSA)
Metropolitan Statistical Area:1. Is a geographical region with a
relatively high population density at its core and close economic ties throughout the area
2. Center city of 50,000 or more and its surrounding commuter shed
Combined Statistical Area: • Grouping of adjacent MSAs
Green on map represents national parks and forests
Philadelphia-Reading-Camden CSA
2
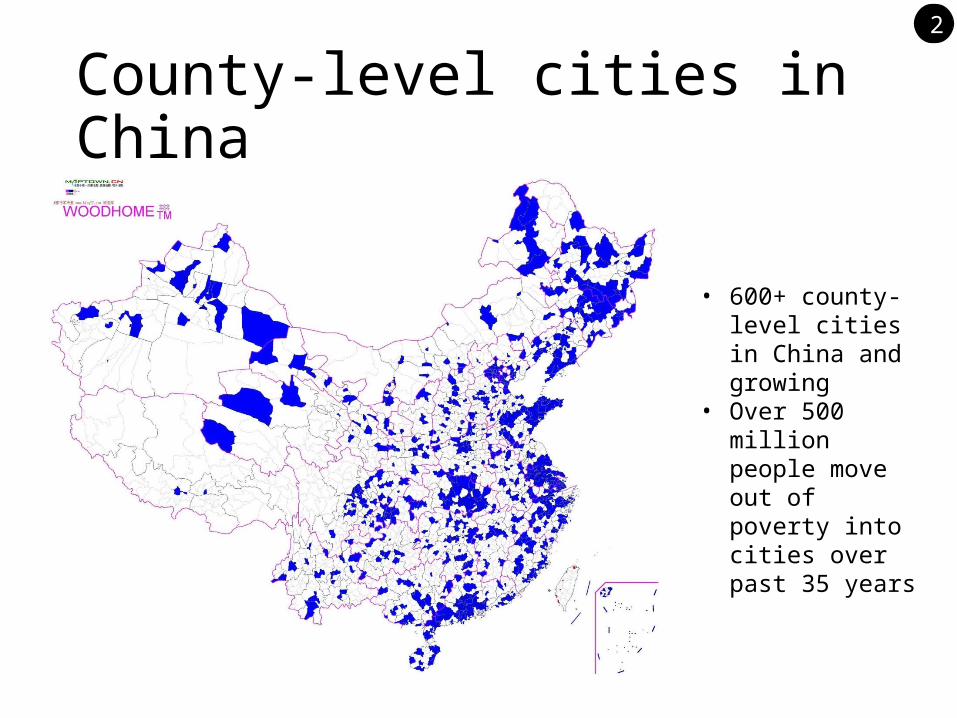
County-level cities in China
• 600+ county-level cities in China and growing
• Over 500 million people move out of poverty into cities over past 35 years
2
23
Cities Around the World
• Metros generally recognized economic entities• Paris is a municipality within the Ile de France,
metropolitan region. Also in France, metro regions include Lyon, Marseilles, and Lille.• Greater London (extends to the green belt around
London), also Manchester, Birmingham, Leeds, Liverpool, 46 in total • China has X “cities” which include• Within cities, high demand for real estate, given
locational advantage of clusters..
2
http://en.wikipedia.org/wiki/Greater_London_Built-up_Area

Why Cities Develop
24
3
25
Historical Perspective
• Urban settlements – extend back to beginning of recorded history=> fortress, mining, port (trading) cities• Industrial revolution=> manufacturing cities• Globalization=> knowledge based “command and
control” cities
3
26
Why do cities form?
• Cities form where there is market demand due to production and consumption efficiencies• Clustered production and clustered consumption are
efficient and result in lower cost output and services• Cities produce goods that they exchange for raw
materials from the surrounding rural area• The traded good (or service) is the base good (export
good) of the urban economy• Growth of export/base goods predicts growth of
employment in city and overall pop growth of city
3

27
Another Word for Cluster: Agglomeration
• Paul Krugman 2008 Nobel Prize for the New Urban Geography, and New Trade Theory. Concentration of specialized industries in particular localities
• “Nobody really thinks that Silicon Valley owes its existence to exogenously given factors of production advantage. (God made the Santa Clara valley for apricots, not semiconductors.)”
• How are global cities/clusters linked?
• The Increasing Returns Revolution in Trade and Geography – Prize Lecture 12/8/2008• http://www.nobelprize.org/nobel_prizes/economics/laureates/2008/krugman_lecture.pdf (canvas)
3
28
Global Urbanization
• New trade theory motivated by similar-similar trade occurring among advanced economies due to specialization
• A global shift by 2000s, “the United States did more trade in manufactured goods with developing countries than with other advanced nations” - Krugman
• Rapidly rising trade between high and low wage economies occurring through rise in trade between cities of the industrialized world and emerging economies
• Rise of cities in China.
3
29
Without clusters, no cities
• World with no cities• Uniform distribution of population• Uniform density with no density peaks (e.g. 9 acres per
person in the U.S.)
• Assumptions for a world without cities1. Uniform physical plane (no comparative advantage of
the place)2. No economies of scale in production or consumption
3

30
If no advantages to spatial clusters…
• No production or consumption organized in density or scale• All goods would be made at home• No trade
3
31
Trading cities
• Comparative spatial advantages• Differences in resources (e.g. proximity to resource
extraction) • Natural trading points (e.g. trading cities along a river or
seaport)
• Trading cities develop as a result
• Uniform physical plane, then why cities? Why industrial cities which supplanted trading cities.
3
Why did industrial cities develop?
• Assume away comparative spatial advantages, assume a uniform plane• Why are there cities?
• Assume one firm with economies of scale
• Customers of that firm and suppliers to that firm, all else equal will want to locate near.
• Other firms with economies of scale will want to locate near to access market.
32
3
33
Why Industrial Cities Develop:Agglomeration Economies
• AE=advantages of spatial concentration resulting from firm scale economies with transportation costs
• Industries with economies of scale attracted to an urban customer base, labor base and/or supplier base
• Will bid up land prices and rents near market, with bigger markets commanding higher rents and prices
• Economies of scale vary by industry, gives rise to cities of all sizes
• If transportation costs are zero, no need to cluster near market, near other firms for this reason, so will cities exist in a virtual economy?
3
34
Sources of Urban Agglomeration• Kinds of AE – urban and local – Duranton (1999)
“Distance, Land, and Proximity: Economic Analysis and the Evolution of Cities.” http://www.envplan.com/epa/fulltext/a31/a312169. pdf (canvas)
• Advantages of spatial concentration that result from the scale of an entire urban area or industry size• Urbanization economies: across industries, large market
sizes create large pools of supplier/consumer and allow specialization.
• Localization economies: within an industry, arise from many firms in the same industry locating close to each other.
3

35
Urbanization Economies• Specialized service firms need large cities to find a sufficient
market.• Firms from many different industries need suppliers, such as
banks, insurance, printing, office technology, etc.• Input sharing- scale economies in input use and production-
result in efficiencies in shared input use— e.g. airport, university• The larger the city, the more specialized needs can be
supported
3
36
• Production costs of a firm fall if the total output of the local industry increases• Labor Market Pooling
• Lowers search and moving costs for workers and firms• Input Sharing
• Scale economies in input use and production-result in efficiencies in shared input use— e.g. airport, university
• Knowledge spillovers• Industry cluster facilitates rapid exchange of information and
diffusion of technology—like Silicon Valley• Networks and dynamic advantages of knowledge based
cities
Localization Economies
3
37
Examples
• Localization agglomeration economies gained from specialization:• Finance: London, NY• Media, entertainment: Los Angeles and Mumbai
“Bollywood”• Geneva and watches• Milan, NY, Paris and fashion• Eds and meds: NY, Boston, Philadelphia• Aerospace, Seattle• IT, Silicon Valley, Bangalore
3
38
Urban Bright Lights and Consumption Agglomerations
• AE hold for consumption as well: Restaurants, music, arts
• Large groupings of heterogeneous people increase the likelihood that there will be sufficient demand for idiosyncratic products.
• Carlino and Saiz (2008) Beautiful Cities: Leisure Amenities and Urban Growth http://ssrn.com/abstract=1280157
• Paris!
3
Systems of Cities
39
4

40
How are cities constructed in space?
• How will cities be “arranged “ in space• Two key concepts of central place theory
• Threshold: the minimum market size for a firm to exist due to costs and economies of scale
• Range: the average maximum distance people will travel to purchase goods and services
• Gives rise to the rank size rule and “map”
4

41
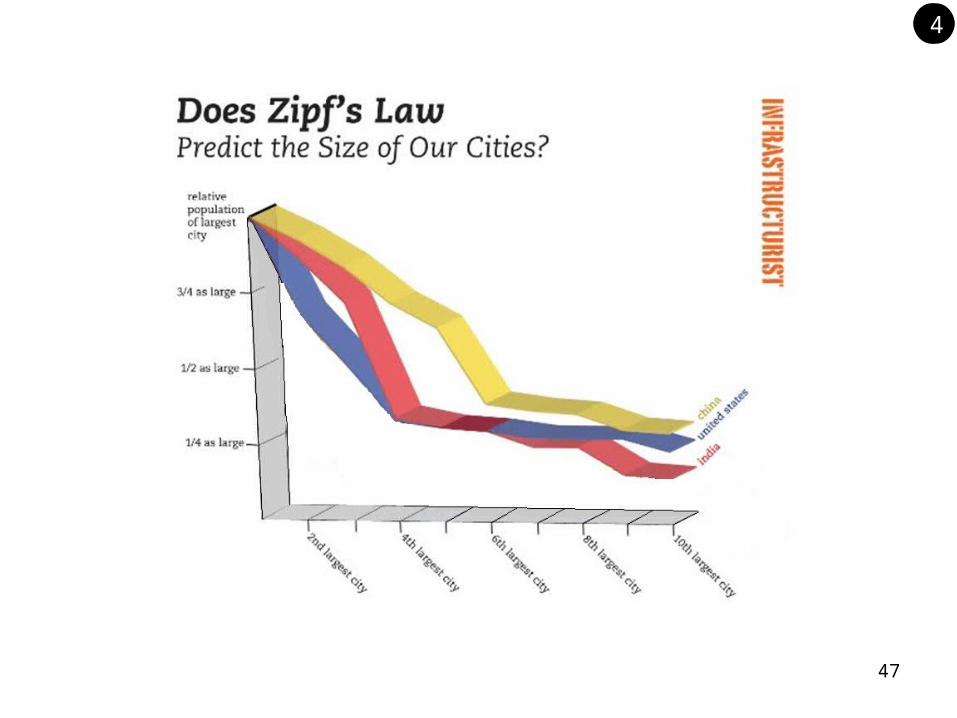
Central Place Hierarchy: 2 pictures4

Rank Size Rule: Zipf’s Law• The largest city with the highest economies of scale firms
has the largest population & jobs• Firms with second highest economies of scale will locate
in the two second largest cities each with half the population (and jobs) of the first tier city
• Rank size rule– Definition: The product of an urban area’s rank and population is
a constant equal to the population of the largest urban area• The rank size rule implies that the second largest urban
area is half the size of the largest, etc.• With a given market size, one city will serve all market
with highest level scale economies, the second two cities will each serve half that market
42
4

Rank Size Rule
0
5000
10000
15000
20000
25000
1 2 3 4 5 6 7
43
4

City Size Distribution• Conforms broadly to rule• City size range reflects economies of scale • Cities compete for industries and agglomerations with
highest scale econ– i.e. Mercedes Benz in Atlanta and Tuscaloosa, Alabama– Branson, Mo—country music competing with Nashville
44
4

US Size Distribution of Urbanized Areas
• >12.8 million 1• 6.4-12.8 million 2• 3.2-6.4 million 4• 1.6 to 3.2 million 14• 800,000 to 1.6 million 19• 400,000 to 800,000 33• 200,000 to 400,000 52• 100,000 to 200,000 99• 50,000 to 100,000 172
45
4

4
47
4
Future of Cities
48
5

49
Cities and Knowledge Creation
• Information flows intensify the need for face to face interaction
• Cities are the best provider of the social connectivity
• Cities foster central functions and specialization within global trading networks
• The internet and in person exchange are complements.
5

50
Moretti, The New Geography of Jobs
Why do innovative firms cluster near each other in expensive locations when they could be elsewhere?• No obvious natural advantage• Place matters! But why?• Productivity and creativity • Dynamic and net work advantages1. Thick labor markets– skilled workers, become more
skilled2. Knowledge spillovers: social diffusion of ideas
5

51
• Inequalities in skills have been growing over time
• Places that started more skilled have become more skilled
Glaeser, Revitalizing American Cities5
52
Dynamic AdvantagesGlobal Superstar Cities and Knowledge Economies
• Global super star cities: Innovation speeds up because smart people are connected to each other, and because they are gateways to finance, that spurs economic growth• Paradox of modern metropolis – urban proximity has
become ever more valuable even as the cost of connecting across long distances has fallen• High population densities give residents greater
opportunities for face-to-face interactions.• Result: Nonlinearity in wealth and productivity
increases by city size =>global super star cities
5
53
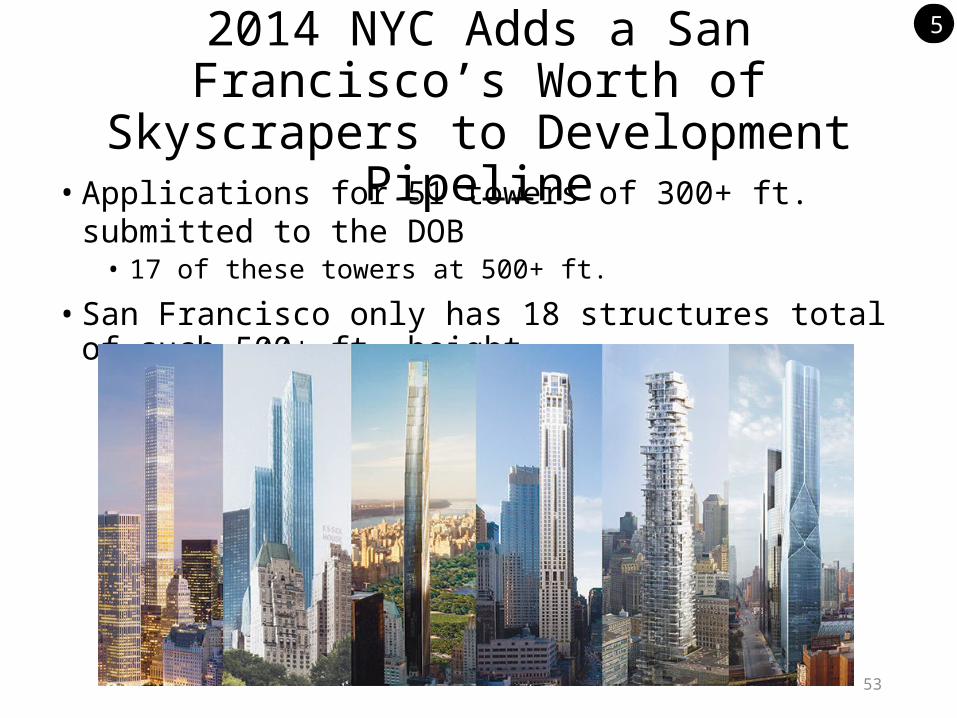
2014 NYC Adds a San Francisco’s Worth of Skyscrapers to Development Pipeline
• Applications for 51 towers of 300+ ft. submitted to the DOB• 17 of these towers at 500+ ft.
• San Francisco only has 18 structures total of such 500+ ft. height
5

54
Cities with Population >20 Million by 2025
UN World Urbanization Prospects: http://esa.un.org/unup/pdf/WUP2011_Highlights.pdf
Population (millions) 1970 1990 2011 2025Tokyo, Japan 23.3 32.5 37.2 38.7Delhi, India 3.5 9.7 22.7 32.9Shanghai, China 6 7.8 20.2 28.4Mumbai, India 5.8 12.4 19.7 26.6Mexico City, Mexico 8.8 15.3 20.4 24.6New York-Newark, USA 16.2 16.3 20.4 23.6Sao Paulo, Brazil 7.6 14.8 19.9 23.2Dhaka, Bangladesh 1.4 6.6 15.4 22.9Beijing, China 4.4 6.8 15.6 22.6Karachi, Pakistan 3.1 7.1 13.9 20.2
• In 1970, 2 cities > 10 Million
• In 2011, more than 20 cities > 10 Million
• By 2025, more than 10 cities > 20 Million
5

How Cities Respond to Markets
• If there is a market demand for development of cities:
• Cities have incentives to spur local development, to “sell” themselves to industry and employers and to build infrastructure
• Land sales in China motivated by desire to grow cities by local officials (similar to US)
55
5
Do markets or governments dictate?
• But infrastructure and government regulations determine where cities will exist as well
• Roads: national system links local areas to markets and local roads follow development if financing and incentives to provide local infrastructure
• Do cities have ability to self-finance infrastructure?
56
5

India’s Golden Quadrilateral
57
5
58
The Century of the City
• First time in world history that the majority of the globe’s population lives in cities
• Today 7 billion people worldwide; by 2050, about 9-11 billion people
• Global urban population will grow by 2-3 billion by 2050; of which, 2.5 billion will be in developing countries– In 2025 there will be more than thirty mega cities of more
than 10 million people. Before 1950 there were only 2: New York City and London
– More than 50 million move into cities each year– A city about the size of Philadelphia per week
5
World Population Continues to Grow
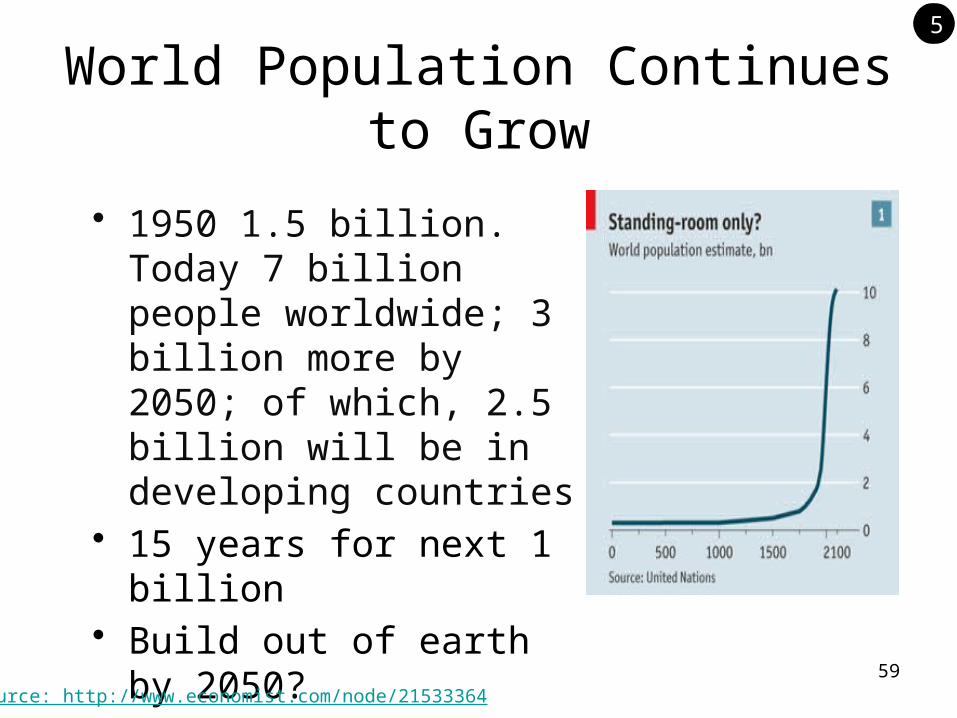
• 1950 1.5 billion. Today 7 billion people worldwide; 3 billion more by 2050; of which, 2.5 billion will be in developing countries
• 15 years for next 1 billion• Build out of earth by 2050?
Source: http://www.economist.com/node/2153336459
5

60
Future Population Growth is in Cities
Source: World Urban Prospects: UN
5

Next Class: Readings and Topic
61
6
Next Class: Readings and Topic
• DiPasquale and Wheaton, The Property and Capital Markets, Chapter 1 (BP#6)
• Wachter and Kroll, Simple Analytics of Equilibrium and Disequilibrium, (pp. 1-17) (BP#7)
62
6

Zell/Lurie Real Estate Career Fair
Friday, January 23, 2015 Houston Hall, 11 a.m. to 1:30 p.m.
Open to ALL students interested in real estate. Meet more than 100 professionals in all areas of the industry:
development, finance, management, and more.
The Zell/Lurie Real Estate Center gratefully acknowledges the Jeff T. Blau Endowment for Student Placement,
which has helped make this event possible.