real estate final - credit libanais - close to you journey, with real estate prices rising...
TRANSCRIPT
Credit Libanais Economic Research Unit
2009 2010 2011
Below 100 sqm 12.45% 6.40% 7.36%
101-150 sqm 26.31% 37.93% 45.98%
151-200 sqm 28.37% 27.17% 22.79%
201-300 sqm 16.45% 15.27% 11.01%
301-400 sqm 3.90% 1.90% 2.01%
Above 400 sqm 2.80% 2.05% 1.11%
Houses 4.59% 5.38% 6.29%
Villas 5.09% 3.91% 3.43%
Palaces 0.04% 0.00% 0.02%
Total 100% 100% 100%
Source: Order of Engineers, Credit Libanais Economic Research Unit
Breakdown of New Residential Units
Sp
ace
Are
a
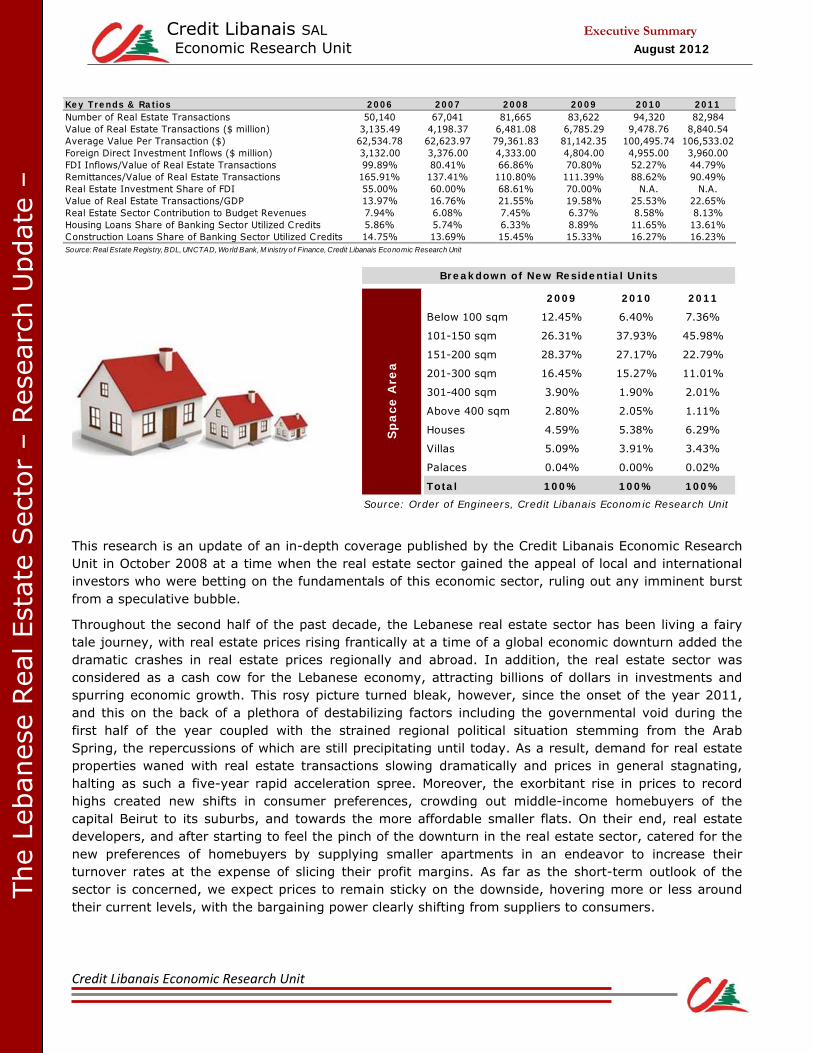
Key Trends & Ratios 2006 2007 2008 2009 2010 2011Number of Real Estate Transactions 50,140 67,041 81,665 83,622 94,320 82,984Value of Real Estate Transactions ($ million) 3,135.49 4,198.37 6,481.08 6,785.29 9,478.76 8,840.54Average Value Per Transaction ($) 62,534.78 62,623.97 79,361.83 81,142.35 100,495.74 106,533.02Foreign Direct Investment Inflows ($ million) 3,132.00 3,376.00 4,333.00 4,804.00 4,955.00 3,960.00FDI Inflows/Value of Real Estate Transactions 99.89% 80.41% 66.86% 70.80% 52.27% 44.79%Remittances/Value of Real Estate Transactions 165.91% 137.41% 110.80% 111.39% 88.62% 90.49%Real Estate Investment Share of FDI 55.00% 60.00% 68.61% 70.00% N.A. N.A.Value of Real Estate Transactions/GDP 13.97% 16.76% 21.55% 19.58% 25.53% 22.65%Real Estate Sector Contribution to Budget Revenues 7.94% 6.08% 7.45% 6.37% 8.58% 8.13%Housing Loans Share of Banking Sector Utilized Credits 5.86% 5.74% 6.33% 8.89% 11.65% 13.61%Construction Loans Share of Banking Sector Utilized Credits 14.75% 13.69% 15.45% 15.33% 16.27% 16.23%Source: Real Estate Registry, BDL, UNCTAD, World Bank, M inistry o f Finance, Credit Libanais Economic Research Unit
This research is an update of an in-depth coverage published by the Credit Libanais Economic Research Unit in October 2008 at a time when the real estate sector gained the appeal of local and international investors who were betting on the fundamentals of this economic sector, ruling out any imminent burst from a speculative bubble.
Throughout the second half of the past decade, the Lebanese real estate sector has been living a fairy tale journey, with real estate prices rising frantically at a time of a global economic downturn added the dramatic crashes in real estate prices regionally and abroad. In addition, the real estate sector was considered as a cash cow for the Lebanese economy, attracting billions of dollars in investments and spurring economic growth. This rosy picture turned bleak, however, since the onset of the year 2011, and this on the back of a plethora of destabilizing factors including the governmental void during the first half of the year coupled with the strained regional political situation stemming from the Arab Spring, the repercussions of which are still precipitating until today. As a result, demand for real estate properties waned with real estate transactions slowing dramatically and prices in general stagnating, halting as such a five-year rapid acceleration spree. Moreover, the exorbitant rise in prices to record highs created new shifts in consumer preferences, crowding out middle-income homebuyers of the capital Beirut to its suburbs, and towards the more affordable smaller flats. On their end, real estate developers, and after starting to feel the pinch of the downturn in the real estate sector, catered for the new preferences of homebuyers by supplying smaller apartments in an endeavor to increase their turnover rates at the expense of slicing their profit margins. As far as the short-term outlook of the sector is concerned, we expect prices to remain sticky on the downside, hovering more or less around their current levels, with the bargaining power clearly shifting from suppliers to consumers.
The
Leban
ese
Rea
l Est
ate
Sec
tor
– R
esea
rch U
pdat
e –
Credit Libanais SAL Executive Summary
Economic Research Unit August 2012

Credit Libanais Economic Research Unit
IMPORTANT NOTICE
This economic research publication has been prepared by the economic research unit at Credit
Libanais SAL on the basis of published information and other sources which are deemed reliable. It
is intended for limited use only and its re-distribution without the prior written consent of Credit
Libanais is strictly prohibited.
Credit Libanais does not make any warranty or representation, expressed or implied, as to the
accuracy or completeness of the materials contained herein. Neither the information nor the
opinions expressed herein constitute, or are to be construed as an offer or solicitation of an offer to
buy or sell investments. Opinions and data expressed herein are subject to change without prior
notice.
Credit Libanais Economic Research Unit
TABLE OF CONTENTS
I. DEMAND FACTORS 1
A. Real Estate Property Transactions 1
B. Shift in Consumer Behavior and New Demand Hubs 3
II. SUPPLY FACTORS 5
A. Construction Permits 6
B. Cement Deliveries 7
III. THE OFFICE MARKET 9
IV. NEW PROJECTS 10
A. Beirut Area 10
B. Metn Area 11
C. Baabda Area 12
D. Kesserwen Area 12
V. THE LEBANESE COMPANY FOR RECONSTRUCTION AND DEVELOPMENT – SOLIDERE 13
VI. CURRENT PRICES BY REGION 15
A. Beirut Region 15
B. Metn Caza 15
C. Baabda Caza 16
D. Kesserwen Caza 17
E. Aley Caza 17
VII. REAL ESTATE LENDING SCHEMES 18
VIII. TRANSPARENCY OF THE LEBANESE REAL ESTATE SECTOR 20
IX. THE IMPACT OF THE REAL ESTATE SECTOR ON THE LEBANESE ECONOMY 21
A. Contribution to Budget Revenues and Municipalities 21
B. Attraction of Foreign Direct Investments 23
X. AFFORDABILITY OF PRICES IN BEIRUT 24
XI. RENTAL YIELDS 25
XII. S.W.O.T. ANALYSIS 26
XIII. REGRESSION ANALYSIS 27

Credit Libanais Economic Research Unit
SYNOPSIS OF TERMS
“BDL” Banque du Liban
“CAGR” Compounded Annual Growth Rate
“FDI” Foreign Direct Investment
“GCC” Gulf Cooperation Council
“GDLRC” General Directorate of Land Registry & Cadastre
“IDAL” Investment Development Authority of Lebanon
“LBP” The Lebanese Pound
“PCH” Public Corporation for Housing
“Real Estate Registry” General Directorate of Land Registry & Cadastre
“SQM” Square Meters
“USD” The United States Dollar
“$” The United States Dollar

Credit Libanais Economic Research Unit
Source: General Directorate of Land Registry and Cadastre, Credit Libanais Economic Research Unit
4.20
6.48 6.79
9.488.84
4.15
67,041
81,665 83,622
94,320 82,984
34,388
0.00
1.00
2.00
3.00
4.00
5.00
6.00
7.00
8.00
9.00
10.00
0
10,000
20,000
30,000
40,000
50,000
60,000
70,000
80,000
90,000
100,000
2007 2008 2009 2010 2011 YTD June 2012
Value of Transactions ($ Billion) Number of Transactions
$ Billion
Evolutionof Value & Volume of Real Estate Transactions
I. DEMAND FACTORS
A. REAL ESTATE PROPERTY TRANSACTIONS
Demand for real estate property in Lebanon went through a roller-coaster trend over the last five years or so, in line with the twists and turns in the local and regional political scenes added a variety of economic and fundamental factors such as the Saudi stock market crash in the year 2006, the propagation of the global financial crisis in the year 2008 and the relative undervaluation of the Lebanese real estate sector back then. More particularly, Lebanon’s sound investment climate and the robustness of its banking sector portrayed it as a major hub for investments during periods of crisis. This surge in capital and Foreign Direct Investments (FDIs) inflows to Lebanon was further propelled by the Doha Accord in the year 2008 which laid the foundation for a period of political stability after two years of political squabbling, added the surge in oil prices to all-time historic highs which buoyed liquidity levels in the GCC region. This is evidenced by the rally in the number of real estate transactions at a Compounded Annual Growth Rate (CAGR) of 17.11% from 50,140 in the year 2006 to 94,320 in the year 2010 [1]. Said increase was associated with a hike in prices, as depicted by the rapid expansion in the average value per transaction from $62,534 in the year 2006 to $100,496 in the year 2010. Demand, however, waned in the year 2011, suppressed by the resignation of the national unity government which was followed by a governmental void for a period of six months coupled with the eruption of turbulences across Arab countries and especially neighboring Syria. This was reflected via a 12.02% annual drop in the number of real estate transactions to 82,984 by end of year 2011, reaching 34,388 in the first half of 2012 [1].
[1] Real Estate Registry
1

Credit Libanais Economic Research Unit
2.45% 2.38%2.53%
2.04%1.81%
1.89%
0.00%
0.50%
1.00%
1.50%
2.00%
2.50%
3.00%
2007 2008 2009 2010 2011 YTD June 2012
Sales to Foreigners as a Percentage of Total Sales
Source:GDLRC, Credit Libanais Economic Research Unit
40.54%
39.28%
36.33%
36.72% 35.73%
35.79% 31.23%
0.00%
5.00%
10.00%
15.00%
20.00%
25.00%
30.00%
35.00%
40.00%
45.00%
2006 2007 2008 2009 2010 2011 Jun‐12
Baabda Real Estate Directorate's Share of Total Real Estate Sales to Foreigners
Source: GDLRC, Credit Libanais Economic Research Unit
Baabda23.83%
Beirut7.11%
Jounieh11.38%
Metn11.99%
Zahle8.83%
Others36.85%
Breakdown of Foreign Real Estate Transactions by Region in the First Half of 2012
Source: GDLRC, Credit Libanais Economic Research Unit
The share of foreigners of total real estate sales transactions followed suit dipping form a peak of 2.53% in 2009 to 2.04% in 2010 and 1.81% in 2011. Nevertheless, foreigners’ purchase of Lebanese realties posted a slight rebound to 1.89% during the first half of 2012 [2].
In a related context, the aggravation of the political scene and devastating war in Syria prompted a number of Syrian families to evacuate the country and relocate to neighboring Lebanon. This stimulated demand for furnished apartments with no significant increase in the purchase of real estate property awaiting the outcomes of the political impasse before deciding whether to splash out or not.
Foreigners’ interest has ever since been concentrated in the Baabda and Aley cazas and most notably in areas such as Bhamdoun, Aley, and Sawfar. Accordingly, the Baabda, Aley and Chouf regions, all of which are grouped under the umbrella of the Baabda real estate registry, have since the year 2006 accounted for nearly one third of total real estate sales to foreigners. This is further validated by the following two charts:
[2] Real Estate Registry
2
Credit Libanais Economic Research Unit
9.26% 8.89%
8.21%7.92%
7.37%
7.34%
7.11%
6.00%
7.00%
8.00%
9.00%
10.00%
2006 2007 2008 2009 2010 2011 Jun‐12
Beirut Real Estate Directorate's Share of Total Real Estate Transactions
Source: GDLRC, Credit Libanais Economic Research Unit
B. SHIFT IN CONSUMER BEHAVIOR AND NEW DEMAND HUBS
The disproportionate evolution in price trends across Lebanon has caused significant shifts in consumer behavior, both on the apartment size and apartment location fronts.
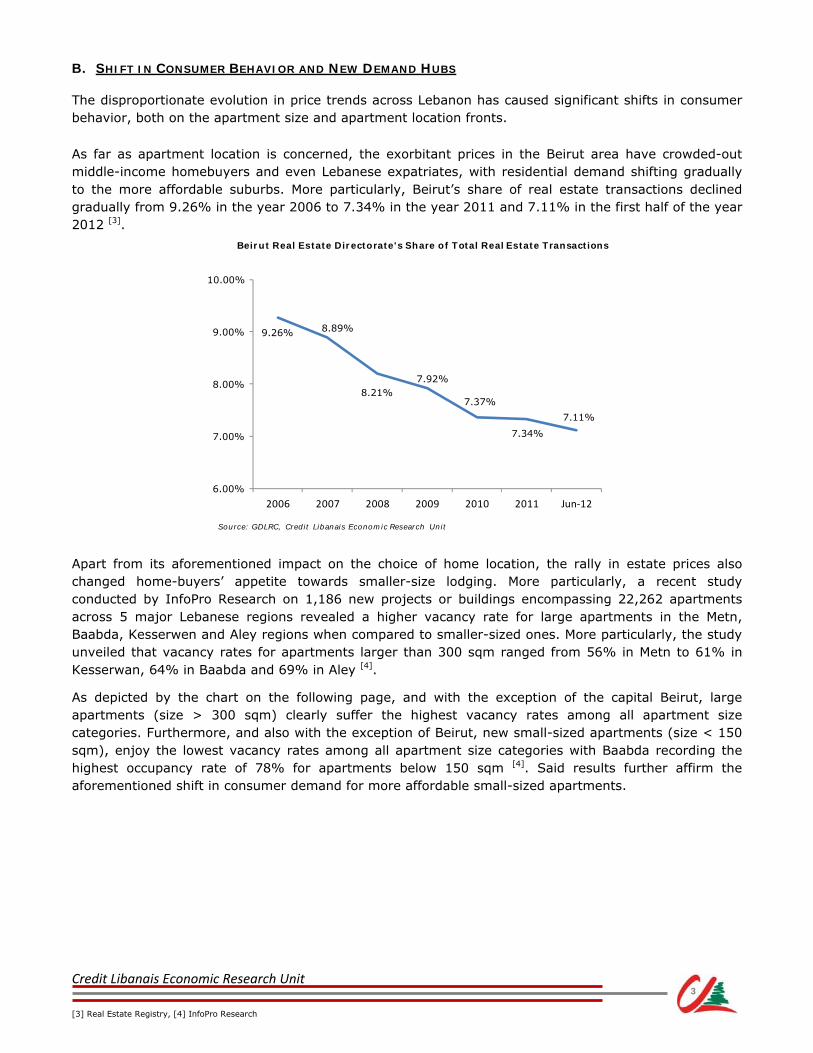
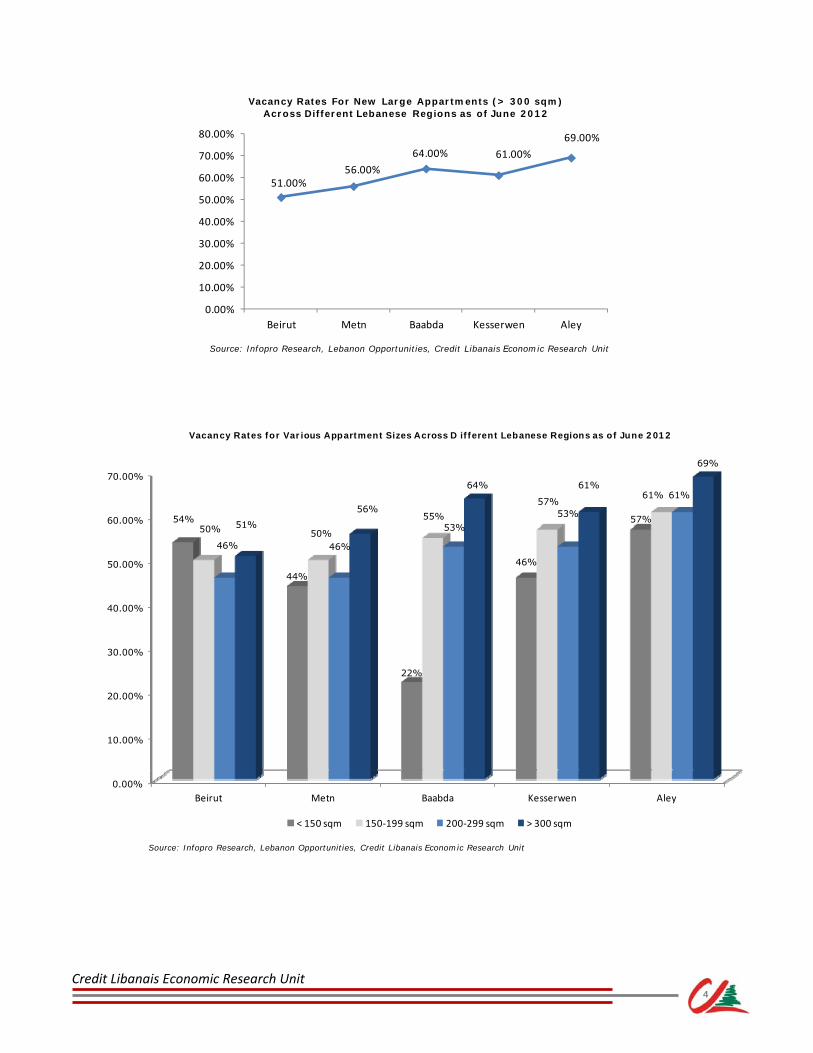
As far as apartment location is concerned, the exorbitant prices in the Beirut area have crowded-out middle-income homebuyers and even Lebanese expatriates, with residential demand shifting gradually to the more affordable suburbs. More particularly, Beirut’s share of real estate transactions declined gradually from 9.26% in the year 2006 to 7.34% in the year 2011 and 7.11% in the first half of the year 2012 [3]. Apart from its aforementioned impact on the choice of home location, the rally in estate prices also changed home-buyers’ appetite towards smaller-size lodging. More particularly, a recent study conducted by InfoPro Research on 1,186 new projects or buildings encompassing 22,262 apartments across 5 major Lebanese regions revealed a higher vacancy rate for large apartments in the Metn, Baabda, Kesserwen and Aley regions when compared to smaller-sized ones. More particularly, the study unveiled that vacancy rates for apartments larger than 300 sqm ranged from 56% in Metn to 61% in Kesserwan, 64% in Baabda and 69% in Aley [4].
As depicted by the chart on the following page, and with the exception of the capital Beirut, large apartments (size > 300 sqm) clearly suffer the highest vacancy rates among all apartment size categories. Furthermore, and also with the exception of Beirut, new small-sized apartments (size < 150 sqm), enjoy the lowest vacancy rates among all apartment size categories with Baabda recording the highest occupancy rate of 78% for apartments below 150 sqm [4]. Said results further affirm the aforementioned shift in consumer demand for more affordable small-sized apartments.
[3] Real Estate Registry, [4] InfoPro Research
3
Credit Libanais Economic Research Unit
51.00%56.00%
64.00% 61.00%
69.00%
0.00%
10.00%
20.00%
30.00%
40.00%
50.00%
60.00%
70.00%
80.00%
Beirut Metn Baabda Kesserwen Aley
Vacancy Rates For New Large Appartments (> 300 sqm) Across Different Lebanese Regions as of June 2012
Source: Infopro Research, Lebanon Opportunities, Credit Libanais Economic Research Unit
4
Vacancy Rates for Various Appartment Sizes Across D ifferent Lebanese Regions as of June 2012
0.00%
10.00%
20.00%
30.00%
40.00%
50.00%
60.00%
70.00%
Beirut Metn Baabda Kesserwen Aley
54%
44%
22%
46%
57%50% 50%
55%
57%61%
46% 46%
53%
53%
61%
51%
56%
64% 61%
69%
< 150 sqm 150‐199 sqm 200‐299 sqm > 300 sqm
Source: Infopro Research, Lebanon Opportunities, Credit Libanais Economic Research Unit
Credit Libanais Economic Research Unit
26.31%
37.93%
45.98%
28.37%
27.17% 22.79%23.15%
19.21%
14.13%
0.00%
5.00%
10.00%
15.00%
20.00%
25.00%
30.00%
35.00%
40.00%
45.00%
50.00%
2009 2010 2011
101‐150 sqm 151‐200 sqm Above 200 sqm
Evolution of Residential Building Supply by Apartment Size
Source: Order of Engineers, Credit Libanais Economic Research Unit
2009 2010 2011
Below 100 sqm 12.45% 6.40% 7.36%
101-150 sqm 26.31% 37.93% 45.98%
151-200 sqm 28.37% 27.17% 22.79%
201-300 sqm 16.45% 15.27% 11.01%
301-400 sqm 3.90% 1.90% 2.01%
Above 400 sqm 2.80% 2.05% 1.11%
Houses 4.59% 5.38% 6.29%
Villas 5.09% 3.91% 3.43%
Palaces 0.04% 0.00% 0.02%
Total 100% 100% 100%
Source: Order of Engineers, Credit Libanais Economic Research Unit
Breakdown of New Residential Units
Sp
ace
Are
a
II. SUPPLY FACTORS
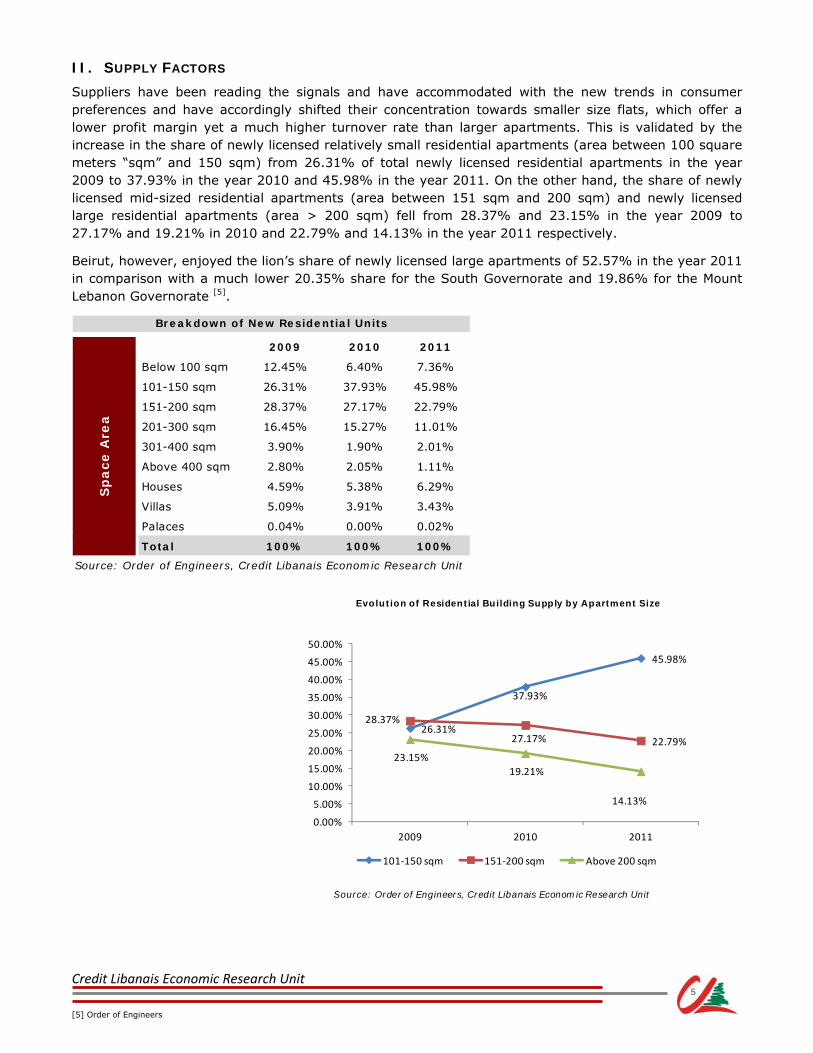
Suppliers have been reading the signals and have accommodated with the new trends in consumer preferences and have accordingly shifted their concentration towards smaller size flats, which offer a lower profit margin yet a much higher turnover rate than larger apartments. This is validated by the increase in the share of newly licensed relatively small residential apartments (area between 100 square meters “sqm” and 150 sqm) from 26.31% of total newly licensed residential apartments in the year 2009 to 37.93% in the year 2010 and 45.98% in the year 2011. On the other hand, the share of newly licensed mid-sized residential apartments (area between 151 sqm and 200 sqm) and newly licensed large residential apartments (area > 200 sqm) fell from 28.37% and 23.15% in the year 2009 to 27.17% and 19.21% in 2010 and 22.79% and 14.13% in the year 2011 respectively.
Beirut, however, enjoyed the lion’s share of newly licensed large apartments of 52.57% in the year 2011 in comparison with a much lower 20.35% share for the South Governorate and 19.86% for the Mount Lebanon Governorate [5].
[5] Order of Engineers
5
Credit Libanais Economic Research Unit
- 200 400 600 800 1,000 1,200 1,400
Beirut
Mt. Lebanon
North
Bekaa
South
Nabatieh
1,394
978
883
693
617
551
Average Sqm/Construction Permit Per Region In The Year 2011
0
2,000,000
4,000,000
6,000,000
8,000,000
10,000,000
12,000,000
14,000,000
16,000,000
2005 2006 2007 2008 2009 2010 2011 H1-2012
7,928,422 7,532,137 7,919,013
14,280,853
11,509,142
15,187,40313,889,806
6,339,246
Evolution of Construction Permits (Sqm)
12,678,492(Extrapolated Value)
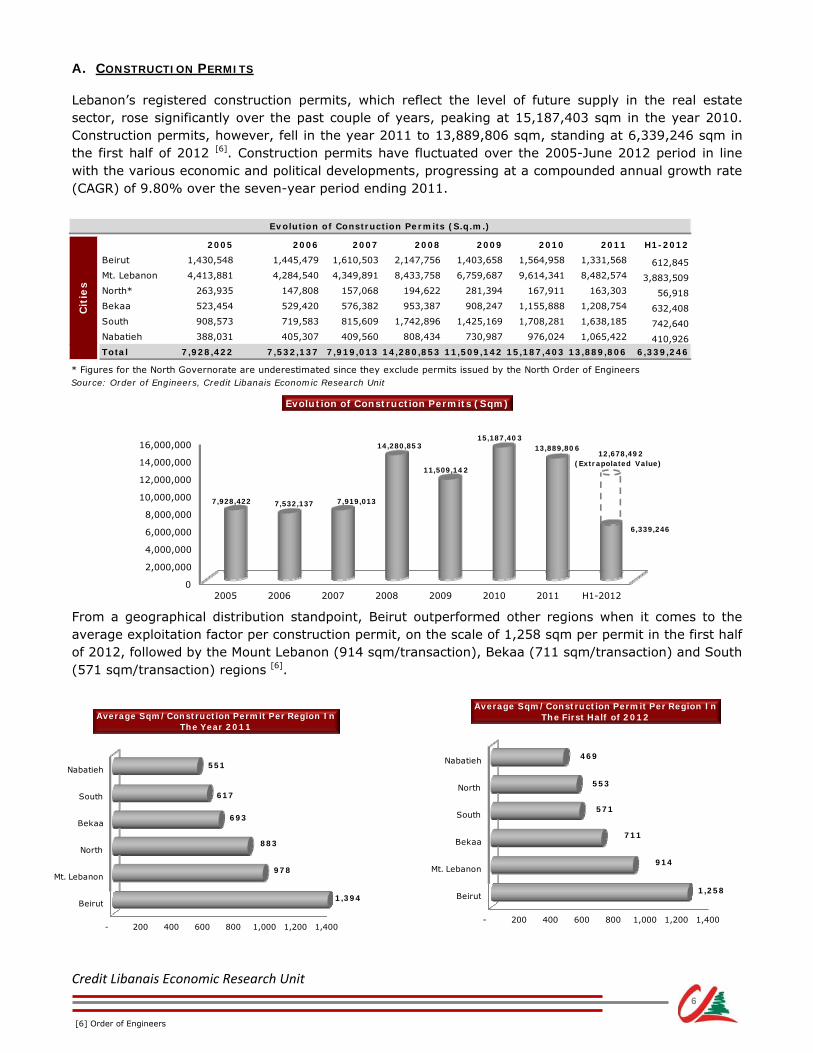
A. CONSTRUCTION PERMITS
Lebanon’s registered construction permits, which reflect the level of future supply in the real estate sector, rose significantly over the past couple of years, peaking at 15,187,403 sqm in the year 2010. Construction permits, however, fell in the year 2011 to 13,889,806 sqm, standing at 6,339,246 sqm in the first half of 2012 [6]. Construction permits have fluctuated over the 2005-June 2012 period in line with the various economic and political developments, progressing at a compounded annual growth rate (CAGR) of 9.80% over the seven-year period ending 2011.
From a geographical distribution standpoint, Beirut outperformed other regions when it comes to the average exploitation factor per construction permit, on the scale of 1,258 sqm per permit in the first half of 2012, followed by the Mount Lebanon (914 sqm/transaction), Bekaa (711 sqm/transaction) and South (571 sqm/transaction) regions [6].
[6] Order of Engineers
6
2005 2006 2007 2008 2009 2010 2011 H1-2012
Beirut 1,430,548 1,445,479 1,610,503 2,147,756 1,403,658 1,564,958 1,331,568 612,845Mt. Lebanon 4,413,881 4,284,540 4,349,891 8,433,758 6,759,687 9,614,341 8,482,574 3,883,509North* 263,935 147,808 157,068 194,622 281,394 167,911 163,303 56,918Bekaa 523,454 529,420 576,382 953,387 908,247 1,155,888 1,208,754 632,408South 908,573 719,583 815,609 1,742,896 1,425,169 1,708,281 1,638,185 742,640Nabatieh 388,031 405,307 409,560 808,434 730,987 976,024 1,065,422 410,926Total 7,928,422 7,532,137 7,919,013 14,280,853 11,509,142 15,187,403 13,889,806 6,339,246
* Figures for the North Governorate are underestimated since they exclude permits issued by the North Order of EngineersSource: Order of Engineers, Credit Libanais Economic Research Unit
Cit
ies
Evolution of Construction Permits (S.q.m.)
- 200 400 600 800 1,000 1,200 1,400
Beirut
Mt. Lebanon
Bekaa
South
North
Nabatieh
1,258
914
711
571
553
469
Average Sqm/Construction Permit Per Region In The First Half of 2012

Credit Libanais Economic Research Unit
According to the Order of Engineers’ 2011 annual report, 83.06% of construction permits for new buildings was geared towards residential use (7.4 million sqm), followed by commercial use (6.91%), economic (4.77%) use, and hotels & tourism services (2.61%) [7].
B. CEMENT DELIVERIES
Notwithstanding the volatile trend in construction permits over the 2005-May 2012 period, cement deliveries, the coincident indicator of construction activity, have been on the rise post Israeli aggression on Lebanon, embracing Lebanon’s long reconstruction journey. Total cement deliveries reached 2,074.8 thousand tons as at end of May 2012 and 5,549.8 thousand tons in the full year 2011 up from 3,039.6 thousand tons in 2005 [8]. The compounded annual growth rate in cement deliveries stood at 10.55% over the period extending between 2005 and 2011.
[7] Order of Engineers, [8] BDL
7
Area (S.q.m.) % of Total Area (S.q.m.) % of Total
Residential Buildings 8,203,193 83.21% 7,401,311 83.06%
Commercial Buildings 597,703 6.06% 616,185 6.91%
Economic Sector Buildings (Agriculture, Industry) 520,080 5.28% 424,818 4.77%
Hotels & Tourism Services Buildings 155,819 1.58% 232,453 2.61%
Public Buildings (Administrative, Social & Cultural) 271,954 2.76% 132,078 1.48%
Public Services Buildings (schools, hospitals, etc.) 109,194 1.11% 104,399 1.17%Total 9,857,943 100% 8,911,244 100%
Source: Order of Engineers, Credit Libanais Economic Research Unit
Pu
rpo
se
of
Use
Breakdown of Construction Permits for New Buildings By Purpose of Use
2010 2011
Residential Buildings, 83.06%
Commercial Buildings, 6.91%
Economic Sector Buildings ,
4.77%
Hotels & Tourism Services
Buildings, 2.61% Public Buildings, 1.48% Public Services
Buildings , 1.17%
Breakdown of Construction Permits for New Buildings By Purpose of Use In The Year 2011
2005 3,039,622
2006 3,422,927
2007 3,944,945
2008 4,219,257
2009 4,897,460
2010 5,226,621
2011 5,549,769
May-2012 2,074,803
Source:BDL, Credit Libanais Economic Research Unit
Evolution of Cumulative Cement Deliveries
To
ns
0
1,000,000
2,000,000
3,000,000
4,000,000
5,000,000
6,000,000
3,039,6223,422,927
3,944,9454,219,257
4,897,4605,226,621
5,549,769
2,074,803
Evolution of Cement Deliveries (Tons)
4,979,527(Extrapolated Value)

Credit Libanais Economic Research Unit
Country CityOccupancy Cost
€/sqm/YearRank2012
Hong Kong Hong Kong 2,026 1
United Kingdom London 1,978 2
Japan Tokyo 1,635 3
Russia Moscow 1,223 4
China Beijing 1,082 5
United States New York 992 6
Australia Sydney 987 7
Brazil Rio de Janeiro 904 8
France Paris 875 9
Switzerland Zurich 809 10
United Arab Emirates Abu Dhabi 508 20
Netherlands Amsterdam 506 21
Lebanon Beirut 492 22
Greece Athens 483 23
Spain Madrid 476 24
Vietnam Hanoi 452 25
Source: Cushman & Wakefield, Credit Libanais Economic Research Unit
-9%
13%
0%
-12%
-6%
-15%
-10%
-5%
0%
5%
10%
15%
Annual Office Rental Growth in The Middle East Region in 2011
Source: Cushman & Wakefield, Credit Libanais Economic Research Unit
III. THE OFFICE MARKET
The dynamics governing the office market in Lebanon differ from those controlling the residential market. This was particularly evidenced in the year 2011 when office rental prices burgeoned amid a general stagnation in residential real estate prices. In fact, Beirut was one of the few cities in the Middle East region to witness a rise in office rent in the year 2011, registering the third highest growth rate (13%) in the Europe, Middle East and Africa (“EMEA”) region. In addition, Beirut ranked 22nd among the most expensive office markets worldwide, with an annual occupancy cost of €492/sqm during the year 2012. According to Cushman & Wakefield, a commercial real estate services firm, the “scarcity of high quality space” in Beirut triggered an increase in office rental prices during the year 2011, a trend which is anticipated to be sustainable during the year 2012 [9].
[9] Cushman & Wakefield
8

Credit Libanais Economic Research Unit
342
398 380427
492
0
100
200
300
400
500
600
2008 2009 2010 2011 2012
Evolution of Annual Office Rental Costs/sqm in Beirut
in €
Source: Cushman & Wakefield, Credit Libanais Economic Research Unit
Total Number of Shopping Malls 6
Total Number of Stores in Malls 720
Total Gross Leasable Area (GLA) in Malls (SQM) 197,000
Average Occupancy Rate in Malls 85%-95%
Average Rental Value in Malls ($/SQM/Year) 1,000 - 1,500
Source: Ramco
Malls in Greater Beirut & Suburbs
Are
a
Historically, office rental costs have been on the rise in general in the Beirut area, and this owing primarly to a lack in Grade A (premium) supply, the thing which mitigates any curtailement in demand resulting from political deadlock. More particularly, annual office rental cost in the Beirut area increased form €342/sqm in the year 2008 to €492/sqm in the year 2012, registering a CAGR of 9.52%.
Further on the commercial front and according to the quarterly report of the Lebanese real estate consultancy firm “RAMCO”, the Greater Beirut area hosts 6 shopping malls, namely ABC Dbayeh, ABC Ashrafieh, CityMall, Beirut Mall, Le Mall Sin el Fil and Beirut Souks. Said malls house some 720 stores spread over 197 thousand sqm. Malls in Beirut enjoy a high average occupancy rate of 85%-95% with the average rental value ranging between $1,000/sqm/year and $1,500 /sqm/year. In addition, Beirut entails six shopping centers including Sodeco Square, Dunes, Verdun 730, Verdun 732, Concorde Galleria and Galaxy.
9

Credit Libanais Economic Research Unit
IV. NEW PROJECTS
The following section captures some landmark projects currently in the pipeline across different Lebanese regions:
A. BEIRUT AREA
- Plus Towers Solidere: Developed by Bachoura 1542 s.a.l and Bachoura 1525 s.a.l, subsidiaries of Plus Properties. Located at the heart of the central district, the project comprises apartments ranging between 185 sqm and 590 sqm. Expected delivery date is in the year 2013.
- Venus Towers: Developed by Venus Real Estate Development company. Located in the Solidere
area, the project comprises three towers with the number of storeys ranging between 19 and 30. Apartment sizes, on the other hand, range between 256 sqm and 1,180 sqm.
- Credit Libanais Headquarters: Developed by ERGA group with MAN enterprise acting as the main contractor. Located in the Ashrafieh area on plot number 5589, the project spans over 37 storeys, four of which are underground hosting a total of 500 cars approximately. The project will enjoy several environmental aspects and will offer various amenities including a nursery, a cafeteria and a gymnasium. The project is expected to be completed by March 2014.
- Achrafieh 5403: Developed by Cedars company, a seven-storey building with apartment sizes
ranging between 213 sqm and 235 sqm. Expected delivery date is November 2013, with selling prices starting at $3,300/sqm.
- Jeanne d’Arc 233: Developed by YM Development company. Apartment sizes range between 160 sqm and 240 sqm. Expected delivery date is in March 2015. Selling prices start at $3,800/sqm.
- Trilium Project: Developed by Mercury Development and located in the Ashrafieh area. The project comprises three towers with the number of storeys ranging between 20 and 25 and apartment sizes ranging between 140 sqm and 200 sqm. The project also comprises a commercial building and retail outlets.
- Vermelho Hamra: Developed by Mercury Development and Ideal Development. Apartment sizes stand at 160 sqm. Expected delivery date is in December 2014. Selling prices start at $3,800/sqm.
- 20|30 Beirut: Developed by Jamil Saab & Co. and located in the Ashrafieh – Furn el Hayek area. Apartment sizes range between 400 sqm and 600 sqm. Expected delivery date is in June 2015. Selling prices start at $5,000/sqm.
- Verdun Gardens: Developed by Horizon Development and located in the Verdun area. Apartment sizes average 570 sqm with selling prices starting at $5,500/sqm.
- Sama Beirut: Developed by Antonios Projects with MAN enterprise acting as the main contractor.
The project, located in the Sodeco area, comprises a 50-storey tower, which when completed would be the tallest of its kind in Lebanon with its roof standing at 256 meters above sea level. The project fuses residential (66 apartments with their size ranging between 300 sqm and 1,500 sqm), office (7 floors) and commercial space with expected delivery scheduled for mid 2014.
10
Credit Libanais Economic Research Unit
- Trabaud 1804: Developed by Capstone Investment Group, the project is located in the Ashrafieh – Trabaud area. The $50 million project comprises a 23-storey tower, with apartment sizes ranging between 294 sqm and 445 sqm. Expected delivery date is in September 2014.
- L’Heritage de Abdel Wahab: Developed by Capstone Investment Group, the project is located in
the Ashrafieh – Abdel Wahab El Inglizi area. The $20 million project consists of a 12-storey building, with apartment sizes ranging between 165 sqm and 350 sqm. Expected delivery is by end of 2014.
- Zaytouna Bay: A joint venture between Solidere and Staw company, the project lies at the
waterfront of Beirut near the St. George Hotel. The $200 million project spans over an area of over 2,000 sqm and comprises over 20 local and international restaurants.
B. METN AREA
- Crystal Towers Antelias: Developed by SAYFCO, a $100 million project spanning over an area of 30,000 sqm. The project consists of two towers, one 30-floor residential tower with apartment sizes ranging between 170 sqm and 255 sqm and one 20-floor commercial tower with office spaces starting from 120 sqm.
- Horizon Dbaye: Developed by SAYFCO, a $70 million project spanning over an area of 40,000 sqm. The project consists of 169 apartments with their sizes ranging between 145 sqm and 310 sqm added a semi Olympic pool and lavish gardens.
- Abraj Jdeideh: Developed by SAYFCO, a $60 million project spanning over an area of 40,000 sqm. The project consists of 270 apartments with their sizes ranging between 122 sqm and 166 sqm added a bunch of amenities including basketball/tennis courts.
- Tilal Bhersaf: Developed by Reef Middle East s.a.l, a subsidiary of Plus Properties and spanning over an area of 21,000 sqm. The project comprises 15 buildings with the apartment size ranging between 197 sqm and 638 sqm. Expected delivery date is in the year 2013.
- Monteverde 81: Developed by Monteverde 81 s.a.l, a subsidiary of Plus Properties. The project comprises 2 residential buildings with apartment size ranging between 179 sqm and 468 sqm. Expected delivery date is in the year 2013.
- Fanar Residence: Developed by Societe Generale pour L'habitat s.al. The project comprises 3 U-shaped blocks with apartment size ranging between 127 sqm and 210 sqm.
- Jadev Residences: Developed by Mouawad Residences and located in the Bsalim area. Apartment sizes range between 207 sqm and 265 sqm. Expected delivery date is December 2014. Selling prices are at $2,000/sqm.
- Waterfront City: Located in the Dbayeh area, this project is a joint venture between real estate developer Joseph Khoury Holding and Dubai-based Majid al-Futtaim properties. The $2 billion project will be allocated over four phases, the first phase of which will consist of seven buildings comprising residential units, restaurants, cafés, and a retail zone. Selling prices for residential units range between $2,800/sqm and $6,000/sqm.
11
Credit Libanais Economic Research Unit
C. BAABDA AREA
- Beirut City Center: Centrally located in Hazmieh, and developed by Majid al-Futtaim properties, the Beirut City Center is a $300 million shopping mall that spans over an area 13,000 sqm. Beirut City Center will offer over 200 specialty stores in addition to a full service Carrefour hypermarket, an 8-screen multiplex cinema, and 40 different food and beverage outlets. The expected launching date is scheduled for 2013.
- Yarze 76: Developed by Yarze 2376 s.a.l, a subsidiary of Plus Properties and spanning over an area
of 1,251 sqm. Apartment size ranges between 212 sqm and 896 sqm. Expected delivery date is in the year 2013.
- Yarze Gardens: Developed by Yarze Garden s.a.l, a subsidiary of Plus Properties. The project comprises a four-storey building with apartment sizes ranging between 269 sqm and 783 sqm. Expected delivery date is in the year 2013.
- Al-Mandaloun 3110: Developed by Al-Mandaloun 3110 s.a.l, and located in the Yarzé area. The project consists of one building with apartment sizes ranging between 255 sqm and 275 sqm. Delivery is scheduled for October 2013, with selling prices set at $3,500/sqm.
D. KESSERWEN AREA
- Les Suites de Faqra: Developed by SAYFCO, a $75 million project spanning over an area of 18,000 sqm. The project consists of 110 high-end suites allocated over four types namely Junior (75 sqm), Deluxe (110 sqm), Garden (135 sqm) and Presidential (215 sqm and 230 sqm).
- Les Villettes de Kfardebian: Developed by SAYFCO, a $35 million project spanning over an area of 10,000 sqm. The project consists of 25 villas with their sizes ranging between 290 sqm and 650 sqm.
12

Credit Libanais Economic Research Unit
StatusNumber of Projects
BUA SQM
Completed 272 1,375,455
Under Restoration 6 12,543
Under Construction 41 383,562
Awaiting Permit 18 307,069
Under Study 34 504,781
No Activity 7 16,632
Awaiting Submission 13 395,834
Total 391 2,995,876
Land Use BUA SQM % of Total
Residential 1,362,037 45.46%
Office 699,088 23.34%
Commercial 146,122 4.88%
Hotel & Furnished Apartments 266,080 8.88%
Mixed-Use 323,626 10.80%
Government & Public Utilities 131,782 4.40%
Religious & Cultural Institutions 67,141 2.24%
Total 2,995,876 100.00%
Source: Solidere
Snapshot on Solidere's Projects' Status & Purpose of Use As Of June 2012
De
ve
lop
me
nt
Sta
ge
La
nd
Use
Dis
triu
tio
n
4.9 4.78.3
18.016.0
23.0
16.5
24.0
18.514.4
13.85.3 5.5 8.8
19.5
26.525.2
40.0
28.0 24.620.9
15.0
0
5
10
15
20
25
30
35
40
45
2002 2003 2004 2005 2006 2007 2008 2009 2010 2011 Up To July 2012
$Evolution of Solidere Class A Shares' Prices
Closing Price Highest Price
V. THE LEBANESE COMPANY FOR RECONSTRUCTION AND DEVELOPMENT – SOLIDERE
The Lebanese Company For Reconstruction and Development of Beirut Central District S.A.L. (Solidere) is a Lebanese joint-stock company incorporated on May 5, 1994 and specializes in real estate development activities and services. Solidere was behind the reconstruction of the Beirut Central District (BCD) including the financing and development of BCD’s infrastructure, the erection of new buildings, the restoration of existing ones, and the sale and/or lease of real estate properties and land parcels.
Solidere floats its shares (100 million Class A shares & 65 million Class B shares) on the Beirut Stock Exchange, while listing its Global Depository Receipts (GDRs) on the London Stock Exchange. The exchange’s heavyweight stock is viewed as a mirror image for Lebanon’s political arena. More specifically, we have seen the prices of Solidere A & B shares peak at $40 and $39.9 respectively in the year 2008 in the aftermath of the Doha accord, before slipping progressively to reach $13.75 and $13.80 as at end of July 2012 amid the various endogenous and exogenous shocks that stroke Lebanon and the region since early 2011 [10].
According to Solidere’s quarterly report, the company’s total number of completed projects since its establishement has reached 272 as at the end of the first half of 2012 spread over a total built-up area of 1,375,455 sqm. The company is hosting on its agenda 41 projects that are still under construction and 34 currently under study. The bulk of projects launched by Solidere are of a residential nature (45.46% of total projects in terms of total built-up area), followed by office buildings (23.34%), mixed-use projects (10.80%) and hotel & furnished apartments (8.88%) as elaborated below [10]:
4.8 5.08.1
18.016.0
22.7
16.7
23.8
18.614.5
13.85.5 5.5 8.8
19.3
26.425.6
39.9
27.9 24.321.0
14.8
0
5
10
15
20
25
30
35
40
45
2002 2003 2004 2005 2006 2007 2008 2009 2010 2011 Up To July 2012
$Evolution of Solidere Class B Shares' Prices
Closing Price Highest Price
[10] Solidere
13

Credit Libanais Economic Research Unit
The financial performance of the Lebanese Company for Reconstruction and Development of the Beirut Central District “Solidere” is significantly tied to the overall local and regional political environment. This is reflected by the company’s stellar performance in the year 2008 when net profits reached $224.2 million following the regained political stability. Said figure compares to a much lower $108.5 million in 2005, $132.2 million in 2006 and $182.7 million in 2007 at a time when the Beirut Central District’s activity was paralyzed by the assassination of the former Prime Minister, Mr. Rafik Hariri, which marked the beginning of a series of traumatic events including serial assassinations of politicians, journalists and other Lebanese personalities added the opposition’s 18-month sit-in in the BCD. Solidere’s 2011 audited financial statements reported a 17.26% drop in net consolidated profits to $158.8 million, down from $195.5 million in the year 2010 [11]. This comes in light of the escalating local and regional political impasse which erupted in early 2011 with the outbreak of the Arab Spring revolutions. Said stalemate had cast its shadows on the Lebanese economy as a whole, and more particularly, on the country’s trade activity and real estate sector throughout the year. The bulk of the company’s income stems from closed deals on property & land sales, reaching $241.7 million during the full year 2011, down from $337.2 million in 2010, while gross rental income rose to $49.9 million in comparison with $41.2 million in 2010. Sales backlog, which represent the deals negotiated but not closed yet, fell to $40 million in 2011 comparing with $77.5 million in the preceding year [11].
$ Million 2002 2003 2004 2005 2006 2007 2008 2009 2010 2011
Sales of Land and Real Estate Properties
128.9 87.0 169.4 252.8 255.2 256.6 288.5 305.1 337.2 241.7
Gross Rental Income 14.1 15.4 18.6 20.8 20.7 21.7 20.8 27.3 41.2 49.9
General and Administrative Expenses 9.3 9.2 10.1 11.5 14.3 19.3 18.1 24.3 42.7 38.2
Net Income 41.1 16.4 54.1 108.5 132.2 182.7 224.2 189.2 195.5 158.8
Earnings Per Share ($) 0.265 0.104 0.340 0.686 0.838 1.178 1.445 1.235 1.285 1.029
Sales Backlog 95.0 67.0 78.5 1,119.2 1,196.0 605.5 914.1 428.5 77.5 40.0
Source: Solidere, Credit Libanais Economic Research Unit
Fin
an
cia
l H
igh
lig
hts
Solidere's Key Financials
0
50
100
150
200
250
300
350
2002 2003 2004 2005 2006 2007 2008 2009 2010 2011
128.9
87.0
169.4
252.8 255.2 256.6288.5
305.1337.2
241.7
14.1 15.4 18.6 20.8 20.7 21.7 20.8 27.341.2
49.9
Evolution of Solidere's Income From Real Estate Properties Sales & Rental
Sales of Land and Real Estate Properties Gross Rental Income
$ Million
0
50
100
150
200
250
2002 2003 2004 2005 2006 2007 2008 2009 2010 2011
41.1
16.4
54.1
108.5
132.2
182.7
224.2
189.2 195.5
158.8
Evolution of Solidere's Net Income
$ Million
[11] Solidere
14

Credit Libanais Economic Research Unit
0.31%
30.98%
21.02%
47.69%
< 2000 $/sqm $2,000 ‐ $3,000 $/sqm
$3,000 ‐ $3,999 $/sqm > $4,000 $/sqm
Breakdown of New Apartment Prices in the Beirut Region
Source: Infopro Research, Lebanon Opportunities, Credit Libanais Economic Research Unit
16%
46%
58%
49%
0%
10%
20%
30%
40%
50%
60%
70%
< 2000 $/sqm $2,000 ‐ $3,000 $/sqm
$3,000 ‐ $3,999 $/sqm
> $4,000 $/sqm
Vacancy Rates For New Appartments In the Beirut Region
Source: Infopro Research, Lebanon Opportunities, Credit Libanais Economic Research Unit
VI. CURRENT PRICES BY REGION
A. BEIRUT REGION
Real estate prices vary across Lebanese regions depending on a variety of factors namely proximity to the capital Beirut, ease of accessibility to economic centers, congestion, elevation, and climate. Obviously, the capital Beirut, being the economic center of the country and one of the major economic hubs in the Middle East region, enjoys and by far the highest price levels across Lebanese regions. More particularly, and according to a survey conducted by InfoPro Research in June 2012, nearly half (47.69%) of new apartments in Beirut are priced above $4,000/sqm with the share of new apartments priced below $2,000/sqm representing a meager 0.31%. In terms of vacancy rates, apartments priced below $2,000/sqm enjoy the lowest vacancy rate (16%) among all price categories with those priced above $4,000/sqm (vacancy rate of 49%) faring better than apartments priced between $3,000/sqm and $4,000/sqm (vacancy rate of 58%) [12].This may be explained by an inclination from wealthy home-buyers to favor high-end apartments in the Beirut region over medium-quality apartments.
B. METN CAZA
The Metn Region is one of the few regions in Lebanon to have maintained a somewhat steady demand for realty notwithstanding the general slowdown in the Lebanese real estate sector, and this on the back of its close proximity to Beirut on the one hand added its relatively reasonable price levels on the other hand. It is worth noting that prices in the Metn region accelerated rapidly over the last couple of years, buoyed by a vivid demand from middle-income homebuyers crowded-out by the prices in the Beirut region. However, it is worth pointing out, in this context, that demand is not monotonic across the Metn region, with areas at a close proximity to the Mkalles roundabout such as Dekwaneh, Mansourieh, Rawda, Mar Roukoz, and Ain Saadeh faring better than the areas of Rabieh and Rabweh due to the congestion created by the Antelias bottleneck. As highlighted before, prices in the Metn region remain pretty much affordable, with around 63% of new apartments priced at below $2,000/sqm and only some 2.90% priced at above $3,000/sqm, with said prices corresponding to the lavish areas of Monteverde, Rabieh and Horsh Tabet. As far as vacancy rates are concerned, new apartments priced above the $3,000/sqm level suffer the highest vacancy rates (61%) while apartments falling in the price bracket $2,500/sqm-$2,999/sqm enjoy the lowest vacancy rates as captured by the pie chart below [12].
[12] InfoPro Research
15

Credit Libanais Economic Research Unit
62.82%
19.79%
14.50%2.90%
< 2000 $/sqm $2,000 ‐ $2,400 $/sqm
$2,500 ‐ $3,000 $/sqm > $3,000 $/sqm
Breakdown of New Apartment Prices in the Metn Region
Source: Infopro Research, Lebanon Opportunities, Credit Libanais Economic Research Unit
29.52%
20.36%
32.38%
16.24%1.51%
< 1,500 $/sqm $1,500 ‐ $1,999 $/sqm $2,000 ‐ $2,999 $/sqm
$3,000 ‐ $3,999 $/sqm > $4,000 $/sqm
Breakdown of New Apartment Prices in the Baabda Region
Source: Infopro Research, Lebanon Opportunities, Credit Libanais Economic Research Unit
24%
54%51%
70%67%
0%
10%
20%
30%
40%
50%
60%
70%
80%
< 1,500 $/sqm $1,500 ‐ $1,999 $/sqm
$2,000 ‐ $2,999 $/sqm
$3,000 ‐ $3,999 $/sqm
> $4,000 $/sqm
Vacancy Rates For New Appartments In the Baabda Region
Source: Infopro Research, Lebanon Opportunities, Credit Libanais Economic Research Unit
49%
55%
34%
61%
0%
10%
20%
30%
40%
50%
60%
70%
< 2000 $/sqm $2,000 ‐$2,400 $/sqm
$2,500 ‐ $3,000 $/sqm
> $3,000 $/sqm
Vacancy Rates For New Appartments In the Metn Region
Source: Infopro Research, Lebanon Opportunities, Credit Libanais Economic Research Unit
C. BAABDA CAZA
Like the Metn region, the Baabda caza also lies at a very close proximity to the capital Beirut, with many of its affiliated areas such as Furn el Chebbak, Ain el Remmaneh, Chiyah, Haret Hreik, and Hazmieh, being suburbs of the Lebanese capital. In addition, and as is the case with the Metn caza, the Baabda caza witnessed a stellar increase in real estate prices over the last couple of years owing to the crowding out of middle-income homebuyers from Beirut. Prices in the Baabda caza remain quite affordable, apart from some luxurious areas such as Yarze, Baabda, and Hazmieh, with around 50% of new apartments selling at below $2,000/sqm and only a mere 1.51% priced at above $4,000/sqm. Apartments selling at below $1,500/sqm have very low vacancy rates of 24% given their affordability, in comparison with vacancy rates of 67% for apartments selling at above $4,000/sqm and 70% for those priced between $3,000/sqm and $4,000/sqm [13].
[13] InfoPro Research
16

Credit Libanais Economic Research Unit
28.19%
35.44%
21.73%
12.31%2.33%
< 1,500 $/sqm $1,500 ‐ $1,999 $/sqm $2,000 ‐$2,999 $/sqm
$3,000 ‐ $3,999 $/sqm > $4,000 $/sqm
Breakdown of New Apartment Prices in the Kesserwen Region
Source: Infopro Research, Lebanon Opportunities, Credit Libanais Economic Research Unit
54% 54%62%
32%
75%
0%
10%
20%
30%
40%
50%
60%
70%
80%
< 1,500 $/sqm $1,500 ‐ $1,999 $/sqm
$2,000 ‐ $2,999 $/sqm
$3,000 ‐ $3,999 $/sqm
> $4,000 $/sqm
Vacancy Rates For New Appartments In the Kesserwen Region
Source: Infopro Research, Lebanon Opportunities, Credit Libanais Economic Research Unit
D. KESSERWEN CAZA
Unlike the Baabda and Metn regions, the Kesserwen region lies at some remote distance from Beirut, with none of its areas being a suburb of the Lebanese capital. However, it is not the distance from the capital that keeps the prices in the Kesserwen region somewhat tamed, especially when compared to those in the Metn and Baabda areas, but rather the numerous bottlenecks separating the Kesserwen region fom Beirut. From a pricing perspective, some 63% of the new apartments in the Kesserwen region are selling at below $2,000/sqm with their vacancy rates standing at around 54% in comparison with vacancy rates of 36.59% and 49% for their peers in the Baabda and Metn regions on a respective basis [14].
E. ALEY CAZA
The Aley region remains much more affordable than the four aforementioned regions, despite having some of its areas at a close proximity to Beirut. More particularly, some 95% of the new apartments in the Aley region are selling at below $2,000/sqm with Bchamoun and Aramoun enjoying some of the most affordable real estate prices along the periphery of the capital. Notwithstanding the affordability of prices, demand remains somewhat subdued for the Aley region with an average vacancy rate of 60% for new apartments [14]. Supply has reacted in response to the tamed demand, with the Aley region having the fewest number of projects in the market in the year 2011.
65.21%
30.08%
4.71%
< 1,500 $/sqm $1,500 ‐ $1,999 $/sqm > $2,000 $/sqm
Breakdown of New Apartment Prices in the Aley Region
Source: Infopro Research, Lebanon Opportunities, Credit Libanais Economic Research Unit
62%
53%
74%
0%
10%
20%
30%
40%
50%
60%
70%
80%
< 1,500 $/sqm $1,500 ‐$1,999 $/sqm > $2,000 $/sqm
Vacancy Rates For New Appartments In the Aley Region
Source: Infopro Research, Lebanon Opportunities, Credit Libanais Economic Research Unit
[14] InfoPro Research
17

Credit Libanais Economic Research Unit
1,1381,322
1,768
2,805
4,511
5,982
15.2%16.2%
33.7%
58.6% 60.8%
32.6%
0.00%
10.00%
20.00%
30.00%
40.00%
50.00%
60.00%
70.00%
0
1,000
2,000
3,000
4,000
5,000
6,000
7,000
2006 2007 2008 2009 2010 2011
Residential Loans % Growth in Housing Loans
in $ Million Evolution of Housing Loan's Portfolio at Lebanese Banks
Source: Lebanese Central Bank, Credit Libanais Economic Research Unit
VII. REAL ESTATE LENDING SCHEMES
The housing loan’s portfolio at Lebanese banks has accelerated remarkably over the last couple of years nearing $6 billion in the year 2011 in comparison with just $1.13 billion in 2006 [15]. More particularly, the stellar performance of the housing loan’s portfolio was mainly witnessed during the years 2008, 2009 and 2010 amid the robust demand for real estate property coupled with the Public Corporation for Housing’s decision to raise the loan ceiling at several occasions from $80,000 to $120,000 and finally to $180,000. Growth in real estate loans fell to 32.6% in the year 2011 down from 60.8% in 2010 and 58.6% in 2009 owing to rising political tensions which drove home buyers to be more coy on splashing out on real estate.
Lebanese banks offer a variety of housing loans, some of which are tailored by banks while the others are the fruit of the collaboration between banks with the Public Corporation for Housing on the one hand and the Lebanese Central Bank on the other. In addition, the Housing Bank (Banque de L’Habitat), which is a privately owned bank, specializes in extending housing loans for the financing of home ownership in Lebanon.
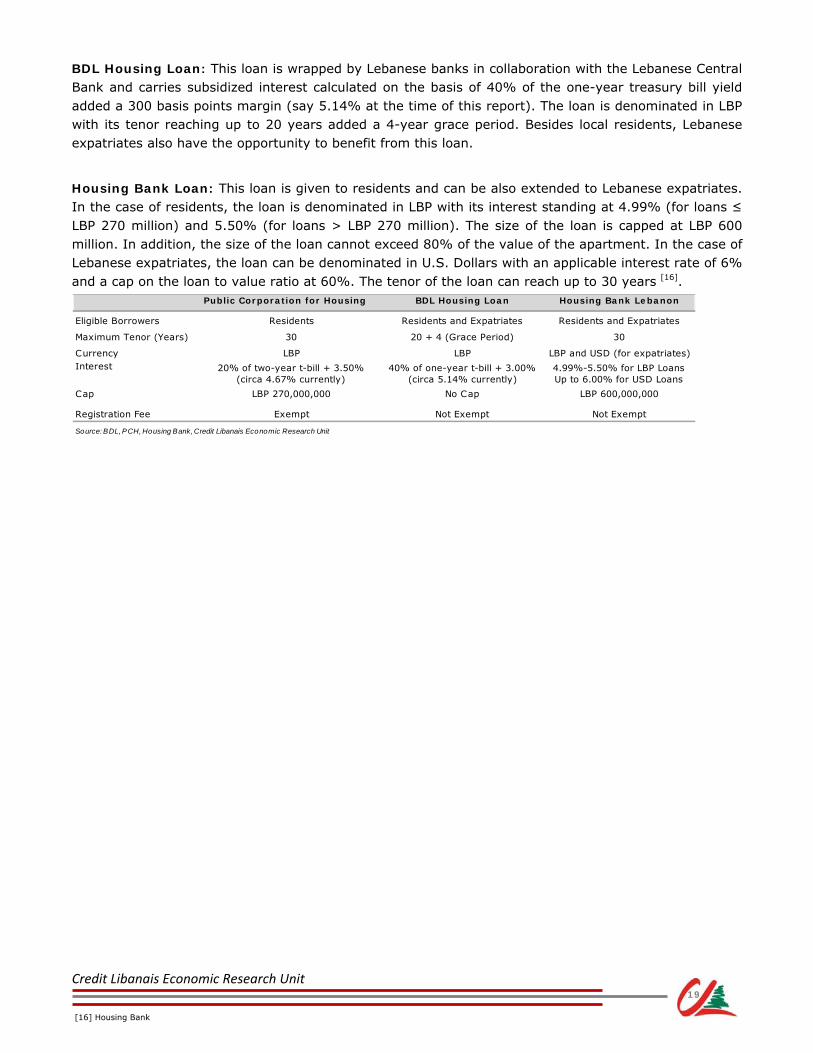
The Public Corporation for Housing: Housing loans extended by the the Public Corporation for Housing (PCH) are promoted through Lebanese banks and carry subsidized interest calculated on the basis of 20% of the two-year treasury bill yield added a 350 basis points margin (circa 4.67% at the time of publication of this report). The loan is denominated in LBP with its tenor reaching up to 30 years, and this depending on the borrower’s age. PCH loans are capped at LBP 270 million with the value of the loan being conditional upon the applicant’s salary in accordance with the following formula:
Loan Value = Basic Monthly Salary/3 * 12 * 15 (in the event the loan’s tenor is thirty years)
It is worth noting, in this perspective, that 10% of the loan’s amount remains held with the Public Corporation for Housing.
Applicants for PCH home loans are exempt from a variety of fees, mainly registration fees. Finally, PCH loans are only available for Lebanese residents.
[15] BDL
18
Credit Libanais Economic Research Unit
Public Corporation for Housing BDL Housing Loan Housing Bank Lebanon
Eligible Borrowers Residents Residents and Expatriates Residents and Expatriates
Maximum Tenor (Years) 30 20 + 4 (Grace Period) 30
Currency LBP LBP LBP and USD (for expatriates)Interest 20% of two-year t-bill + 3.50%
(circa 4.67% currently)40% of one-year t-bill + 3.00%
(circa 5.14% currently)4.99%-5.50% for LBP Loans Up to 6.00% for USD Loans
Cap LBP 270,000,000 No Cap LBP 600,000,000
Registration Fee Exempt Not Exempt Not Exempt
Source: BDL, PCH, Housing Bank, Credit Libanais Economic Research Unit
BDL Housing Loan: This loan is wrapped by Lebanese banks in collaboration with the Lebanese Central Bank and carries subsidized interest calculated on the basis of 40% of the one-year treasury bill yield added a 300 basis points margin (say 5.14% at the time of this report). The loan is denominated in LBP with its tenor reaching up to 20 years added a 4-year grace period. Besides local residents, Lebanese expatriates also have the opportunity to benefit from this loan.
Housing Bank Loan: This loan is given to residents and can be also extended to Lebanese expatriates. In the case of residents, the loan is denominated in LBP with its interest standing at 4.99% (for loans ≤ LBP 270 million) and 5.50% (for loans > LBP 270 million). The size of the loan is capped at LBP 600 million. In addition, the size of the loan cannot exceed 80% of the value of the apartment. In the case of Lebanese expatriates, the loan can be denominated in U.S. Dollars with an applicable interest rate of 6% and a cap on the loan to value ratio at 60%. The tenor of the loan can reach up to 30 years [16].
[16] Housing Bank
19
Credit Libanais Economic Research Unit
VIII. TRANSPARENCY OF THE LEBANESE REAL ESTATE SECTOR
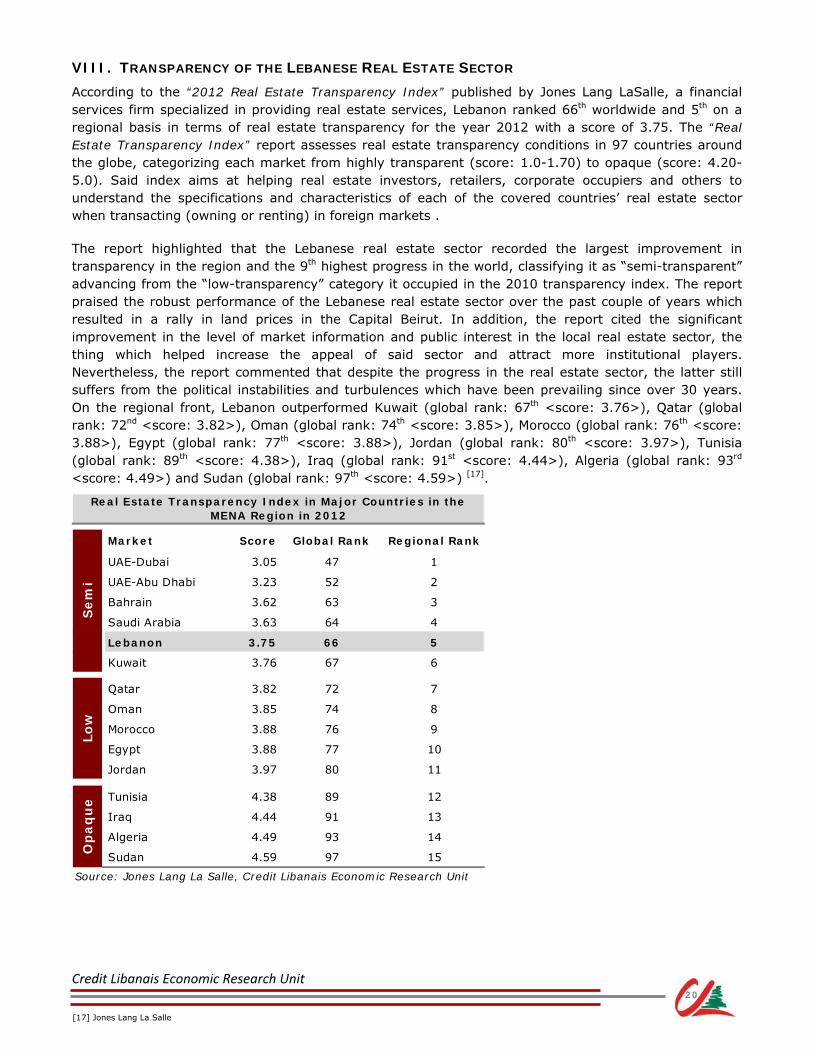
According to the “2012 Real Estate Transparency Index” published by Jones Lang LaSalle, a financial services firm specialized in providing real estate services, Lebanon ranked 66th worldwide and 5th on a regional basis in terms of real estate transparency for the year 2012 with a score of 3.75. The “Real Estate Transparency Index” report assesses real estate transparency conditions in 97 countries around the globe, categorizing each market from highly transparent (score: 1.0-1.70) to opaque (score: 4.20-5.0). Said index aims at helping real estate investors, retailers, corporate occupiers and others to understand the specifications and characteristics of each of the covered countries’ real estate sector when transacting (owning or renting) in foreign markets . The report highlighted that the Lebanese real estate sector recorded the largest improvement in transparency in the region and the 9th highest progress in the world, classifying it as “semi-transparent” advancing from the “low-transparency” category it occupied in the 2010 transparency index. The report praised the robust performance of the Lebanese real estate sector over the past couple of years which resulted in a rally in land prices in the Capital Beirut. In addition, the report cited the significant improvement in the level of market information and public interest in the local real estate sector, the thing which helped increase the appeal of said sector and attract more institutional players. Nevertheless, the report commented that despite the progress in the real estate sector, the latter still suffers from the political instabilities and turbulences which have been prevailing since over 30 years. On the regional front, Lebanon outperformed Kuwait (global rank: 67th <score: 3.76>), Qatar (global rank: 72nd <score: 3.82>), Oman (global rank: 74th <score: 3.85>), Morocco (global rank: 76th <score: 3.88>), Egypt (global rank: 77th <score: 3.88>), Jordan (global rank: 80th <score: 3.97>), Tunisia (global rank: 89th <score: 4.38>), Iraq (global rank: 91st <score: 4.44>), Algeria (global rank: 93rd <score: 4.49>) and Sudan (global rank: 97th <score: 4.59>) [17].
[17] Jones Lang La Salle
20
Market Score Global Rank Regional Rank
UAE-Dubai 3.05 47 1
UAE-Abu Dhabi 3.23 52 2
Bahrain 3.62 63 3
Saudi Arabia 3.63 64 4
Lebanon 3.75 66 5
Kuwait 3.76 67 6
Qatar 3.82 72 7
Oman 3.85 74 8
Morocco 3.88 76 9
Egypt 3.88 77 10
Jordan 3.97 80 11
Tunisia 4.38 89 12
Iraq 4.44 91 13
Algeria 4.49 93 14
Sudan 4.59 97 15
Source: Jones Lang La Salle, Credit Libanais Economic Research Unit
Real Estate Transparency Index in Major Countries in the MENA Region in 2012
Se
mi
Lo
wO
pa
qu
e

Credit Libanais Economic Research Unit
187.06
252.07
384.74415.26
565.84 559.87
173.13
0.00
100.00
200.00
300.00
400.00
500.00
600.00
2006 2007 2008 2009 2010 2011 Apr‐12
Evolution of Real Estate Registration Fees
Source: Real Estate Registry, Ministry of Finance, Credit Libanais Economic Research Unit
in USD Million
384.08352.90
521.39
536.65
721.72 758.87
263.35
7.94%
6.08%
7.45%6.37%
8.58% 8.13% 8.33%
0.00%
1.00%
2.00%
3.00%
4.00%
5.00%
6.00%
7.00%
8.00%
9.00%
10.00%
0.00
100.00
200.00
300.00
400.00
500.00
600.00
700.00
800.00
900.00
2006 2007 2008 2009 2010 2011 Apr-12
in USD Million Evolution of Budget Revenues from Real Estate Sector and their Contribution to Total Budget and Treasury Receipts
Source: Real Estate Registry, Ministry of Finance, Credit Libanais Economic Research Unit
IX. THE IMPACT OF THE REAL ESTATE SECTOR ON THE LEBANESE ECONOMY
A. CONTRIBUTION TO BUDGET REVENUES AND MUNICIPALITIES
Registration fees, and which constitute the bulk of real estate sector-related budget revenues, have been on the rise over the 2006-2010 period, in line with the increase in the number of real estate transactions coupled with the rally in real estate prices (bearing in mind that registration fees are function of the value of real estate transactions). Registration fees, however, fell in the year 2011 amid a contraction in the number of real estate transactions and some corrections in prices. More particularly, registration fees burgeoned from $187 million in the year 2006 to around $566 million in the year 2010 before easing to around $560 million in the year 2011 [18]. Registration fees ended the month of April 2012 at $173.13 million comparing with $167.83 million in the same period in 2011.
In total, budget revenues generated from real estate sector-related fees (e.g. registration fees, built property tax) soared from $384.08 million in the year 2006 to some $721.72 million in the year 2010 and $758.87 million in the year 2011. In addition, the contribution of real estate sector-related fees to total budget revenues and treasury receipts increased from 7.94% in the year 2006 to 8.58% in the year 2010 before shedding to 8.13% in 2011 and 8.33% in the first four months of the year 2012 [18].
[18] Ministry of Finance
21

Credit Libanais Economic Research Unit
12.15%
73.78%
14.07%
Built Property Tax Real Estate Registration Fees Others
Source: Real Estate Registry, Credit Libanais Economic Research Unit
Breakdown of Budget Revenues From the Real Estate Sector in the Year 2011
24.69%
65.74%
9.57%
Built Property Tax Real Estate Registration Fees Others
Source: Real Estate Registry, Credit Libanais Economic Research Unit
Breakdown of Budget Revenues From the Real Estate Sector in the First Four Months of the Year 2012
Foreingers10.06%
Local89.94%
Breakdown of Real Estate Sector-Related Fees by Nationality in the First Half of the Year 2012
Source: Real Estate Registry, Credit Libanais Economic Research Unit
Foreingers6.47%
Local93.53%
Breakdown of Real Estate Sector-Related Fees by Nationality in the Year 2011
Source: Real Estate Registry, Credit Libanais Economic Research Unit
A breakdown of realty-related fees shows a sizeable contribution from foreigners standing at 6.47% in 2011 and 10.06% in the first half of 2012. This justifies the increasing share of foreigners of total real estate sales transactions from 1.84% in 2011 to 1.89% as at end of June 2012:
As discussed earlier, the bulk of real estate sector-related budget revenues originates from registration fees (around 74% in 2011; around 66% up to April 2012), with the share of taxation on built-up property standing at 12.15% in 2011 and 24.69% by end of April 2012. This is further elaborated by the following charts:
Apart from its contribution to budget revenues, the real estate sector also channels funds to municipalities in the form of municipality fees. The substantial rise in municpality fees over the last couple of years (Compunded Annual Growth Rate of 28.89% over the 2006-2011 period), owes mainly to the frantic rise in real estate prices, given that municipality fees are function of the rental value of an appartment.
22

Credit Libanais Economic Research Unit
1.65
2.03
2.97
3.39
0
0.5
1
1.5
2
2.5
3
3.5
4
2006 2007 2008 2009
FDI Inflows to the Lebanese Real Estate and Residential Sector (2006 - 2009)
Source: World Bank, IDAL, Credit Libanais Economic Research Unit
in USD Billion
3.00
3.38
4.33
4.84 4.96
3.90
0.00
1.00
2.00
3.00
4.00
5.00
6.00
2006 2007 2008 2009 2010 2011e
FDI Inflows to Lebanon (2006 - 2011e)
Source: World Bank, IDAL, Credit Libanais Economic Research Unit
in USD Billion
43.23%
25.38%
0.67%
6.72%
24.00%
Real Estate Residential Industry Agriculture Services
Sectoral Breakdown of FDI Inflows to Lebanon in the Year 2008
Source: IDAL, Credit Libanais Economic Research Unit
44.67%
26.40%
1.02%
1.78%
26.14%
Real Estate Residential Industry Agriculture Services
Sectoral Breakdown of FDI Inflows to Lebanon in the Year 2009
Source: IDAL, Credit Libanais Economic Research Unit
B. ATTRACTION OF FOREIGN DIRECT INVESTMENTS
Lebanon’s real estate sector is highly dependant on the influx of foreign investments, particularly from Lebanese expatriates. Said inflows of foreign capital into the real estate sector helped shield the sector during times of local and international crises that hampered local demand. FDI inflows to Lebanon’s real estate and residential sectors have been building momentum exponentially post Israeli war on Lebanon in 2006 from $1.65 billion as at end of year 2006 to $3.39 billion in the year 2009 [19].
It is worth noting that total FDI inflows to Lebanon reached $4.96 billion in 2010 and $3.90 billion in 2011, yet no statistics were published to date that gauge the share of real estate of the aforementioned figures. Historically, though, the share of the real estate and residential sectors of FDI inflows to Lebanon stood at 68.61% in 2008 and 71.07% in 2009 as illustrated in the charts below:
[19] IDAL, World Bank
23
8.94
12.09
18.4016.06
27.53
31.81
13.64
0.00
5.00
10.00
15.00
20.00
25.00
30.00
35.00
2006 2007 2008 2009 2010 2011 June
Evolution of Municipality Fees
Source: Real Estate Registry, Credit Libanais Economic Research Unit
in USD Million
Credit Libanais Economic Research Unit
City
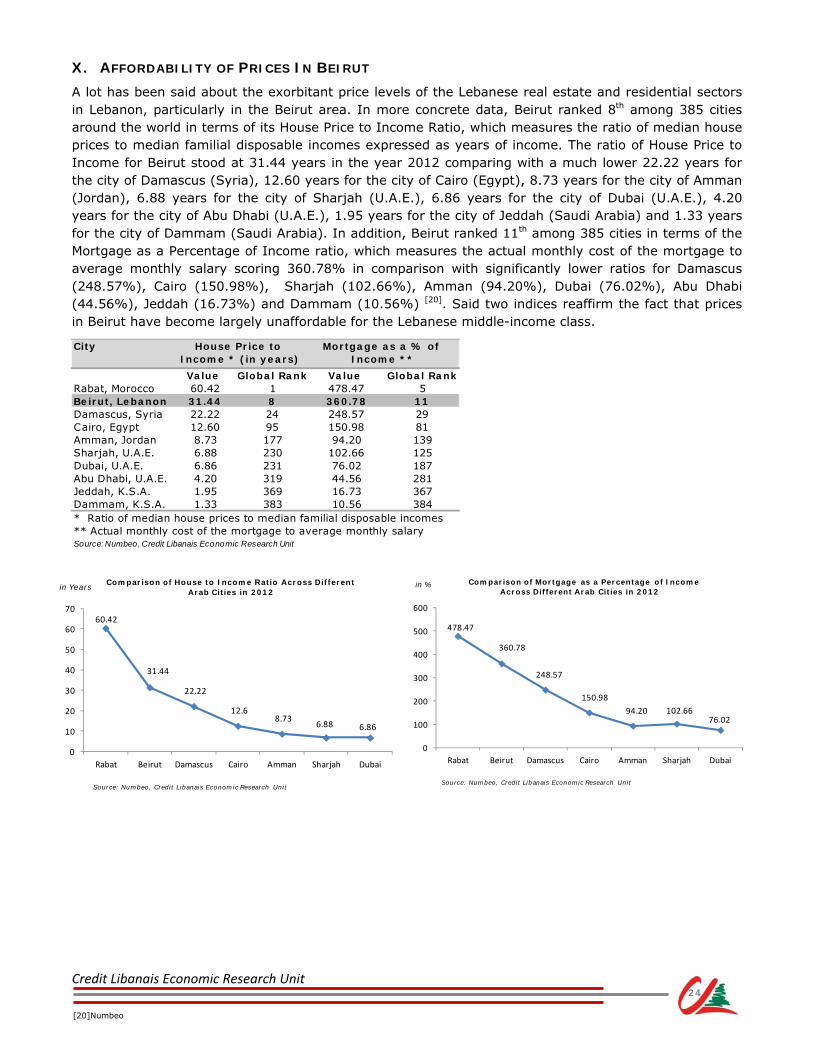
Value Global Rank Value Global RankRabat, Morocco 60.42 1 478.47 5Beirut, Lebanon 31.44 8 360.78 11Damascus, Syria 22.22 24 248.57 29Cairo, Egypt 12.60 95 150.98 81Amman, Jordan 8.73 177 94.20 139Sharjah, U.A.E. 6.88 230 102.66 125Dubai, U.A.E. 6.86 231 76.02 187Abu Dhabi, U.A.E. 4.20 319 44.56 281Jeddah, K.S.A. 1.95 369 16.73 367Dammam, K.S.A. 1.33 383 10.56 384* Ratio of median house prices to median familial disposable incomes** Actual monthly cost of the mortgage to average monthly salarySource: Numbeo, Credit Libanais Economic Research Unit
House Price to Income * (in years)
Mortgage as a % of Income **
60.42
31.44
22.22
12.68.73
6.88 6.86
0
10
20
30
40
50
60
70
Rabat Beirut Damascus Cairo Amman Sharjah Dubai
Comparison of House to Income Ratio Across Different Arab Cities in 2012
Source: Numbeo, Credit Libanais Economic Research Unit
in Years
478.47
360.78
248.57
150.98
94.20 102.6676.02
0
100
200
300
400
500
600
Rabat Beirut Damascus Cairo Amman Sharjah Dubai
Comparison of Mortgage as a Percentage of Income Across Different Arab Cities in 2012
Source: Numbeo, Credit Libanais Economic Research Unit
in %
X. AFFORDABILITY OF PRICES IN BEIRUT
A lot has been said about the exorbitant price levels of the Lebanese real estate and residential sectors in Lebanon, particularly in the Beirut area. In more concrete data, Beirut ranked 8th among 385 cities around the world in terms of its House Price to Income Ratio, which measures the ratio of median house prices to median familial disposable incomes expressed as years of income. The ratio of House Price to Income for Beirut stood at 31.44 years in the year 2012 comparing with a much lower 22.22 years for the city of Damascus (Syria), 12.60 years for the city of Cairo (Egypt), 8.73 years for the city of Amman (Jordan), 6.88 years for the city of Sharjah (U.A.E.), 6.86 years for the city of Dubai (U.A.E.), 4.20 years for the city of Abu Dhabi (U.A.E.), 1.95 years for the city of Jeddah (Saudi Arabia) and 1.33 years for the city of Dammam (Saudi Arabia). In addition, Beirut ranked 11th among 385 cities in terms of the Mortgage as a Percentage of Income ratio, which measures the actual monthly cost of the mortgage to average monthly salary scoring 360.78% in comparison with significantly lower ratios for Damascus (248.57%), Cairo (150.98%), Sharjah (102.66%), Amman (94.20%), Dubai (76.02%), Abu Dhabi (44.56%), Jeddah (16.73%) and Dammam (10.56%) [20]. Said two indices reaffirm the fact that prices in Beirut have become largely unaffordable for the Lebanese middle-income class.
[20]Numbeo
24
Credit Libanais Economic Research Unit
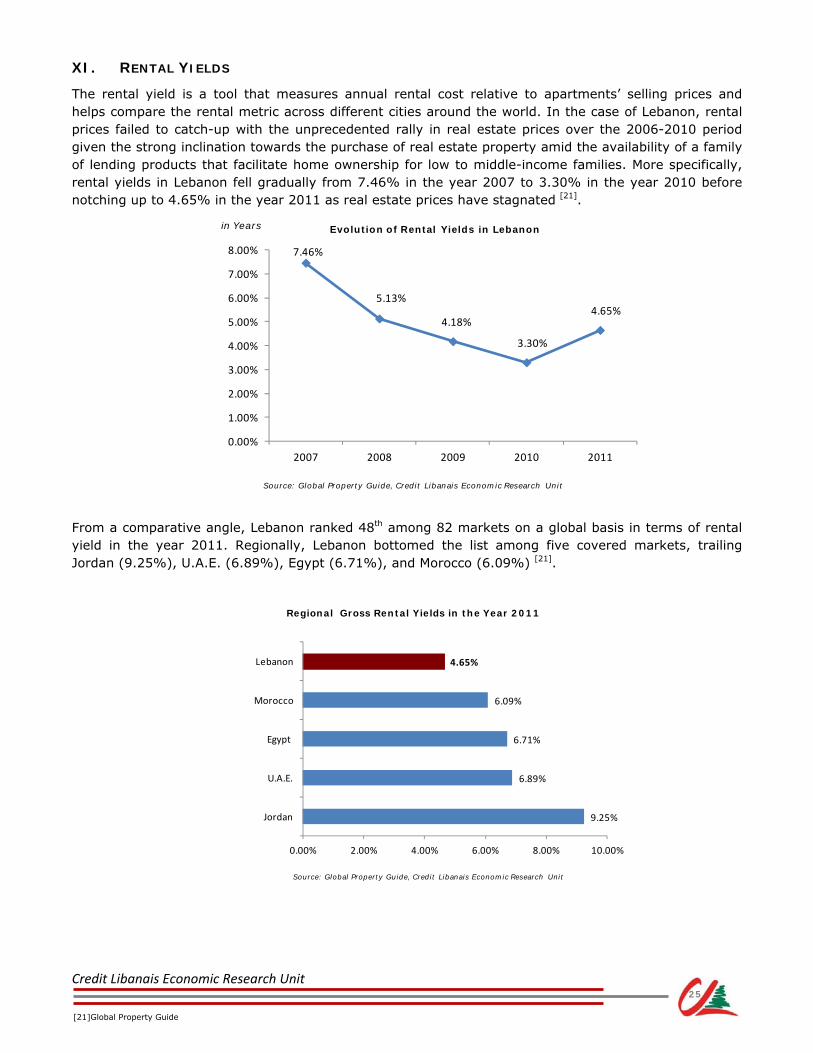
7.46%
5.13%
4.18%
3.30%
4.65%
0.00%
1.00%
2.00%
3.00%
4.00%
5.00%
6.00%
7.00%
8.00%
2007 2008 2009 2010 2011
Evolution of Rental Yields in Lebanon
Source: Global Property Guide, Credit Libanais Economic Research Unit
in Years
9.25%
6.89%
6.71%
6.09%
4.65%
0.00% 2.00% 4.00% 6.00% 8.00% 10.00%
Jordan
U.A.E.
Egypt
Morocco
Lebanon
Regional Gross Rental Yields in the Year 2011
Source: Global Property Guide, Credit Libanais Economic Research Unit
XI. RENTAL YIELDS
The rental yield is a tool that measures annual rental cost relative to apartments’ selling prices and helps compare the rental metric across different cities around the world. In the case of Lebanon, rental prices failed to catch-up with the unprecedented rally in real estate prices over the 2006-2010 period given the strong inclination towards the purchase of real estate property amid the availability of a family of lending products that facilitate home ownership for low to middle-income families. More specifically, rental yields in Lebanon fell gradually from 7.46% in the year 2007 to 3.30% in the year 2010 before notching up to 4.65% in the year 2011 as real estate prices have stagnated [21]. From a comparative angle, Lebanon ranked 48th among 82 markets on a global basis in terms of rental yield in the year 2011. Regionally, Lebanon bottomed the list among five covered markets, trailing Jordan (9.25%), U.A.E. (6.89%), Egypt (6.71%), and Morocco (6.09%) [21].
[21]Global Property Guide
25

Credit Libanais Economic Research Unit
XII. S.W.O.T. ANALYSIS
26
Threats
• A sustainable deadlock in Lebanon and the region could limit the influx of foreign capital to Lebanon, and consequently hampers demand for new real estate.
• Recently, social, religious and parliamentary figures have been attacking the current foreign ownership law in Lebanon describing it as too “generous” and implicating that foreign ownership should be further tightened to preserve Lebanon’s identity.
• Rising prices of raw materials pose a threat on the real estate sector by compelling developers to raise prices.
• The steep rise in land prices, given the supply scarcity, may render some real estate projects unfeasible.
• Banks have exhausted a big part of the reduction of their reserves associated with LBP lending reserve reduction that piled up as a result of Central bank circular number 185 that called for encouraging LBP lending at competitive rates. This puts pressure on banks’ future financing of subsidized housing unless a renewed initiative by the Central Bank of Lebanon to sustain reduction on reserve requirements sees the light.
Weaknesses • Real estate projects rely mostly in their funding on pre-
launch sales.
• The surge in demand drove prices to exorbitant levels, rendering new residential apartments in Beirut unaffordable for the Lebanese middle-income society.
• The recent developments in Syria have affected the supply of labor, creating as such upward pressure on the cost of the labor force.
• Fluctuating global raw material prices.
• Real estate sector highly correlated to prevailing political situation and vulnerable to local and regional political shocks.
• High vacancy rates in large apartments reflecting the curtailed demand for high-end residential units.
• The high congestion of buildings and the lack of anti-seismic design in old buildings in the capital, jeopardizing residential safety norms.
• The poor and inadequate infrastructure has buoyed realty demand in the areas surrounding Beirut (Metn, Baabda) and curtailed demand in areas far from the capital.
• Limited parking spaces in Beirut.
Opportunities
• Favorable demographic trends with some 20,000-25,000 new apartments demanded each year according to real estate experts.
• Sustainable demand from Lebanese expatriates wishing to own real estate property in their mother country.
• Subdued interest rate on subsidized housing loans, the thing which encourages borrowing for home financing.
• Presence of multiple sources of mortgage financing institutions (banks, the Housing Bank and the Public Corporation for Housing).
• The current cap on foreign ownership is less stringent than the cap in some other Arab countries.
• The inflow of Syrians to Lebanon amid the escalating turbulences in Syria could fuel demand for real estate properties.
Strengths
• The laissez-faire nature of the Lebanese economy encourages and attracts foreign investments.
• The real estate sector is considered to be a cash cow for the Lebanese economy, attracting substantial inflows from Lebanese expatriates and foreign investors.
• A solid stable peg between the local currency (Lebanese Pound) and the US Dollar mitigating exchange rate risk for foreign investors.
• No restrictions on repatriation of capital and convertibility of the currency.
• Albeit it witnessed an appreciation recently, the cost of labor is still relatively low owing to the influx of workers from Syria and other neighboring countries with cheaper labor force.
• Moderate and unique climate that is rarely witnessed in the Gulf area making it an attraction point for the regional Arab Community.
• Demand for real estate property has been driven by genuine rather than speculative purposes, mitigating as such, and to a great extent, any risks of an imminent burst from a speculative bubble.
• Low leverage on the supply side notwithstanding banks’ willingness to finance up to 60% of loan value for real estate developers.
• Scarcity of available land and especially within the Greater Beirut area, ruling out any possible depreciation in prices.
• State-of-the-art, modern and internationally renowned realty architecture.
• Resilient office market buoyed by lack of high quality supply.
Credit Libanais Economic Research Unit
Dependent Variable
Year Number of Real Estate Transactions
Construction Permits (sqm)
Financial Inflows ($ Million)
Coincident Indicator
H1 2006 25,542 4,724,797 6,317.8 192
H2 2006 24,598 2,797,340 9,913.0 178
H1 2007 27,697 3,591,246 3,950.0 171
H2 2007 39,344 4,327,767 7,088.0 188
H1 2008 34,274 4,351,512 5,650.8 198
H2 2008 47,391 9,906,525 10,470.2 210
H1 2009 33,040 5,208,651 8,242.0 229
H2 2009 50,582 6,300,491 12,415.0 241
H1 2010 45,939 7,305,293 7,780.5 250
H2 2010 48,381 7,882,110 9,255.5 256
H1 2011 37,386 7,493,549 6,630.8 262
H2 2011 45,598 6,396,257 7,266.2 266
Source: BDL, UNCTAD, World Bank, IM F, Real Estate Registry, Credit Libanais Economic Research Unit
Independent Variables
0
10,000
20,000
30,000
40,000
50,000
60,000
H1 2006
H2 2006
H1 2007
H2 2007
H1 2008
H2 2008
H1 2009
H2 2009
H1 2010
H2 2010
H1 2011
H2 2011
Evolution in the Number of Real Estate Transactions
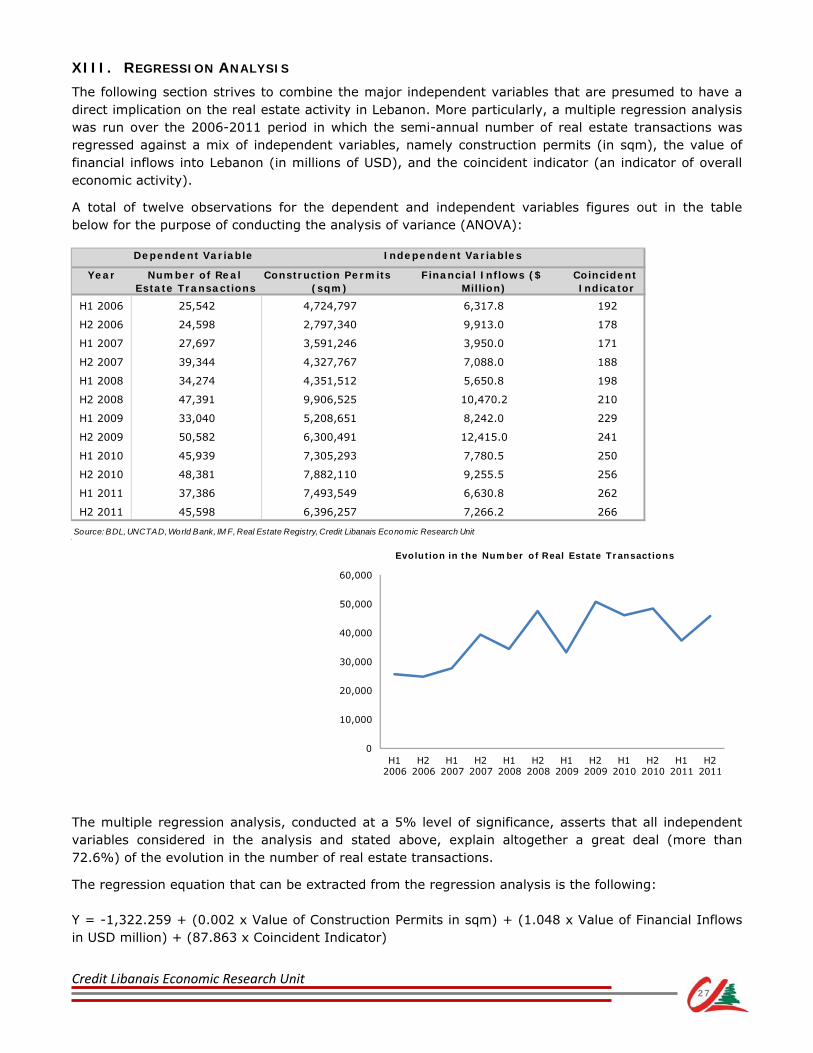
XIII. REGRESSION ANALYSIS
The following section strives to combine the major independent variables that are presumed to have a direct implication on the real estate activity in Lebanon. More particularly, a multiple regression analysis was run over the 2006-2011 period in which the semi-annual number of real estate transactions was regressed against a mix of independent variables, namely construction permits (in sqm), the value of financial inflows into Lebanon (in millions of USD), and the coincident indicator (an indicator of overall economic activity).
A total of twelve observations for the dependent and independent variables figures out in the table below for the purpose of conducting the analysis of variance (ANOVA):
The multiple regression analysis, conducted at a 5% level of significance, asserts that all independent variables considered in the analysis and stated above, explain altogether a great deal (more than 72.6%) of the evolution in the number of real estate transactions.
The regression equation that can be extracted from the regression analysis is the following: Y = -1,322.259 + (0.002 x Value of Construction Permits in sqm) + (1.048 x Value of Financial Inflows in USD million) + (87.863 x Coincident Indicator)
27
Credit Libanais Economic Research Unit
ANOVA
df SS MS F Significance F
Regression 3 693,672,025 231,224,008 7.065734 0.012251583
Residual 8 261,797,586 32,724,698
Total 11 955,469,611
Coefficients Standard Error t Stat
Intercept -1,322.25925 12,215.65598 -0.10824
Construction Permits 0.00205 0.00119 1.73329
Financial Inflows 1.04752 0.81873 1.27945
Coinci Indicator 87.86348445 67.34938665 1.3045922
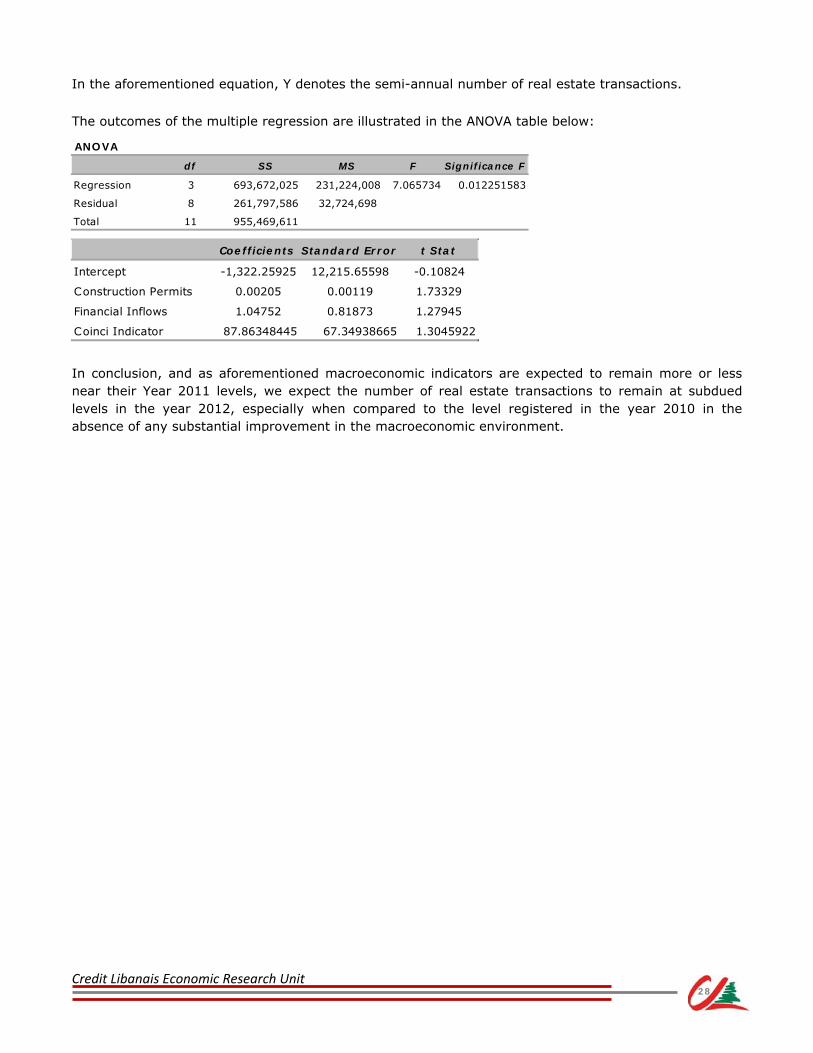
In the aforementioned equation, Y denotes the semi-annual number of real estate transactions. The outcomes of the multiple regression are illustrated in the ANOVA table below:
In conclusion, and as aforementioned macroeconomic indicators are expected to remain more or less near their Year 2011 levels, we expect the number of real estate transactions to remain at subdued levels in the year 2012, especially when compared to the level registered in the year 2010 in the absence of any substantial improvement in the macroeconomic environment.
28

Credit Libanais Economic Research Unit
REFERENCES
- Mr. Habib Hamandi of SAYFCO
- Mr. Joe Ibrahim of PLUS PROPERTIES
- Mr. Karim Makarem of RAMCO
- Mr. Nicholas Mehchy of PLUS PROPERTIES
- Mr. Ziad Maalouf of CAPSTONE
- Banque du Liban
- Cushman & Wakefield
- Global Property Guide
- Housing Bank
- Infopro
- International Monetary Fund
- Investment Development Authority of Lebanon
- Jones Lang La Salle
- Lebanon Opportunities
- The Lebanese Ministry of Finance
- Numbeo
- Lebanon’s Order of Engineers
- Lebanon’s Real Estate Registry
- Solidere
- United Nations Conference on Trade and Development
- The World Bank
29
Credit Libanais Economic Research Unit
Credit Libanais SAL
Economic Research Unit Tel: +961-1-326 786 Fax: +961-1-326 786 [email protected] For Your Queries: Fadlo I. Choueiri, CFA [email protected] Tel: +961-1-200 028 EXT: 235 Jad Abi Haidar [email protected] Tel: +961-1-200 028 EXT. 251 Rim Fayad [email protected] Tel: +961-1-200 028 EXT. 230 Joelle Samaha [email protected] Tel: +961-1-200 028 EXT. 232 Jessica Basbous [email protected] Tel: +961-1-200 028 EXT. 275
CONTACTS
30
Credit Libanais Economic Research Unit
Economic Research Unit Sofil Center – Charles Malek Avenue Ashrafieh 1100 2811 P.O.Box 16-6729 Beirut, Lebanon Tel: +961-1-326 786 Fax: +961-1-326 786 E-mail:[email protected] www.creditlibanais.com.lb
CREDIT LIBANAIS SAL