real estate market overview - liaa · real estate market overview annual report research &...
TRANSCRIPT

Real Estate Market OverviewAnnual Report
Research & Forecast Report
Latvia | Lithuania | Estonia2014
Accelerating success.
2Real Estate Market Overview | 2014 | Colliers International | SORAINEN
Contents
LAtviA MARket OveRview 3Economic Overview 4
Investment Market 5
Office Market 8
Retail Market 12
Industrial Market 16
Hotel Market 20
Legal Overview 23
Tax Summary 27
LithuAniA MARket OveRview 29Economic Overview 30
Investment Market 31
Office Market 33
Retail Market 37
Warehouse Market 41
Hotel Market 44
Legal Overview 47
Tax Summary 51
estOniA MARket OveRview 53Economic Overview 54
Investment Market 55
Office Market 57
Retail Market 61
Industrial Market 65
Hotel Market 68
Legal Overview 72
Tax Summary 76
3Real Estate Market Overview | 2014 | Latvia | Colliers International
Dear Reader,It is our pleasure to present the Colliers real estate market review for Latvia where you will find much useful information about trends and forecasts, the latest statistics and market insights. Our partner Sorainen helped with preparation of the real estate legal and tax review. We believe this material will be useful when evaluating all the risks before making the right business decisions. 2013 surprised us with its high activity within the investment segment, doubling the volume of transactions compared to 2012. We feel a positive trend within all the commercial real estate segments and believe that the market is readying itself for new developments. As evidence of that, we see an increased number of transactions involving land plots for development projects.We expect 2014 to maintain a similar trend. Vacancies in existing buildings in all segments will stay low, rent rates will continue to increase slightly and we do not exclude the possibility that the market will see new players investing in our region. 2014 is an important year for Colliers, as we have now been active in the region for the last 10 years. We have witnessed very rapid market development, a huge shock from the crisis followed by a relatively rapid recovery. We are proud that our clients and partners find our services valuable in each of these market cycles and we take this opportunity to express huge gratitude to them for their loyalty and cooperation over the last decade.
Thank you and we wish you an interesting and successful year,
Deniss Kairans
Deniss KairansPartner | Managing [email protected]
Latvia Market Overview
4Real Estate Market Overview | 2014 | Latvia | Colliers International
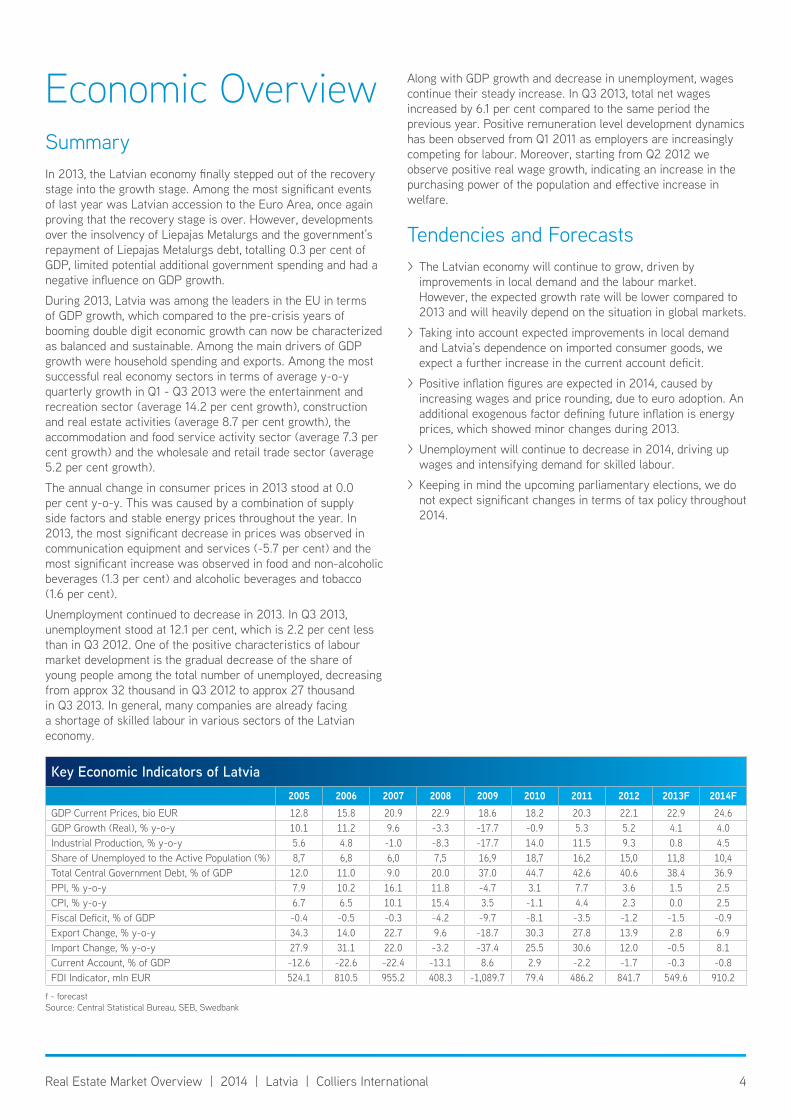
Economic OverviewSummaryIn 2013, the Latvian economy finally stepped out of the recovery stage into the growth stage. Among the most significant events of last year was Latvian accession to the Euro Area, once again proving that the recovery stage is over. However, developments over the insolvency of Liepajas Metalurgs and the government’s repayment of Liepajas Metalurgs debt, totalling 0.3 per cent of GDP, limited potential additional government spending and had a negative influence on GDP growth.
During 2013, Latvia was among the leaders in the EU in terms of GDP growth, which compared to the pre-crisis years of booming double digit economic growth can now be characterized as balanced and sustainable. Among the main drivers of GDP growth were household spending and exports. Among the most successful real economy sectors in terms of average y-o-y quarterly growth in Q1 - Q3 2013 were the entertainment and recreation sector (average 14.2 per cent growth), construction and real estate activities (average 8.7 per cent growth), the accommodation and food service activity sector (average 7.3 per cent growth) and the wholesale and retail trade sector (average 5.2 per cent growth).
The annual change in consumer prices in 2013 stood at 0.0 per cent y-o-y. This was caused by a combination of supply side factors and stable energy prices throughout the year. In 2013, the most significant decrease in prices was observed in communication equipment and services (-5.7 per cent) and the most significant increase was observed in food and non-alcoholic beverages (1.3 per cent) and alcoholic beverages and tobacco (1.6 per cent).
Unemployment continued to decrease in 2013. In Q3 2013, unemployment stood at 12.1 per cent, which is 2.2 per cent less than in Q3 2012. One of the positive characteristics of labour market development is the gradual decrease of the share of young people among the total number of unemployed, decreasing from approx 32 thousand in Q3 2012 to approx 27 thousand in Q3 2013. In general, many companies are already facing a shortage of skilled labour in various sectors of the Latvian economy.
Along with GDP growth and decrease in unemployment, wages continue their steady increase. In Q3 2013, total net wages increased by 6.1 per cent compared to the same period the previous year. Positive remuneration level development dynamics has been observed from Q1 2011 as employers are increasingly competing for labour. Moreover, starting from Q2 2012 we observe positive real wage growth, indicating an increase in the purchasing power of the population and effective increase in welfare.
Tendencies and Forecasts > The Latvian economy will continue to grow, driven by improvements in local demand and the labour market. However, the expected growth rate will be lower compared to 2013 and will heavily depend on the situation in global markets.
> Taking into account expected improvements in local demand and Latvia’s dependence on imported consumer goods, we expect a further increase in the current account deficit.
> Positive inflation figures are expected in 2014, caused by increasing wages and price rounding, due to euro adoption. An additional exogenous factor defining future inflation is energy prices, which showed minor changes during 2013.
> Unemployment will continue to decrease in 2014, driving up wages and intensifying demand for skilled labour.
> Keeping in mind the upcoming parliamentary elections, we do not expect significant changes in terms of tax policy throughout 2014.
key economic indicators of Latvia2005 2006 2007 2008 2009 2010 2011 2012 2013F 2014F
GDP Current Prices, bio EUR 12.8 15.8 20.9 22.9 18.6 18.2 20.3 22.1 22.9 24.6GDP Growth (Real), % y-o-y 10.1 11.2 9.6 -3.3 -17.7 -0.9 5.3 5.2 4.1 4.0Industrial Production, % y-o-y 5.6 4.8 -1.0 -8.3 -17.7 14.0 11.5 9.3 0.8 4.5Share of Unemployed to the Active Population (%) 8,7 6,8 6,0 7,5 16,9 18,7 16,2 15,0 11,8 10,4Total Central Government Debt, % of GDP 12.0 11.0 9.0 20.0 37.0 44.7 42.6 40.6 38.4 36.9PPI, % y-o-y 7.9 10.2 16.1 11.8 -4.7 3.1 7.7 3.6 1.5 2.5CPI, % y-o-y 6.7 6.5 10.1 15.4 3.5 -1.1 4.4 2.3 0.0 2.5Fiscal Deficit, % of GDP -0.4 -0.5 -0.3 -4.2 -9.7 -8.1 -3.5 -1.2 -1.5 -0.9Export Change, % y-o-y 34.3 14.0 22.7 9.6 -18.7 30.3 27.8 13.9 2.8 6.9Import Change, % y-o-y 27.9 31.1 22.0 -3.2 -37.4 25.5 30.6 12.0 -0.5 8.1Current Account, % of GDP -12.6 -22.6 -22.4 -13.1 8.6 2.9 -2.2 -1.7 -0.3 -0.8FDI Indicator, mln EUR 524.1 810.5 955.2 408.3 -1,089.7 79.4 486.2 841.7 549.6 910.2
f - forecastSource: Central Statistical Bureau, SEB, Swedbank
5Real Estate Market Overview | 2014 | Latvia | Colliers International
Investment MarketGeneral Overview > 2013 was marked by the most significant activity in the last six years and doubling of total investment volume compared to 2012.
> A number of major deals initiated in 2012 were finally closed in 2013, among which is the purchase by Lords LB of an SMI portfolio consisting of retail and industrial properties across Latvia and Lithuania.
> The office, industrial and retail sectors were among the leaders of investment activity accounting for approx 60 per cent of total annual investment volume.
> Improvement in the investment climate and positive market expectations contributed to yield compression. Additionally, the Latvian S&P credit rating was upgraded to BBB+ with a positive outlook.
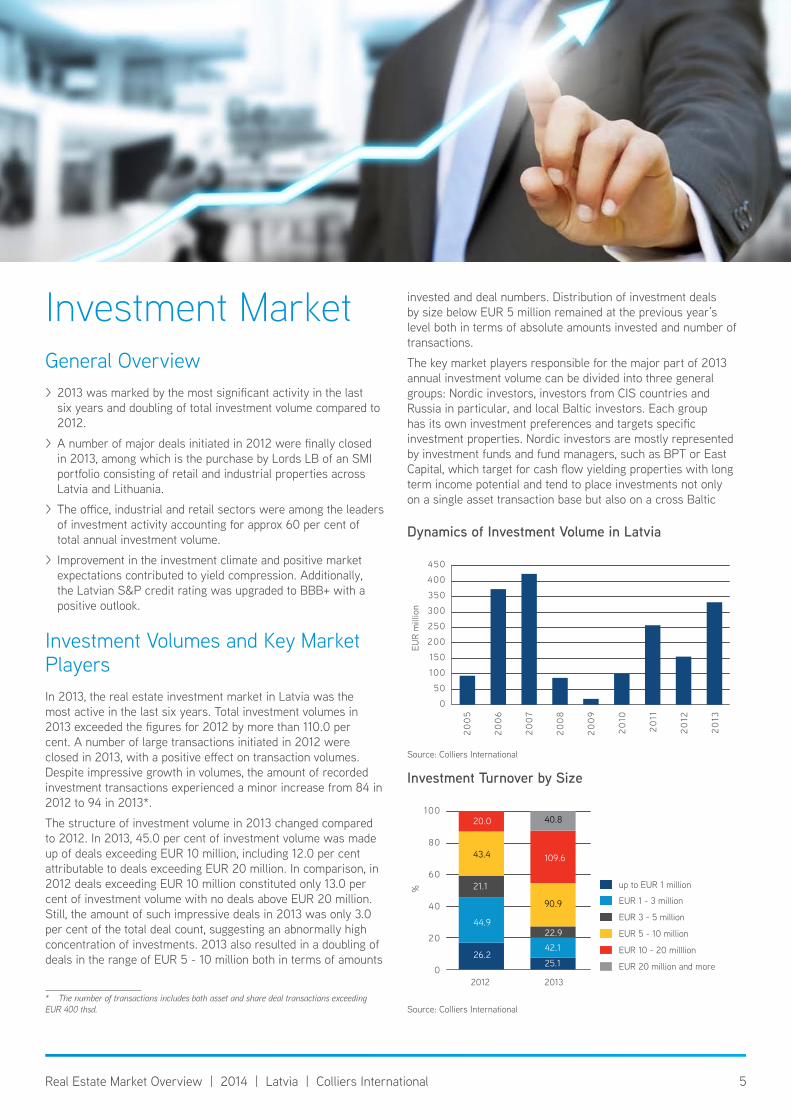
Investment Volumes and Key Market PlayersIn 2013, the real estate investment market in Latvia was the most active in the last six years. Total investment volumes in 2013 exceeded the figures for 2012 by more than 110.0 per cent. A number of large transactions initiated in 2012 were closed in 2013, with a positive effect on transaction volumes. Despite impressive growth in volumes, the amount of recorded investment transactions experienced a minor increase from 84 in 2012 to 94 in 2013*.
The structure of investment volume in 2013 changed compared to 2012. In 2013, 45.0 per cent of investment volume was made up of deals exceeding EUR 10 million, including 12.0 per cent attributable to deals exceeding EUR 20 million. In comparison, in 2012 deals exceeding EUR 10 million constituted only 13.0 per cent of investment volume with no deals above EUR 20 million. Still, the amount of such impressive deals in 2013 was only 3.0 per cent of the total deal count, suggesting an abnormally high concentration of investments. 2013 also resulted in a doubling of deals in the range of EUR 5 - 10 million both in terms of amounts
* The number of transactions includes both asset and share deal transactions exceeding EUR 400 thsd.
invested and deal numbers. Distribution of investment deals by size below EUR 5 million remained at the previous year’s level both in terms of absolute amounts invested and number of transactions.
The key market players responsible for the major part of 2013 annual investment volume can be divided into three general groups: Nordic investors, investors from CIS countries and Russia in particular, and local Baltic investors. Each group has its own investment preferences and targets specific investment properties. Nordic investors are mostly represented by investment funds and fund managers, such as BPT or East Capital, which target for cash flow yielding properties with long term income potential and tend to place investments not only on a single asset transaction base but also on a cross Baltic
Source: Colliers International
Dynamics of investment volume in Latvia
EUR
mill
ion
20
05
20
06
20
07
20
08
20
09
20
10
20
11
20
12
20
13
450
400
350
300
250
200
150
100
50
0
Source: Colliers International
investment turnover by size
90.9
22.942.1
25.1
109.6
40.8
21.1
44.9
26.2
43.4
20.0
2012 2013
up to EUR 1 million
EUR 1 - 3 million
EUR 3 - 5 million
EUR 5 - 10 million
EUR 10 - 20 milllion
EUR 20 million and more
%
100
80
60
40
20
0
6Real Estate Market Overview | 2014 | Latvia | Colliers International
country portfolio base. Presence of investors from CIS countries and Russia is the fact that distinct the Latvian market from the Estonian and Lithuanian markets. Investors from CIS countries and Russia aim at more risky projects, compared to institutional investors, as well as considering properties with development opportunities. In 2013, Ektornet as a seller was one of the market players, having accumulated impressive experience in cooperation with investors from CIS countries and Russia. Lastly, local private investors are a group mainly focused on properties with upside potential, requiring resolution of vacancy issues and with unfinished development. Local investors aim at EUR 1 - 4 million transactions and invest in sectors of their particular expertise.
The top three investors in 2013 were Lords LB, Capital Mill and East Capital all together responsible for aggregate investment volume of more than EUR 100 million in Latvia.
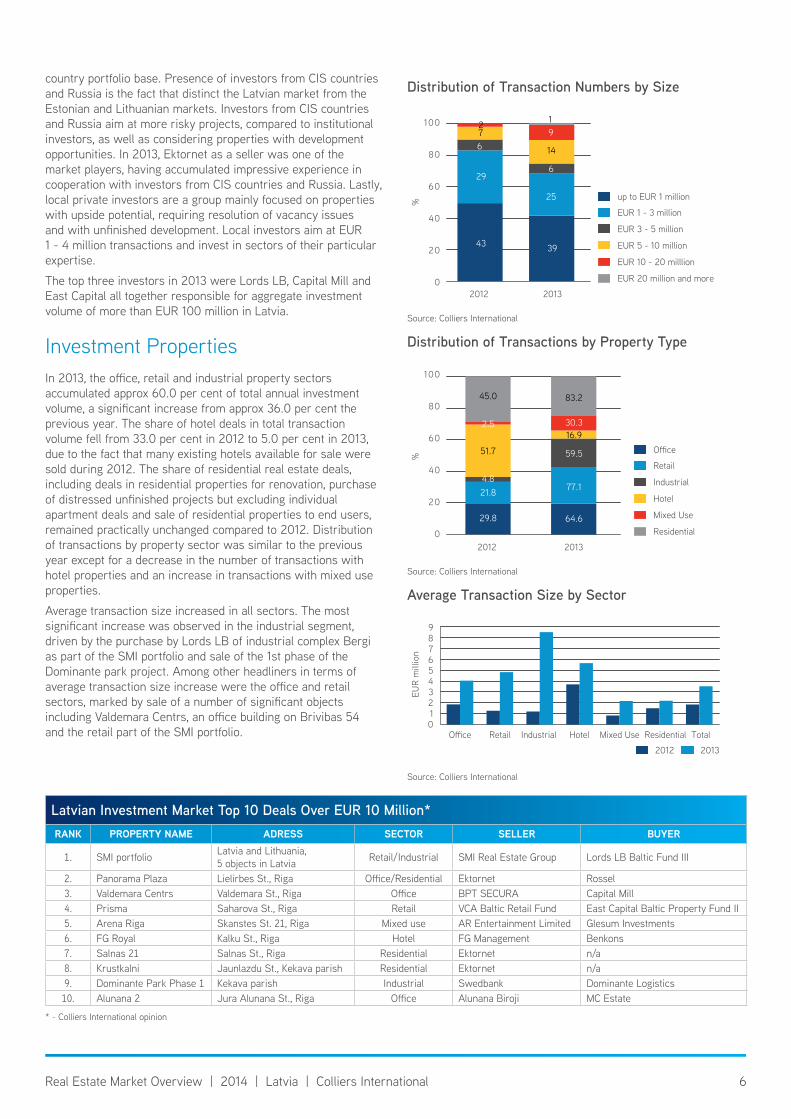
Investment PropertiesIn 2013, the office, retail and industrial property sectors accumulated approx 60.0 per cent of total annual investment volume, a significant increase from approx 36.0 per cent the previous year. The share of hotel deals in total transaction volume fell from 33.0 per cent in 2012 to 5.0 per cent in 2013, due to the fact that many existing hotels available for sale were sold during 2012. The share of residential real estate deals, including deals in residential properties for renovation, purchase of distressed unfinished projects but excluding individual apartment deals and sale of residential properties to end users, remained practically unchanged compared to 2012. Distribution of transactions by property sector was similar to the previous year except for a decrease in the number of transactions with hotel properties and an increase in transactions with mixed use properties.
Average transaction size increased in all sectors. The most significant increase was observed in the industrial segment, driven by the purchase by Lords LB of industrial complex Bergi as part of the SMI portfolio and sale of the 1st phase of the Dominante park project. Among other headliners in terms of average transaction size increase were the office and retail sectors, marked by sale of a number of significant objects including Valdemara Centrs, an office building on Brivibas 54 and the retail part of the SMI portfolio.
Source: Colliers International
Distribution of transactions by Property type
16.9
59.5
77.1
64.6
30.3
83.2
4.821.8
29.8
51.7
2.5
45.0
2012 2013
Office
Retail
Industrial
Hotel
Mixed Use
Residential
%
100
80
60
40
20
0
Source: Colliers International
Average transaction size by sector
Office Retail Industrial Hotel Mixed Use Residential Total
EUR
mill
ion
9876543210
2012 2013
Source: Colliers International
Distribution of transaction numbers by size
14
6
25
39
91
6
29
43
72
2012 2013
up to EUR 1 million
EUR 1 - 3 million
EUR 3 - 5 million
EUR 5 - 10 million
EUR 10 - 20 milllion
EUR 20 million and more
%
100
80
60
40
20
0
Latvian investment Market top 10 Deals Over euR 10 Million*RanK PRoPeRty name aDRess sectoR selleR BuyeR
1. SMI portfolio Latvia and Lithuania, 5 objects in Latvia Retail/Industrial SMI Real Estate Group Lords LB Baltic Fund III
2. Panorama Plaza Lielirbes St., Riga Office/Residential Ektornet Rossel3. Valdemara Centrs Valdemara St., Riga Office BPT SECURA Capital Mill4. Prisma Saharova St., Riga Retail VCA Baltic Retail Fund East Capital Baltic Property Fund II5. Arena Riga Skanstes St. 21, Riga Mixed use AR Entertainment Limited Glesum Investments6. FG Royal Kalku St., Riga Hotel FG Management Benkons7. Salnas 21 Salnas St., Riga Residential Ektornet n/a8. Krustkalni Jaunlazdu St., Kekava parish Residential Ektornet n/a9. Dominante Park Phase 1 Kekava parish Industrial Swedbank Dominante Logistics10. Alunana 2 Jura Alunana St., Riga Office Alunana Biroji MC Estate
* - Colliers International opinion

7Real Estate Market Overview | 2014 | Latvia | Colliers International
Investment YieldsImprovement of the investment climate and positive market expectations contributed to yield compression in 2013. The prime yield for industrial objects decreased to 9.0 per cent, while retail and office yields were 7.75 per cent and 8.0 per cent respectively.
Still, many transactions in the Latvian market continue to be “price per square meter” based. But as asking and offering yield spreads shrink, we expect to see more yield based transactions in the future.
Forecasts > In 2014 we expect a further increase in the number of investment deals and a total annual deal count close to 100.
> The market will remain active, but we expect a decrease in the amount of good quality investment properties mainly due to lack of development in the crisis years.
> The retail segment is expected to be the leader in terms of investment volumes in 2014. Some major deals were already starting to build up by the end of 2013.
> The real estate investment market has room for additional players, especially those with investment amounts of up to EUR 100 million.
Source: Colliers International
historical Yield Dynamics
Industrial Office Retail
%
20
06
20
07
20
08
20
09
20
10
20
11
20
12
20
13
14
12
10
8
6
4
Source: Colliers International
Distribution of the transaction numbers by sector
37
16
16
14
38
4
17
16
14
3
30
2012 2013
Office
Retail
Industrial
Hotel
Mixed Use
Residential
%
100
80
60
40
20
0
8Real Estate Market Overview | 2014 | Latvia | Colliers International
Office MarketGeneral Overview > Along with the general economic improvement and increase of business activity, the office market expressed positive dynamics, resulting in falling total vacancy and slight increase of rent rates.
> In 2013 we finally saw closure of a sales deal for the office building on G. Astras Street 1c with 7,000 sqm GLA, actively coming onto the market in 2014 and offering long-awaited large leasable areas.
> The past year was marked by average demand compared to 2012 and 2011. For the fourth consecutive year the absorption rate exceeded 21,000 sqm. IT companies continued to be among demand driver leaders.
> Due to the small amount of office premises with leasable area over 1,000 sqm, big tenants began to consider expansion to lower class office premises. This tendency had been driven by falling vacancy rates in professional office buildings.
> In the context of lack of new developments, tenants were actively prolonging their lease agreements, although keeping in mind reallocation plans as soon as new projects arrive.
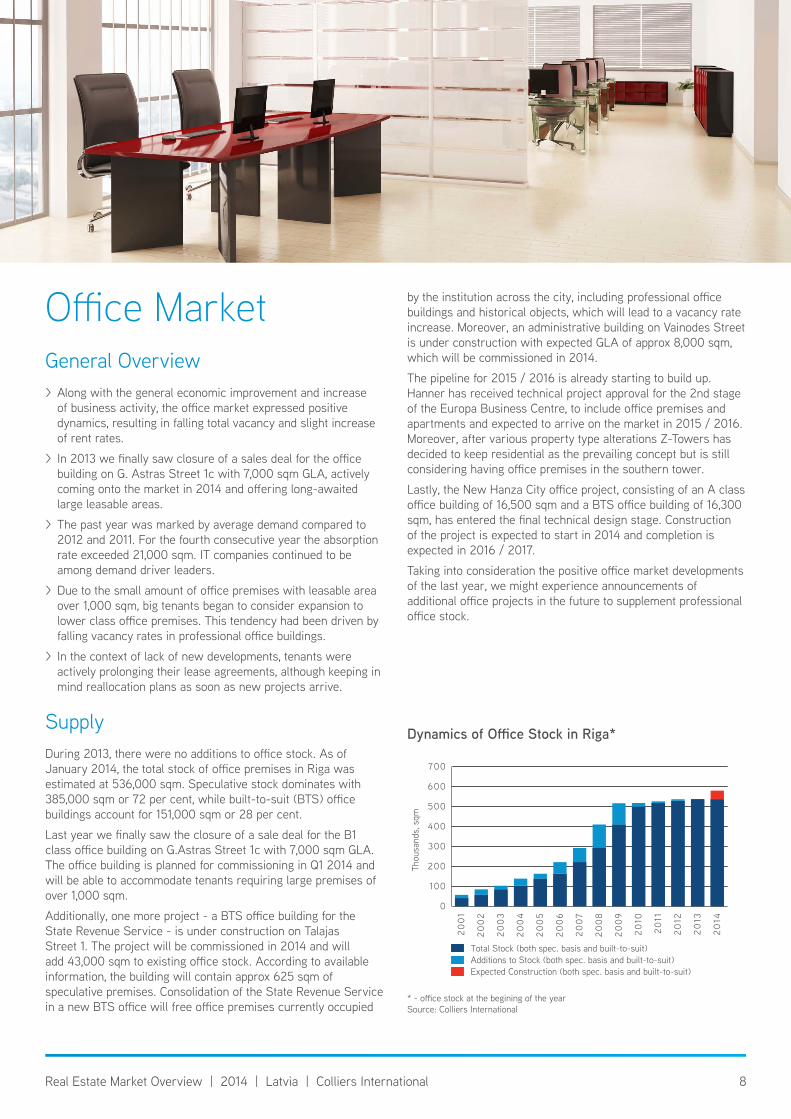
SupplyDuring 2013, there were no additions to office stock. As of January 2014, the total stock of office premises in Riga was estimated at 536,000 sqm. Speculative stock dominates with 385,000 sqm or 72 per cent, while built-to-suit (BTS) office buildings account for 151,000 sqm or 28 per cent.
Last year we finally saw the closure of a sale deal for the B1 class office building on G.Astras Street 1c with 7,000 sqm GLA. The office building is planned for commissioning in Q1 2014 and will be able to accommodate tenants requiring large premises of over 1,000 sqm.
Additionally, one more project - a BTS office building for the State Revenue Service - is under construction on Talajas Street 1. The project will be commissioned in 2014 and will add 43,000 sqm to existing office stock. According to available information, the building will contain approx 625 sqm of speculative premises. Consolidation of the State Revenue Service in a new BTS office will free office premises currently occupied
by the institution across the city, including professional office buildings and historical objects, which will lead to a vacancy rate increase. Moreover, an administrative building on Vainodes Street is under construction with expected GLA of approx 8,000 sqm, which will be commissioned in 2014.
The pipeline for 2015 / 2016 is already starting to build up. Hanner has received technical project approval for the 2nd stage of the Europa Business Centre, to include office premises and apartments and expected to arrive on the market in 2015 / 2016. Moreover, after various property type alterations Z-Towers has decided to keep residential as the prevailing concept but is still considering having office premises in the southern tower.
Lastly, the New Hanza City office project, consisting of an A class office building of 16,500 sqm and a BTS office building of 16,300 sqm, has entered the final technical design stage. Construction of the project is expected to start in 2014 and completion is expected in 2016 / 2017.
Taking into consideration the positive office market developments of the last year, we might experience announcements of additional office projects in the future to supplement professional office stock.
* - office stock at the begining of the yearSource: Colliers International
Dynamics of Office Stock in Riga*
20
01
20
02
20
03
20
04
20
05
20
06
20
07
20
08
20
09
20
10
20
11
20
12
20
13
20
14
700
600
500
400
300
200
100
0
Expected Construction (both spec. basis and built-to-suit)Additions to Stock (both spec. basis and built-to-suit)Total Stock (both spec. basis and built-to-suit)
Thou
sand
s, s
qm
9Real Estate Market Overview | 2014 | Latvia | Colliers International
Top 10 Office Lease Transactions of 2013
tenant InDustRy oBJect/ aDDRess aRea, sQm
AlphaMedia Online gambling Unity centre 2,772 SMS Credit Finance Panorama Plaza 2,145Tieto IT Forburga 1,671Seesam & Pohjola Finance Muitas 1 1,500
Veselibas Centrs 4 Healthcare Rigas Sanitara Transporta Autobaze 1,000
ATEA IT SWH centre 800Stream Pay IT Muitas 1 700LIAD Baltija Retail Terbatas 30 616CTE IT Astras biroji 610Transekspedicija Logistics INDI centre 600
Source: Colliers International
DemandAccording to Colliers International estimates, absorption of total office space in 2013 amounted to 21,200 sqm. Purchase of the office building on Brivibas Street 54 by Pasta Banka for the purpose of new headquarters in a modern office building contributed to the absorption figure by 4,000 sqm. However, this transaction should be considered more as an investment outcome than a market takeup. If we deduct reallocation of Pasta Banka from the total absorption figure, we arrive at pure market driven absorption of 17,200 sqm.
In the second part of 2013 we saw a decline in the absorption rate, explained by lack of available vacant premises, as well as the fact that a significant number of companies have already performed their office relocation or expansion.
In 2013 the most active tenants in the market were IT, financial and online gambling companies, altogether accounting for more than 50 per cent of all market leasing transactions.
Last year, companies started to consider class downgrades for potential office expansions in the context of several factors, including lack of vacant office premises.
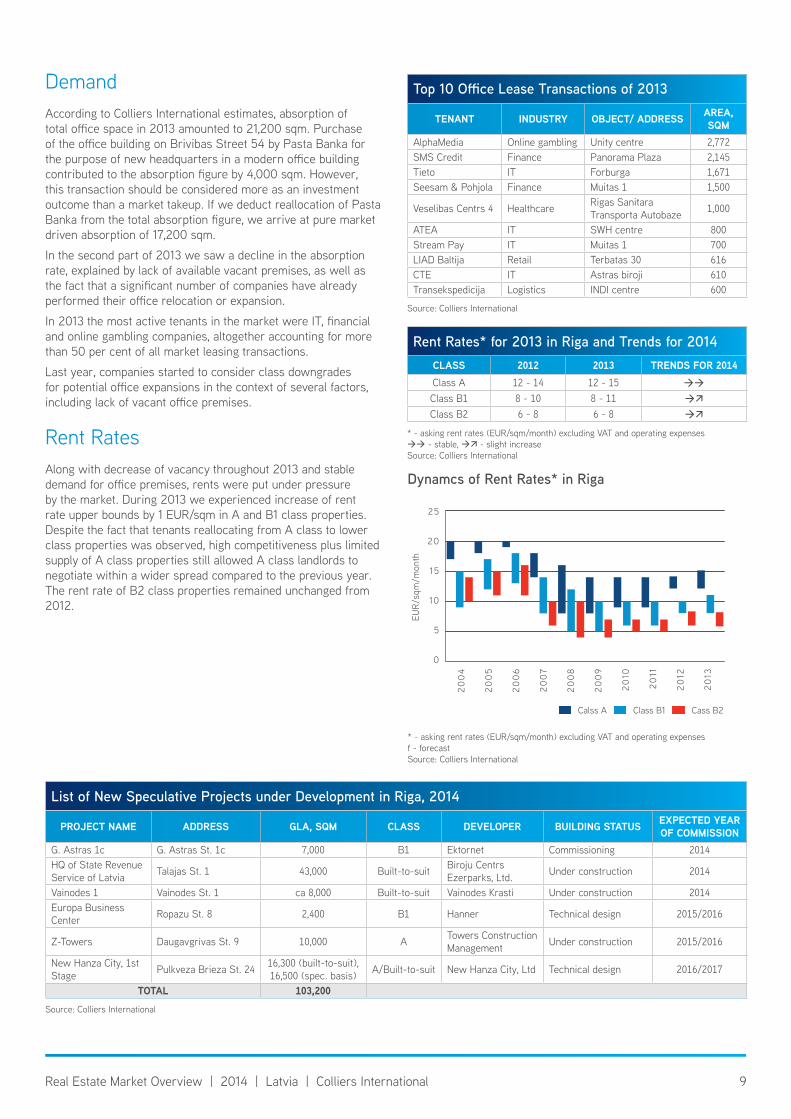
Rent RatesAlong with decrease of vacancy throughout 2013 and stable demand for office premises, rents were put under pressure by the market. During 2013 we experienced increase of rent rate upper bounds by 1 EUR/sqm in A and B1 class properties. Despite the fact that tenants reallocating from A class to lower class properties was observed, high competitiveness plus limited supply of A class properties still allowed A class landlords to negotiate within a wider spread compared to the previous year. The rent rate of B2 class properties remained unchanged from 2012.
Rent Rates* for 2013 in Riga and trends for 2014class 2012 2013 Trends For 2014Class A 12 - 14 12 - 15
Class B1 8 - 10 8 - 11
Class B2 6 - 8 6 - 8
* - asking rent rates (EUR/sqm/month) excluding VAT and operating expenses - stable, - slight increaseSource: Colliers International
* - asking rent rates (EUR/sqm/month) excluding VAT and operating expensesf - forecastSource: Colliers International
Dynamcs of Rent Rates* in Riga
Calss A Class B1 Cass B2
EUR/
sqm
/mon
th
20
04
20
05
20
06
20
07
20
08
20
09
20
10
20
11
20
12
20
13
25
20
15
10
5
0
List of new speculative Projects under Development in Riga, 2014
PRoJect name aDDRess Gla, sQm class DeVeloPeR BuIlDInG status eXPecteD yeaR oF CoMMIssIon
G. Astras 1c G. Astras St. 1c 7,000 B1 Ektornet Commissioning 2014HQ of State Revenue Service of Latvia Talajas St. 1 43,000 Built-to-suit Biroju Centrs
Ezerparks, Ltd. Under construction 2014
Vainodes 1 Vainodes St. 1 ca 8,000 Built-to-suit Vainodes Krasti Under construction 2014Europa Business Center Ropazu St. 8 2,400 B1 Hanner Technical design 2015/2016
Z-Towers Daugavgrivas St. 9 10,000 A Towers Construction Management Under construction 2015/2016
New Hanza City, 1st Stage Pulkveza Brieza St. 24 16,300 (built-to-suit),
16,500 (spec. basis) A/Built-to-suit New Hanza City, Ltd Technical design 2016/2017
total 103,200Source: Colliers International
10Real Estate Market Overview | 2014 | Latvia | Colliers International
VacancyVacancy continued to decrease. The total vacancy rate for both speculative and built-to-suit projects in January 2014 comprised 5.3 per cent, compared to 9.3 per cent one year ago. Vacancy calculated only for speculative office buildings stood at 7.4 per cent, compared to 13.0 per cent one year ago.
Vacancy in the A class segment stood at 5.6 per cent, which is an increase compared to the 4.6 per cent recorded in 2012. The reasons lie in the trend already noted of tenants performing office downgrades in their search for expansion opportunities. Additionally, after the insolvency of Snoras the former Krajbanka building on J.Dalina Street has still not been placed in an auction and is technically recognized as an occupied BTS office building.
Total vacancy rate in B1 and B2 class office buildings accounts for 5.2 per cent and has experienced a massive decrease comparing to the 2012 figure of 10.1 per cent. Among other reasons, the decrease in vacancy was triggered by tenants moving out of A class office buildings.
Tendencies and Forecasts > Despite expected office stock supplementation in 2014, vacancy is expected to continue moderate downward movement, falling below 4.5 per cent.
> The absorption rate will slow during 2014. We expect the absorption rate of professional speculative stock to be within 15,000 - 20,000 sqm.
> Taking into account the positive economic outlook, companies will continue to expand. In previous years, expanding companies were moving into larger office premises. However, starting from this year we believe that these companies will be fragmentizing themselves in different locations, but in close proximity.
> Rent rates for A and B class office premises could slightly increase.
> Main demand for office premises is expected to come from the IT industry and opening of new shared service centres in Riga.
> Considering the diminishing amount of vacancy and increasing demand for office premises, potential tenants are expected to turn their sights to historical buildings in the city centre.
> Consolidation of the State Revenue Service in a new BTS office will free premises currently occupied by the institution across the city, including premises in the SWH office building and some downgraded office premises. This could prod the landlords to perform refurbishment or upgrade of vacant premises in order to retain market competitiveness.
> 2014 might be the right year to start considering new development opportunities.
vacancy Rates for 2013 in Riga and trends for 2014class 2012 2013 Trends For 2014Class A 4.6 % 5.6 %
Class B1 10.3 % 5.1 %
Class B2 9.7 % 5.7 %
- stable, - slight decreaseSource: Colliers International
11Real Estate Market Overview | 2014 | Latvia | Colliers International
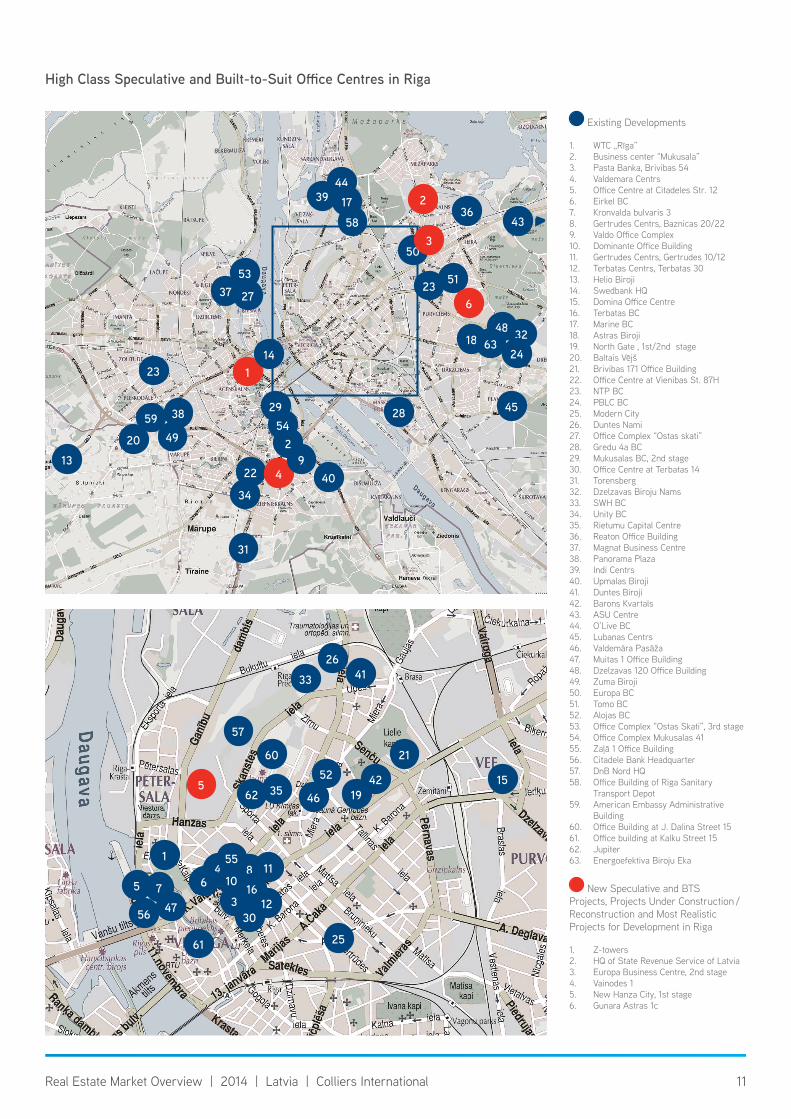
High Class Speculative and Built-to-Suit Office Centres in Riga
Existing Developments
1. WTC „Rīga”2. Business center “Mukusala”3. Pasta Banka, Brivibas 544. Valdemara Centrs5. Office Centre at Citadeles Str. 126. Eirkel BC7. Kronvalda bulvaris 38. Gertrudes Centrs, Baznicas 20/229. Valdo Office Complex10. Dominante Office Building11. Gertrudes Centrs, Gertrudes 10/1212. Terbatas Centrs, Terbatas 3013. Helio Biroji14. Swedbank HQ15. Domina Office Centre16. Terbatas BC17. Marine BC18. Astras Biroji19. North Gate , 1st/2nd stage20. Baltais Vējš 21. Brivibas 171 Office Building22. Office Centre at Vienibas St. 87H23. NTP BC24. PBLC BC25. Modern City26. Duntes Nami27. Office Complex “Ostas skati”28. Gredu 4a BC 29. Mukusalas BC, 2nd stage30. Office Centre at Terbatas 1431. Torensberg32. Dzelzavas Biroju Nams33. SWH BC34. Unity BC35. Rietumu Capital Centre36. Reaton Office Building37. Magnat Business Centre38. Panorama Plaza39. Indi Centrs40. Upmalas Biroji41. Duntes Biroji42. Barons Kvartals43. ASU Centre44. O’Live BC 45. Lubanas Centrs46. Valdemāra Pasāža47. Muitas 1 Office Building48. Dzelzavas 120 Office Building49. Zuma Biroji50. Europa BC51. Tomo BC52. Alojas BC53. Office Complex “Ostas Skati”, 3rd stage54. Office Complex Mukusalas 4155. Zaļā 1 Office Building56. Citadele Bank Headquarter57. DnB Nord HQ58. Office Building of Riga Sanitary
Transport Depot59. American Embassy Administrative
Building60. Office Building at J. Dalina Street 1561. Office building at Kalku Street 1562. Jupiter63. Energoefektiva Biroju Eka
New Speculative and BTS Projects, Projects Under Construction / Reconstruction and Most Realistic Projects for Development in Riga
1. Z-towers2. HQ of State Revenue Service of Latvia3. Europa Business Centre, 2nd stage4. Vainodes 15. New Hanza City, 1st stage6. Gunara Astras 1c
57
62
47
15
26
33 41
21
4235
1
2561
5 7
19
846 10
163
3012
1155
52
46
56
60
5
59
50
51
48
45
49
53
4439 17
36
23
3224
18 63
28
4022
34
31
1
2
3
4
6
92
29
14
37 27
23
38
20
13
58
54
43 ▷
12Real Estate Market Overview | 2014 | Latvia | Colliers International
Retail MarketGeneral Overview > Continuous improvement of the Latvian economy stimulated positive growth of the retail trade, resulting in increasing activity by the main market players, as well as increasing performance indicators of shopping centres.
> All major shopping centres experienced reorganisation and tenant mix improvements, with the main goal of rental revenue optimisation, new brand attraction and footfall maximisation.
> In Q4 2013, preparation for construction works of a major future newcomer - SC Akropolis - began on Maskavas street in the neighbourhood of the Southern Bridge, signalling that the market has improved and highlighting that the time has come to think more about development and growth while maintaining the current focus on effective existence.
SupplyBy the end of 2013, total leasable retail stock amounted to approx 658,000 sqm, consisting of shopping centre premises (413,000 sqm), big-boxes (212,500 sqm) and department stores (32,000 sqm).
In 2013, the market did not see major developments apart from minor activity from the grocery segment. A new A7 shopping centre with total GLA of 5,075 sqm opened in Kekava municipality with Rimi as anchor tenant, occupying 2,500 sqm. Additionally, Maxima commissioned and opened a new Maxima XX store with net tradable area of 1,750 sqm in Purvciems on Dzelzavas Street. Delivery of two Maxima grocery stores, which had been planned for commissioning in Q4 2013 on Dammes Street (GBA 1,000 sqm) and Biķernieku Street (GBA 7,500 sqm), were postponed to H1 2014.
Major shopping centres continued their tenant rotation, which was triggered at the beginning of the year. The main goals pursued are more effective tenant disposition and rental revenue optimization. The focus has shifted from purely rent revenue maximization concerns to tenant mix quality and presence of strong and in-demand international brands. Following this trend, Bowlero has gone through a rearrangement from being a purely leisure centre towards becoming a shopping/leisure centre with Euronics as the first tenant. Sky&More will change its concept
from a shopping centre to a “shop-in-shop” concept at the beginning of 2014 with unified retail space instead of separate shops. Additionally, SC Olimpia has declared plans to rearrange the 2nd floor part into an 8,000 sqm large brand outlet, consisting of 30 stores, in 2014.
The new development pipeline of new shopping centres is empty for 2014. However, the situation is expected to change in 2015.
* - retail stock and vacancy rates at the begining of the yearSource: Colliers International
Dynamics of Retail stock and vacancy in Riga*
20
02
20
03
20
04
20
05
20
06
20
07
20
08
20
09
20
10
20
11
20
12
20
13
20
14
700
600
500
400
300
200
100
0
Total Stock at the Beginning of the PeriodAdditions to StockExpected ConstructionShopping Centre Vacancy
Thou
sand
s, s
qm
12
10
8
6
4
2
0
%
* - retail stock at the begining of the yearSource: Colliers International
Distribution of the Retail stock in Riga by Property type*
20
02
20
03
20
04
20
05
20
06
20
07
20
08
20
09
20
10
20
11
20
12
20
13
20
14
700
600
500
400
300
200
100
0
Shopping Centre Expected Construction Big-boxDepartment Store Additions to Stock
Thou
sand
s, s
qm
13Real Estate Market Overview | 2014 | Latvia | Colliers International
In Q4 2013, preparation for construction works of a major future newcomer - SC Akropolis - began on Maskavas street in the neighbourhood of the Southern Bridge. The announced retail GLA of the new shopping centre is 60,000 sqm. Completion of Akropolis is expected in 2015 - 2016. This newcomer is expected to have a notable effect on competition in the local retail market, as in the context of decreasing population the current footfall of existing players will be redistributed. Additionally, still moderate growth of consumers’ disposable incomes will not allow absorption of additional stock without changing the current balance in the Riga shopping centre market.
Along with the development of Akropolis, during 2014 major market players are expected to decide upon realisation of their new development plans.
Linstow Centre Management, one of the key local market players, plans to expand its major shopping centres - Origo and Alfa. These plans presume expansion of Alfa by approx 11,500 sqm and expansion of Origo by a new 6 - 7 floor wing consisting of 20,000 sqm of retail premises on the first three floors and an office part on the higher floors.
ELL, another major retail market player in Riga, is also considering potential expansion of its own shopping centre, Spice Home. Though no clear development schedule has been announced yet, we expect news of this development to appear during 2014.
Expansion decisions by the major market players will heavily depend on the situation around the latest newcomer - Akropolis.
DemandDuring 2013, Riga’s retail market continued to face increasing demand for retail premises. This tendency was especially evident in prime shopping centres and key street retail locations.
International brands which entered the Latvian market in 2012 pursued expansion. H&M opened a new store in SC Mols, occupying 1,200 sqm. In December 2013, Riga experienced the return of the Audimas sportswear brand, occupying 188 sqm in SC Domina. Moreover, stores of such new brands as the Italian luxury fashion brand Faconnable and the international brand Next opened in SC Domina. Among catering newcomers in recent years, Charlie Pizza expanded its chain to SC Domina and SC Spice, supplementing their existing restaurant on the Dome square. CCC shoe stores expanded their presence by opening a new store in SC Mols. Additionally, Reserved and Mohito leased a total of approx 2,000 sqm in Galleria Riga.
2014 is expected to continue the established trend of new brand entry and new openings. By the end of 2013, international sandwich restaurant chain Subway had announced their entry to the Latvian and other Baltic State markets. Debenhams is opening its first store in Spice in March/April 2014. Moreover, H&M is introducing the first H&M Home concept in the Baltics to Riga Plaza, as well as planning to open an additional H&M store in SC Spice in March 2014
Parallel to increasing activity by shopping centres, the street retail segment has been growing ever more active. International brands that are largely represented in shopping centres continued to consider opportunities to open street retail stores in active locations with high pedestrian flow. This trend could lead to a considerable increase in rent rates and could promote the creation of high street retail areas or dense retail districts.
Rent RatesAlong with the economic recovery and increasing demand for retail areas in 2013, rent rates in shopping centres experienced annual growth. During 2013, we saw an increase in rental margins of small and medium retail areas. By the end of the year the main players shifted their focus to attracting strong international brands and sacrificing potential rent maximization in favour of tenant mix improvement. Street retail rent rates continued upward movement along with increasing demand for street retail premises.
Source: Colliers International
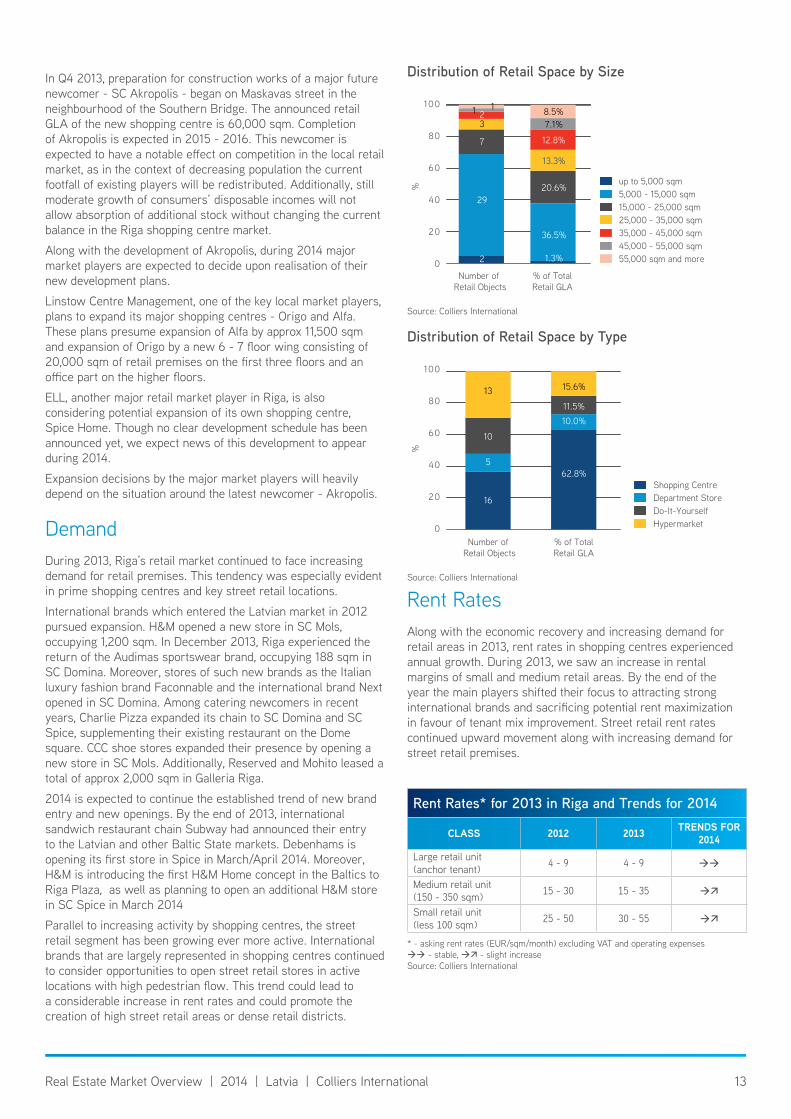
Distribution of Retail space by size
12.8%
13.3%
20.6%
36.5%
1.3%
8.5%7.1%
7
29
2
321 1
Number of Retail Objects
% of Total Retail GLA
up to 5,000 sqm5,000 - 15,000 sqm15,000 - 25,000 sqm25,000 - 35,000 sqm35,000 - 45,000 sqm45,000 - 55,000 sqm55,000 sqm and more
%
100
80
60
40
20
0
Source: Colliers International
Distribution of Retail space by type
Number of Retail Objects
% of Total Retail GLA
10.0%
62.8%
11.5%
15.6%
16
5
10
13
Shopping CentreDepartment StoreDo-It-YourselfHypermarket
%
100
80
60
40
20
0
Rent Rates* for 2013 in Riga and trends for 2014
class 2012 2013 Trends For 2014
Large retail unit (anchor tenant) 4 - 9 4 - 9
Medium retail unit (150 - 350 sqm) 15 - 30 15 - 35
Small retail unit (less 100 sqm) 25 - 50 30 - 55
* - asking rent rates (EUR/sqm/month) excluding VAT and operating expenses - stable, - slight increaseSource: Colliers International
14Real Estate Market Overview | 2014 | Latvia | Colliers International
VacancyAs of January 2014, the average vacancy rate in all shopping centres was 2.3 per cent. During 2013 vacancy decreased by 5,000 sqm. Vacancy continued to be biased among shopping centres, accounting for close to zero per cent in the most successful shopping centres, 2 - 5 per cent in the less successful ones and approx 10 per cent in a few shopping centres.
The announced market exit of Dressmann, BikBok and Cubus will not have a negative effect on vacancy in 2014, but vacant premises will be quickly absorbed either by new entrants or tenants already standing in line for retail areas.
Overall, almost all vacant premises in key locations are occupied and landlords are shifting towards pursuing quality of tenant mix.
Tendencies and Forecasts > In the absence of external economic shocks, the market should continue to show positive development figures, supported by continuously growing consumption and improvement in wage and unemployment levels.
> Key market players, which have been actively improving tenant mix and attracting new brands to their properties, will start to experience the benefits of their efforts invested during previous years.
> New retail area supply additions in the face of SC Akropolis are already initiated and are expected to change the distribution of consumers and to affect the performance indicators of existing properties.
> First expansion plans may be announced by the main market players in 2014. In our opinion, announcement of expansion plans may come from any of the major market players, continuing to strengthen its established market position. The question is: who will be the one to make the first move?
> Demand will continue to be strong, supported by incoming brands and expansion of those already present.
> Vacancy has reached a minimum and further minor improvement is possible only in respect of smaller and less successful shopping centres.
> Given the dense occupation of the major retail properties, rent rates will develop in line with current rent rate indexation terms. Since rent indexation in most rental agreements is pegged to CPI, which was 0.0 per cent in 2013, we shall see quite insignificant increase of rent rates in 2014.
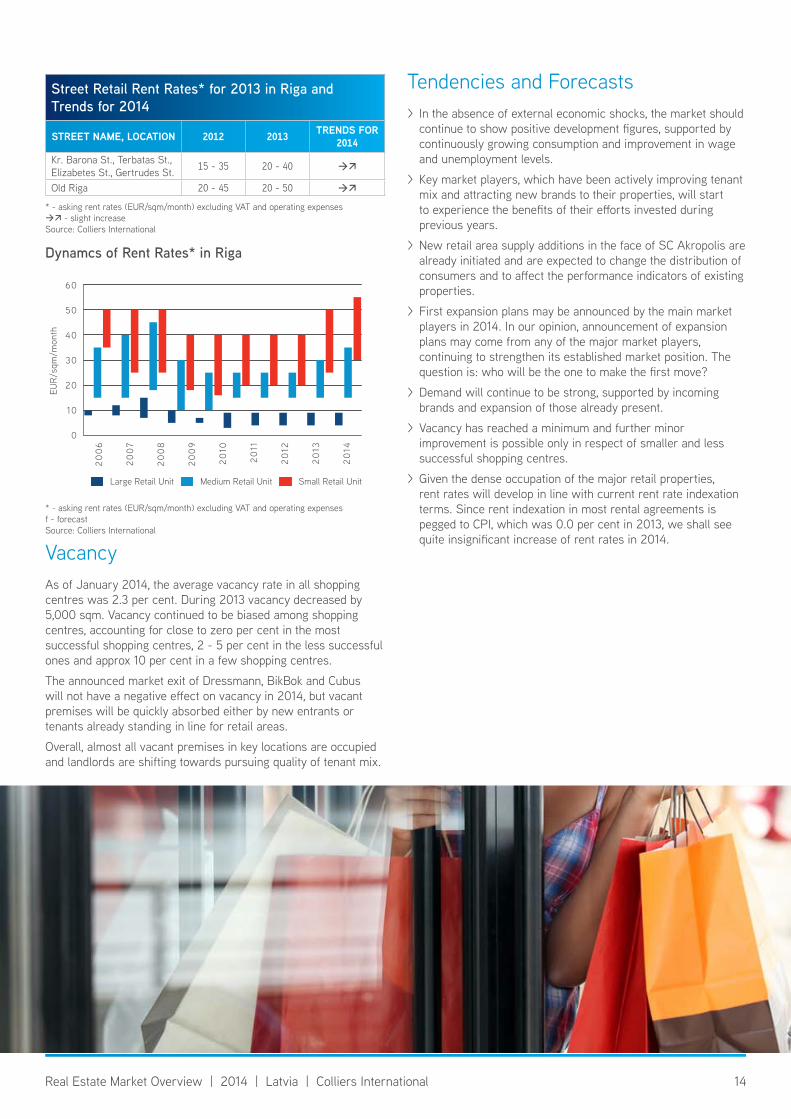
street Retail Rent Rates* for 2013 in Riga and trends for 2014
stReet name, locatIon 2012 2013 Trends For 2014
Kr. Barona St., Terbatas St., Elizabetes St., Gertrudes St. 15 - 35 20 - 40
Old Riga 20 - 45 20 - 50
* - asking rent rates (EUR/sqm/month) excluding VAT and operating expenses - slight increaseSource: Colliers International
* - asking rent rates (EUR/sqm/month) excluding VAT and operating expensesf - forecastSource: Colliers International
Dynamcs of Rent Rates* in Riga
Large Retail Unit Medium Retail Unit Small Retail Unit
EUR/
sqm
/mon
th
20
06
20
07
20
08
20
09
20
10
20
11
20
12
20
13
20
14
60
50
40
30
20
10
0
15Real Estate Market Overview | 2014 | Latvia | Colliers International
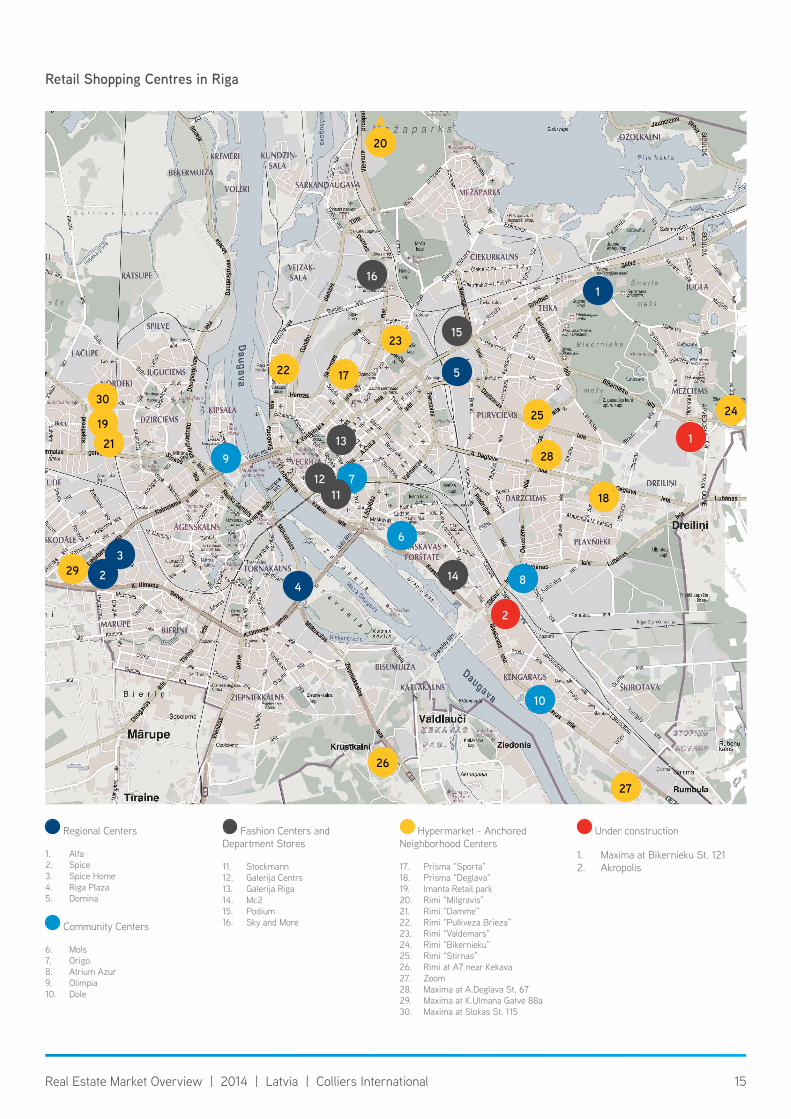
Retail shopping Centres in Riga
Regional Centers
1. Alfa2. Spice3. Spice Home4. Riga Plaza5. Domina
Community Centers
6. Mols7. Origo8. Atrium Azur9. Olimpia10. Dole
Fashion Centers and Department Stores
11. Stockmann12. Galerija Centrs13. Galerija Riga14. Mc215. Podium16. Sky and More
Hypermarket - Anchored Neighborhood Centers
17. Prisma “Sporta”18. Prisma “Deglava”19. Imanta Retail park20. Rimi “Milgravis”21. Rimi “Damme”22. Rimi “Pulkveza Brieza”23. Rimi “Valdemars”24. Rimi “Bikernieku”25. Rimi “Stirnas”26. Rimi at A7 near Kekava27. Zoom28. Maxima at A.Deglava St. 6729. Maxima at K.Ulmana Gatve 88a30. Maxima at Slokas St. 115
Under construction
1. Maxima at Bikernieku St. 1212. Akropolis
1
23
4
5
6
8
10
9
7
16
12
13
11
14
15
2119
30
29
1722
23
27
25
26
28
18
24
1
2
20
16Real Estate Market Overview | 2014 | Latvia | Colliers International
Industrial MarketGeneral Overview > The industrial real estate market continued to be active in terms of demand throughout 2013, which even led to shortage of large premises in the absence of new developments.
> In 2013 development activity in the industrial real estate market finally restarted and as a result three new projects are expected to arrive on the market in 2014, supplementing industrial real estate stock by 63,500 sqm of leasable area.
> Due to the recent political crisis between Lithuania and Russia, a number of companies shifted their focus to the Latvian real estate market.
> Two large scale logistic and distribution companies, Via 3L Latvia and Sanitex/BLS, each began the process of consolidating their warehouse operations to single individual locations in 2013, which in our opinion is the first sign of a tendency to be continued in the near future by other large industrial players.
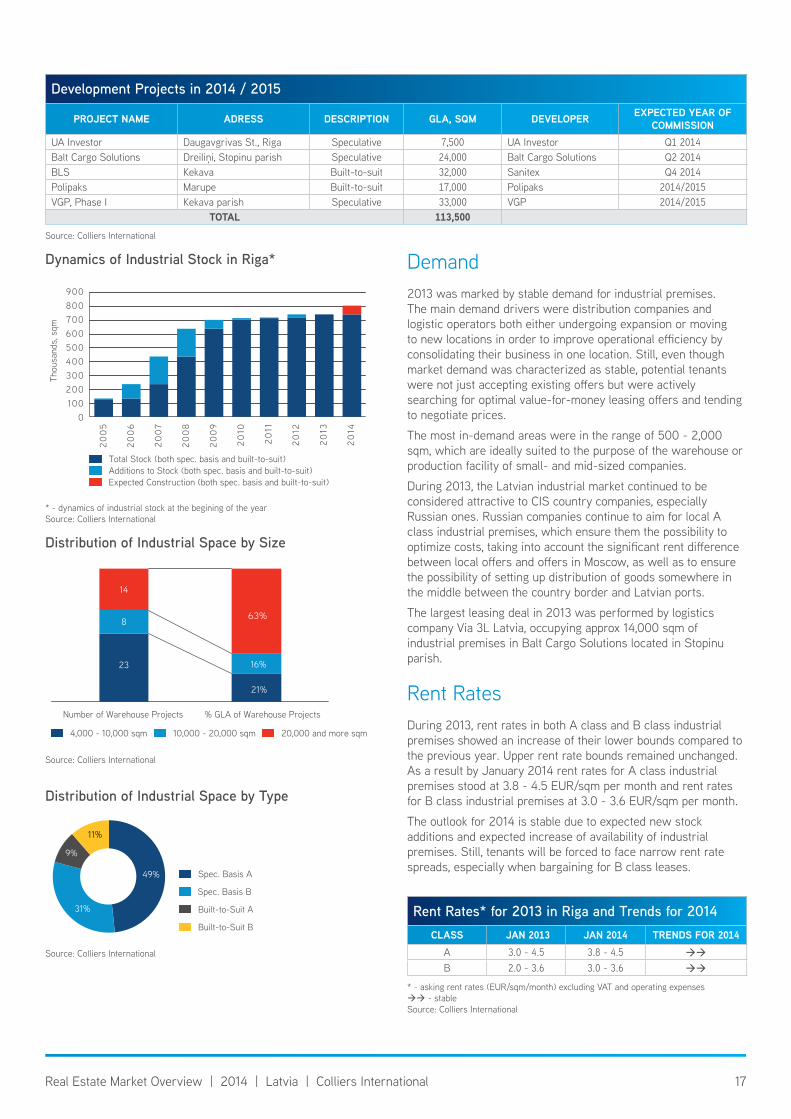
SupplyAt the beginning of 2013, the Colliers International commercial real estate database on the industrial and warehouse segment was revised and updated in order to reflect changes in GLA areas. By the end of 2013, total leasable industrial stock amounted to approx 743,500 sqm, consisting of 591,200 sqm of speculative premises and 152,300 sqm of built-to-suit premises. Around 40 per cent of total stock is located within Riga city limits. The other 60.0 per cent is located around the Riga Ring Road (near Kekava, Olaine, Marupe, Salaspils and Jelgava).
During 2013, there were no new additions to industrial stock. However, after almost three quiet years development activity has finally resumed. By the end of 2013, we saw the development pipeline as consisting of four projects, which are expected to arrive on the market in 2014 / 2015. Among them are two speculative projects: UA Investor on Daugavgrivas St., consisting of approx 7,500 sqm of GLA and expected to be completed in Q1 2014, and Balt Cargo Solutions, consisting of approx 24,000 sqm of GLA and expected to be completed in Q2 2014. Moreover, in 2014 / 2015 two built-to-suit projects are expected to arrive on the market: BLS, totalling approx 32,000 sqm of GLA and
expected to arrive on the market in Q4 2014, plus premises with 17,000 sqm of GLA, currently under construction by Merks for Polipaks and expected to be commissioned in 2014 / 2015. Additionally, in 2014 VGP plans to start construction of the 1st phase of a speculative project in Kekava parish, estimated at 33,000 sqm of GLA.
As a result, in 2014 we anticipate the most significant increase of industrial stock since 2010. Still, the general trend remains that developers are willing to engage in new construction only in the event of having a predefined client. Additionally, shortage of premises above 10,000 sqm is observed.
Source: Central Statistical Bureau
volume indices of industrial Production (2010=100)
%
130
120
110
100
90
80
70
602009 2010 2011 2012 2013
Source: Central Statistical Bureau
Amount of Goods Carried
Amount Carried by Road Carried by RailwayCarried in LV Ports
Mill
ion
Tonn
s
50
40
30
20
10
0
2009 2010 2011 2012 2013Q1-Q3 Q1-Q3 Q1-Q3 Q1-Q3 Q1-Q3
17Real Estate Market Overview | 2014 | Latvia | Colliers International
Demand2013 was marked by stable demand for industrial premises. The main demand drivers were distribution companies and logistic operators both either undergoing expansion or moving to new locations in order to improve operational efficiency by consolidating their business in one location. Still, even though market demand was characterized as stable, potential tenants were not just accepting existing offers but were actively searching for optimal value-for-money leasing offers and tending to negotiate prices.
The most in-demand areas were in the range of 500 - 2,000 sqm, which are ideally suited to the purpose of the warehouse or production facility of small- and mid-sized companies.
During 2013, the Latvian industrial market continued to be considered attractive to CIS country companies, especially Russian ones. Russian companies continue to aim for local A class industrial premises, which ensure them the possibility to optimize costs, taking into account the significant rent difference between local offers and offers in Moscow, as well as to ensure the possibility of setting up distribution of goods somewhere in the middle between the country border and Latvian ports.
The largest leasing deal in 2013 was performed by logistics company Via 3L Latvia, occupying approx 14,000 sqm of industrial premises in Balt Cargo Solutions located in Stopinu parish.
Rent RatesDuring 2013, rent rates in both A class and B class industrial premises showed an increase of their lower bounds compared to the previous year. Upper rent rate bounds remained unchanged. As a result by January 2014 rent rates for A class industrial premises stood at 3.8 - 4.5 EUR/sqm per month and rent rates for B class industrial premises at 3.0 - 3.6 EUR/sqm per month.
The outlook for 2014 is stable due to expected new stock additions and expected increase of availability of industrial premises. Still, tenants will be forced to face narrow rent rate spreads, especially when bargaining for B class leases.
* - dynamics of industrial stock at the begining of the yearSource: Colliers International
Dynamics of industrial stock in Riga*
20
05
20
06
20
07
20
08
20
09
20
10
20
11
20
12
20
13
20
14
900800700600500400300200100
0
Expected Construction (both spec. basis and built-to-suit)Additions to Stock (both spec. basis and built-to-suit)Total Stock (both spec. basis and built-to-suit)
Thou
sand
s, s
qm
Source: Colliers International
Distribution of industrial space by size
4,000 - 10,000 sqm 10,000 - 20,000 sqm 20,000 and more sqm
23
8
14
21%
16%
63%
Number of Warehouse Projects % GLA of Warehouse Projects
Source: Colliers International
Distribution of industrial space by type
31%
49%
11%
9%
Spec. Basis A
Spec. Basis B
Built-to-Suit A
Built-to-Suit B
Development Projects in 2014 / 2015
PRoJect name aDRess DescRIPtIon Gla, sQm DeVeloPeR eXPeCTed YeAr oF commIssIon
UA Investor Daugavgrivas St., Riga Speculative 7,500 UA Investor Q1 2014Balt Cargo Solutions Dreiliņi, Stopinu parish Speculative 24,000 Balt Cargo Solutions Q2 2014BLS Kekava Built-to-suit 32,000 Sanitex Q4 2014Polipaks Marupe Built-to-suit 17,000 Polipaks 2014/2015VGP, Phase I Kekava parish Speculative 33,000 VGP 2014/2015
total 113,500Source: Colliers International
Rent Rates* for 2013 in Riga and trends for 2014class JAn 2013 JAn 2014 Trends For 2014
A 3.0 - 4.5 3.8 - 4.5
B 2.0 - 3.6 3.0 - 3.6
* - asking rent rates (EUR/sqm/month) excluding VAT and operating expenses - stableSource: Colliers International
18Real Estate Market Overview | 2014 | Latvia | Colliers International
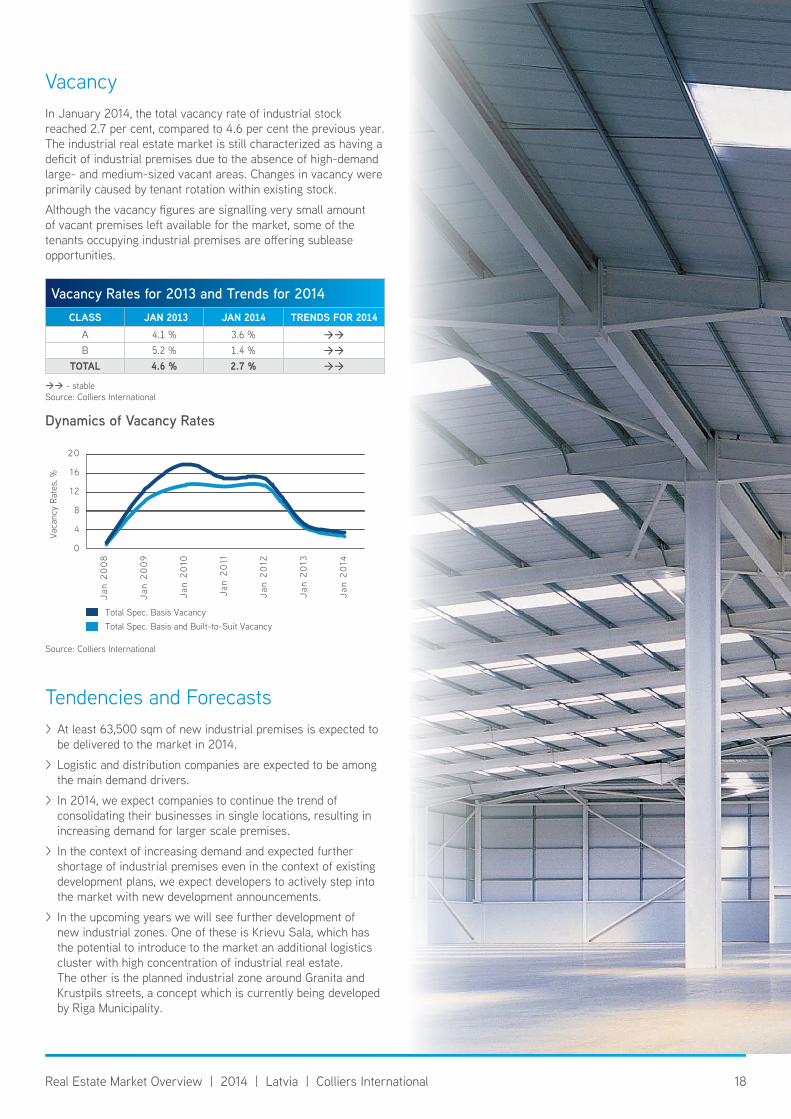
VacancyIn January 2014, the total vacancy rate of industrial stock reached 2.7 per cent, compared to 4.6 per cent the previous year. The industrial real estate market is still characterized as having a deficit of industrial premises due to the absence of high-demand large- and medium-sized vacant areas. Changes in vacancy were primarily caused by tenant rotation within existing stock.
Although the vacancy figures are signalling very small amount of vacant premises left available for the market, some of the tenants occupying industrial premises are offering sublease opportunities.
Tendencies and Forecasts > At least 63,500 sqm of new industrial premises is expected to be delivered to the market in 2014.
> Logistic and distribution companies are expected to be among the main demand drivers.
> In 2014, we expect companies to continue the trend of consolidating their businesses in single locations, resulting in increasing demand for larger scale premises.
> In the context of increasing demand and expected further shortage of industrial premises even in the context of existing development plans, we expect developers to actively step into the market with new development announcements.
> In the upcoming years we will see further development of new industrial zones. One of these is Krievu Sala, which has the potential to introduce to the market an additional logistics cluster with high concentration of industrial real estate. The other is the planned industrial zone around Granita and Krustpils streets, a concept which is currently being developed by Riga Municipality.
vacancy Rates for 2013 and trends for 2014class JAn 2013 JAn 2014 Trends For 2014
A 4.1 % 3.6 %
B 5.2 % 1.4 %
total 4.6 % 2.7 %
- stableSource: Colliers International
Source: Colliers International
Dynamics of vacancy Rates
Total Spec. Basis Vacancy Total Spec. Basis and Built-to-Suit Vacancy
Vaca
ncy
Rate
s, %
20
16
12
8
4
0
Jan
20
08
Jan
20
09
Jan
20
10
Jan
20
11
Jan
20
12
Jan
20
13
Jan
20
14
19Real Estate Market Overview | 2014 | Latvia | Colliers International
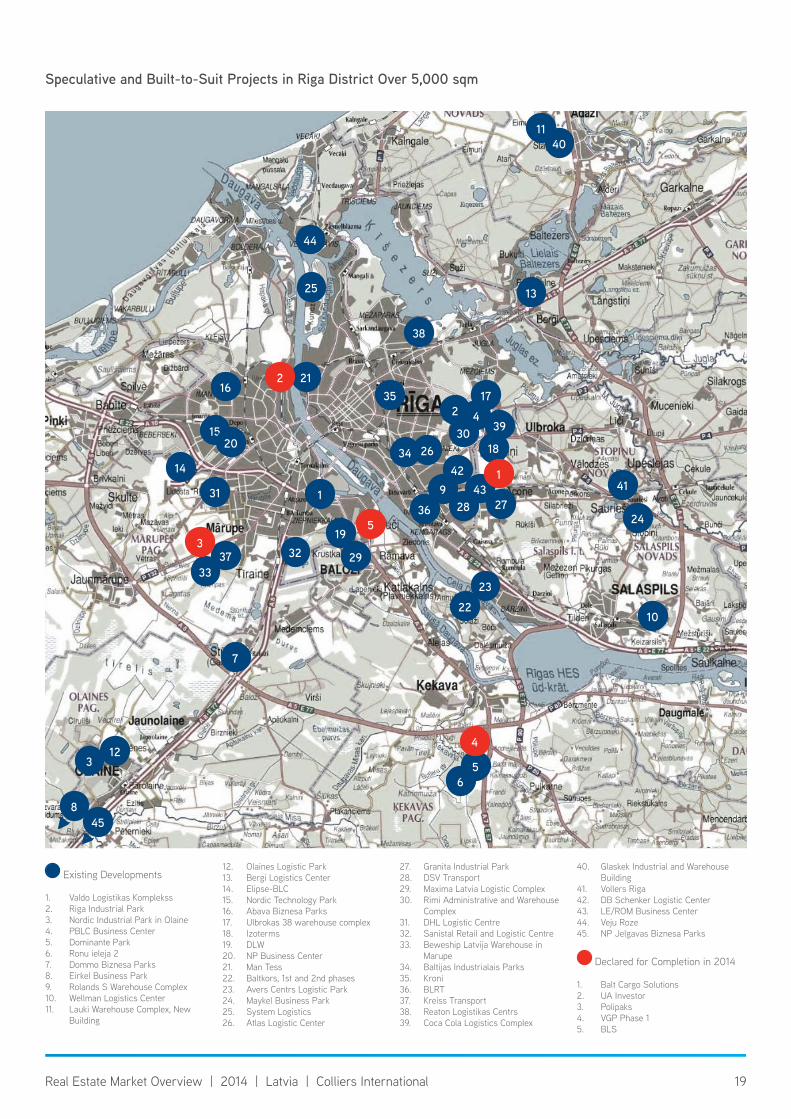
speculative and Built-to-suit Projects in Riga District Over 5,000 sqm
Existing Developments
1. Valdo Logistikas Komplekss2. Riga Industrial Park3. Nordic Industrial Park in Olaine4. PBLC Business Center5. Dominante Park6. Ronu ieleja 27. Dommo Biznesa Parks8. Eirkel Business Park9. Rolands S Warehouse Complex10. Wellman Logistics Center11. Lauki Warehouse Complex, New
Building
12. Olaines Logistic Park13. Bergi Logistics Center14. Elipse-BLC 15. Nordic Technology Park16. Abava Biznesa Parks17. Ulbrokas 38 warehouse complex18. Izoterms19. DLW20. NP Business Center21. Man Tess22. Baltkors, 1st and 2nd phases 23. Avers Centrs Logistic Park24. Maykel Business Park25. System Logistics26. Atlas Logistic Center
27. Granita Industrial Park28. DSV Transport29. Maxima Latvia Logistic Complex30. Rimi Administrative and Warehouse
Complex31. DHL Logistic Centre32. Sanistal Retail and Logistic Centre33. Beweship Latvija Warehouse in
Marupe34. Baltijas Industrialais Parks35. Kroni36. BLRT37. Kreiss Transport38. Reaton Logistikas Centrs39. Coca Cola Logistics Complex
40. Glaskek Industrial and Warehouse Building
41. Vollers Riga42. DB Schenker Logistic Center43. LE/ROM Business Center44. Veju Roze45. NP Jelgavas Biznesa Parks
Declared for Completion in 2014
1. Balt Cargo Solutions 2. UA Investor3. Polipaks4. VGP Phase 15. BLS
123
7
5
4
10
23
22
9
21
44
25
16
1520
1
19
293733
32
14
2 4
13
38
35
1140
17
34 26
2836
4327
39
1830
42 1
53
2
6
8▷
45▷
24
4131
20Real Estate Market Overview | 2014 | Latvia | Colliers International
Hotel MarketGeneral Overview > During 2013, the number of visitors to Latvian hotels and other accommodation establishments grew for the fourth year in a row.
> Russian and CIS country tourists continued to constitute a significant part of accommodation industry clients.
> The Latvian hotel market is dominated by 4-star hotels. In 2013, two more hotels upgraded their ratings to join the 4-star hotel group.
> Occupancy and performance indicators were improving, slowly but steadily returning to pre-crisis levels.
> Positive visitation dynamics were significantly supported by continuous development of tourist attraction sites and major public events taking place throughout the year.
SupplyBy the end of 2013, the supply of hotels in Latvia stood at 214, among which 104 were not certified. Half of the hotels and 70.0 per cent of the hotel rooms were located in Riga and Jurmala. Additionally, the most significant part of hotel room supply is dominated by 4-star hotel rooms, constituting 52.0 per cent of total Latvian hotel room stock and 62.0 per cent of total Riga hotel stock respectively. During the year, Riga hotel room stock increased by 92 rooms.
The Latvian hotel market continued to be dominated by local hotel operators and has only four international hotel chains present: Rezidor, Wyndham, Choice Hotels and Best Western. However, according to available information at least one additional international chain may enter the Latvian hotel market in 2014 / 2015.
During 2013, two new hotels were opened in Old Riga: the 4-star 60-room Hotel Astor in the Old Town and the 4-star 120-room Wellton Centrum Hotel and Spa. Additionally, the Albert Hotel, Hotel „Radi un Draugi” and the City Hotel were upgraded from 3-star to 4-star class, while Hotel Riga and Hotel Metropole were closed for reconstruction and rebranding. More hotel stock additions are planned in 2014 / 2015, with expected commissioning of at least three newly developed hotels, located at Jekaba Street 24 and Mercure Hotel at Elizabetes Street 101,
which are being developed by the same owner, and an additional Wellton hotel on Valnu Street. Hotel FG Royal was purchased by investors from Azerbaijan. Moreover, in the upcoming years, a historical building at Grecinieku Street 34, which was bought from Riga Municipality by local private investors at auction in Q2 2013, may be turned into a hotel.
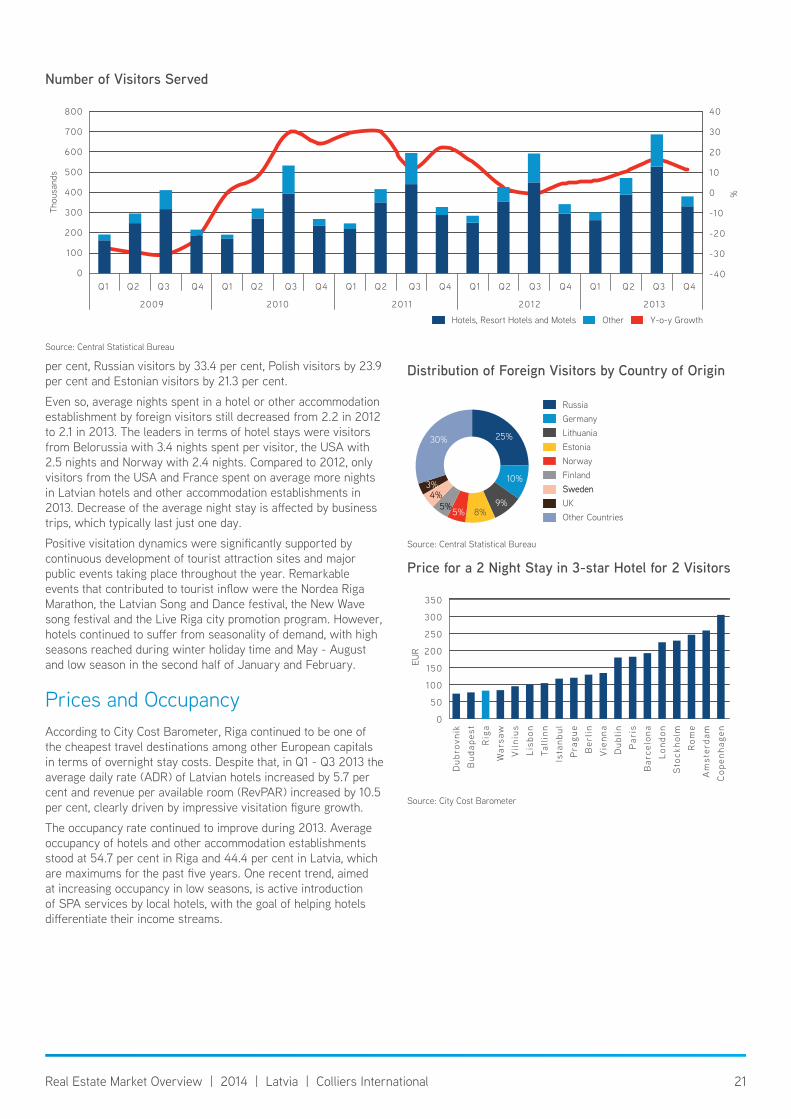
DemandThroughout 2013, the number of people serviced by Latvian hotels and other accommodation establishments showed positive growth. A total of 1.84 million visitors were serviced by the Latvian hotel industry, among which 1.25 million or 67.0 per cent were foreign visitors. The total number of visitors in 2013 grew by 11.8 per cent while the number of foreign visitors grew by 14.0 per cent compared to 2012.
Russian, German, Lithuanian and Estonian visitors accounted for more than a half of all foreign visitors in 2013 with Russian visitors alone standing out with 25.0 per cent. Compared to 2012, in 2013 the number of Belorussian visitors grew by 36.5
number of hotels and Rooms in Latvia and Riga
staRslatVIa RIGa
Hotels Rooms Hotels Rooms5-star 7 300 6 2584-star 36 3,618 25 3,1943-star 61 2,973 28 1,6222-star 4 77 1 281-star 2 45 2 45
ToTAl CerTIFIed 110 7,013 62 5,147Non-certified 104 2,486 30 956
total 214 9,499 92 6,103Source: Central Statistical Bureau
Source: Central Statistical Bureau
Distribution of hotels by number of stars in Latvia
33%
55%
4%2%
6%
5-star
4-star
3-star
2-star
1-star
21Real Estate Market Overview | 2014 | Latvia | Colliers International
per cent, Russian visitors by 33.4 per cent, Polish visitors by 23.9 per cent and Estonian visitors by 21.3 per cent.
Even so, average nights spent in a hotel or other accommodation establishment by foreign visitors still decreased from 2.2 in 2012 to 2.1 in 2013. The leaders in terms of hotel stays were visitors from Belorussia with 3.4 nights spent per visitor, the USA with 2.5 nights and Norway with 2.4 nights. Compared to 2012, only visitors from the USA and France spent on average more nights in Latvian hotels and other accommodation establishments in 2013. Decrease of the average night stay is affected by business trips, which typically last just one day.
Positive visitation dynamics were significantly supported by continuous development of tourist attraction sites and major public events taking place throughout the year. Remarkable events that contributed to tourist inflow were the Nordea Riga Marathon, the Latvian Song and Dance festival, the New Wave song festival and the Live Riga city promotion program. However, hotels continued to suffer from seasonality of demand, with high seasons reached during winter holiday time and May - August and low season in the second half of January and February.
Prices and OccupancyAccording to City Cost Barometer, Riga continued to be one of the cheapest travel destinations among other European capitals in terms of overnight stay costs. Despite that, in Q1 - Q3 2013 the average daily rate (ADR) of Latvian hotels increased by 5.7 per cent and revenue per available room (RevPAR) increased by 10.5 per cent, clearly driven by impressive visitation figure growth.
The occupancy rate continued to improve during 2013. Average occupancy of hotels and other accommodation establishments stood at 54.7 per cent in Riga and 44.4 per cent in Latvia, which are maximums for the past five years. One recent trend, aimed at increasing occupancy in low seasons, is active introduction of SPA services by local hotels, with the goal of helping hotels differentiate their income streams.
Source: Central Statistical Bureau
Distribution of Foreign visitors by Country of Origin
Russia GermanyLithuaniaEstoniaNorwayFinland Sweden UKOther Countries
Sweden
30%
8%
10%
9%5%5%
3%4%
25%
Source: Central Statistical Bureau
number of visitors served
Hotels, Resort Hotels and Motels Other Y-o-y Growth
800
700
600
500
400
300
200
100
0
%
40
30
20
10
0
-10
-20
-30
-40
2009 2010 2011 2012 2013
Q1 Q2 Q3 Q4 Q1 Q2 Q3 Q4 Q1 Q2 Q3 Q4 Q1 Q2 Q3 Q4 Q1 Q2 Q3 Q4
Thou
sand
s
Source: City Cost Barometer
Price for a 2 night stay in 3-star hotel for 2 visitors
EUR
Dub
rovn
ikB
udap
est
Rig
aW
arsa
wV
ilni
usLi
sbon
Tall
inn
Ista
nbul
Pra
gue
Ber
lin
Vie
nna
Dub
lin
Par
isB
arce
lona
Lond
onS
tock
holm
Rom
eA
mst
erda
mC
open
hage
n
350
300
250
200
150
100
50
0
22Real Estate Market Overview | 2014 | Latvia | Colliers International
Tendencies and Forecasts > We expect further market development both in terms of visitation and hotel performance indicators. Additionally, we expect Riga hotel room stock to be supplemented by more than 350 rooms from new developments commissioned in 2014 / 2015.
> Ongoing consistent support for development of tourist attraction sites and major public events, promoting Latvia’s image globally, will continue to yield results. Additionally, the fact that Riga had been awarded the status of European Capital of Culture in 2014 will yield additional benefits for the hotel industry, especially in the long run.
> Expected entry of additional international chains will strengthen their market share and market influence, leading to a more predictable and organized market in terms of room rates and performance indicator benchmarks.
> Most of the existing hotels which were put up for sale have already been sold. The appearance of new hotels is expected to occur mainly in the context of development of historical buildings or new construction.
Room Prices in Latvian Accommodation
staRs Room Rate RanGe, euR
most common Room Rate, euR
5-star 199 - 1,800 3504-star 49 - 450 903-star 26 - 400 60
Source: Colliers International
Source: Central Statistical Bureau
Dynamics of Average Monthly Room Occupancy Rate in Accommodation establishments
%
20
07
20
08
20
09
20
10
20
11
20
12
20
13
70
60
50
40
30
20
10
0
Riga Latvia

23Real Estate Market Overview | 2014 | Latvia | SORAINEN
Legal OverviewReal estate in Latvia can be purchased in two ways - via an asset transfer deal or via a share transfer deal. Asset deals and share deals are both commonly used in practice.
Asset Transfer Deals
Main Steps Usually the sale of real estate by one party (seller) to another party (buyer) would be completed within 2 - 3 months following these main steps:
1. The parties sign a single purchase agreement.
2. Sometimes, in the case of a larger real estate transaction, prior to the final purchase agreement another agreement (letter of intent or preliminary purchase agreement) is concluded. The preliminary agreement sets out the main terms of the deal (e.g. purchase price, payment mechanism, main deadlines to complete due diligence of the real estate and sign the final agreement).
3. The seller offers the municipality or third parties the chance to exercise their right of first refusal to acquire the property on the same conditions as agreed in the signed purchase agreement. The municipality has up to 20 days to do so, but the term for third parties can be different.
4. If a party with a right of first refusal acquires the property, then the purchase agreement signed between the parties terminates in respect of real estate acquired by third parties.
5. Simultaneously with the purchase agreement, the parties negotiate and conclude an agreement with a bank on opening and maintaining an escrow account at the bank.
6. The seller notifies the buyer on receipt of refusals from all third parties with a right of first refusal to acquire the real estate or alternatively the seller confirms that third parties have not replied to the offer to exercise their right within the given term.
7. If third parties (e.g. the municipality) do not exercise their right of first refusal, the buyer transfers the purchase price (100 per cent) to the escrow account.
8. After transfer of the purchase price the parties in the presence of a notary public sign the application to the Land Book for registration of the buyer’s title to the real estate. The buyer pays state and stamp duties.
9. The seller files the documents with the Land Book and performs other acts in order to register the buyer’s title with the Land Book.
10. After the buyer’s title is registered with the Land Book, the bank transfers the purchase price to the seller.
If the purchase of real estate is financed by a third party (e.g. a bank) then the lender will require security in the form of a mortgage. This means that a third party will be involved in the transaction. This is usually done by having the third party as a party to the escrow account agreement. There the bank would undertake the obligation to finance payment of the purchase price if mortgages and encumbrances are established.
Main Advantages and Drawbacks > Registration of title and thus payment of notary fees as well as state and stamp duty is required.
> Limited scope of due diligence investigation is required since the review concerns the target asset only.
> Agreements on supply of utilities and other services concluded by the seller must be assigned to the buyer or new agreements must be signed with utility and service providers.
> An asset transaction may in some cases be treated as sale of the entire company, in which case all obligations associated with the company may be transferred from the seller to the buyer.
Share Transfer Deals
Main StepsThe main steps for share transfer deals are:
1. Initial agreement on the transaction. This involves the understanding by both parties of the sale process. At this stage, the parties would sign a Letter of Intent (usually non-binding apart from confidentiality and exclusivity clauses) that will in general state the understanding of both parties on the subject of the sale and the potential price (including price calculation). Usually at this stage a due diligence of the target company starts. Depending on the volume and business activities of the target company, the buyer performs legal due diligence, financial due diligence, tax due diligence, as well as technical, environmental, and other due diligences. The aim of the due diligence is to identify potential risks having negative consequences on the business or share value of the target company. Results of the due diligence can lead to decrease of the purchase price, change of the deal structure or even to a decision not to proceed with the transaction.
2. Agreement on terms and conditions of the transaction. If the results of the due diligence are satisfactory, the parties start work on the transaction documents. In practice, the first draft of the share purchase agreement is provided by the buyer. Depending on the complexity of the transaction, negotiations on the terms and conditions of the transaction documents can take from several weeks to several months.
3. Closing the transaction. When the parties have agreed on all terms and conditions of the transaction agreements, signing of documents takes place. Depending on the complexity of the transaction and the business type of the target company (e.g. whether this is a regulated company) as well as on whether the purchase of target company shares is considered as a merger under Latvian Competition Law, the time required for closing the transaction can vary from a couple of weeks to several months after signing the transaction agreements. The time for closing is required for the target company to obtain e.g. any consents required for change of control or merger clearances, as well as to provide other documents and perform other acts required for closing so that the title to the shares and control of the target company can be transferred from the seller to the buyer on the closing date. These include e.g. change of the target company management board to ensure transfer of control to the buyer on the closing date. Between signing and closing the transaction, the buyer has to obtain the
24Real Estate Market Overview | 2014 | Latvia | SORAINEN
sum required to complete the purchase, which is usually paid into the escrow account before the closing date.
4. Registration of changes in the Latvian Enterprise Register. Depending on the form of company (e.g. private limited liability company, public limited liability company, partnership), certain registration procedures must be carried out in the Latvian Enterprise Register and signatures of most of the documents that have to be submitted must be notarised. Registration may involve: registration of change of Articles of Association, change of the target company management board and notification of change of target company shareholders.
Key Issues to Take into AccountWhen considering a share transfer of a company holding target real estate the following should inter alia be taken into account:
> the buyer is considered to be the seller’s legal successor, so that registration of the buyer’s title to real estate (and payment of related expenses) is not required;
> ownership of shares is transferred to the buyer at the time of signing the agreement or on registration with the Registry of Enterprises, depending on the agreement. Registration of ownership of shares usually takes a few days;
> when implementing a transfer of a private limited liability company’s shares, the signatures of both the buyer of the shares and the seller of the shares must be notarised;
> upon completion of share transfer, the buyer assumes responsibility for the whole company, including any matters that occurred before change of ownership;
> due diligence investigations are more extensive than in asset transfer as the entire company (with all its rights and liabilities irrespective of whether they were known to the buyer at the time of concluding the agreement) is transferred, as opposed to transfer of the target real estate only;
> applicability of financial assistance rules;
> deferred tax issues.
Title to Real Estate, Land BookTitle to real estate is formally created upon registration with the Land Book. Before registration the transaction remains valid between the parties but is not binding on third parties and the buyer cannot exercise ownership rights or other property rights to the real estate.
Registration of title is carried out on the basis of an application signed by both seller and buyer in the presence of a notary. Payment of stamp and state duty on registration of title is also required. In addition to the registration application, the original purchase agreement and documents evidencing payment of state and stamp duties, other documents may have to be filed with the Land Book (e.g., written consent of the seller’s spouse approved by a notary). Registration of title generally takes ten days as of filing all the necessary documents with the Land Book.
All the information registered with the Land Book, including information on the legal status of the real estate and its encumbrances is binding on third parties and is publicly available (including via the electronic Land Book database) for a fee.
Acquisition of Real Estate
GeneralA building erected on land is considered to be a part of the land. However, as a result of land reform, situations occur where a land plot and a building situated on it are in different ownership.
Generally, transfer of title to a building or land separately from each other is not possible unless the land plot and the building are registered with the Land Book as separate property objects.
Change of OwnershipTransfer of title to real estate may be restricted by a number of factors, including restrictions on foreign ownership of land, rights of first refusal as well as encumbrances registered with the Land Book, e.g., mortgages and prohibition notes. Moreover, before the title can be transferred, any real estate tax debt with regard to a particular real property needs to be paid, as well as real estate tax for the current year.
Form of AgreementsWritten form is required for transactions with real estate, as well as registration with the Land Book. Notarisation of the purchase agreement is not compulsory, while notarisation is required for registration applications to the Land Book.
Language RequirementsThere is no specific requirement to use only the official state language (Latvian) in agreements on real estate. Parties to the agreement may choose the language of the agreement themselves. However, if the original language or the prevailing language of the agreement is not Latvian, a translation of the agreement approved by a notary and an original counterpart of the agreement must be filed with the Land Book for registration of the transaction. Registration applications to the Land Book are always drafted by a notary in Latvian and if necessary orally translated by the notary or another person to the person signing the application.
Due DiligenceBefore carrying out any real estate transaction, it is advisable to research the legal status of the real estate, e.g., information on the title holder, encumbrances, lease agreements, pollution and permitted use as set by the local authority. The results of research may be useful for settling the final purchase price that better reflects its value and for more accurate assessment of potential expenses that the buyer is likely to incur on acquisition.
Right of First RefusalBefore title to real estate may be transferred, all persons with a right of first refusal to purchase the particular real estate must be offered an opportunity to exercise their right. Only after all these persons have declined to exercise this right in writing or the term for using these rights has expired may the purchase agreement and the buyer’s title be registered with the Land Book.
Certain entities’ rights of first refusal are established by law. However, these rights may also be agreed on by the parties to the
25Real Estate Market Overview | 2014 | Latvia | SORAINEN
particular transaction. A local authority has right of first refusal in respect of acquisition of real estate (land and buildings) located in its territory if the real estate is necessary for performance by the local authority of its statutory functions, e.g., operation of schools, kindergartens, certain types of social housing.
The state has a right of first refusal upon sale of cultural monuments of state importance, land plots in protection zones as well as in ports and special economic zones.
Rights of first refusal also exist in favour of co-owners of real estate if any of them transfers their notional part of the real estate to a person who is not a co-owner of the real estate. Additionally, where land and buildings (except buildings which have been divided into apartment properties) constructed on it are in different ownership, the owner of each property has a right of first refusal over the other owner’s property if it is sold to a third party.
Rights of first refusal may generally be exercised within two months after the purchase agreement is delivered to persons with such rights. Depending on whether the real estate is or is not necessary for performance by the local authority of its statutory functions, the term for local government is 20 days or five days respectively.
Typical Purchase Price ArrangementsIn complex and long-term projects, part of the purchase price (up to 5 - 10 per cent) might be paid by the buyer to the seller as an advance payment on signing the purchase agreement. Normally, the parties agree to use an escrow account with a bank for payment of the remaining purchase price, in which event an escrow account agreement is signed by the seller, the buyer and the bank. From conclusion of the purchase agreement and until registration of the buyer’s title to the real estate none of the parties has access to the funds transferred to the escrow account. Generally, the parties agree on a list of documents that need to be submitted to the bank and/or actions that need to be performed by the seller as preconditions to the purchase price being transferred from the escrow account to the seller. A Land Book certificate evidencing the buyer’s title to the real estate is usually the main document in the list.
Restrictions
Restrictions on Acquisition of Real EstateCertain restrictions exist as to foreign ownership of land, while there are no such restrictions regarding ownership of buildings. However, since a building erected on land is generally considered to be a part of the land, in most cases ownership of buildings is subject to the same regulations (restrictions) as is the land. Few restrictions apply as to foreign ownership of land located in cities in Latvia, while the regulations are more stringent with regard to the ownership of land in rural areas.
Companies registered in Latvia or in another European Union (EU) Member State may acquire land in cities of Latvia, provided that:
> more than 50 per cent of the company’s share capital is owned by citizens of Latvia and/or citizens of another EU Member State, and/or Latvian state or local government; or
> more than 50 per cent of the company’s share capital is owned
by individuals and/or legal entities from countries with whom Latvia has concluded an agreement on mutual protection of investments (Latvia has signed such agreements with most EU countries, Canada and the USA); or
> the company is a publicly traded joint stock company on the Latvian stock exchange.
Other companies may request a permit from local government to acquire particular real estate, which may or may not be granted. However, these companies are not entitled to acquire land in certain specific areas, e.g., state border territories, special protection zones, agricultural and forest land pursuant to local territorial planning.
An additional requirement applicable to companies wishing to acquire land in rural areas is that companies registered in an EU Member State other than Latvia may not acquire agricultural or forest land. However, as of 1 May 2014 (expiry of the transitional period), companies registered in any EU Member State will be entitled to acquire land in the above mentioned areas on the same conditions as companies registered in Latvia.
At the moment the Latvian Government has been working on changes in the law restricting sales of agricultural land in order to provide better use of agricultural land and to develop agricultural production. The restrictions will decrease the amount of persons eligible to purchase agricultural land in Latvia. They will also make the process of buying agricultural land longer and more unpredictable. The draft law is still under discussion.
Merger (Concentration) Control Real estate transfer may be subject to prior approval by the Latvian Competition Authority (LCA) if it constitutes part of a company merger. The merger may take the form of either a share transfer or an asset transfer and must be notified for approval to the LCA if at least one of the following criteria is satisfied:
> aggregate turnover of the companies involved in the transaction exceeds approx. EUR 35.6 million for the financial year preceding the merger; or
> joint market share of the companies exceeds 40 per cent of the relevant market.
However, notification of a merger to the LCA is not necessary if there are only two parties (the seller and the buyer) to the transaction and the turnover of at least one of them does not exceed approx. EUR 2.13 million.
If real estate is being acquired or leased as part of a grocery chain or a retail company, additional considerations should be taken into account.
EncumbrancesReal estate might be encumbered with servitudes, rights of first refusal, lease rights registered with the Land Book, mortgages, protection zones and other encumbrances that should be taken into account when contemplating acquisition or lease of the real estate, in particular with respect to constructions on it.
Property ManagementMaintenance of both commercial and residential real estate is usually carried out by the owner or by an entity contracted by the owner.
26Real Estate Market Overview | 2014 | Latvia | SORAINEN
Lease Agreements
GeneralLatvian Civil Law lays down the general terms for lease agreements. In residential law, the Law on Residential Tenancy grants extra protection to tenants in comparison with general Civil Law regulation. The reason for this difference is that the tenant is considered to be the weaker party to a residential lease agreement.
In order for a commercial lease agreement concluded by the seller of real estate with a tenant to be binding on the buyer, it needs to be registered with the Land Book. Without registration, the buyer may terminate the lease agreement, in which case the seller must compensate the tenant for all losses caused to the tenant by early termination. Residential lease agreements, in turn, are binding on the buyer, irrespective of registration with the Land Book.
Duration and Expiry of Lease AgreementLease agreements may be concluded for a definite or indefinite term. General rules on termination of lease agreements are laid down by law, while additional rights of each party to unilaterally terminate the agreement may be specifically agreed on by the parties. However, the landlord’s rights to unilaterally terminate a residential lease agreement are limited to cases specifically provided for under the Law on Residential Tenancy.
Lease Payment and Accessory Expenses (Utilities)Pre-payment of lease payments (as a deposit or a guarantee) is usually required by the landlord. These deposits and guarantees as well as the payment procedure are not specifically regulated by law.
In addition to rent, accessory expenses are usually paid by the tenant. Accessory expenses include payments for maintenance of the real estate and utilities provided such as water, gas and electricity.
Distressed Assets PurchaseAcquisition of distressed real estate can be performed on the basis of a voluntary agreement between the parties, in a procedure for compulsory enforcement or during insolvency proceedings of the owner of the real estate. In any case acquisition of distressed real estate is more complex. Therefore a thorough due diligence should be performed. The risk of the seller becoming insolvent has to be taken into account when planning distressed purchases, since a transaction made on conditions detrimental to the seller may be revoked during subsequent insolvency proceedings. This risk is at its highest during the first six months prior to beginning of insolvency proceedings. Therefore making any purchase price pre-payments to a potentially insolvent seller is not advisable and the transaction should be concluded on market terms.
Compulsory enforcement procedure is carried out by bailiffs and is executed through auction under the procedure set by the Civil Procedure Law. Sale of real estate during insolvency proceedings is also usually performed by auction and is regulated by the Insolvency Law and Civil Procedure Law.
Ģirts Rūda Partner, Regional Head of the Real Estate & Construction TeamSORAINEN LatviaKr. Valdemāra Street 21, LV-1010 RigaPhone + 371 67 365 [email protected]
27Real Estate Market Overview | 2014 | Latvia | SORAINEN
Tax* SummarySpecial NotesLatvia offers a beneficial holding companies tax regime. This provides tax exemption for capital gains on sale of shares (also in real estate companies) and dividend income.
Rental Income > 15 per cent (equal to CIT) applies to taxable income based on annual financial profit or loss adjusted for taxation purposes.
> Individuals earning rental income pay 24 per cent PIT on the profit (individuals with no or immaterial expenses can pay 10 per cent on the gross rental income).
Thin Capitalisation > Two tests are applied:
(i) the first is based on a 4:1 debt-to-equity calculation;
(ii) the second compares the interest rate paid with a rate of 1.57 times the statistical weighted average annual interest for loans issued by non-credit institutions.
> Any excess interest calculated under either method is not deductible, and if both methods result in non-deductible interest, the higher amount is non- deductible.
> Non-deductible interest cannot be carried forward and is lost as a deduction.
> Financial and insurance institutions are not subject to thin capitalisation rules.
Depreciation and Losses
Depreciation > Buildings and constructions are depreciated at a specified tax rate of 10 per cent using the reducing balance method.
> Land is not depreciable.
Losses > Losses arising before and including the 2007 tax year can be used for the following 8 years. Losses arising in 2008 and later tax years may be carried forward indefinitely.
> Taxpayers registered in SEZ or Free Ports with losses arising before 2005 may carry them forward for up to 10 years, and losses arising after 2005 may be carried forward indefinitely.
> Intra-group transfer of losses is not allowed as of the 2014 financial year.
* Abbreviations used: CIT - corporate income taxDTT - double taxation treaty EC - European CommissionEEA - European Economic AreaEU - European UnionFEZ - free economic zonePIT - personal income taxSEZ - special economic zoneVAT - value added tax
Withholding Tax > Dividends are tax exempt unless payments are made to “blacklisted” jurisdictions.
> Interest: outgoing interest payments are tax exempt unless paid to “blacklisted” jurisdictions.
> Management and consulting fees: 10 per cent, can be reduced to 0 per cent under a tax treaty.
> Royalties: outgoing royalty payments tax exempt unless paid to “blacklisted” jurisdictions.
> Rental fees on property located in Latvia - 5 per cent.
> Sale price of real estate located in Latvia or shares in “real estate companies”: 2 per cent (“real estate company” is a company more than 50 per cent of whose assets comprise real estate directly or indirectly owned within Latvia). Certain Latvian DTTs can reduce or eliminate payment of withholding taxes.
> Alternatively, companies established in EU or DTT countries are allowed to pay 15 per cent CIT from the profit made as a result of real estate sale - the supporting documents for expenses related to real estate should be presented to the Latvian tax authorities.
> Payments to “blacklisted” jurisdictions - 15 per cent except for supplies of goods. Use of market prices should be proven (Transfer pricing documentation).
> 0 per cent for all payments to Lithuania.
Capital GainsPIT and CIT on capital gains applies to individual taxpayers and corporate taxpayers, both being subject to a 15 per cent rate. However, capital gains from sale of shares held by a Latvian company are tax exempt, unless shares are held in a “blacklisted” jurisdiction.
Real Estate Taxes > Payable by corporate owners or entities having legal ownership or control over use of Latvian real estate. Individuals are liable to tax on their residential homes and apartments.
> Tax applies at a rate of 1.5 per cent of the real estate’s cadastral value and is levied annually. If a company owns or legally possesses a residential property, it is subject to the 1.5 per cent rate. Lower rates apply if residential property is rented out and the rent agreement is registered with the Land Book,
> A rate of 1.5 per cent applies to engineering structures and a 3 per cent rate applies to uncultivated agricultural land. Subject to municipal regulations, derelict or unsafe buildings may be subject to a 3 per cent tax.
> Local municipalities can set the tax rate ranging from 0.2 per cent to 3 per cent in regulations to be issued no later than 1 October of the preceding tax year. If this is not done, the default tax rates apply.
28Real Estate Market Overview | 2014 | Latvia | SORAINEN
> Individual property owners pay the following progressive rates on their residential buildings and apartments:
(i) 0.2 per cent - for cadastral value not exceeding EUR 56,915;
(ii) 0.4 per cent - for cadastral value from EUR 56,915 to EUR 106,715;
(iii) 0.6 per cent - for cadastral value exceeding EUR 106,715.
These rates also apply if a company owns a residential property and registers rent agreements with the Land Book.
> A EUR 7 minimum is payable for each registered item of real estate.
> Unfinished real estate not put into use is subject to 3 per cent RET if the construction permit is not active for 12 months. The same applies for exceeding the total allowed duration of construction works. The taxable base is the higher of either the cadastral value of the land or the cadastral value of the unfinished building.
> Local municipalities have power to grant taxation reductions to specific categories of individuals.
Value Added Tax
Sale of Real Estate > Sale of land and used buildings is VAT-exempt. Taxpayers may opt to tax such property if the buyer is a VAT taxable person.
> Sale of unused real estate (buildings, constructions) and building land (land granted a building permit) is subject to 21 per cent VAT.
> In sale transactions, the value of land and unused buildings cannot be separated for VAT calculation purposes, so that unused buildings and the land on which they stand are taxable.
> The taxable value for the sale of reconstructed or renovated property is the difference between its sale price and the value of the property before reconstruction or renovation.
> Real estate should be registered with the taxation authorities. Deducted input VAT should be adjusted during the next 10 years according to the use of the real estate for VAT taxable and exempt transactions. Rent of residential premises to individuals is VAT-exempt, whereas lease payments for commercial property are subject to 21 per cent VAT.
Real Estate Transaction Related Costs
Costs IncurredTypically these include: brokerage fees, bank fees, fees for legal due diligence and reviewing sale and security agreements, notary fees and state duty.
Sharing CostsSharing transaction costs is a matter for agreement between the parties. Usually, the buyer pays state and stamp duties, whilst notary fees are shared equally between the parties.
State and Transfer Stamp Duties
State Duty > For registration of title to land, dwelling houses - 2 per cent of the purchase price or cadastral value, whichever is higher. No cap applies.
> For commercial properties - 2 per cent of either the real estate purchase price or the cadastral value of the real estate, whichever is higher. A cap of EUR 42,686.15 applies.
> Sale of an apartment to a legal person - 6 per cent of the purchase price or cadastral value of the apartment, whichever is higher.
> Duty does not apply to mergers and other restructurings.
> 1 per cent duty applies to investments in kind of real estate in the share capital of a company.
Stamp DutyEUR 21 for registration of title and issue of a Land Book certificate.
Notary FeesFees for drafting the Land Book registration application and approving the parties’ signatures generally amount to EUR 92.
Mortgage > When the purchase of real estate is financed by a loan that requires a mortgage over real estate the mortgage agreement must be registered with the Land Book. State duty for registration amounts to 0.1 per cent of the loan amount.
> Stamp duty and notary fees are the same as for title registration.
Jānis Taukačs Partner, Regional Head of the Tax & Customs TeamSORAINEN LatviaKr. Valdemāra Street 21, LV-1010 RigaPhone + 371 67 365 [email protected]
29Real Estate Market Overview | 2014 | Lithuania | Colliers International
Market Activity Breaks the Existing Status QuoIn 2013 the Lithuanian RE market finally demonstrated real activity. The amount of transactions reached pre-crisis levels with a few large deals ahead. As demand for commercial RE continued to rise the situation in the RE market was positive with high expectations for the future. Increased construction activity in commercial RE was encouraged by growing internal demand and increases in company turnover. High demand for prime office space stimulated construction of class A office buildings. Besides, overall retail growth of 4.5 per cent for two years in a row led to resumed construction of retail properties postponed due to the crisis. The industrial segment also showed some activity influenced by expansion of industrial companies and construction of built-to-suit warehouses. The perspective for 2014 is optimistic as the expectation is to record a series of new transactions and continuing construction activity. With the prospect of Euro integration in 2015 the government will take all measures to fulfil Euro convergence criteria, so that economic stability is expected to create a favourable environment for further growth of the RE market.
Sincerely,
Ramune Askiniene
Ramune askinienePartner | Managing [email protected]
Lithuania Market Overview
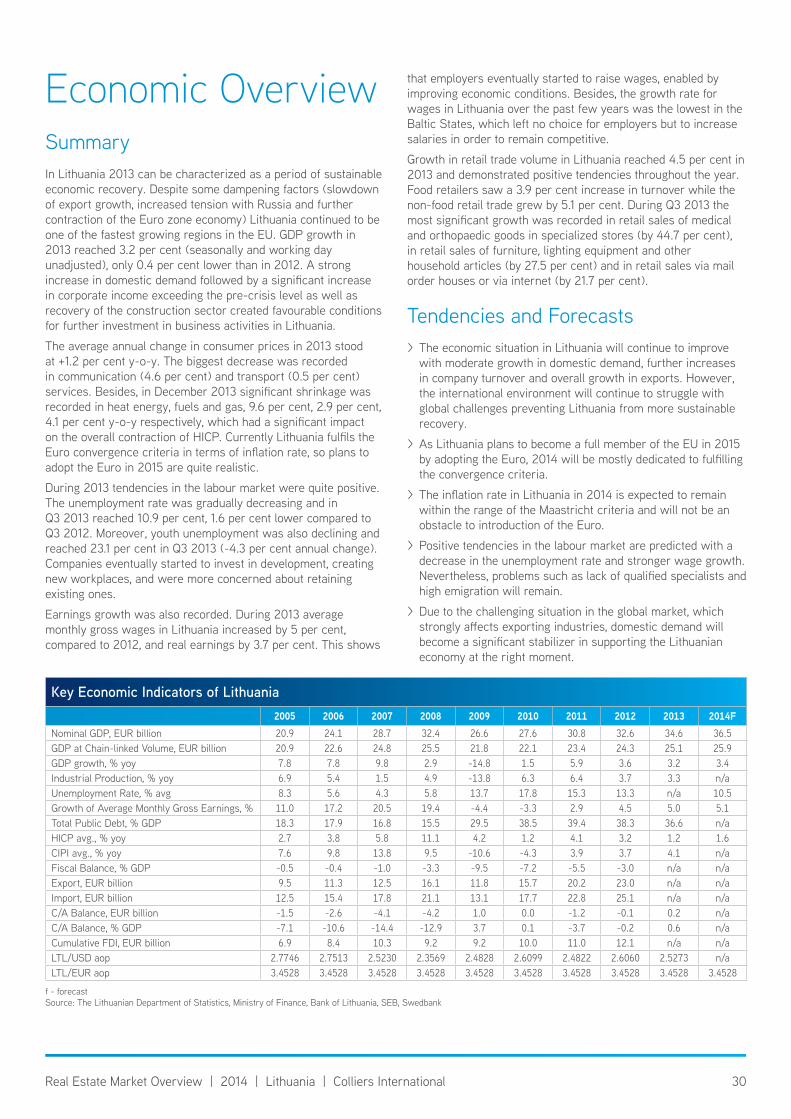
30Real Estate Market Overview | 2014 | Lithuania | Colliers International
Economic OverviewSummaryIn Lithuania 2013 can be characterized as a period of sustainable economic recovery. Despite some dampening factors (slowdown of export growth, increased tension with Russia and further contraction of the Euro zone economy) Lithuania continued to be one of the fastest growing regions in the EU. GDP growth in 2013 reached 3.2 per cent (seasonally and working day unadjusted), only 0.4 per cent lower than in 2012. A strong increase in domestic demand followed by a significant increase in corporate income exceeding the pre-crisis level as well as recovery of the construction sector created favourable conditions for further investment in business activities in Lithuania.
The average annual change in consumer prices in 2013 stood at +1.2 per cent y-o-y. The biggest decrease was recorded in communication (4.6 per cent) and transport (0.5 per cent) services. Besides, in December 2013 significant shrinkage was recorded in heat energy, fuels and gas, 9.6 per cent, 2.9 per cent, 4.1 per cent y-o-y respectively, which had a significant impact on the overall contraction of HICP. Currently Lithuania fulfils the Euro convergence criteria in terms of inflation rate, so plans to adopt the Euro in 2015 are quite realistic.
During 2013 tendencies in the labour market were quite positive. The unemployment rate was gradually decreasing and in Q3 2013 reached 10.9 per cent, 1.6 per cent lower compared to Q3 2012. Moreover, youth unemployment was also declining and reached 23.1 per cent in Q3 2013 (-4.3 per cent annual change). Companies eventually started to invest in development, creating new workplaces, and were more concerned about retaining existing ones.
Earnings growth was also recorded. During 2013 average monthly gross wages in Lithuania increased by 5 per cent, compared to 2012, and real earnings by 3.7 per cent. This shows
that employers eventually started to raise wages, enabled by improving economic conditions. Besides, the growth rate for wages in Lithuania over the past few years was the lowest in the Baltic States, which left no choice for employers but to increase salaries in order to remain competitive.
Growth in retail trade volume in Lithuania reached 4.5 per cent in 2013 and demonstrated positive tendencies throughout the year. Food retailers saw a 3.9 per cent increase in turnover while the non-food retail trade grew by 5.1 per cent. During Q3 2013 the most significant growth was recorded in retail sales of medical and orthopaedic goods in specialized stores (by 44.7 per cent), in retail sales of furniture, lighting equipment and other household articles (by 27.5 per cent) and in retail sales via mail order houses or via internet (by 21.7 per cent).
Tendencies and Forecasts > The economic situation in Lithuania will continue to improve with moderate growth in domestic demand, further increases in company turnover and overall growth in exports. However, the international environment will continue to struggle with global challenges preventing Lithuania from more sustainable recovery.
> As Lithuania plans to become a full member of the EU in 2015 by adopting the Euro, 2014 will be mostly dedicated to fulfilling the convergence criteria.
> The inflation rate in Lithuania in 2014 is expected to remain within the range of the Maastricht criteria and will not be an obstacle to introduction of the Euro.
> Positive tendencies in the labour market are predicted with a decrease in the unemployment rate and stronger wage growth. Nevertheless, problems such as lack of qualified specialists and high emigration will remain.
> Due to the challenging situation in the global market, which strongly affects exporting industries, domestic demand will become a significant stabilizer in supporting the Lithuanian economy at the right moment.
key economic indicators of Lithuania2005 2006 2007 2008 2009 2010 2011 2012 2013 2014F
Nominal GDP, EUR billion 20.9 24.1 28.7 32.4 26.6 27.6 30.8 32.6 34.6 36.5GDP at Chain-linked Volume, EUR billion 20.9 22.6 24.8 25.5 21.8 22.1 23.4 24.3 25.1 25.9GDP growth, % yoy 7.8 7.8 9.8 2.9 -14.8 1.5 5.9 3.6 3.2 3.4Industrial Production, % yoy 6.9 5.4 1.5 4.9 -13.8 6.3 6.4 3.7 3.3 n/aUnemployment Rate, % avg 8.3 5.6 4.3 5.8 13.7 17.8 15.3 13.3 n/a 10.5Growth of Average Monthly Gross Earnings, % 11.0 17.2 20.5 19.4 -4.4 -3.3 2.9 4.5 5.0 5.1Total Public Debt, % GDP 18.3 17.9 16.8 15.5 29.5 38.5 39.4 38.3 36.6 n/aHICP avg., % yoy 2.7 3.8 5.8 11.1 4.2 1.2 4.1 3.2 1.2 1.6CIPI avg., % yoy 7.6 9.8 13.8 9.5 -10.6 -4.3 3.9 3.7 4.1 n/aFiscal Balance, % GDP -0.5 -0.4 -1.0 -3.3 -9.5 -7.2 -5.5 -3.0 n/a n/aExport, EUR billion 9.5 11.3 12.5 16.1 11.8 15.7 20.2 23.0 n/a n/aImport, EUR billion 12.5 15.4 17.8 21.1 13.1 17.7 22.8 25.1 n/a n/aC/A Balance, EUR billion -1.5 -2.6 -4.1 -4.2 1.0 0.0 -1.2 -0.1 0.2 n/aC/A Balance, % GDP -7.1 -10.6 -14.4 -12.9 3.7 0.1 -3.7 -0.2 0.6 n/aCumulative FDI, EUR billion 6.9 8.4 10.3 9.2 9.2 10.0 11.0 12.1 n/a n/aLTL/USD aop 2.7746 2.7513 2.5230 2.3569 2.4828 2.6099 2.4822 2.6060 2.5273 n/aLTL/EUR aop 3.4528 3.4528 3.4528 3.4528 3.4528 3.4528 3.4528 3.4528 3.4528 3.4528
f - forecastSource: The Lithuanian Department of Statistics, Ministry of Finance, Bank of Lithuania, SEB, Swedbank
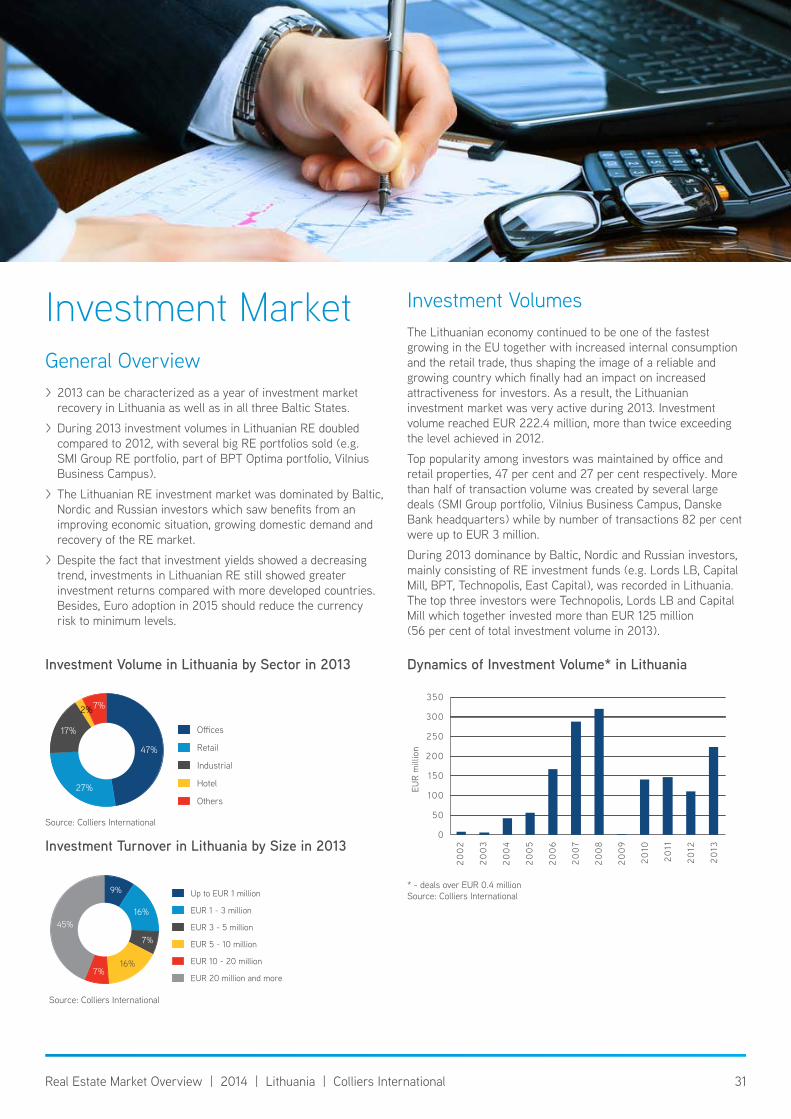
31Real Estate Market Overview | 2014 | Lithuania | Colliers International
Investment MarketGeneral Overview > 2013 can be characterized as a year of investment market recovery in Lithuania as well as in all three Baltic States.
> During 2013 investment volumes in Lithuanian RE doubled compared to 2012, with several big RE portfolios sold (e.g. SMI Group RE portfolio, part of BPT Optima portfolio, Vilnius Business Campus).
> The Lithuanian RE investment market was dominated by Baltic, Nordic and Russian investors which saw benefits from an improving economic situation, growing domestic demand and recovery of the RE market.
> Despite the fact that investment yields showed a decreasing trend, investments in Lithuanian RE still showed greater investment returns compared with more developed countries. Besides, Euro adoption in 2015 should reduce the currency risk to minimum levels.
Investment VolumesThe Lithuanian economy continued to be one of the fastest growing in the EU together with increased internal consumption and the retail trade, thus shaping the image of a reliable and growing country which finally had an impact on increased attractiveness for investors. As a result, the Lithuanian investment market was very active during 2013. Investment volume reached EUR 222.4 million, more than twice exceeding the level achieved in 2012.
Top popularity among investors was maintained by office and retail properties, 47 per cent and 27 per cent respectively. More than half of transaction volume was created by several large deals (SMI Group portfolio, Vilnius Business Campus, Danske Bank headquarters) while by number of transactions 82 per cent were up to EUR 3 million.
During 2013 dominance by Baltic, Nordic and Russian investors, mainly consisting of RE investment funds (e.g. Lords LB, Capital Mill, BPT, Technopolis, East Capital), was recorded in Lithuania. The top three investors were Technopolis, Lords LB and Capital Mill which together invested more than EUR 125 million (56 per cent of total investment volume in 2013).
* - deals over EUR 0.4 millionSource: Colliers International
Dynamics of investment volume* in Lithuania
EUR
mill
ion
20
02
20
03
20
04
20
05
20
06
20
07
20
08
20
09
20
10
20
11
20
12
20
13
350
300
250
200
150
100
50
0investment turnover in Lithuania by size in 2013
45%
7%16%
7%
16%
9% Up to EUR 1 million
EUR 1 - 3 million
EUR 3 - 5 million
EUR 5 - 10 million
EUR 10 - 20 million
EUR 20 million and more
Source: Colliers International
investment volume in Lithuania by sector in 2013
47%
27%
17%
2%7%
Offices
Retail
Industrial
Hotel
Others
Source: Colliers International
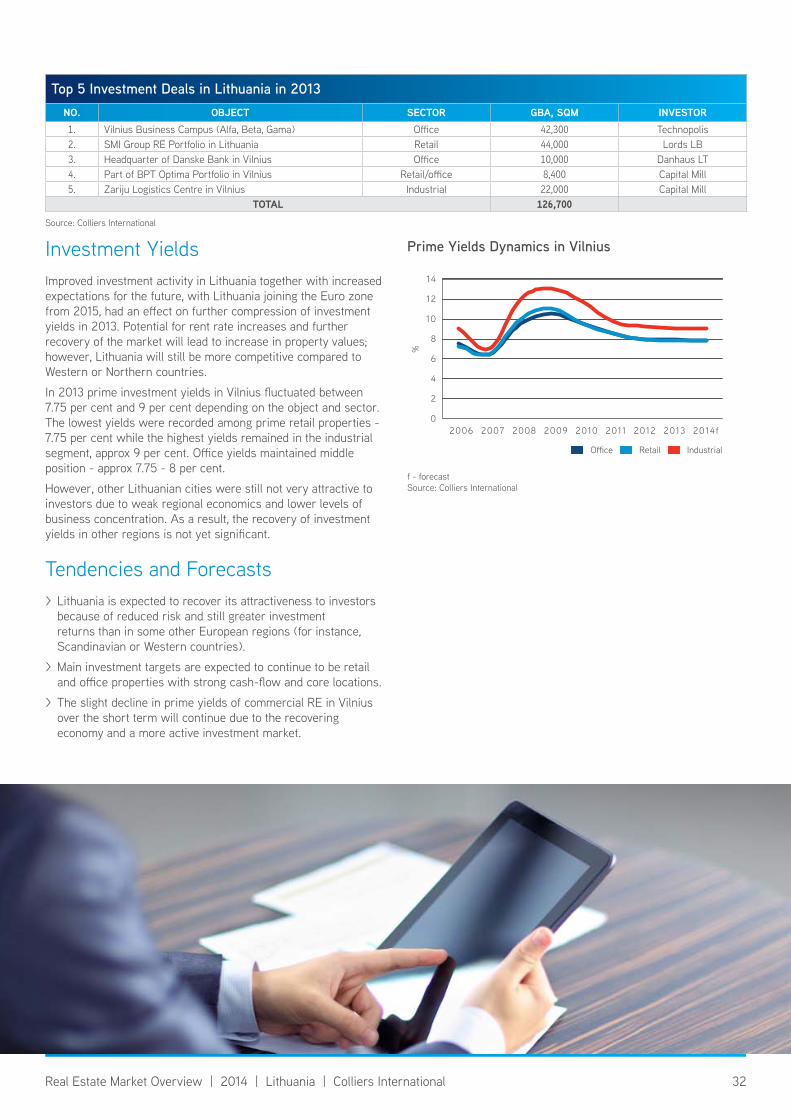
32Real Estate Market Overview | 2014 | Lithuania | Colliers International
Investment YieldsImproved investment activity in Lithuania together with increased expectations for the future, with Lithuania joining the Euro zone from 2015, had an effect on further compression of investment yields in 2013. Potential for rent rate increases and further recovery of the market will lead to increase in property values; however, Lithuania will still be more competitive compared to Western or Northern countries.
In 2013 prime investment yields in Vilnius fluctuated between 7.75 per cent and 9 per cent depending on the object and sector. The lowest yields were recorded among prime retail properties - 7.75 per cent while the highest yields remained in the industrial segment, approx 9 per cent. Office yields maintained middle position - approx 7.75 - 8 per cent.
However, other Lithuanian cities were still not very attractive to investors due to weak regional economics and lower levels of business concentration. As a result, the recovery of investment yields in other regions is not yet significant.
Tendencies and Forecasts > Lithuania is expected to recover its attractiveness to investors because of reduced risk and still greater investment returns than in some other European regions (for instance, Scandinavian or Western countries).
> Main investment targets are expected to continue to be retail and office properties with strong cash-flow and core locations.
> The slight decline in prime yields of commercial RE in Vilnius over the short term will continue due to the recovering economy and a more active investment market.
f - forecastSource: Colliers International
Prime Yields Dynamics in vilnius
%
14
12
10
8
6
4
2
02006 2007 2008 2009 2010 2011 2012 2013 2014f
Office Retail Industrial
top 5 investment Deals in Lithuania in 2013no. oBJect sectoR GBa, sQm InVestoR1. Vilnius Business Campus (Alfa, Beta, Gama) Office 42,300 Technopolis2. SMI Group RE Portfolio in Lithuania Retail 44,000 Lords LB3. Headquarter of Danske Bank in Vilnius Office 10,000 Danhaus LT4. Part of BPT Optima Portfolio in Vilnius Retail/office 8,400 Capital Mill5. Zariju Logistics Centre in Vilnius Industrial 22,000 Capital Mill
total 126,700Source: Colliers International

33Real Estate Market Overview | 2014 | Lithuania | Colliers International
Office MarketGeneral Overview > The Vilnius office market continued to show good results during 2013 and remained in a leader position in terms of supply of new office space in Lithuania. Kaunas and Klaipeda remained inactive, with minor exceptions.
> The biggest growth in demand for office space was observed in Vilnius due to active expansion of Shared Service Centres (SSCs) and relocation of public institutions from built-to-suit premises to modern business centres.
> During 2013 the rent rates for office space in Lithuania remained quite stable. Only Vilnius achieved consistent growth of rent rates (2 - 3 per cent) confirming healthy market growth.
> In 2013 the vacancy level of office space in Lithuania showed a decreasing trend. The average vacancy rate in Vilnius stood at 9.3 per cent, the lowest since 2009.
> As expectations for the future are improving, the pipeline of new office space development in Vilnius is over 100,000 sqm for the next few years.
SupplyDuring 2013 Vilnius office space supply grew by 4.5 per cent y-o-y and reached 404,070 sqm as three new modern business centres with total GLA of 17,345 sqm were introduced to the market. Class A office premises accounted for approx 31 per cent of the total office market and class B approx 69 per cent.
In 2013 the Kaunas office market also saw some activity as the new “Senukai” administrative building (GLA 16,700 sqm) was finished. This is now the biggest modern business centre in Kaunas. However, modern office space supply remained limited there, as the vacancy level was the lowest in the country.
The Klaipeda office market was still unable to attract new investments in the office segment as existing supply strongly exceeded demand. As a result, no new projects were offered to the Klaipeda market, leaving supply at 69,100 sqm.
As expectations for the future improve, currently more than 100,000 sqm of office space is in the pipeline, of which five business centres with total GLA of 70,000 sqm are already under construction in Vilnius. The biggest growth in supply is expected for 2015 in the central part of the city.
Some slight growth of the Kaunas office market is also planned. As “Senukai” relocated to a newly constructed business centre, the former administrative building will be renovated and office space of 3,000 sqm will be offered to the market by the end of 2014.
In Klaipeda developers are quite cautious about the future, so development of new projects is limited. Nevertheless, one office project is in the pipeline as “Realinija” has plans to renovate an old administrative building in Minijos St. by offering a small class B office building with total area of 2,000 sqm in 2015.
f - forecastSource: Colliers International
Dynamics of Speculative Office Space
20
00
20
01
20
02
20
03
20
04
20
05
20
06
20
07
20
08
20
09
20
10
20
11
20
12
20
13
20
14f
400
350
300
250
200
150
100
50
0
Vilnius Kaunas Klaipeda
Thou
sand
s, s
qm
Distribution of Speculative Office Space in Vilnius by Class
31% 49% 20%
32% 49% 19%
32% 50% 18%
33% 52% 15%
36% 49% 16%
41% 39% 20%
39% 35% 27%2007
2008
2009
2010
2011
2012
2013
0% 20% 40% 60% 80% 100%
Calss A Class B1 Cass B2
f - forecastSource: Colliers International
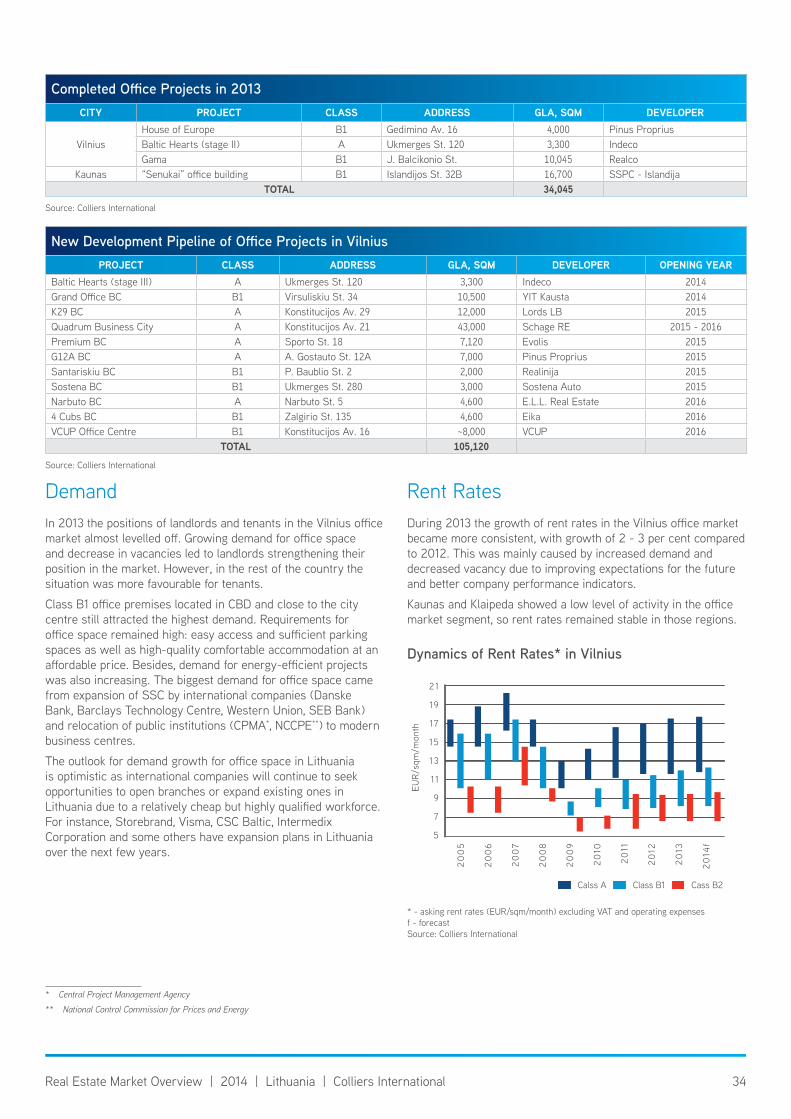
34Real Estate Market Overview | 2014 | Lithuania | Colliers International
DemandIn 2013 the positions of landlords and tenants in the Vilnius office market almost levelled off. Growing demand for office space and decrease in vacancies led to landlords strengthening their position in the market. However, in the rest of the country the situation was more favourable for tenants.
Class B1 office premises located in CBD and close to the city centre still attracted the highest demand. Requirements for office space remained high: easy access and sufficient parking spaces as well as high-quality comfortable accommodation at an affordable price. Besides, demand for energy-efficient projects was also increasing. The biggest demand for office space came from expansion of SSC by international companies (Danske Bank, Barclays Technology Centre, Western Union, SEB Bank) and relocation of public institutions (CPMA*, NCCPE**) to modern business centres.
The outlook for demand growth for office space in Lithuania is optimistic as international companies will continue to seek opportunities to open branches or expand existing ones in Lithuania due to a relatively cheap but highly qualified workforce. For instance, Storebrand, Visma, CSC Baltic, Intermedix Corporation and some others have expansion plans in Lithuania over the next few years.
* Central Project Management Agency
** National Control Commission for Prices and Energy
Rent RatesDuring 2013 the growth of rent rates in the Vilnius office market became more consistent, with growth of 2 - 3 per cent compared to 2012. This was mainly caused by increased demand and decreased vacancy due to improving expectations for the future and better company performance indicators.
Kaunas and Klaipeda showed a low level of activity in the office market segment, so rent rates remained stable in those regions.
* - asking rent rates (EUR/sqm/month) excluding VAT and operating expensesf - forecastSource: Colliers International
Dynamics of Rent Rates* in vilnius
Calss A Class B1 Cass B2
EUR/
sqm
/mon
th
20
05
20
06
20
07
20
08
20
09
20
10
20
11
20
12
20
13
20
14f
2 1
19
17
15
13
11
9
7
5
Completed Office Projects in 2013cIty PRoJect class aDDRess Gla, sQm DeVeloPeR
VilniusHouse of Europe B1 Gedimino Av. 16 4,000 Pinus PropriusBaltic Hearts (stage II) A Ukmerges St. 120 3,300 IndecoGama B1 J. Balcikonio St. 10,045 Realco
Kaunas “Senukai” office building B1 Islandijos St. 32B 16,700 SSPC - Islandijatotal 34,045
Source: Colliers International
New Development Pipeline of Office Projects in VilniusPRoJect class aDDRess Gla, sQm DeVeloPeR oPenInG yeaR
Baltic Hearts (stage III) A Ukmerges St. 120 3,300 Indeco 2014Grand Office BC B1 Virsuliskiu St. 34 10,500 YIT Kausta 2014K29 BC A Konstitucijos Av. 29 12,000 Lords LB 2015Quadrum Business City A Konstitucijos Av. 21 43,000 Schage RE 2015 - 2016Premium BC A Sporto St. 18 7,120 Evolis 2015G12A BC A A. Gostauto St. 12A 7,000 Pinus Proprius 2015Santariskiu BC B1 P. Baublio St. 2 2,000 Realinija 2015Sostena BC B1 Ukmerges St. 280 3,000 Sostena Auto 2015Narbuto BC A Narbuto St. 5 4,600 E.L.L. Real Estate 20164 Cubs BC B1 Zalgirio St. 135 4,600 Eika 2016VCUP Office Centre B1 Konstitucijos Av. 16 ~8,000 VCUP 2016
total 105,120Source: Colliers International
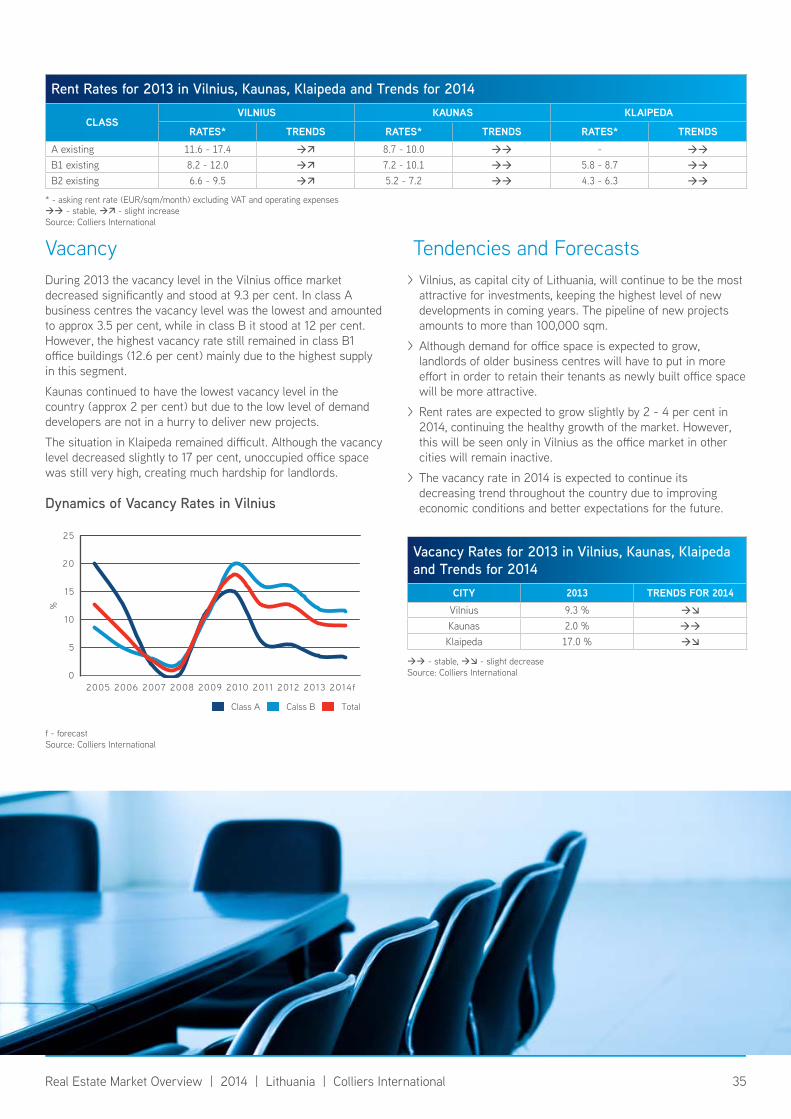
35Real Estate Market Overview | 2014 | Lithuania | Colliers International
VacancyDuring 2013 the vacancy level in the Vilnius office market decreased significantly and stood at 9.3 per cent. In class A business centres the vacancy level was the lowest and amounted to approx 3.5 per cent, while in class B it stood at 12 per cent. However, the highest vacancy rate still remained in class B1 office buildings (12.6 per cent) mainly due to the highest supply in this segment.
Kaunas continued to have the lowest vacancy level in the country (approx 2 per cent) but due to the low level of demand developers are not in a hurry to deliver new projects.
The situation in Klaipeda remained difficult. Although the vacancy level decreased slightly to 17 per cent, unoccupied office space was still very high, creating much hardship for landlords.
Tendencies and Forecasts > Vilnius, as capital city of Lithuania, will continue to be the most attractive for investments, keeping the highest level of new developments in coming years. The pipeline of new projects amounts to more than 100,000 sqm.
> Although demand for office space is expected to grow, landlords of older business centres will have to put in more effort in order to retain their tenants as newly built office space will be more attractive.
> Rent rates are expected to grow slightly by 2 - 4 per cent in 2014, continuing the healthy growth of the market. However, this will be seen only in Vilnius as the office market in other cities will remain inactive.
> The vacancy rate in 2014 is expected to continue its decreasing trend throughout the country due to improving economic conditions and better expectations for the future.
f - forecastSource: Colliers International
Dynamics of vacancy Rates in vilnius
%
25
20
15
10
5
02005 2006 2007 2008 2009 2010 2011 2012 2013 2014f
Class A Calss B Total
Rent Rates for 2013 in vilnius, kaunas, klaipeda and trends for 2014
classVIlnIus Kaunas KlaIPeDa
Rates* tRenDs Rates* tRenDs Rates* tRenDsA existing 11.6 - 17.4 8.7 - 10.0 -
B1 existing 8.2 - 12.0 7.2 - 10.1 5.8 - 8.7
B2 existing 6.6 - 9.5 5.2 - 7.2 4.3 - 6.3
* - asking rent rate (EUR/sqm/month) excluding VAT and operating expenses - stable, - slight increaseSource: Colliers International
vacancy Rates for 2013 in vilnius, kaunas, klaipeda and trends for 2014
cIty 2013 Trends For 2014Vilnius 9.3 %
Kaunas 2.0 %
Klaipeda 17.0 %
- stable, - slight decreaseSource: Colliers International
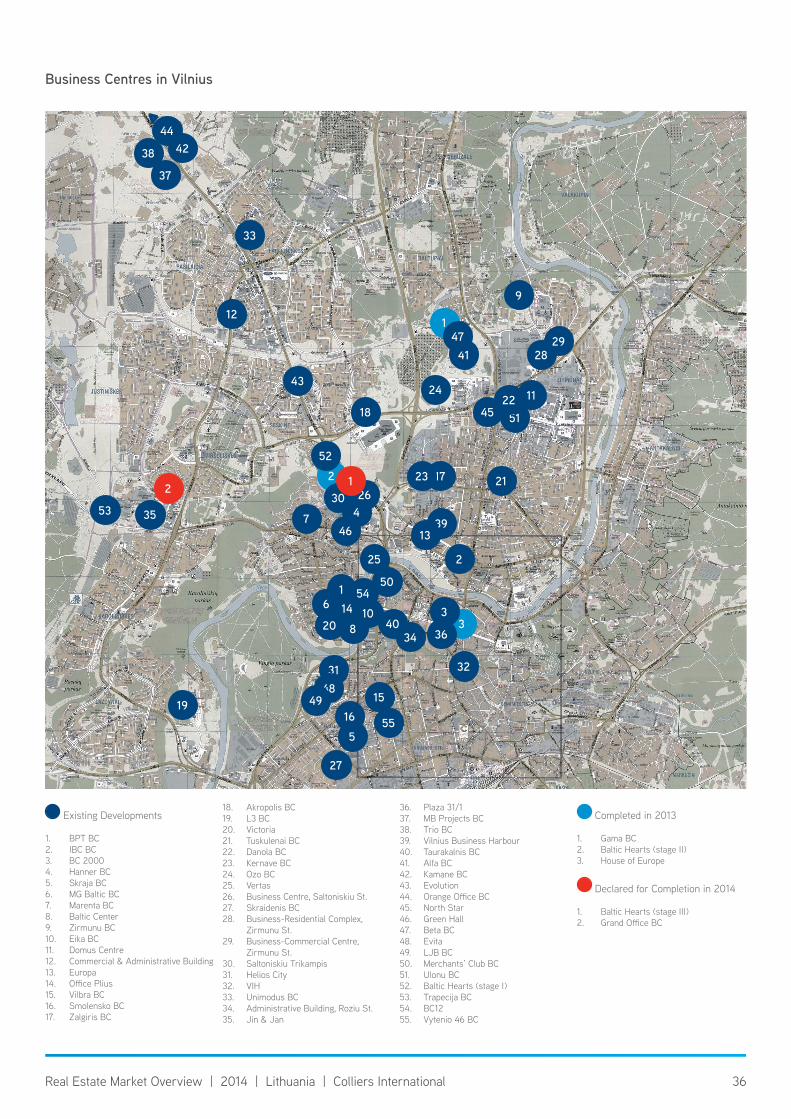
36Real Estate Market Overview | 2014 | Lithuania | Colliers International
Business Centres in vilnius
42
1
2
50
52
51
53
54
55
2829
21
25
3047
26
3
1723
3913
32
9
1822 11
2
24
12
33
38
37
35
19
31
27
1615
36
3
3440
41
45
46
43
16
1014
820
5
44
47
4849
▷
12
Existing Developments
1. BPT BC2. IBC BC3. BC 20004. Hanner BC5. Skraja BC6. MG Baltic BC7. Marenta BC8. Baltic Center9. Zirmunu BC10. Eika BC11. Domus Centre12. Commercial & Administrative Building13. Europa14. Office Plius15. Vilbra BC 16. Smolensko BC17. Zalgiris BC
18. Akropolis BC19. L3 BC20. Victoria21. Tuskulenai BC22. Danola BC23. Kernave BC24. Ozo BC25. Vertas26. Business Centre, Saltoniskiu St.27. Skraidenis BC28. Business-Residential Complex,
Zirmunu St.29. Business-Commercial Centre,
Zirmunu St.30. Saltoniskiu Trikampis31. Helios City32. VIH33. Unimodus BC34. Administrative Building, Roziu St.35. Jin & Jan
36. Plaza 31/137. MB Projects BC38. Trio BC39. Vilnius Business Harbour40. Taurakalnis BC41. Alfa BC42. Kamane BC43. Evolution44. Orange Office BC45. North Star46. Green Hall47. Beta BC48. Evita 49. LJB BC50. Merchants’ Club BC51. Ulonu BC52. Baltic Hearts (stage I)53. Trapecija BC54. BC1255. Vytenio 46 BC
Completed in 2013
1. Gama BC2. Baltic Hearts (stage II)3. House of Europe
Declared for Completion in 2014
1. Baltic Hearts (stage III)2. Grand Office BC
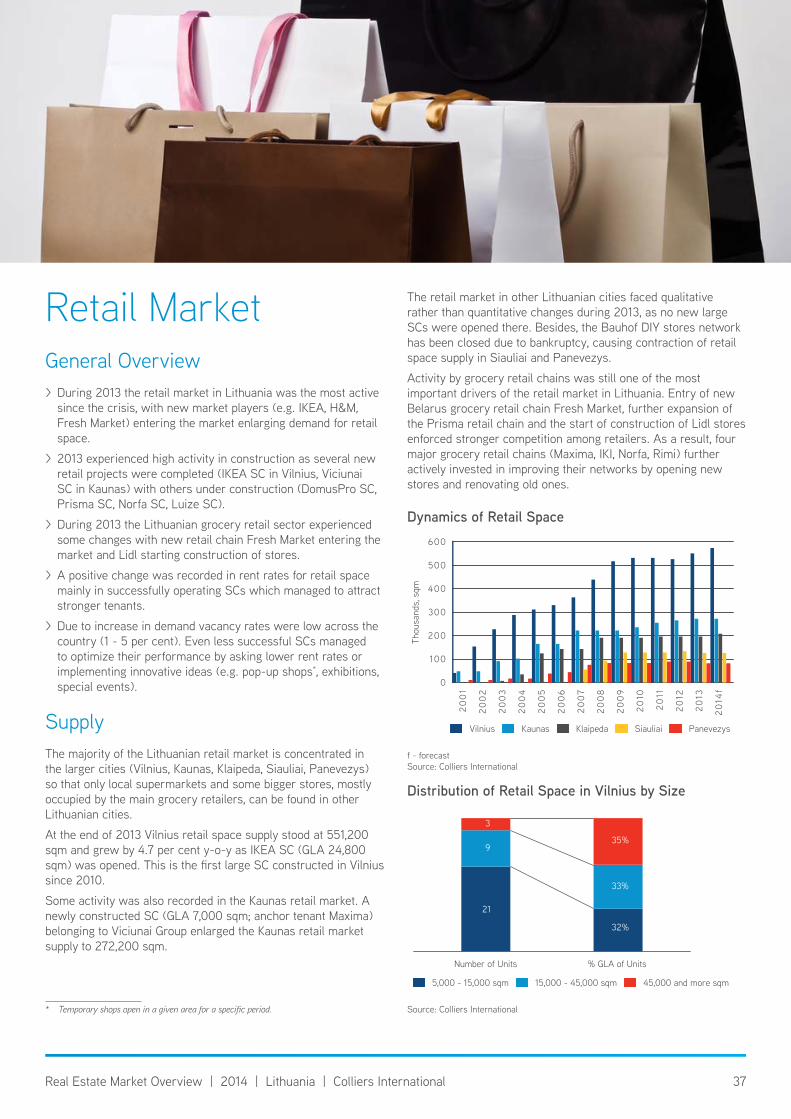
37Real Estate Market Overview | 2014 | Lithuania | Colliers International
Retail MarketGeneral Overview > During 2013 the retail market in Lithuania was the most active since the crisis, with new market players (e.g. IKEA, H&M, Fresh Market) entering the market enlarging demand for retail space.
> 2013 experienced high activity in construction as several new retail projects were completed (IKEA SC in Vilnius, Viciunai SC in Kaunas) with others under construction (DomusPro SC, Prisma SC, Norfa SC, Luize SC).
> During 2013 the Lithuanian grocery retail sector experienced some changes with new retail chain Fresh Market entering the market and Lidl starting construction of stores.
> A positive change was recorded in rent rates for retail space mainly in successfully operating SCs which managed to attract stronger tenants.
> Due to increase in demand vacancy rates were low across the country (1 - 5 per cent). Even less successful SCs managed to optimize their performance by asking lower rent rates or implementing innovative ideas (e.g. pop-up shops*, exhibitions, special events).
SupplyThe majority of the Lithuanian retail market is concentrated in the larger cities (Vilnius, Kaunas, Klaipeda, Siauliai, Panevezys) so that only local supermarkets and some bigger stores, mostly occupied by the main grocery retailers, can be found in other Lithuanian cities.
At the end of 2013 Vilnius retail space supply stood at 551,200 sqm and grew by 4.7 per cent y-o-y as IKEA SC (GLA 24,800 sqm) was opened. This is the first large SC constructed in Vilnius since 2010.
Some activity was also recorded in the Kaunas retail market. A newly constructed SC (GLA 7,000 sqm; anchor tenant Maxima) belonging to Viciunai Group enlarged the Kaunas retail market supply to 272,200 sqm.
* Temporary shops open in a given area for a specific period.
The retail market in other Lithuanian cities faced qualitative rather than quantitative changes during 2013, as no new large SCs were opened there. Besides, the Bauhof DIY stores network has been closed due to bankruptcy, causing contraction of retail space supply in Siauliai and Panevezys.
Activity by grocery retail chains was still one of the most important drivers of the retail market in Lithuania. Entry of new Belarus grocery retail chain Fresh Market, further expansion of the Prisma retail chain and the start of construction of Lidl stores enforced stronger competition among retailers. As a result, four major grocery retail chains (Maxima, IKI, Norfa, Rimi) further actively invested in improving their networks by opening new stores and renovating old ones.
f - forecastSource: Colliers International
Dynamics of Retail space
20
01
20
02
20
03
20
04
20
05
20
06
20
07
20
08
20
09
20
10
20
11
20
12
20
13
20
14f
600
500
400
300
200
100
0
Vilnius Kaunas Klaipeda Siauliai Panevezys
Thou
sand
s, s
qm
Distribution of Retail space in vilnius by size
5,000 - 15,000 sqm 15,000 - 45,000 sqm 45,000 and more sqm
21
9
3
32%
33%
35%
Number of Units % GLA of Units
Source: Colliers International
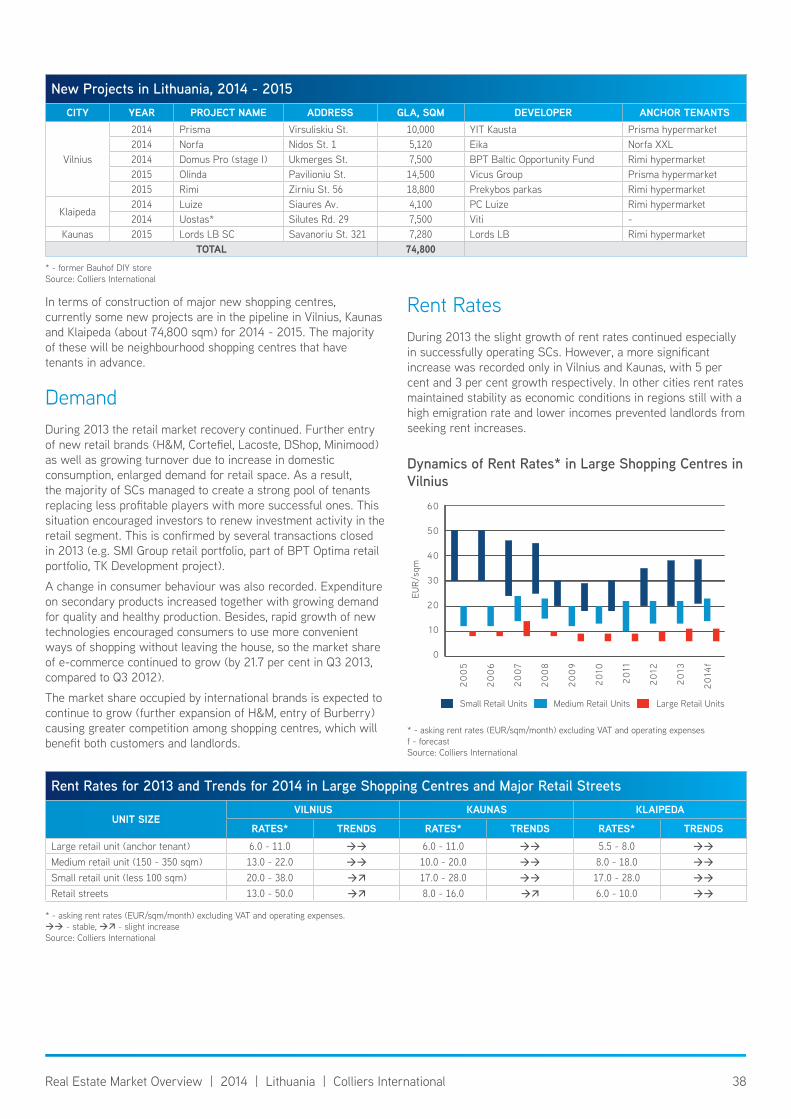
38Real Estate Market Overview | 2014 | Lithuania | Colliers International
In terms of construction of major new shopping centres, currently some new projects are in the pipeline in Vilnius, Kaunas and Klaipeda (about 74,800 sqm) for 2014 - 2015. The majority of these will be neighbourhood shopping centres that have tenants in advance.
DemandDuring 2013 the retail market recovery continued. Further entry of new retail brands (H&M, Cortefiel, Lacoste, DShop, Minimood) as well as growing turnover due to increase in domestic consumption, enlarged demand for retail space. As a result, the majority of SCs managed to create a strong pool of tenants replacing less profitable players with more successful ones. This situation encouraged investors to renew investment activity in the retail segment. This is confirmed by several transactions closed in 2013 (e.g. SMI Group retail portfolio, part of BPT Optima retail portfolio, TK Development project).
A change in consumer behaviour was also recorded. Expenditure on secondary products increased together with growing demand for quality and healthy production. Besides, rapid growth of new technologies encouraged consumers to use more convenient ways of shopping without leaving the house, so the market share of e-commerce continued to grow (by 21.7 per cent in Q3 2013, compared to Q3 2012).
The market share occupied by international brands is expected to continue to grow (further expansion of H&M, entry of Burberry) causing greater competition among shopping centres, which will benefit both customers and landlords.
Rent RatesDuring 2013 the slight growth of rent rates continued especially in successfully operating SCs. However, a more significant increase was recorded only in Vilnius and Kaunas, with 5 per cent and 3 per cent growth respectively. In other cities rent rates maintained stability as economic conditions in regions still with a high emigration rate and lower incomes prevented landlords from seeking rent increases.
new Projects in Lithuania, 2014 - 2015cIty yeaR PRoJect name aDDRess Gla, sQm DeVeloPeR ancHoR tenants
Vilnius
2014 Prisma Virsuliskiu St. 10,000 YIT Kausta Prisma hypermarket2014 Norfa Nidos St. 1 5,120 Eika Norfa XXL2014 Domus Pro (stage I) Ukmerges St. 7,500 BPT Baltic Opportunity Fund Rimi hypermarket2015 Olinda Pavilioniu St. 14,500 Vicus Group Prisma hypermarket2015 Rimi Zirniu St. 56 18,800 Prekybos parkas Rimi hypermarket
Klaipeda2014 Luize Siaures Av. 4,100 PC Luize Rimi hypermarket2014 Uostas* Silutes Rd. 29 7,500 Viti -
Kaunas 2015 Lords LB SC Savanoriu St. 321 7,280 Lords LB Rimi hypermarkettotal 74,800
* - former Bauhof DIY storeSource: Colliers International
* - asking rent rates (EUR/sqm/month) excluding VAT and operating expensesf - forecastSource: Colliers International
Dynamics of Rent Rates* in Large shopping Centres in vilnius
Small Retail Units Medium Retail Units Large Retail Units
EUR/
sqm
20
05
20
06
20
07
20
08
20
09
20
10
20
11
20
12
20
13
20
14f
60
50
40
30
20
10
0
Rent Rates for 2013 and trends for 2014 in Large shopping Centres and Major Retail streets
unIt sIzeVIlnIus Kaunas KlaIPeDa
Rates* tRenDs Rates* tRenDs Rates* tRenDsLarge retail unit (anchor tenant) 6.0 - 11.0 6.0 - 11.0 5.5 - 8.0
Medium retail unit (150 - 350 sqm) 13.0 - 22.0 10.0 - 20.0 8.0 - 18.0
Small retail unit (less 100 sqm) 20.0 - 38.0 17.0 - 28.0 17.0 - 28.0
Retail streets 13.0 - 50.0 8.0 - 16.0 6.0 - 10.0
* - asking rent rates (EUR/sqm/month) excluding VAT and operating expenses. - stable, - slight increaseSource: Colliers International
39Real Estate Market Overview | 2014 | Lithuania | Colliers International
Vacancy RatesIn 2013 the vacancy level in major Lithuanian cities maintained a decreasing trend. Successfully operating SCs practically had no free space. A more difficult situation prevailed in less successful SCs, but even they managed to reduce free retail space, offering alternative ideas or changing the SC concept.
A sustainable level of vacancy (1 - 5 per cent) was observed across the country, with landlords more focused on qualitative improvements of their tenant mix in order to attract more customers to their SCs.
Tendencies and Forecasts > The main driver of the retail market in Lithuania will continue to be grocery retail chains. Fresh Market has plans to open about 30 new stores in 2014, Lidl will start construction of stores all over the country and major grocery retail market players (Maxima, IKI, Rimi, Norfa, Prisma) will continue to improve their competitiveness.
> Construction of new retail properties will mainly concentrate on neighbourhood SCs with an anchor tenant-retailer in advance. The Lithuanian retail market is still not ready for introduction of new regional SCs in the short term.
> Investments in improving the property concept of SCs will continue in order to attract more customers and increase attractiveness to investors.
> Rent rates in Lithuania will be quite stable in 2014. Only slight growth is predicted (2 - 4 per cent) in successfully operating shopping centres.
> The vacancy rate will remain low during 2014 especially in successfully operating SCs in Vilnius, Kaunas and Klaipeda. However, the gap between vacancy in primary and secondary projects will remain.
> The economic outlook in the Euro zone, wage changes, the impact of emigration and rapid development of e-commerce will affect consumption habits and development of the retail market in the near future.
vacancy Rates for 2013 and trends for 2014cIty Vacancy tRenDs
Vilnius 2.0 %
Kaunas 1.0 %
Klaipeda 2.0 %
- stableSource: Colliers International
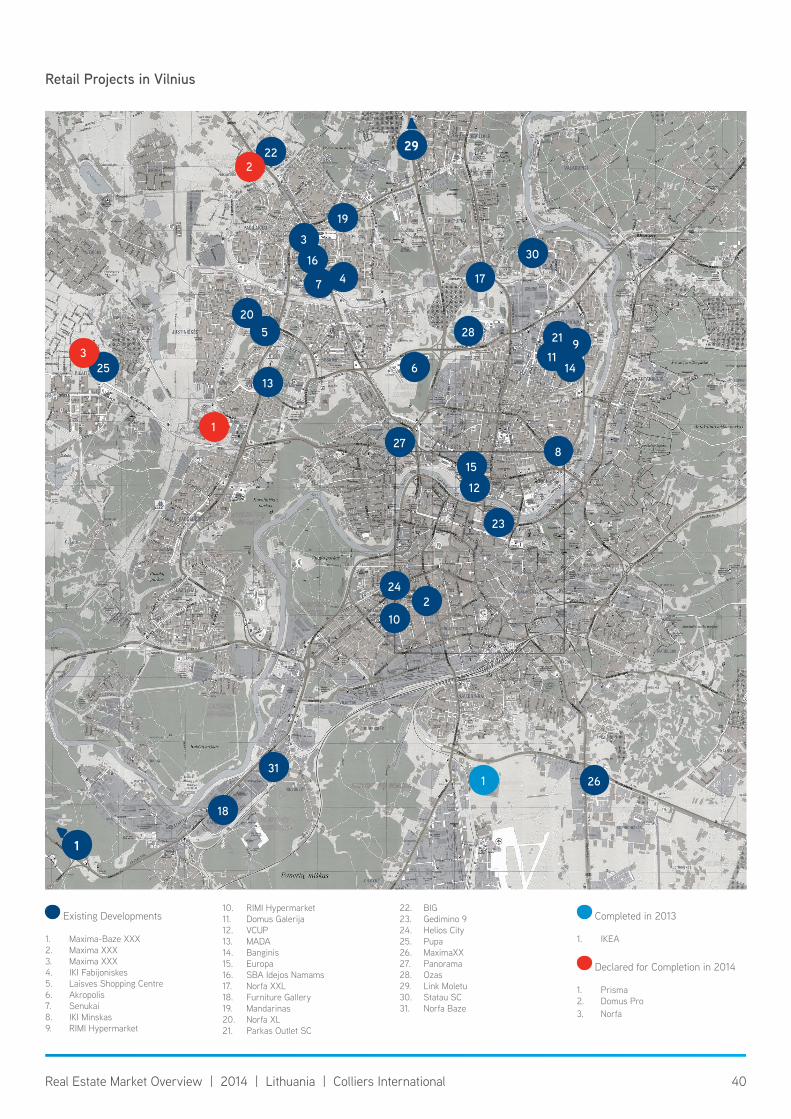
40Real Estate Market Overview | 2014 | Lithuania | Colliers International
Retail Projects in vilnius
18
26
24
102
3
16
22
205
13
27
25
19
7 4 17
30
31
28
611
14
9
8
12
23
15
21
1
▷
29
▷
1
1
2
3
Existing Developments
1. Maxima-Baze XXX2. Maxima XXX3. Maxima XXX4. IKI Fabijoniskes5. Laisves Shopping Centre6. Akropolis7. Senukai8. IKI Minskas9. RIMI Hypermarket
10. RIMI Hypermarket11. Domus Galerija12. VCUP13. MADA14. Banginis15. Europa16. SBA Idejos Namams17. Norfa XXL18. Furniture Gallery19. Mandarinas20. Norfa XL21. Parkas Outlet SC
22. BIG23. Gedimino 924. Helios City25. Pupa26. MaximaXX27. Panorama28. Ozas29. Link Moletu30. Statau SC31. Norfa Baze
Completed in 2013
1. IKEA
Declared for Completion in 2014
1. Prisma2. Domus Pro3. Norfa
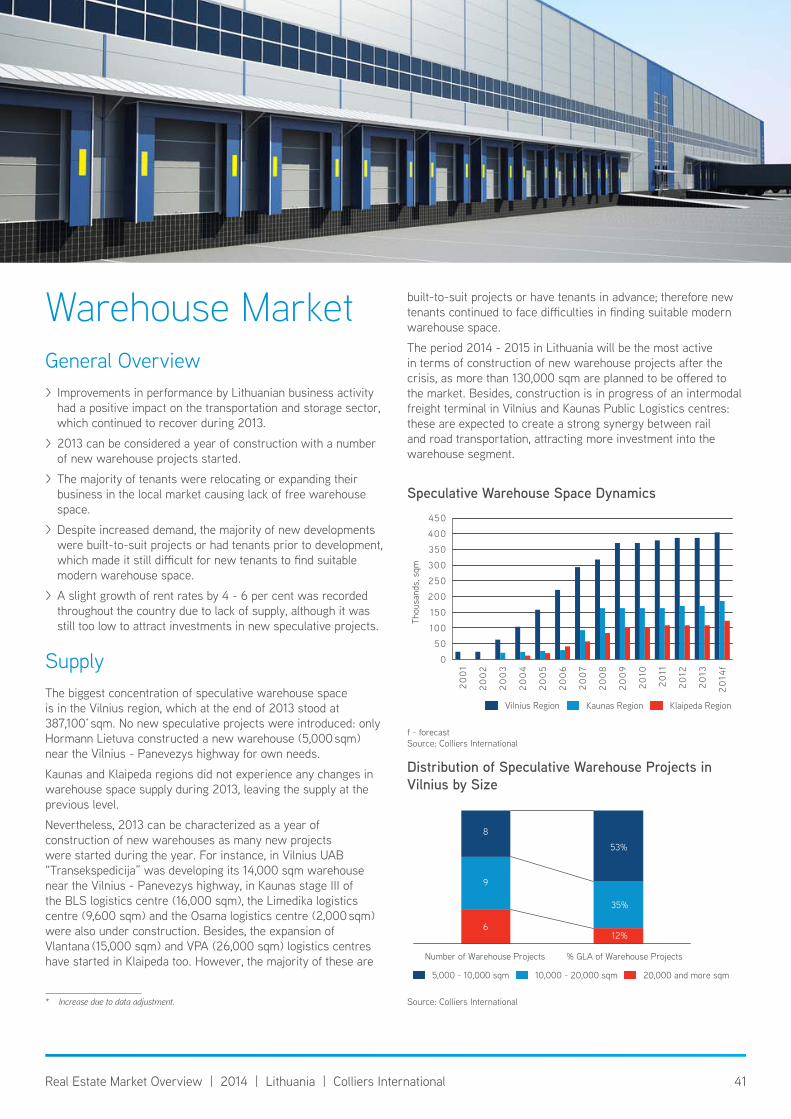
41Real Estate Market Overview | 2014 | Lithuania | Colliers International
Warehouse MarketGeneral Overview > Improvements in performance by Lithuanian business activity had a positive impact on the transportation and storage sector, which continued to recover during 2013.
> 2013 can be considered a year of construction with a number of new warehouse projects started.
> The majority of tenants were relocating or expanding their business in the local market causing lack of free warehouse space.
> Despite increased demand, the majority of new developments were built-to-suit projects or had tenants prior to development, which made it still difficult for new tenants to find suitable modern warehouse space.
> A slight growth of rent rates by 4 - 6 per cent was recorded throughout the country due to lack of supply, although it was still too low to attract investments in new speculative projects.
SupplyThe biggest concentration of speculative warehouse space is in the Vilnius region, which at the end of 2013 stood at 387,100* sqm. No new speculative projects were introduced: only Hormann Lietuva constructed a new warehouse (5,000 sqm) near the Vilnius - Panevezys highway for own needs.
Kaunas and Klaipeda regions did not experience any changes in warehouse space supply during 2013, leaving the supply at the previous level.
Nevertheless, 2013 can be characterized as a year of construction of new warehouses as many new projects were started during the year. For instance, in Vilnius UAB “Transekspedicija” was developing its 14,000 sqm warehouse near the Vilnius - Panevezys highway, in Kaunas stage III of the BLS logistics centre (16,000 sqm), the Limedika logistics centre (9,600 sqm) and the Osama logistics centre (2,000 sqm) were also under construction. Besides, the expansion of Vlantana (15,000 sqm) and VPA (26,000 sqm) logistics centres have started in Klaipeda too. However, the majority of these are
* Increase due to data adjustment.
built-to-suit projects or have tenants in advance; therefore new tenants continued to face difficulties in finding suitable modern warehouse space.
The period 2014 - 2015 in Lithuania will be the most active in terms of construction of new warehouse projects after the crisis, as more than 130,000 sqm are planned to be offered to the market. Besides, construction is in progress of an intermodal freight terminal in Vilnius and Kaunas Public Logistics centres: these are expected to create a strong synergy between rail and road transportation, attracting more investment into the warehouse segment.
f - forecastSource: Colliers International
speculative warehouse space Dynamics
20
01
20
02
20
03
20
04
20
05
20
06
20
07
20
08
20
09
20
10
20
11
20
12
20
13
20
14f
450
400
350
300
250
200
150
100
50
0
Vilnius Region Kaunas Region Klaipeda Region
Thou
sand
s, s
qm
Distribution of speculative warehouse Projects in vilnius by size
5,000 - 10,000 sqm 10,000 - 20,000 sqm 20,000 and more sqm
6
9
8
12%
35%
53%
Number of Warehouse Projects % GLA of Warehouse Projects
Source: Colliers International
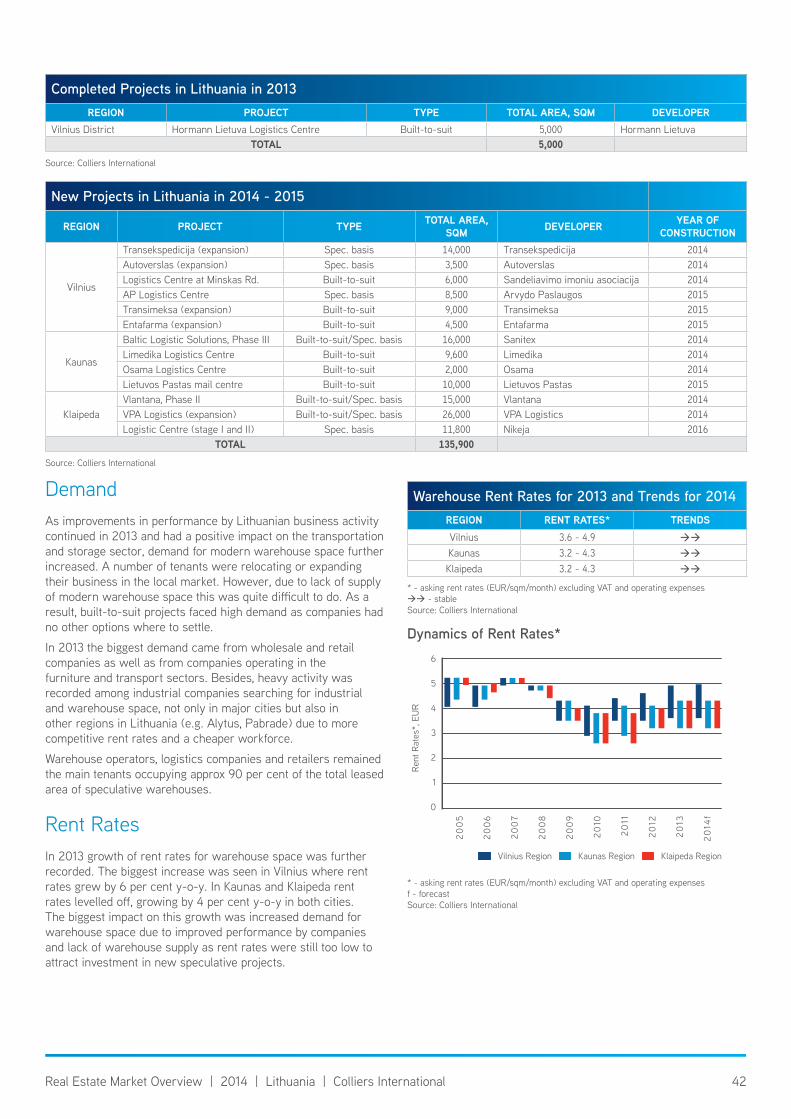
42Real Estate Market Overview | 2014 | Lithuania | Colliers International
DemandAs improvements in performance by Lithuanian business activity continued in 2013 and had a positive impact on the transportation and storage sector, demand for modern warehouse space further increased. A number of tenants were relocating or expanding their business in the local market. However, due to lack of supply of modern warehouse space this was quite difficult to do. As a result, built-to-suit projects faced high demand as companies had no other options where to settle.
In 2013 the biggest demand came from wholesale and retail companies as well as from companies operating in the furniture and transport sectors. Besides, heavy activity was recorded among industrial companies searching for industrial and warehouse space, not only in major cities but also in other regions in Lithuania (e.g. Alytus, Pabrade) due to more competitive rent rates and a cheaper workforce.
Warehouse operators, logistics companies and retailers remained the main tenants occupying approx 90 per cent of the total leased area of speculative warehouses.
Rent RatesIn 2013 growth of rent rates for warehouse space was further recorded. The biggest increase was seen in Vilnius where rent rates grew by 6 per cent y-o-y. In Kaunas and Klaipeda rent rates levelled off, growing by 4 per cent y-o-y in both cities. The biggest impact on this growth was increased demand for warehouse space due to improved performance by companies and lack of warehouse supply as rent rates were still too low to attract investment in new speculative projects.
warehouse Rent Rates for 2013 and trends for 2014ReGIon Rent Rates* tRenDsVilnius 3.6 - 4.9
Kaunas 3.2 - 4.3
Klaipeda 3.2 - 4.3
* - asking rent rates (EUR/sqm/month) excluding VAT and operating expenses - stableSource: Colliers International
* - asking rent rates (EUR/sqm/month) excluding VAT and operating expenses f - forecastSource: Colliers International
Dynamics of Rent Rates*
Vilnius Region Kaunas Region Klaipeda Region
Rent
Rat
es*,
EU
R
20
05
20
06
20
07
20
08
20
09
20
10
20
11
20
12
20
13
20
14f
6
5
4
3
2
1
0
new Projects in Lithuania in 2014 - 2015
ReGIon PRoJect tyPe total aRea, sQm DeVeloPeR YeAr oF
constRuctIon
Vilnius
Transekspedicija (expansion) Spec. basis 14,000 Transekspedicija 2014Autoverslas (expansion) Spec. basis 3,500 Autoverslas 2014Logistics Centre at Minskas Rd. Built-to-suit 6,000 Sandeliavimo imoniu asociacija 2014AP Logistics Centre Spec. basis 8,500 Arvydo Paslaugos 2015Transimeksa (expansion) Built-to-suit 9,000 Transimeksa 2015Entafarma (expansion) Built-to-suit 4,500 Entafarma 2015
Kaunas
Baltic Logistic Solutions, Phase III Built-to-suit/Spec. basis 16,000 Sanitex 2014Limedika Logistics Centre Built-to-suit 9,600 Limedika 2014Osama Logistics Centre Built-to-suit 2,000 Osama 2014Lietuvos Pastas mail centre Built-to-suit 10,000 Lietuvos Pastas 2015
KlaipedaVlantana, Phase II Built-to-suit/Spec. basis 15,000 Vlantana 2014VPA Logistics (expansion) Built-to-suit/Spec. basis 26,000 VPA Logistics 2014Logistic Centre (stage I and II) Spec. basis 11,800 Nikeja 2016
total 135,900Source: Colliers International
Completed Projects in Lithuania in 2013ReGIon PRoJect tyPe total aRea, sQm DeVeloPeR
Vilnius District Hormann Lietuva Logistics Centre Built-to-suit 5,000 Hormann Lietuvatotal 5,000
Source: Colliers International
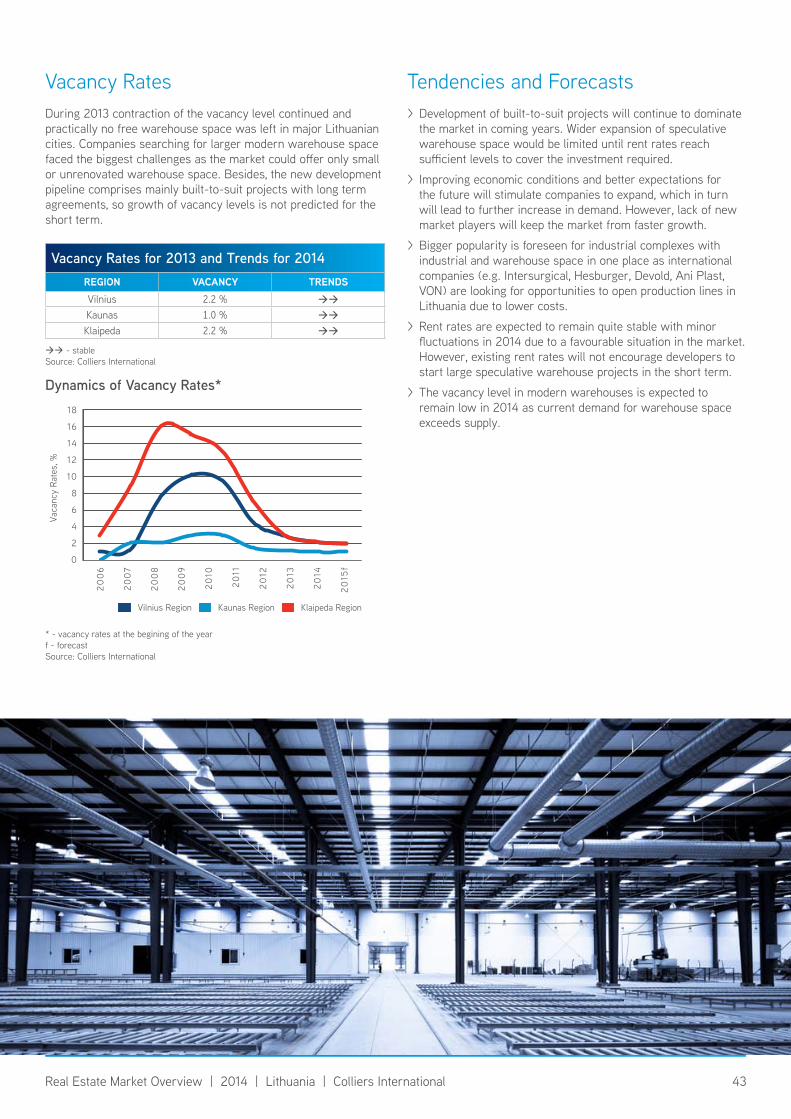
43Real Estate Market Overview | 2014 | Lithuania | Colliers International
Vacancy RatesDuring 2013 contraction of the vacancy level continued and practically no free warehouse space was left in major Lithuanian cities. Companies searching for larger modern warehouse space faced the biggest challenges as the market could offer only small or unrenovated warehouse space. Besides, the new development pipeline comprises mainly built-to-suit projects with long term agreements, so growth of vacancy levels is not predicted for the short term.
Tendencies and Forecasts > Development of built-to-suit projects will continue to dominate the market in coming years. Wider expansion of speculative warehouse space would be limited until rent rates reach sufficient levels to cover the investment required.
> Improving economic conditions and better expectations for the future will stimulate companies to expand, which in turn will lead to further increase in demand. However, lack of new market players will keep the market from faster growth.
> Bigger popularity is foreseen for industrial complexes with industrial and warehouse space in one place as international companies (e.g. Intersurgical, Hesburger, Devold, Ani Plast, VON) are looking for opportunities to open production lines in Lithuania due to lower costs.
> Rent rates are expected to remain quite stable with minor fluctuations in 2014 due to a favourable situation in the market. However, existing rent rates will not encourage developers to start large speculative warehouse projects in the short term.
> The vacancy level in modern warehouses is expected to remain low in 2014 as current demand for warehouse space exceeds supply.
vacancy Rates for 2013 and trends for 2014ReGIon Vacancy tRenDsVilnius 2.2 %
Kaunas 1.0 %
Klaipeda 2.2 %
- stableSource: Colliers International
* - vacancy rates at the begining of the yearf - forecastSource: Colliers International
Dynamics of vacancy Rates*
Vilnius Region Kaunas Region Klaipeda Region
Vaca
ncy
Rate
s, %
20
06
20
07
20
08
20
09
20
10
20
11
20
12
20
13
20
14
20
15f
18
16
14
12
10
8
6
4
2
0
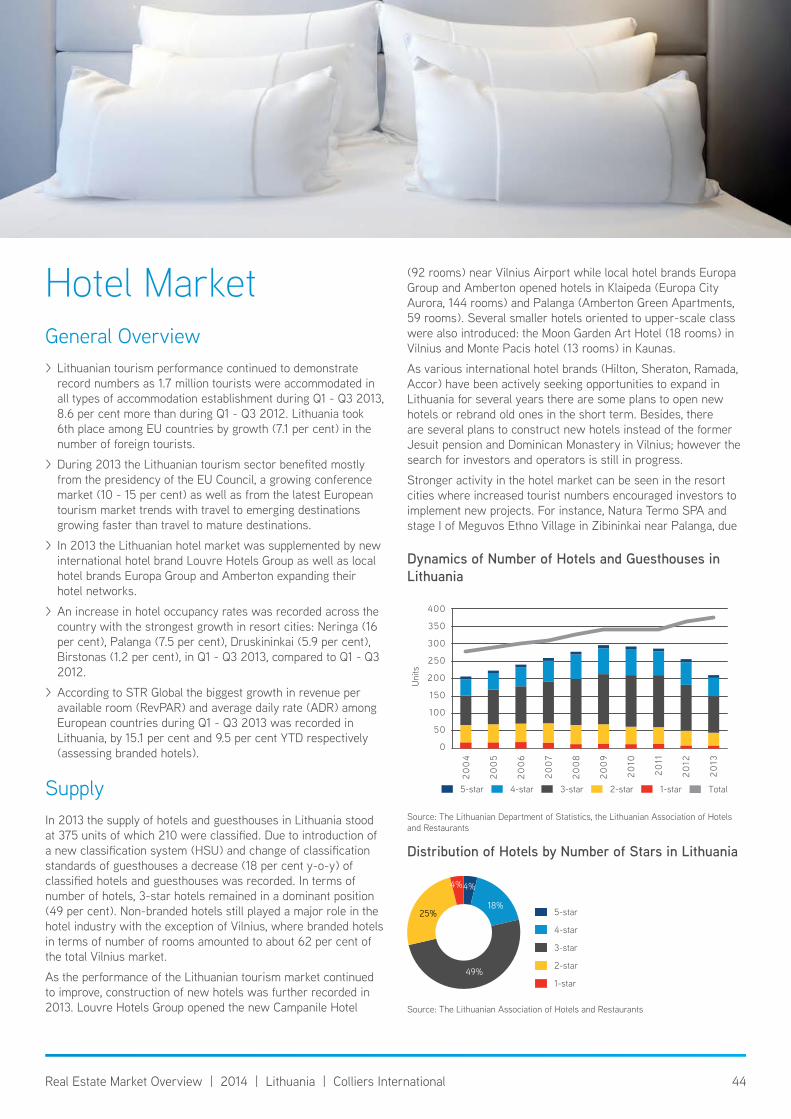
44Real Estate Market Overview | 2014 | Lithuania | Colliers International
Hotel MarketGeneral Overview > Lithuanian tourism performance continued to demonstrate record numbers as 1.7 million tourists were accommodated in all types of accommodation establishment during Q1 - Q3 2013, 8.6 per cent more than during Q1 - Q3 2012. Lithuania took 6th place among EU countries by growth (7.1 per cent) in the number of foreign tourists.
> During 2013 the Lithuanian tourism sector benefited mostly from the presidency of the EU Council, a growing conference market (10 - 15 per cent) as well as from the latest European tourism market trends with travel to emerging destinations growing faster than travel to mature destinations.
> In 2013 the Lithuanian hotel market was supplemented by new international hotel brand Louvre Hotels Group as well as local hotel brands Europa Group and Amberton expanding their hotel networks.
> An increase in hotel occupancy rates was recorded across the country with the strongest growth in resort cities: Neringa (16 per cent), Palanga (7.5 per cent), Druskininkai (5.9 per cent), Birstonas (1.2 per cent), in Q1 - Q3 2013, compared to Q1 - Q3 2012.
> According to STR Global the biggest growth in revenue per available room (RevPAR) and average daily rate (ADR) among European countries during Q1 - Q3 2013 was recorded in Lithuania, by 15.1 per cent and 9.5 per cent YTD respectively (assessing branded hotels).
SupplyIn 2013 the supply of hotels and guesthouses in Lithuania stood at 375 units of which 210 were classified. Due to introduction of a new classification system (HSU) and change of classification standards of guesthouses a decrease (18 per cent y-o-y) of classified hotels and guesthouses was recorded. In terms of number of hotels, 3-star hotels remained in a dominant position (49 per cent). Non-branded hotels still played a major role in the hotel industry with the exception of Vilnius, where branded hotels in terms of number of rooms amounted to about 62 per cent of the total Vilnius market.
As the performance of the Lithuanian tourism market continued to improve, construction of new hotels was further recorded in 2013. Louvre Hotels Group opened the new Campanile Hotel
(92 rooms) near Vilnius Airport while local hotel brands Europa Group and Amberton opened hotels in Klaipeda (Europa City Aurora, 144 rooms) and Palanga (Amberton Green Apartments, 59 rooms). Several smaller hotels oriented to upper-scale class were also introduced: the Moon Garden Art Hotel (18 rooms) in Vilnius and Monte Pacis hotel (13 rooms) in Kaunas.
As various international hotel brands (Hilton, Sheraton, Ramada, Accor) have been actively seeking opportunities to expand in Lithuania for several years there are some plans to open new hotels or rebrand old ones in the short term. Besides, there are several plans to construct new hotels instead of the former Jesuit pension and Dominican Monastery in Vilnius; however the search for investors and operators is still in progress.
Stronger activity in the hotel market can be seen in the resort cities where increased tourist numbers encouraged investors to implement new projects. For instance, Natura Termo SPA and stage I of Meguvos Ethno Village in Zibininkai near Palanga, due
Source: The Lithuanian Department of Statistics, the Lithuanian Association of Hotels and Restaurants
Dynamics of number of hotels and Guesthouses in Lithuania
Uni
ts
400
350
300
250
200
150
100
50
0
20
04
20
05
20
06
20
07
20
08
20
09
20
10
20
11
20
12
20
13
1-star2-star3-star4-star5-star Total
Source: The Lithuanian Association of Hotels and Restaurants
Distribution of hotels by number of stars in Lithuania
18%
49%
25%
4%4%
5-star
4-star
3-star
2-star
1-star
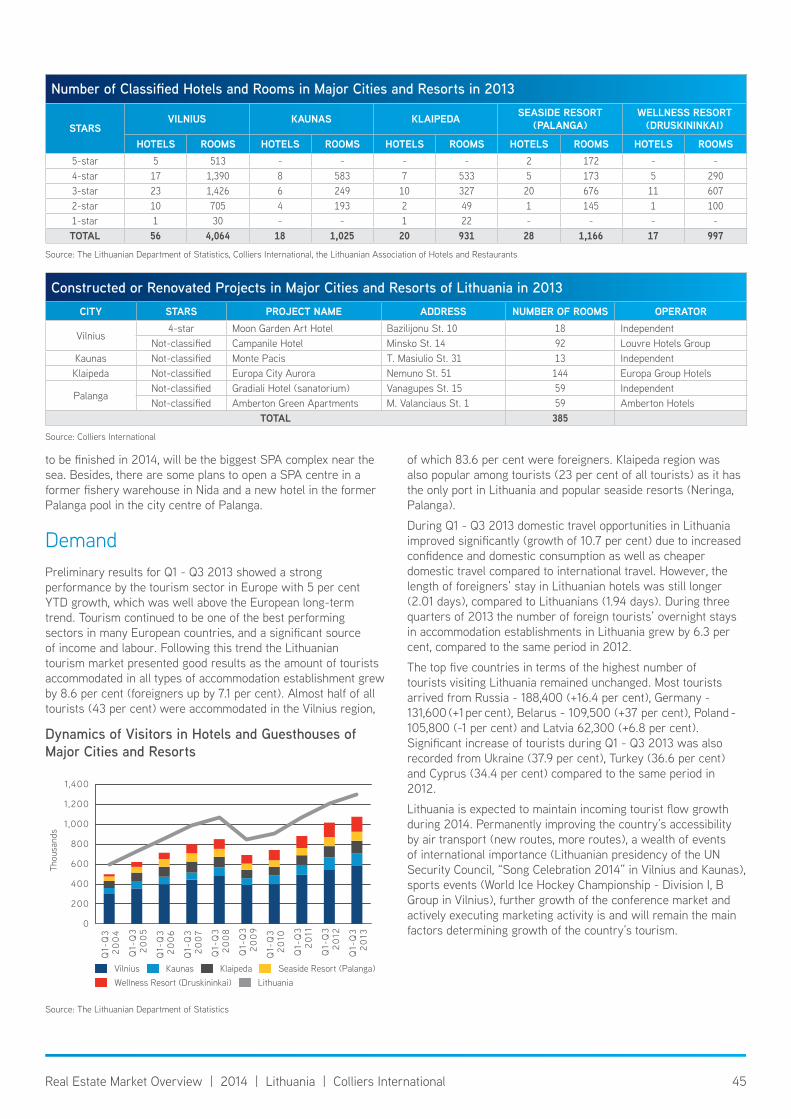
45Real Estate Market Overview | 2014 | Lithuania | Colliers International
to be finished in 2014, will be the biggest SPA complex near the sea. Besides, there are some plans to open a SPA centre in a former fishery warehouse in Nida and a new hotel in the former Palanga pool in the city centre of Palanga.
DemandPreliminary results for Q1 - Q3 2013 showed a strong performance by the tourism sector in Europe with 5 per cent YTD growth, which was well above the European long-term trend. Tourism continued to be one of the best performing sectors in many European countries, and a significant source of income and labour. Following this trend the Lithuanian tourism market presented good results as the amount of tourists accommodated in all types of accommodation establishment grew by 8.6 per cent (foreigners up by 7.1 per cent). Almost half of all tourists (43 per cent) were accommodated in the Vilnius region,
of which 83.6 per cent were foreigners. Klaipeda region was also popular among tourists (23 per cent of all tourists) as it has the only port in Lithuania and popular seaside resorts (Neringa, Palanga).
During Q1 - Q3 2013 domestic travel opportunities in Lithuania improved significantly (growth of 10.7 per cent) due to increased confidence and domestic consumption as well as cheaper domestic travel compared to international travel. However, the length of foreigners’ stay in Lithuanian hotels was still longer (2.01 days), compared to Lithuanians (1.94 days). During three quarters of 2013 the number of foreign tourists’ overnight stays in accommodation establishments in Lithuania grew by 6.3 per cent, compared to the same period in 2012.
The top five countries in terms of the highest number of tourists visiting Lithuania remained unchanged. Most tourists arrived from Russia - 188,400 (+16.4 per cent), Germany - 131,600 (+1 per cent), Belarus - 109,500 (+37 per cent), Poland - 105,800 (-1 per cent) and Latvia 62,300 (+6.8 per cent). Significant increase of tourists during Q1 - Q3 2013 was also recorded from Ukraine (37.9 per cent), Turkey (36.6 per cent) and Cyprus (34.4 per cent) compared to the same period in 2012.
Lithuania is expected to maintain incoming tourist flow growth during 2014. Permanently improving the country’s accessibility by air transport (new routes, more routes), a wealth of events of international importance (Lithuanian presidency of the UN Security Council, “Song Celebration 2014” in Vilnius and Kaunas), sports events (World Ice Hockey Championship - Division I, B Group in Vilnius), further growth of the conference market and actively executing marketing activity is and will remain the main factors determining growth of the country’s tourism.
Number of Classified Hotels and Rooms in Major Cities and Resorts in 2013
staRsVIlnIus Kaunas KlaIPeDa seasIDe ResoRt
(PalanGa)Wellness ResoRt
(DRusKInInKaI)
Hotels Rooms Hotels Rooms Hotels Rooms Hotels Rooms Hotels Rooms5-star 5 513 - - - - 2 172 - -4-star 17 1,390 8 583 7 533 5 173 5 2903-star 23 1,426 6 249 10 327 20 676 11 6072-star 10 705 4 193 2 49 1 145 1 1001-star 1 30 - - 1 22 - - - -total 56 4,064 18 1,025 20 931 28 1,166 17 997
Source: The Lithuanian Department of Statistics, Colliers International, the Lithuanian Association of Hotels and Restaurants
Source: The Lithuanian Department of Statistics
Dynamics of visitors in hotels and Guesthouses of Major Cities and Resorts
Thou
sand
s
1 ,400
1,200
1,000
800
600
400
200
0
Vilnius Kaunas Klaipeda Seaside Resort (Palanga)Wellness Resort (Druskininkai) Lithuania
Q1-
Q3
20
04
Q1-
Q3
20
05
Q1-
Q3
20
06
Q1-
Q3
20
07
Q1-
Q3
20
08
Q1-
Q3
20
09
Q1-
Q3
20
10
Q1-
Q3
20
11
Q1-
Q3
20
12
Q1-
Q3
20
13
Constructed or Renovated Projects in Major Cities and Resorts of Lithuania in 2013cIty staRs PRoJect name aDDRess nuMber oF rooMs oPeRatoR
Vilnius4-star Moon Garden Art Hotel Bazilijonu St. 10 18 Independent
Not-classified Campanile Hotel Minsko St. 14 92 Louvre Hotels GroupKaunas Not-classified Monte Pacis T. Masiulio St. 31 13 IndependentKlaipeda Not-classified Europa City Aurora Nemuno St. 51 144 Europa Group Hotels
PalangaNot-classified Gradiali Hotel (sanatorium) Vanagupes St. 15 59 IndependentNot-classified Amberton Green Apartments M. Valanciaus St. 1 59 Amberton Hotels
total 385Source: Colliers International
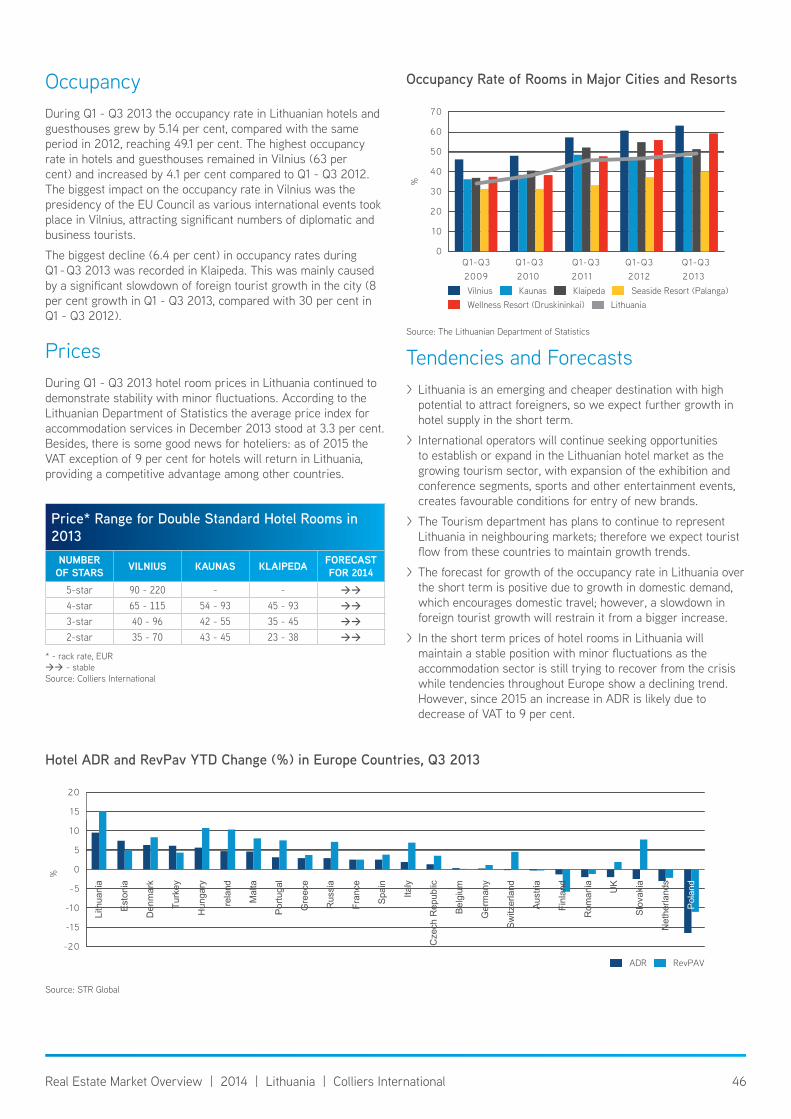
46Real Estate Market Overview | 2014 | Lithuania | Colliers International
OccupancyDuring Q1 - Q3 2013 the occupancy rate in Lithuanian hotels and guesthouses grew by 5.14 per cent, compared with the same period in 2012, reaching 49.1 per cent. The highest occupancy rate in hotels and guesthouses remained in Vilnius (63 per cent) and increased by 4.1 per cent compared to Q1 - Q3 2012. The biggest impact on the occupancy rate in Vilnius was the presidency of the EU Council as various international events took place in Vilnius, attracting significant numbers of diplomatic and business tourists.
The biggest decline (6.4 per cent) in occupancy rates during Q1 - Q3 2013 was recorded in Klaipeda. This was mainly caused by a significant slowdown of foreign tourist growth in the city (8 per cent growth in Q1 - Q3 2013, compared with 30 per cent in Q1 - Q3 2012).
PricesDuring Q1 - Q3 2013 hotel room prices in Lithuania continued to demonstrate stability with minor fluctuations. According to the Lithuanian Department of Statistics the average price index for accommodation services in December 2013 stood at 3.3 per cent. Besides, there is some good news for hoteliers: as of 2015 the VAT exception of 9 per cent for hotels will return in Lithuania, providing a competitive advantage among other countries.
Tendencies and Forecasts > Lithuania is an emerging and cheaper destination with high potential to attract foreigners, so we expect further growth in hotel supply in the short term.
> International operators will continue seeking opportunities to establish or expand in the Lithuanian hotel market as the growing tourism sector, with expansion of the exhibition and conference segments, sports and other entertainment events, creates favourable conditions for entry of new brands.
> The Tourism department has plans to continue to represent Lithuania in neighbouring markets; therefore we expect tourist flow from these countries to maintain growth trends.
> The forecast for growth of the occupancy rate in Lithuania over the short term is positive due to growth in domestic demand, which encourages domestic travel; however, a slowdown in foreign tourist growth will restrain it from a bigger increase.
> In the short term prices of hotel rooms in Lithuania will maintain a stable position with minor fluctuations as the accommodation sector is still trying to recover from the crisis while tendencies throughout Europe show a declining trend. However, since 2015 an increase in ADR is likely due to decrease of VAT to 9 per cent.
Source: The Lithuanian Department of Statistics
Occupancy Rate of Rooms in Major Cities and Resorts
2009 2010 2011 2012 2013Q1-Q3 Q1-Q3 Q1-Q3 Q1-Q3 Q1-Q3
%
70
60
50
40
30
20
10
0
Vilnius Kaunas Klaipeda Seaside Resort (Palanga)Wellness Resort (Druskininkai) Lithuania
Source: STR Global
hotel ADR and RevPav YtD Change (%) in europe Countries, Q3 2013
%
20
15
10
5
0
-5
-10
-15
-20
ADR RevPAV
Lith
uani
a
Est
onia
Den
mar
k
Turk
ey
Hun
gary
Irela
nd
Mal
ta
Por
tuga
l
Gre
ece
Rus
sia
Fran
ce
Spa
in
Italy
Cze
ch R
epub
lic
Bel
gium
Ger
man
y
Sw
itzer
land
Aus
tria
Finl
and
Rom
ania UK
Slo
vaki
a
Net
herla
nds
Pol
and
Price* Range for Double standard hotel Rooms in 2013
numBeR oF sTArs VIlnIus Kaunas KlaIPeDa ForeCAsT
For 20145-star 90 - 220 - -
4-star 65 - 115 54 - 93 45 - 93
3-star 40 - 96 42 - 55 35 - 45
2-star 35 - 70 43 - 45 23 - 38
* - rack rate, EUR - stableSource: Colliers International

47Real Estate Market Overview | 2014 | Lithuania | SORAINEN
Legal OverviewCommercial real estate in Lithuania can be purchased in two ways - via asset transfer deal or via share transfer deal. Asset deals and share deals are both commonly used in practice.
Asset Transfer Deals
Main Steps Usually a sale of real estate by one party (seller) to another party (buyer) would be carried out following these main steps:
1. In the case of a larger real estate transaction, before signing the final sale-purchase agreement the parties usually conclude preliminary documents (e.g. letter of intent or preliminary purchase agreement) setting out the main terms of the deal (e.g. purchase price, payment mechanism, main deadlines to complete due diligence of the real estate and sign the final agreement).
2. Before concluding the final sale-purchase agreement the seller must offer third parties to exercise their right of first refusal to acquire the property (e.g. property co-owners, if such rights exist) on the same conditions as agreed with the buyer.
3. In the case of price settlement through a notary’s or bank escrow (deposit) account simultaneously with conclusion of the final sale-purchase agreement, the parties negotiate and conclude an agreement on the terms of use of the escrow account.
4. If purchase of real estate is financed by a third party (e.g. a bank), then the lender will require security in the form of a mortgage. In that case the mortgage is usually created immediately after registration of the real estate in the name of the new owner or the new owner may mortgage real estate to be acquired in the future.
5. The parties sign an asset purchase agreement, which must be certificated by a notary. Non-compliance with requirements of form makes the contract ineffective.
6. After signing and notarisation of the purchase agreement, title to the property transferred should be registered with the Real Estate Register in the new owner’s name. Registration is done through the notary who certified the transaction.
7. According to existing practice, the notary’s fees and costs related to certification of the transaction are covered by the buyer or shared between the parties. The buyer also pays for registration of title in its name with the public register.
A regular real estate transfer transaction is usually completed within 10 - 15 business days. For more complicated transfers (involving preliminary documents, due diligence, fulfilment of certain conditions precedent, third party participation) the transaction may take about 2 - 3 months.
Key Issues Involved > Asset deals may be more expensive than share deals, as an asset deal involves notary and registration fees.
> Lithuanian law entitles a tenant of the property to terminate the lease on change of ownership of the leased property; in practice this issue is tackled by collecting waivers from tenants.
> Under certain circumstances an asset deal may be treated as a sale of the entire company, in which case the buyer may be exposed to additional risks related to validity of the transaction and liability to creditors and employees of the company which owned the target real estate.
> The scope of due diligence investigation is limited as it covers only the target asset.
Share Transfer Deals
Main StepsShare transfer deals include these main steps:
1. Especially in the event of a larger transaction, a letter of intent, preliminary purchase agreement or similar pre-contractual arrangement is entered into before signing the main share purchase agreement. The letter of intent, preliminary agreement or similar document sets out the main terms of the transaction (e.g. purchase price, payment mechanism, main deadlines to complete due diligence and sign the final agreement, exclusivity period).
2. Usually a due diligence (e.g. legal, tax, commercial, financial) is performed before concluding the main share purchase agreement. Before examining the documents of the target company the purchaser and its advisors sign confidentiality /non-disclosure obligations. In certain situations due diligence may occur after signing the share purchase agreement but before completion of the transaction.
3. Once the parties reach agreement on the transaction, the share purchase agreement is signed.
4. When less than 100 per cent of shares are acquired, waivers have to be obtained from other shareholders (i.e. those not selling their shares) of their right of first refusal (pre-emptive right) to acquire the shares to be sold by the selling shareholder. These waivers are collected before signing the purchase agreement or before completion of the transaction (in that case obtaining waivers is included as a condition precedent for closing). In addition, when less than 100 per cent shares are acquired, a shareholders’ agreement may be concluded between the buyer and the seller and/or other shareholders.
5. Merger control and other regulatory filings are generally carried out before closing and are included in the transaction documents as conditions precedent for completion.
6. Title to the shares is transferred as agreed in the share purchase agreement (e.g. on signing, after payment all or part of the purchase price). Transfer of title is evidenced by making entries in the securities’ accounts opened in the name of the seller and the buyer (in the event of non-certificated shares). If certificated shares are transferred, then entries evidencing the transfer (endorsements) are made on the share certificates.
7. The new list of shareholders should be filed with the Register of Legal Entities.
Key Issues to Take into Account > A share deal does not involve notary fees and state duty for registration of real estate.
> The buyer takes over the entire company (assets and liabilities)
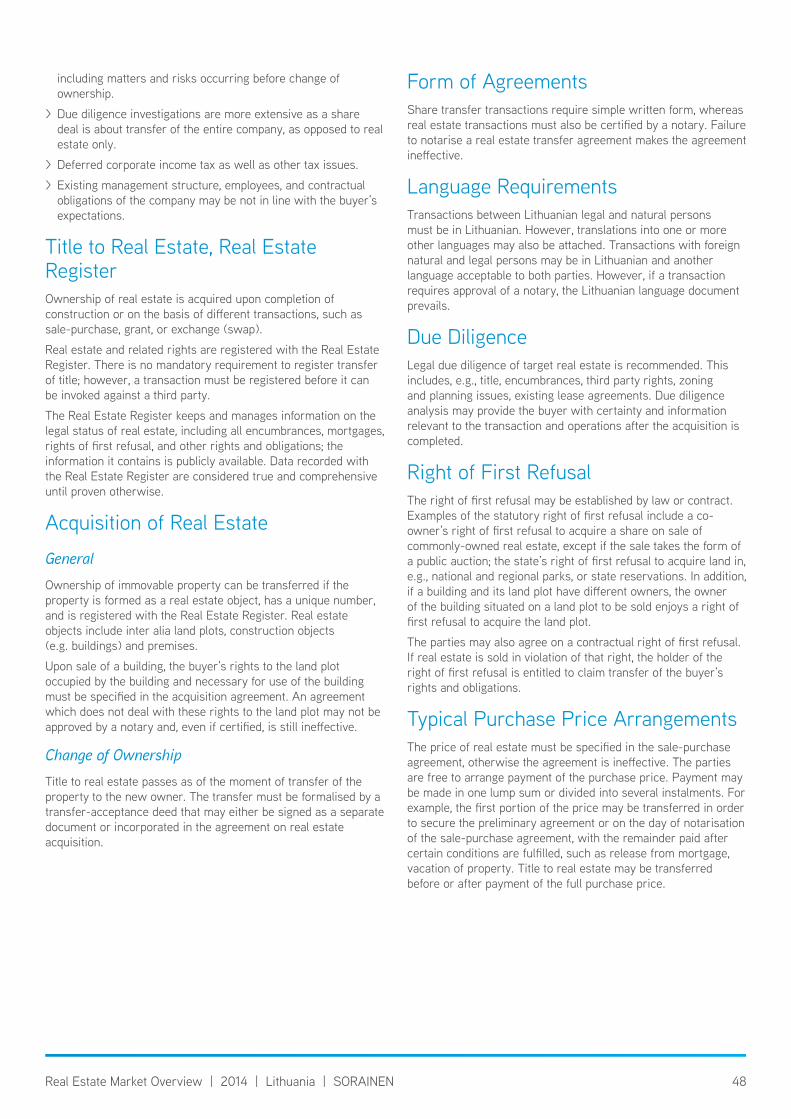
48Real Estate Market Overview | 2014 | Lithuania | SORAINEN
including matters and risks occurring before change of ownership.
> Due diligence investigations are more extensive as a share deal is about transfer of the entire company, as opposed to real estate only.
> Deferred corporate income tax as well as other tax issues.
> Existing management structure, employees, and contractual obligations of the company may be not in line with the buyer’s expectations.
Title to Real Estate, Real Estate RegisterOwnership of real estate is acquired upon completion of construction or on the basis of different transactions, such as sale-purchase, grant, or exchange (swap).
Real estate and related rights are registered with the Real Estate Register. There is no mandatory requirement to register transfer of title; however, a transaction must be registered before it can be invoked against a third party.
The Real Estate Register keeps and manages information on the legal status of real estate, including all encumbrances, mortgages, rights of first refusal, and other rights and obligations; the information it contains is publicly available. Data recorded with the Real Estate Register are considered true and comprehensive until proven otherwise.
Acquisition of Real Estate
GeneralOwnership of immovable property can be transferred if the property is formed as a real estate object, has a unique number, and is registered with the Real Estate Register. Real estate objects include inter alia land plots, construction objects (e.g. buildings) and premises.
Upon sale of a building, the buyer’s rights to the land plot occupied by the building and necessary for use of the building must be specified in the acquisition agreement. An agreement which does not deal with these rights to the land plot may not be approved by a notary and, even if certified, is still ineffective.
Change of OwnershipTitle to real estate passes as of the moment of transfer of the property to the new owner. The transfer must be formalised by a transfer-acceptance deed that may either be signed as a separate document or incorporated in the agreement on real estate acquisition.
Form of AgreementsShare transfer transactions require simple written form, whereas real estate transactions must also be certified by a notary. Failure to notarise a real estate transfer agreement makes the agreement ineffective.
Language RequirementsTransactions between Lithuanian legal and natural persons must be in Lithuanian. However, translations into one or more other languages may also be attached. Transactions with foreign natural and legal persons may be in Lithuanian and another language acceptable to both parties. However, if a transaction requires approval of a notary, the Lithuanian language document prevails.
Due DiligenceLegal due diligence of target real estate is recommended. This includes, e.g., title, encumbrances, third party rights, zoning and planning issues, existing lease agreements. Due diligence analysis may provide the buyer with certainty and information relevant to the transaction and operations after the acquisition is completed.
Right of First RefusalThe right of first refusal may be established by law or contract. Examples of the statutory right of first refusal include a co-owner’s right of first refusal to acquire a share on sale of commonly-owned real estate, except if the sale takes the form of a public auction; the state’s right of first refusal to acquire land in, e.g., national and regional parks, or state reservations. In addition, if a building and its land plot have different owners, the owner of the building situated on a land plot to be sold enjoys a right of first refusal to acquire the land plot.
The parties may also agree on a contractual right of first refusal. If real estate is sold in violation of that right, the holder of the right of first refusal is entitled to claim transfer of the buyer’s rights and obligations.
Typical Purchase Price ArrangementsThe price of real estate must be specified in the sale-purchase agreement, otherwise the agreement is ineffective. The parties are free to arrange payment of the purchase price. Payment may be made in one lump sum or divided into several instalments. For example, the first portion of the price may be transferred in order to secure the preliminary agreement or on the day of notarisation of the sale-purchase agreement, with the remainder paid after certain conditions are fulfilled, such as release from mortgage, vacation of property. Title to real estate may be transferred before or after payment of the full purchase price.
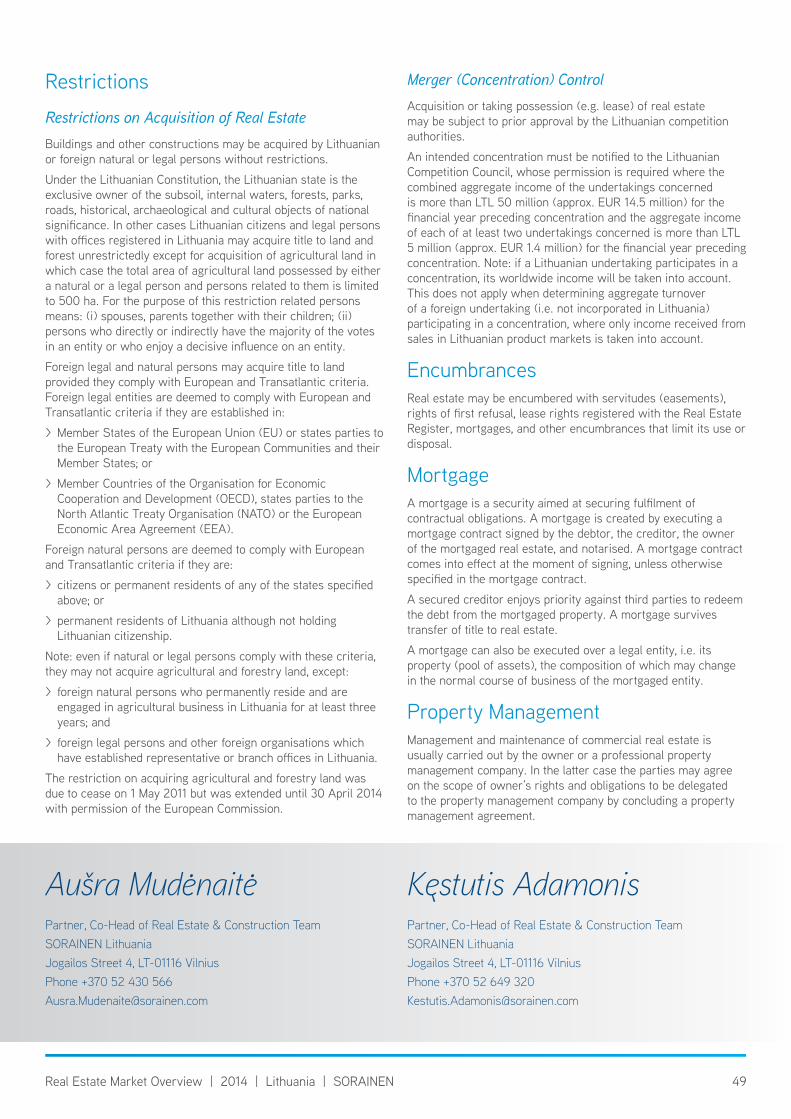
49Real Estate Market Overview | 2014 | Lithuania | SORAINEN
Restrictions
Restrictions on Acquisition of Real EstateBuildings and other constructions may be acquired by Lithuanian or foreign natural or legal persons without restrictions.
Under the Lithuanian Constitution, the Lithuanian state is the exclusive owner of the subsoil, internal waters, forests, parks, roads, historical, archaeological and cultural objects of national significance. In other cases Lithuanian citizens and legal persons with offices registered in Lithuania may acquire title to land and forest unrestrictedly except for acquisition of agricultural land in which case the total area of agricultural land possessed by either a natural or a legal person and persons related to them is limited to 500 ha. For the purpose of this restriction related persons means: (i) spouses, parents together with their children; (ii) persons who directly or indirectly have the majority of the votes in an entity or who enjoy a decisive influence on an entity.
Foreign legal and natural persons may acquire title to land provided they comply with European and Transatlantic criteria. Foreign legal entities are deemed to comply with European and Transatlantic criteria if they are established in:
> Member States of the European Union (EU) or states parties to the European Treaty with the European Communities and their Member States; or
> Member Countries of the Organisation for Economic Cooperation and Development (OECD), states parties to the North Atlantic Treaty Organisation (NATO) or the European Economic Area Agreement (EEA).
Foreign natural persons are deemed to comply with European and Transatlantic criteria if they are:
> citizens or permanent residents of any of the states specified above; or
> permanent residents of Lithuania although not holding Lithuanian citizenship.
Note: even if natural or legal persons comply with these criteria, they may not acquire agricultural and forestry land, except:
> foreign natural persons who permanently reside and are engaged in agricultural business in Lithuania for at least three years; and
> foreign legal persons and other foreign organisations which have established representative or branch offices in Lithuania.
The restriction on acquiring agricultural and forestry land was due to cease on 1 May 2011 but was extended until 30 April 2014 with permission of the European Commission.
Merger (Concentration) Control Acquisition or taking possession (e.g. lease) of real estate may be subject to prior approval by the Lithuanian competition authorities.
An intended concentration must be notified to the Lithuanian Competition Council, whose permission is required where the combined aggregate income of the undertakings concerned is more than LTL 50 million (approx. EUR 14.5 million) for the financial year preceding concentration and the aggregate income of each of at least two undertakings concerned is more than LTL 5 million (approx. EUR 1.4 million) for the financial year preceding concentration. Note: if a Lithuanian undertaking participates in a concentration, its worldwide income will be taken into account. This does not apply when determining aggregate turnover of a foreign undertaking (i.e. not incorporated in Lithuania) participating in a concentration, where only income received from sales in Lithuanian product markets is taken into account.
EncumbrancesReal estate may be encumbered with servitudes (easements), rights of first refusal, lease rights registered with the Real Estate Register, mortgages, and other encumbrances that limit its use or disposal.
MortgageA mortgage is a security aimed at securing fulfilment of contractual obligations. A mortgage is created by executing a mortgage contract signed by the debtor, the creditor, the owner of the mortgaged real estate, and notarised. A mortgage contract comes into effect at the moment of signing, unless otherwise specified in the mortgage contract.
A secured creditor enjoys priority against third parties to redeem the debt from the mortgaged property. A mortgage survives transfer of title to real estate.
A mortgage can also be executed over a legal entity, i.e. its property (pool of assets), the composition of which may change in the normal course of business of the mortgaged entity.
Property ManagementManagement and maintenance of commercial real estate is usually carried out by the owner or a professional property management company. In the latter case the parties may agree on the scope of owner’s rights and obligations to be delegated to the property management company by concluding a property management agreement.
Aušra MudėnaitėPartner, Co-Head of Real Estate & Construction TeamSORAINEN LithuaniaJogailos Street 4, LT-01116 VilniusPhone +370 52 430 [email protected]
Kęstutis AdamonisPartner, Co-Head of Real Estate & Construction Team SORAINEN LithuaniaJogailos Street 4, LT-01116 VilniusPhone +370 52 649 [email protected]

50Real Estate Market Overview | 2014 | Lithuania | SORAINEN
Lease Agreements
GeneralThe main regulatory framework of lease agreements is laid down in the Lithuanian Civil Code. Parties to lease agreements, however, may freely agree on most lease terms. The lease agreement survives transfer of title to the leased real estate object, provided the lease agreement is registered with the Real Estate Register.
Duration and Expiry of Lease AgreementA lease agreement may be concluded for either an indefinite or fixed term, but in all cases the term may not exceed 100 years. If the term has not been set, the lease agreement is deemed to be concluded for an indefinite term. A fixed-term lease agreement becomes indefinite if the tenant uses leased property for more than ten days after its expiry and the landlord does not object.
Tenants who have properly discharged their obligations under lease agreements enjoy a right of first refusal against third parties to renew the lease.
Lease Payment and Other Expenses (Utilities)Terms and conditions for payment of rent and other expenses are subject to agreement between the parties. Rent is usually paid monthly. It is common to agree on annual indexation of rent on the basis of local or EU harmonised consumer price indices.
Payments for maintenance of leased real estate and other utility costs (e.g. water, heating, gas, electricity) are, as a rule, made on top of rent. The landlord may also require a deposit, guarantee, surety or other similar instrument securing payment obligations of the tenant.
51Real Estate Market Overview | 2014 | Lithuania | SORAINEN
Tax* SummaryRental Income > 15 per cent CIT applies to net income.
> Reduced rate of 5 per cent CIT applies to small companies with:
(i) income less than LTL 1 million (approx. EUR 289,620) in 1 calendar year; and
(ii) less than 10 employees.
> Deductions: all customary expenses incurred in relation to earning rental income. Exception: non-deductible expenses falling into an exhaustive list, e.g. fines, penalties, dividends, gifts.
Thin Capitalisation > Interest and currency exchange losses on debt in excess of a debt/equity ratio of 4:1 are non-deductible for CIT purposes if debt capital is provided by a creditor that:
(i) directly or indirectly holds more than 50 per cent of shares or rights (options) to dividends; or
(ii) together with related parties holds more than 50 per cent of shares or rights (options) to dividends, and the holding of that creditor is not less than 10 per cent.
> Exception: if a taxpayer proves that the same loan could exist between unrelated parties under the same conditions, thin capitalisation does not apply.
> Company Law: the interest rate on shareholders’ loans may not exceed the average bank interest rate current in the location of the lender’s business.
> Financial institutions providing leasing services are not subject to thin capitalisation rules.
Depreciation and Losses
Depreciation > Buildings are depreciated using the straight-line or double-declining method (for certain types of assets).
> Land is not depreciable.
Losses > Tax losses can be carried forward for an unlimited number of years as long as they are set off against income from the same type of activity (exception: losses from disposal of securities can be carried forward for 5 years only and can only be offset against income from sale of securities).
* Abbreviations used: CIT - corporate income taxDTT - double taxation treaty EC - European CommissionEEA - European Economic AreaEU - European UnionFEZ - free economic zonePIT - personal income taxSEZ - special economic zoneVAT - value added tax
> The amount of losses carried forward cannot exceed 70 per cent of an entity’s profits received during a fiscal year. This restriction is not applicable to entities that are entitled to apply the reduced CIT rate of 5 per cent.
> Intra-group transfer of losses allowed.
Withholding Tax
Dividends > From a Lithuanian company to a Lithuanian company - 15 per cent CIT to be withheld by the distributing company unless the participation exemption applies.
> From a Lithuanian company to a foreign company - 15 per cent CIT to be withheld by the distributing company unless the participation exemption applies.
> Participation exemption applies where:
(i) the receiving entity holds at least 10 per cent of the shares granting the same percentage of votes in the paying entity;
(ii) for at least 12 months.
Not applicable to dividends payable to FEZ.
Interest > Paid to foreign taxable entities registered in EEA or DTT country – non-taxable.
> Paid to foreign entities registered in other countries - 10 per cent.
> Exemptions:
(i) interest paid on government securities issued in international markets;
(ii) deposit interest;
(iii) interest on subordinated loans meeting the criteria set by the Bank of Lithuania.
Royalties > Paid to associated EU companies - no withholding tax applies.
> Paid to other foreign companies - 10 per cent.
Income From Sale or Rental of Real Estate Situated in LithuaniaTax is levied on gross rental income and on capital gain from sale of the asset (achieved through a refund procedure).
Capital Gains > Capital gains earned by Lithuanian entities - 15 per cent CIT (capital gains are included in general taxable income).
> Capital gains from sale of shares in entities registered in EEA or DTT countries - exempt from tax if:
(i) at least 25 per cent of the shares in the entity were held;
(ii) for a period of not less than 2 years.

52Real Estate Market Overview | 2014 | Lithuania | SORAINEN
Real Estate Taxes
Land Tax > Payable by owners of private land for land other than forest land, roads of common usage and land owned by embassies.
> Tax base: market value of the land calculated against the results of mass valuation.
> Tax rates: 0.01 per cent - 4 per cent of the value of the real estate. A precise tariff is established by the local municipality annually.
> Payment: before 15 November of the tax year concerned based on a declaration provided by the tax administrator.
Real Estate Tax > Payable by Lithuanian and foreign legal entities for real estate other than land in Lithuania.
> Tax base: market value of the real estate calculated against the results of mass valuation.
> Tax rates: 0.3 per cent - 3 per cent of the value of the real estate. A precise tariff is set by the local municipality annually.
> Payment: before 1 February of the subsequent year. Advance payments are made quarterly where the annual amount of tax exceeds LTL 1,500 (approx. EUR 434).
Land Lease Tax > Payable by legal entities and individuals for state or municipal land leased by legal entities and individuals.
> Tax rate: 0.1 per cent - 4 per cent of the land value. A precise tariff is set by the local municipality for each individual case.
Value Added Tax
Sale of Real Estate > Sale of real estate (land and buildings) is generally VAT - exempt.
> Exceptions:
(i) sale of land for construction;
(ii) sale of land with new buildings; and
(iii) sale of new buildings. Buildings are regarded as new if they started to be used or were critically improved less than 24 months before the sale (uncompleted buildings are also regarded as new buildings).
Lease of Real EstateLease of real estate is generally VAT - exempt except lease of dwelling houses.
Optional TaxationLithuanian VAT payers have the option to tax the sale or lease of real estate if the buyer or lessee is another Lithuanian taxable person registered as a VAT payer or a diplomatic mission, consular office, EU institution, international organisation or office. This option applies for a period of not less than 24 months.
Real Estate Transaction Related Costs
Costs IncurredTypically these include: brokerage fees, real estate valuation fee, bank fees, fees for legal due diligence, notary fees and state duty.
Sharing CostsIt is up to the parties to agree how they will bear the transaction costs. Usually, the buyer pays for state and stamp duties, whilst notary fees are shared equally between the parties.
State and Transfer Stamp Duties
State DutyDuty for registration of transfer of title to real estate is calculated separately for each real estate object transferred or acquired and depends on the average market value of the real estate. Duty varies from LTL 10 (approx. EUR 3) to LTL 5,000 (approx. EUR 1,448) per object.
Stamp DutyNone.
Notary FeesThe notary fee amounts to 0.45 per cent of the real estate transaction value, capped at LTL 20,000 (approx. EUR 5,792) for transactions that involve one real estate object and at LTL 50,000 (approx. EUR 14,481) for transactions involving two or more real estate objects.
Mortgage > A mortgage is a security aimed at securing fulfilment of contractual obligations. A mortgage is created by executing a mortgage contract signed by the debtor, the creditor, the owner of the mortgaged real estate, and notarised. The notary’s fee for certification of mortgage agreement is capped at LTL 500 (approx. EUR 145) and at LTL 1,000 (approx. EUR 290) for perfecting a mortgage over an enterprise (as a pool of assets).
> In addition, costs for services related to notarisation of the mortgage and registration of the transaction with the Mortgage Register would be added (approx. LTL 500, i.e. approx. EUR 145, on average).
Saulė Dagilytė Senior Associate, Head of Tax & Customs Team SORAINEN LithuaniaJogailos Street 4, LT-01116 VilniusPhone +370 52 639 [email protected]

53Real Estate Market Overview | 2014 | Estonia | Colliers International
Time of Challenges and OpportunitiesA year ago, we at Colliers International believed that in 2013 the commercial real estate market in Estonia would be “positively boring”, thus showing stability and modest growth. Looking back at 2013 we see that the market was indeed quite “boring” in the retail and investment sectors but at the same time even too “positive” in the office and industrial segments.In 2013, the office and industrial sectors were two of the most active sectors in the Estonian capital region (Tallinn and Harju County) commercial real estate market in terms of demand, ongoing and planned developments and investment.Positive developments in the Tallinn office sector during the last two years made developers feel more confident about market prospects. The Tallinn office sector continued to surprise market observers with high development activity; in addition to 44,000 sqm of new supply in the second half of the year, 6 new fully or partly speculative development projects were started in 2013 in Tallinn with scheduled delivery in 2014 - 2015.New supply delivered to the warehouse and industrial market reached 76,500 sqm or 10 per cent of current stock, while the volume of new industrial and warehouse premises expected to accrue to the market in 2014 will exceed the level of 2008. Absorption and vacancy rates in both sectors showed improvement throughout the year, while rental growth in the office
segment continued on a steady upward trajectory.Expansion and refurbishment would be key words to describe the retail market experience in 2013. Despite previous announcements and assurances, the Tallinn retail market still did not show substantial growth in terms of construction of new large scale shopping centres while all big retail projects are more likely targeted at 2HY 2016 / 2017.The investment market, one of the major indicators of the health of the real estate market, continued to be active throughout 2013. Total investment volume in 2013 remained more or less at the same level as in 2011 and 2012. Y-o-y 2013 produced a higher number of transactions and therefore a lower average transaction price. Investment activity was shaped by small volume deals (below the EUR 3 million threshold) with only one large transaction valued over EUR 20 million to signal the growing activities of private investor groups.Economic growth as well as private consumption expenditure is expected to show moderate growth in 2014, driven by weaker external demand and calmer, more rational consumer behaviour. Modest economic growth in Estonia may slightly dampen the commercial real estate market in 2014.2014 is likely to be a year of possibilities and challenges. Increased development activity creates wider possibilities for tenants and encourages developers and landlords to be more flexible in their pricing strategies to attract and retain tenants. As a result of increased rent rates the level of additional costs is becoming an increasingly important deciding factor for tenants.The major problem is seen in the fact that the Tallinn area has a small and limited local market. A pickup in the development market traditionally takes place with a substantial lag compared to recovery of demand and thus may not follow further changes in demand and rate of space absorption. There is a threat that saturation point can be exceeded rather quickly.We at Colliers International believe that the following comprehensive market review, prepared by our best experts, will provide useful information and insights to assist in your business decision making in Estonia in 2014.
Sincerely,
Avo Roomussaar
avo RoomussaarPartner | Managing [email protected]
Estonia Market Overview
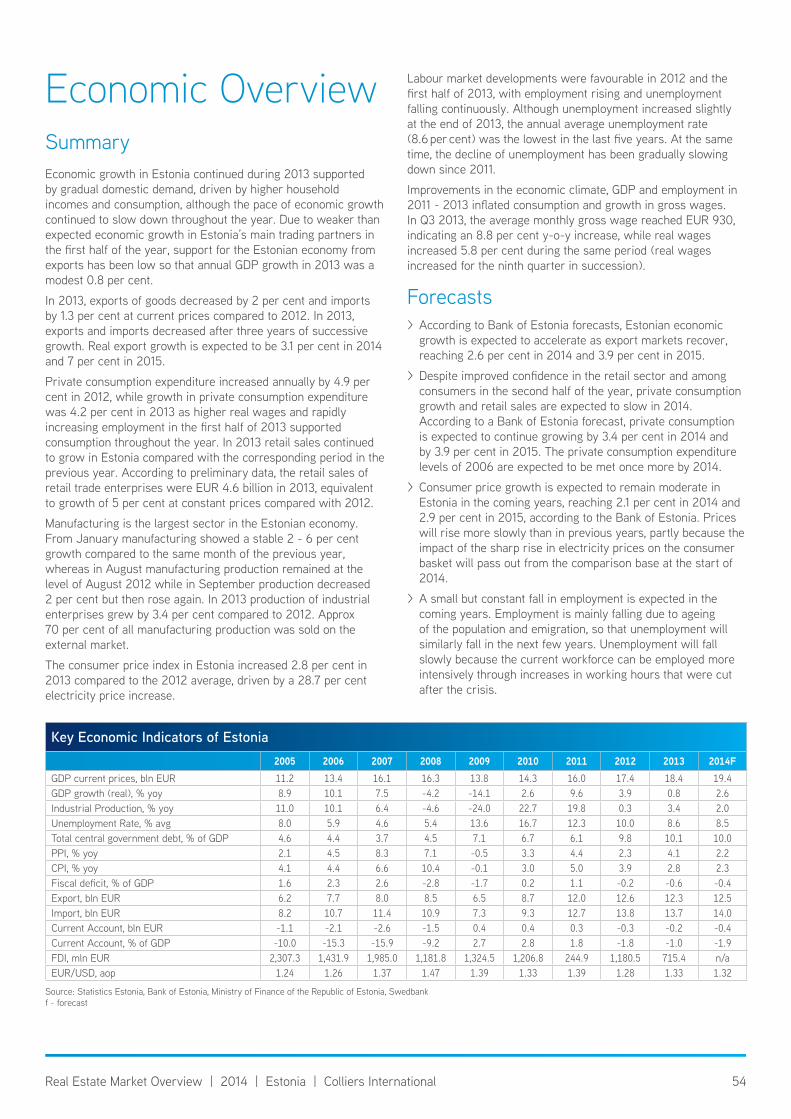
54Real Estate Market Overview | 2014 | Estonia | Colliers International
Economic OverviewSummaryEconomic growth in Estonia continued during 2013 supported by gradual domestic demand, driven by higher household incomes and consumption, although the pace of economic growth continued to slow down throughout the year. Due to weaker than expected economic growth in Estonia’s main trading partners in the first half of the year, support for the Estonian economy from exports has been low so that annual GDP growth in 2013 was a modest 0.8 per cent.
In 2013, exports of goods decreased by 2 per cent and imports by 1.3 per cent at current prices compared to 2012. In 2013, exports and imports decreased after three years of successive growth. Real export growth is expected to be 3.1 per cent in 2014 and 7 per cent in 2015.
Private consumption expenditure increased annually by 4.9 per cent in 2012, while growth in private consumption expenditure was 4.2 per cent in 2013 as higher real wages and rapidly increasing employment in the first half of 2013 supported consumption throughout the year. In 2013 retail sales continued to grow in Estonia compared with the corresponding period in the previous year. According to preliminary data, the retail sales of retail trade enterprises were EUR 4.6 billion in 2013, equivalent to growth of 5 per cent at constant prices compared with 2012.
Manufacturing is the largest sector in the Estonian economy. From January manufacturing showed a stable 2 - 6 per cent growth compared to the same month of the previous year, whereas in August manufacturing production remained at the level of August 2012 while in September production decreased 2 per cent but then rose again. In 2013 production of industrial enterprises grew by 3.4 per cent compared to 2012. Approx 70 per cent of all manufacturing production was sold on the external market.
The consumer price index in Estonia increased 2.8 per cent in 2013 compared to the 2012 average, driven by a 28.7 per cent electricity price increase.
Labour market developments were favourable in 2012 and the first half of 2013, with employment rising and unemployment falling continuously. Although unemployment increased slightly at the end of 2013, the annual average unemployment rate (8.6 per cent) was the lowest in the last five years. At the same time, the decline of unemployment has been gradually slowing down since 2011.
Improvements in the economic climate, GDP and employment in 2011 - 2013 inflated consumption and growth in gross wages. In Q3 2013, the average monthly gross wage reached EUR 930, indicating an 8.8 per cent y-o-y increase, while real wages increased 5.8 per cent during the same period (real wages increased for the ninth quarter in succession).
Forecasts > According to Bank of Estonia forecasts, Estonian economic growth is expected to accelerate as export markets recover, reaching 2.6 per cent in 2014 and 3.9 per cent in 2015.
> Despite improved confidence in the retail sector and among consumers in the second half of the year, private consumption growth and retail sales are expected to slow in 2014. According to a Bank of Estonia forecast, private consumption is expected to continue growing by 3.4 per cent in 2014 and by 3.9 per cent in 2015. The private consumption expenditure levels of 2006 are expected to be met once more by 2014.
> Consumer price growth is expected to remain moderate in Estonia in the coming years, reaching 2.1 per cent in 2014 and 2.9 per cent in 2015, according to the Bank of Estonia. Prices will rise more slowly than in previous years, partly because the impact of the sharp rise in electricity prices on the consumer basket will pass out from the comparison base at the start of 2014.
> A small but constant fall in employment is expected in the coming years. Employment is mainly falling due to ageing of the population and emigration, so that unemployment will similarly fall in the next few years. Unemployment will fall slowly because the current workforce can be employed more intensively through increases in working hours that were cut after the crisis.
key economic indicators of estonia2005 2006 2007 2008 2009 2010 2011 2012 2013 2014F
GDP current prices, bln EUR 11.2 13.4 16.1 16.3 13.8 14.3 16.0 17.4 18.4 19.4GDP growth (real), % yoy 8.9 10.1 7.5 -4.2 -14.1 2.6 9.6 3.9 0.8 2.6Industrial Production, % yoy 11.0 10.1 6.4 -4.6 -24.0 22.7 19.8 0.3 3.4 2.0Unemployment Rate, % avg 8.0 5.9 4.6 5.4 13.6 16.7 12.3 10.0 8.6 8.5Total central government debt, % of GDP 4.6 4.4 3.7 4.5 7.1 6.7 6.1 9.8 10.1 10.0PPI, % yoy 2.1 4.5 8.3 7.1 -0.5 3.3 4.4 2.3 4.1 2.2CPI, % yoy 4.1 4.4 6.6 10.4 -0.1 3.0 5.0 3.9 2.8 2.3Fiscal deficit, % of GDP 1.6 2.3 2.6 -2.8 -1.7 0.2 1.1 -0.2 -0.6 -0.4Export, bln EUR 6.2 7.7 8.0 8.5 6.5 8.7 12.0 12.6 12.3 12.5Import, bln EUR 8.2 10.7 11.4 10.9 7.3 9.3 12.7 13.8 13.7 14.0Current Account, bln EUR -1.1 -2.1 -2.6 -1.5 0.4 0.4 0.3 -0.3 -0.2 -0.4Current Account, % of GDP -10.0 -15.3 -15.9 -9.2 2.7 2.8 1.8 -1.8 -1.0 -1.9FDI, mln EUR 2,307.3 1,431.9 1,985.0 1,181.8 1,324.5 1,206.8 244.9 1,180.5 715.4 n/aEUR/USD, aop 1.24 1.26 1.37 1.47 1.39 1.33 1.39 1.28 1.33 1.32
Source: Statistics Estonia, Bank of Estonia, Ministry of Finance of the Republic of Estonia, Swedbankf - forecast
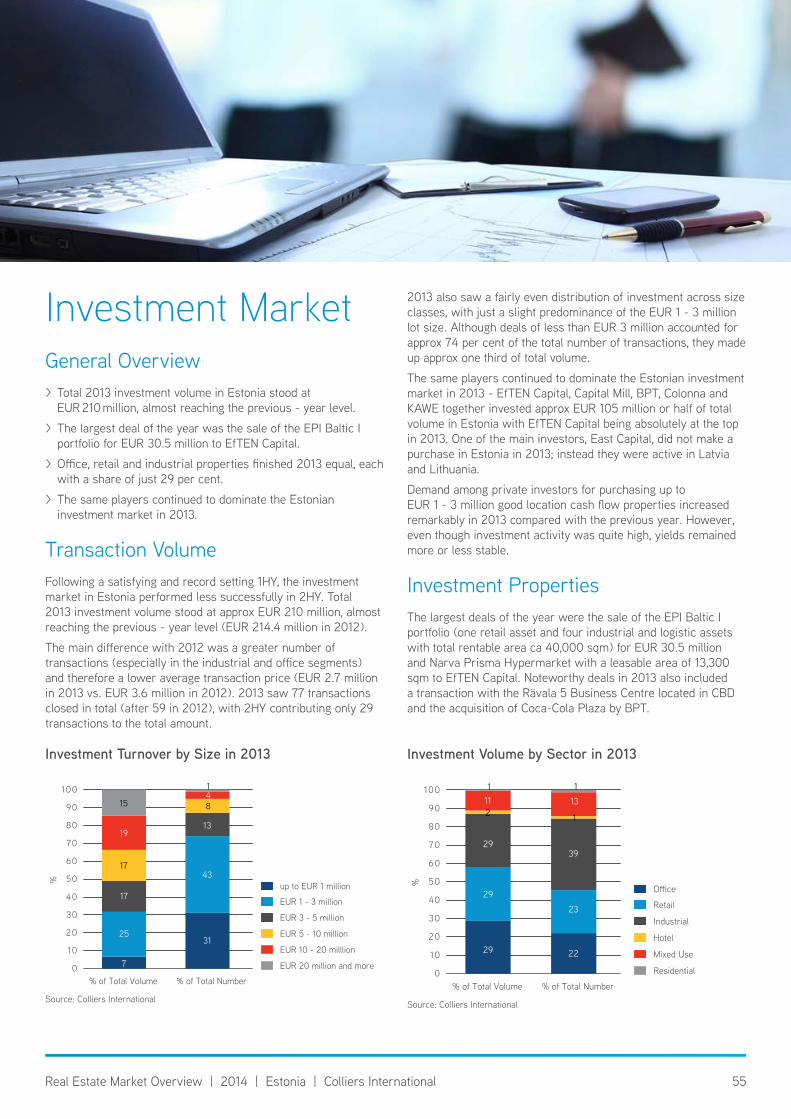
55Real Estate Market Overview | 2014 | Estonia | Colliers International
Investment MarketGeneral Overview > Total 2013 investment volume in Estonia stood at EUR 210 million, almost reaching the previous - year level.
> The largest deal of the year was the sale of the EPI Baltic I portfolio for EUR 30.5 million to EfTEN Capital.
> Office, retail and industrial properties finished 2013 equal, each with a share of just 29 per cent.
> The same players continued to dominate the Estonian investment market in 2013.
Transaction VolumeFollowing a satisfying and record setting 1HY, the investment market in Estonia performed less successfully in 2HY. Total 2013 investment volume stood at approx EUR 210 million, almost reaching the previous - year level (EUR 214.4 million in 2012).
The main difference with 2012 was a greater number of transactions (especially in the industrial and office segments) and therefore a lower average transaction price (EUR 2.7 million in 2013 vs. EUR 3.6 million in 2012). 2013 saw 77 transactions closed in total (after 59 in 2012), with 2HY contributing only 29 transactions to the total amount.
2013 also saw a fairly even distribution of investment across size classes, with just a slight predominance of the EUR 1 - 3 million lot size. Although deals of less than EUR 3 million accounted for approx 74 per cent of the total number of transactions, they made up approx one third of total volume.
The same players continued to dominate the Estonian investment market in 2013 - EfTEN Capital, Capital Mill, BPT, Colonna and KAWE together invested approx EUR 105 million or half of total volume in Estonia with EfTEN Capital being absolutely at the top in 2013. One of the main investors, East Capital, did not make a purchase in Estonia in 2013; instead they were active in Latvia and Lithuania.
Demand among private investors for purchasing up to EUR 1 - 3 million good location cash flow properties increased remarkably in 2013 compared with the previous year. However, even though investment activity was quite high, yields remained more or less stable.
Investment PropertiesThe largest deals of the year were the sale of the EPI Baltic I portfolio (one retail asset and four industrial and logistic assets with total rentable area ca 40,000 sqm) for EUR 30.5 million and Narva Prisma Hypermarket with a leasable area of 13,300 sqm to EfTEN Capital. Noteworthy deals in 2013 also included a transaction with the Rävala 5 Business Centre located in CBD and the acquisition of Coca-Cola Plaza by BPT.
investment turnover by size in 2013
17
17
25
7
19
15 8
13
43
31
41
% of Total Volume % of Total Number
up to EUR 1 million
EUR 1 - 3 million
EUR 3 - 5 million
EUR 5 - 10 million
EUR 10 - 20 milllion
EUR 20 million and more
%
100
90
80
70
60
50
40
30
20
10
0
Source: Colliers International
investment volume by sector in 2013
2
29
29
29
111
1
39
23
22
131
% of Total Volume % of Total Number
Office
Retail
Industrial
Hotel
Mixed Use
Residential
%
100
90
80
70
60
50
40
30
20
10
0
Source: Colliers International

56Real Estate Market Overview | 2014 | Estonia | Colliers International
Office, retail and industrial properties finished 2013 equal, each with a share of just 29 per cent. So unlike 2012, when retail attracted the biggest share of investment (47 per cent), in 2013 all asset classes were in the focus of interest.
At EUR 60 million, investment in office property accounted for approx one third of transaction volume in Estonia in 2013, up from 18 per cent in 2012. The most notable deals of 2013 in the office sector were the sale of Rävala 5 Business Centre and the headquarters properties of Eesti Energia and If P&C Insurance. The office segment also remained active in Estonia at the end of the year, thus accounting for 45 per cent of total investment volume in Q4 2013. Investment activity at the end of the year was led by the sale of the Journalist House Office Building to Colonna Capital, the sale of the Lõkke 4 office building by EfTEN Capital and the acquisition of the ISKU office building by KAWE Group.
Similarly to the office segment, investment in industrial / warehouse property accounted for approx one third of transaction volume in Estonia in 2013, up from 17.4 per cent in 2012. Interest in warehouse / logistics properties in 2013 was driven largely by stable retail sales growth figures across the region during the last two years (above the EU average), resulting in growing activity by 3PL companies, and the desire of institutional investors to diversify their portfolios.
Forecasts > In 2014 the investment market will continue to be active as most investors have capital available. Total investment volume in 2014 is expected to be somewhat lower compared to 2013.
> Colliers foresees transaction volume in 2014 reaching the EUR 160 million level, although total investment volume will depend on private investors and the number of small lot size deals.
> According to a recent Colliers’ survey, investors are well capitalized and are constantly looking for good quality cash flow properties. Willingness to take increased risks can be observed among some investors due to the scarcity of investment grade products.
> Sector - wise, the office and retail sectors will still remain the most favoured by investors, international and local alike. Investment activity in the industrial real estate segment will largely depend on other alternatives for investors (i.e. the office and retail sectors).
> Prime yields are expected to remain stable in 2014.
> Overall, Colliers expects to see moderately active upcoming years (2014 - 2015) with rental flows growing slightly. Capital value growth will be more likely as a result of improving net operating income.
Prime Yield Dynamics, 2005 - 2013
%
16
14
12
10
8
6
4
2
0
Office Retail Industrial
20
05
20
06
20
07
20
08
20
09
20
10 1
H
20
10 2
H
20
11 1
H
20
11 2
H
20
12 1
H
20
12 2
H
20
13 1
H
20
13 2
H
Source: Colliers International
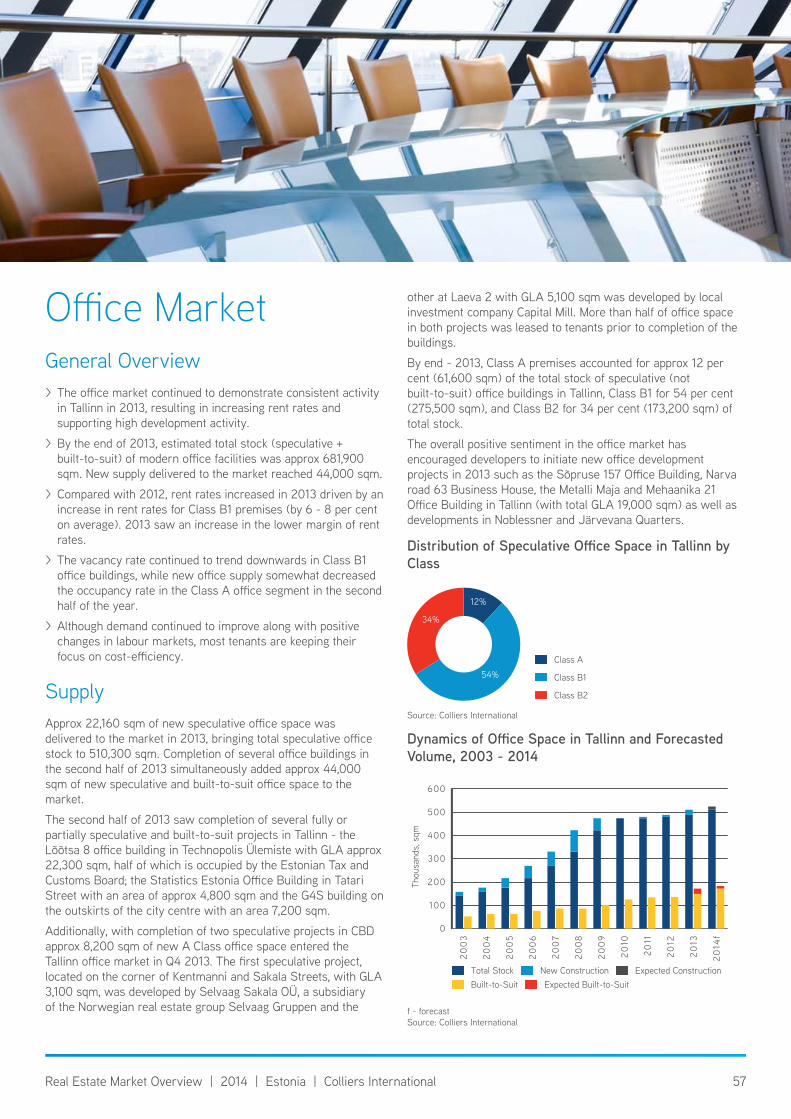
57Real Estate Market Overview | 2014 | Estonia | Colliers International
Office MarketGeneral Overview > The office market continued to demonstrate consistent activity in Tallinn in 2013, resulting in increasing rent rates and supporting high development activity.
> By the end of 2013, estimated total stock (speculative + built-to-suit) of modern office facilities was approx 681,900 sqm. New supply delivered to the market reached 44,000 sqm.
> Compared with 2012, rent rates increased in 2013 driven by an increase in rent rates for Class B1 premises (by 6 - 8 per cent on average). 2013 saw an increase in the lower margin of rent rates.
> The vacancy rate continued to trend downwards in Class B1 office buildings, while new office supply somewhat decreased the occupancy rate in the Class A office segment in the second half of the year.
> Although demand continued to improve along with positive changes in labour markets, most tenants are keeping their focus on cost-efficiency.
SupplyApprox 22,160 sqm of new speculative office space was delivered to the market in 2013, bringing total speculative office stock to 510,300 sqm. Completion of several office buildings in the second half of 2013 simultaneously added approx 44,000 sqm of new speculative and built-to-suit office space to the market.
The second half of 2013 saw completion of several fully or partially speculative and built-to-suit projects in Tallinn - the Lõõtsa 8 office building in Technopolis Ülemiste with GLA approx 22,300 sqm, half of which is occupied by the Estonian Tax and Customs Board; the Statistics Estonia Office Building in Tatari Street with an area of approx 4,800 sqm and the G4S building on the outskirts of the city centre with an area 7,200 sqm.
Additionally, with completion of two speculative projects in CBD approx 8,200 sqm of new A Class office space entered the Tallinn office market in Q4 2013. The first speculative project, located on the corner of Kentmanni and Sakala Streets, with GLA 3,100 sqm, was developed by Selvaag Sakala OÜ, a subsidiary of the Norwegian real estate group Selvaag Gruppen and the
other at Laeva 2 with GLA 5,100 sqm was developed by local investment company Capital Mill. More than half of office space in both projects was leased to tenants prior to completion of the buildings.
By end - 2013, Class A premises accounted for approx 12 per cent (61,600 sqm) of the total stock of speculative (not built-to-suit) office buildings in Tallinn, Class B1 for 54 per cent (275,500 sqm), and Class B2 for 34 per cent (173,200 sqm) of total stock.
The overall positive sentiment in the office market has encouraged developers to initiate new office development projects in 2013 such as the Sõpruse 157 Office Building, Narva road 63 Business House, the Metalli Maja and Mehaanika 21 Office Building in Tallinn (with total GLA 19,000 sqm) as well as developments in Noblessner and Järvevana Quarters.
f - forecastSource: Colliers International
Dynamics of Office Space in Tallinn and Forecasted volume, 2003 - 2014
Thou
sand
s, s
qm
600
500
400
300
200
100
0
20
03
20
04
20
05
20
06
20
07
20
08
20
09
20
10
20
11
20
12
20
13
20
14f
Total Stock New Construction Expected ConstructionBuilt-to-Suit Expected Built-to-Suit
Distribution of Speculative Office Space in Tallinn by Class
54%
34%
12%
Class A
Class B1
Class B2
Source: Colliers International
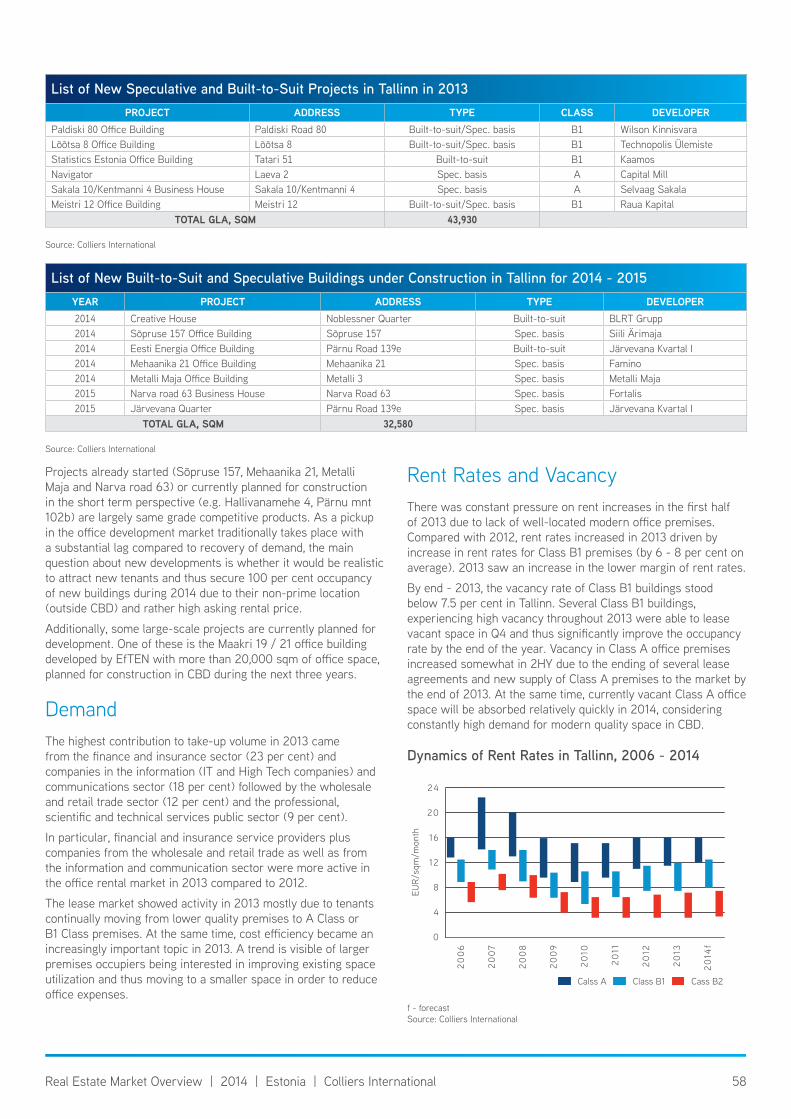
58Real Estate Market Overview | 2014 | Estonia | Colliers International
Projects already started (Sõpruse 157, Mehaanika 21, Metalli Maja and Narva road 63) or currently planned for construction in the short term perspective (e.g. Hallivanamehe 4, Pärnu mnt 102b) are largely same grade competitive products. As a pickup in the office development market traditionally takes place with a substantial lag compared to recovery of demand, the main question about new developments is whether it would be realistic to attract new tenants and thus secure 100 per cent occupancy of new buildings during 2014 due to their non-prime location (outside CBD) and rather high asking rental price.
Additionally, some large-scale projects are currently planned for development. One of these is the Maakri 19 / 21 office building developed by EfTEN with more than 20,000 sqm of office space, planned for construction in CBD during the next three years.
DemandThe highest contribution to take-up volume in 2013 came from the finance and insurance sector (23 per cent) and companies in the information (IT and High Tech companies) and communications sector (18 per cent) followed by the wholesale and retail trade sector (12 per cent) and the professional, scientific and technical services public sector (9 per cent).
In particular, financial and insurance service providers plus companies from the wholesale and retail trade as well as from the information and communication sector were more active in the office rental market in 2013 compared to 2012.
The lease market showed activity in 2013 mostly due to tenants continually moving from lower quality premises to A Class or B1 Class premises. At the same time, cost efficiency became an increasingly important topic in 2013. A trend is visible of larger premises occupiers being interested in improving existing space utilization and thus moving to a smaller space in order to reduce office expenses.
Rent Rates and VacancyThere was constant pressure on rent increases in the first half of 2013 due to lack of well-located modern office premises. Compared with 2012, rent rates increased in 2013 driven by increase in rent rates for Class B1 premises (by 6 - 8 per cent on average). 2013 saw an increase in the lower margin of rent rates.
By end - 2013, the vacancy rate of Class B1 buildings stood below 7.5 per cent in Tallinn. Several Class B1 buildings, experiencing high vacancy throughout 2013 were able to lease vacant space in Q4 and thus significantly improve the occupancy rate by the end of the year. Vacancy in Class A office premises increased somewhat in 2HY due to the ending of several lease agreements and new supply of Class A premises to the market by the end of 2013. At the same time, currently vacant Class A office space will be absorbed relatively quickly in 2014, considering constantly high demand for modern quality space in CBD.
Dynamics of Rent Rates in tallinn, 2006 - 2014
Calss A Class B1 Cass B2
EUR/
sqm
/mon
th
20
06
20
07
20
08
20
09
20
10
20
11
20
12
20
13
20
14f
24
20
16
12
8
4
0
f - forecastSource: Colliers International
List of new speculative and Built-to-suit Projects in tallinn in 2013PRoJect aDDRess tyPe class DeVeloPeR
Paldiski 80 Office Building Paldiski Road 80 Built-to-suit/Spec. basis B1 Wilson KinnisvaraLõõtsa 8 Office Building Lõõtsa 8 Built-to-suit/Spec. basis B1 Technopolis ÜlemisteStatistics Estonia Office Building Tatari 51 Built-to-suit B1 KaamosNavigator Laeva 2 Spec. basis A Capital MillSakala 10/Kentmanni 4 Business House Sakala 10/Kentmanni 4 Spec. basis A Selvaag SakalaMeistri 12 Office Building Meistri 12 Built-to-suit/Spec. basis B1 Raua Kapital
total Gla, sQm 43,930
Source: Colliers International
List of new Built-to-suit and speculative Buildings under Construction in tallinn for 2014 - 2015yeaR PRoJect aDDRess tyPe DeVeloPeR2014 Creative House Noblessner Quarter Built-to-suit BLRT Grupp2014 Sõpruse 157 Office Building Sõpruse 157 Spec. basis Siili Ärimaja2014 Eesti Energia Office Building Pärnu Road 139e Built-to-suit Järvevana Kvartal I2014 Mehaanika 21 Office Building Mehaanika 21 Spec. basis Famino2014 Metalli Maja Office Building Metalli 3 Spec. basis Metalli Maja2015 Narva road 63 Business House Narva Road 63 Spec. basis Fortalis2015 Järvevana Quarter Pärnu Road 139e Spec. basis Järvevana Kvartal I
total Gla, sQm 32,580
Source: Colliers International
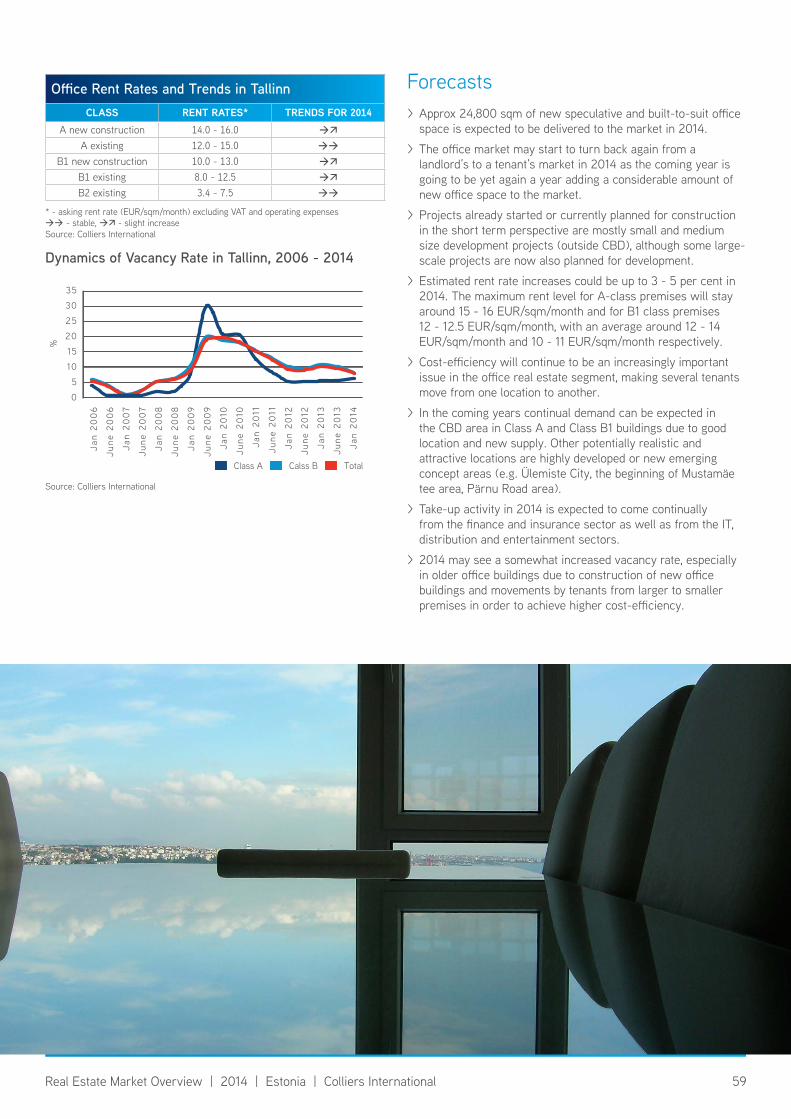
59Real Estate Market Overview | 2014 | Estonia | Colliers International
Forecasts > Approx 24,800 sqm of new speculative and built-to-suit office space is expected to be delivered to the market in 2014.
> The office market may start to turn back again from a landlord’s to a tenant’s market in 2014 as the coming year is going to be yet again a year adding a considerable amount of new office space to the market.
> Projects already started or currently planned for construction in the short term perspective are mostly small and medium size development projects (outside CBD), although some large-scale projects are now also planned for development.
> Estimated rent rate increases could be up to 3 - 5 per cent in 2014. The maximum rent level for A-class premises will stay around 15 - 16 EUR/sqm/month and for B1 class premises 12 - 12.5 EUR/sqm/month, with an average around 12 - 14 EUR/sqm/month and 10 - 11 EUR/sqm/month respectively.
> Cost-efficiency will continue to be an increasingly important issue in the office real estate segment, making several tenants move from one location to another.
> In the coming years continual demand can be expected in the CBD area in Class A and Class B1 buildings due to good location and new supply. Other potentially realistic and attractive locations are highly developed or new emerging concept areas (e.g. Ülemiste City, the beginning of Mustamäe tee area, Pärnu Road area).
> Take-up activity in 2014 is expected to come continually from the finance and insurance sector as well as from the IT, distribution and entertainment sectors.
> 2014 may see a somewhat increased vacancy rate, especially in older office buildings due to construction of new office buildings and movements by tenants from larger to smaller premises in order to achieve higher cost-efficiency.
Office Rent Rates and Trends in Tallinnclass Rent Rates* Trends For 2014
A new construction 14.0 - 16.0
A existing 12.0 - 15.0
B1 new construction 10.0 - 13.0
B1 existing 8.0 - 12.5
B2 existing 3.4 - 7.5
* - asking rent rate (EUR/sqm/month) excluding VAT and operating expenses - stable, - slight increaseSource: Colliers International
Dynamics of vacancy Rate in tallinn, 2006 - 2014
%
35
30
25
20
15
10
5
0
Class A Calss B Total
Jan
20
06
June
20
06
Jan
20
07
June
20
07
Jan
20
08
June
20
08
Jan
20
09
June
20
09
Jan
20
10
June
20
10
Jan
20
11
June
20
11
Jan
20
12
June
20
12
Jan
20
13
June
20
13
Jan
20
14
Source: Colliers International
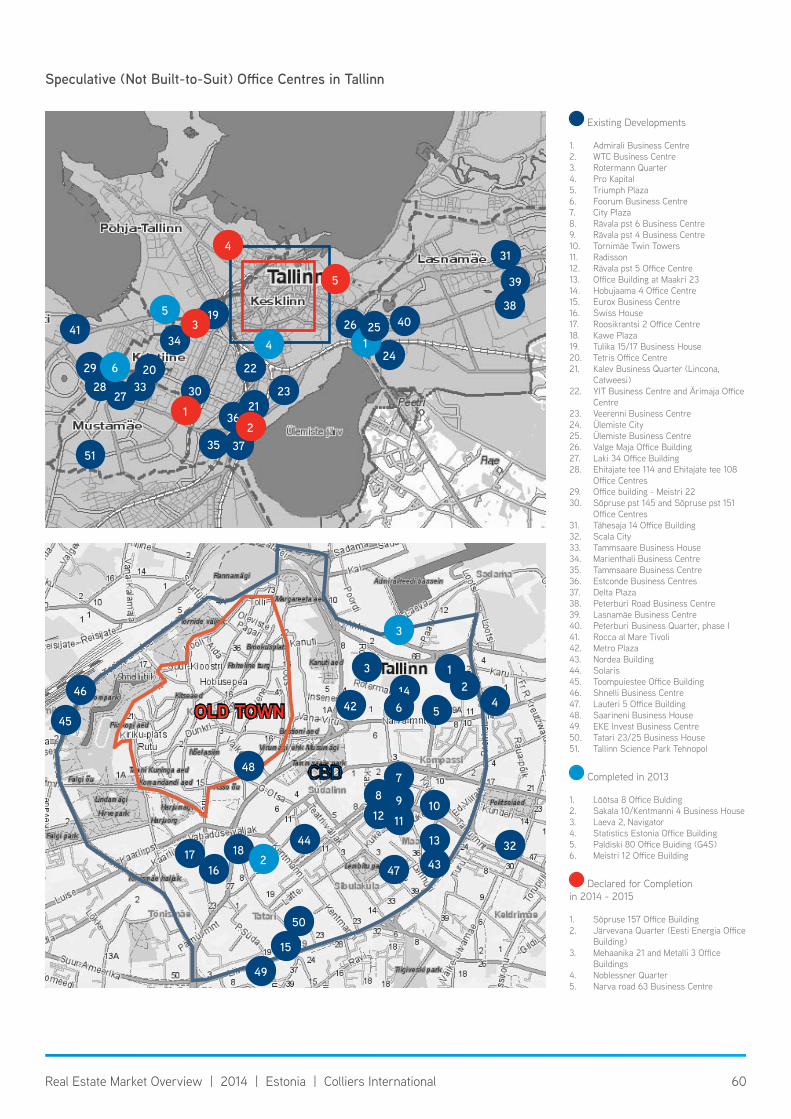
60Real Estate Market Overview | 2014 | Estonia | Colliers International
Speculative (Not Built-to-Suit) Office Centres in Tallinn
33
41
29
2321
51
22
3027
34
37
28
19
31
39
3840
24
26
6
5
4 1
35
362
3
4
1
5
olD toWn
CBD
Existing Developments
1. Admirali Business Centre2. WTC Business Centre3. Rotermann Quarter4. Pro Kapital5. Triumph Plaza6. Foorum Business Centre7. City Plaza8. Rävala pst 6 Business Centre9. Rävala pst 4 Business Centre 10. Tornimäe Twin Towers11. Radisson12. Rävala pst 5 Office Centre13. Office Building at Maakri 2314. Hobujaama 4 Office Centre15. Eurox Business Centre16. Swiss House17. Roosikrantsi 2 Office Centre18. Kawe Plaza19. Tulika 15/17 Business House20. Tetris Office Centre21. Kalev Business Quarter (Lincona,
Catweesi)22. YIT Business Centre and Ärimaja Office
Centre 23. Veerenni Business Centre24. Ülemiste City 25. Ülemiste Business Centre26. Valge Maja Office Building27. Laki 34 Office Building28. Ehitajate tee 114 and Ehitajate tee 108
Office Centres29. Office building - Meistri 22 30. Sõpruse pst 145 and Sõpruse pst 151
Office Centres31. Tähesaja 14 Office Building 32. Scala City33. Tammsaare Business House 34. Marienthali Business Centre35. Tammsaare Business Centre36. Estconde Business Centres37. Delta Plaza38. Peterburi Road Business Centre39. Lasnamäe Business Centre40. Peterburi Business Quarter, phase I41. Rocca al Mare Tivoli 42. Metro Plaza43. Nordea Building44. Solaris45. Toompuiestee Office Building46. Shnelli Business Centre47. Lauteri 5 Office Building48. Saarineni Business House49. EKE Invest Business Centre50. Tatari 23/25 Business House51. Tallinn Science Park Tehnopol
Completed in 2013
1. Lõõtsa 8 Office Bulding2. Sakala 10/Kentmanni 4 Business House3. Laeva 2, Navigator4. Statistics Estonia Office Building 5. Paldiski 80 Office Buiding (G4S)6. Meistri 12 Office Building
Declared for Completion in 2014 - 2015
1. Sõpruse 157 Office Building2. Järvevana Quarter (Eesti Energia Office
Building)3. Mehaanika 21 and Metalli 3 Office
Buildings4. Noblessner Quarter5. Narva road 63 Business Centre
20
25
3
1442
3
45
16
44
15
43
10
7
11
9
47
32
12
8
50
46
48
17
49
1318
6 5
12
4
2
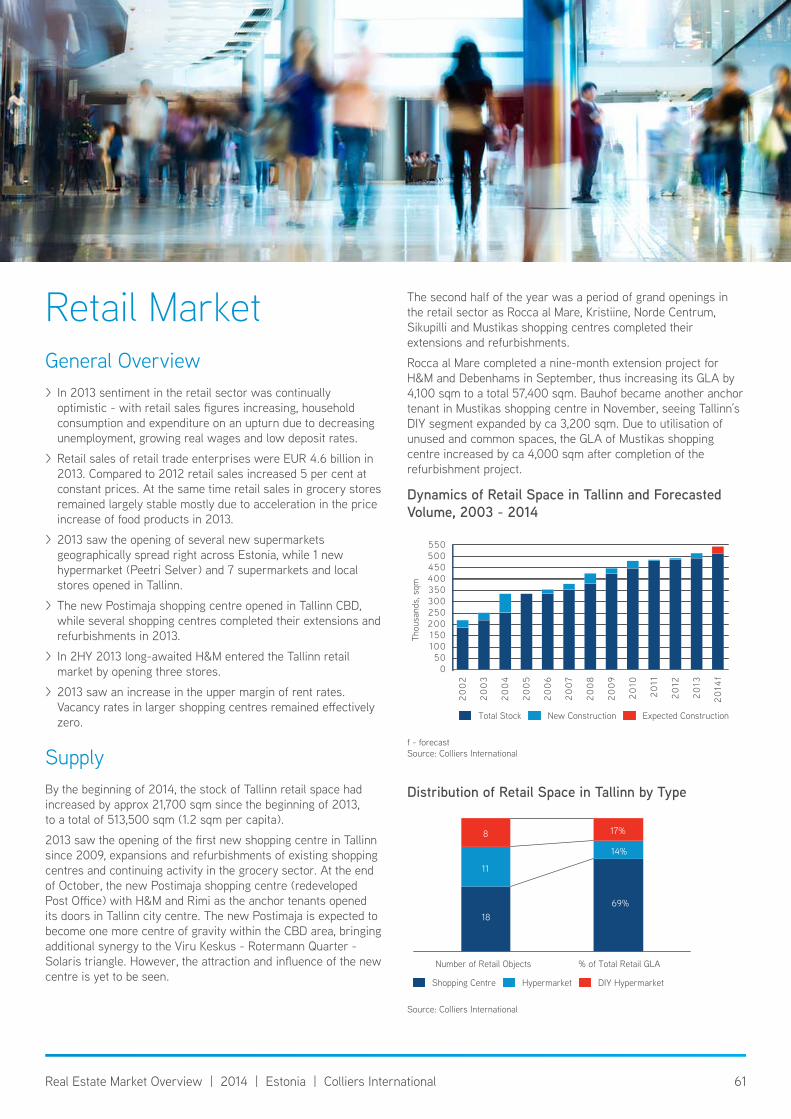
61Real Estate Market Overview | 2014 | Estonia | Colliers International
Retail MarketGeneral Overview > In 2013 sentiment in the retail sector was continually optimistic - with retail sales figures increasing, household consumption and expenditure on an upturn due to decreasing unemployment, growing real wages and low deposit rates.
> Retail sales of retail trade enterprises were EUR 4.6 billion in 2013. Compared to 2012 retail sales increased 5 per cent at constant prices. At the same time retail sales in grocery stores remained largely stable mostly due to acceleration in the price increase of food products in 2013.
> 2013 saw the opening of several new supermarkets geographically spread right across Estonia, while 1 new hypermarket (Peetri Selver) and 7 supermarkets and local stores opened in Tallinn.
> The new Postimaja shopping centre opened in Tallinn CBD, while several shopping centres completed their extensions and refurbishments in 2013.
> In 2HY 2013 long-awaited H&M entered the Tallinn retail market by opening three stores.
> 2013 saw an increase in the upper margin of rent rates. Vacancy rates in larger shopping centres remained effectively zero.
SupplyBy the beginning of 2014, the stock of Tallinn retail space had increased by approx 21,700 sqm since the beginning of 2013, to a total of 513,500 sqm (1.2 sqm per capita).
2013 saw the opening of the first new shopping centre in Tallinn since 2009, expansions and refurbishments of existing shopping centres and continuing activity in the grocery sector. At the end of October, the new Postimaja shopping centre (redeveloped Post Office) with H&M and Rimi as the anchor tenants opened its doors in Tallinn city centre. The new Postimaja is expected to become one more centre of gravity within the CBD area, bringing additional synergy to the Viru Keskus - Rotermann Quarter - Solaris triangle. However, the attraction and influence of the new centre is yet to be seen.
The second half of the year was a period of grand openings in the retail sector as Rocca al Mare, Kristiine, Norde Centrum, Sikupilli and Mustikas shopping centres completed their extensions and refurbishments.
Rocca al Mare completed a nine-month extension project for H&M and Debenhams in September, thus increasing its GLA by 4,100 sqm to a total 57,400 sqm. Bauhof became another anchor tenant in Mustikas shopping centre in November, seeing Tallinn’s DIY segment expanded by ca 3,200 sqm. Due to utilisation of unused and common spaces, the GLA of Mustikas shopping centre increased by ca 4,000 sqm after completion of the refurbishment project.
f - forecastSource: Colliers International
Dynamics of Retail space in tallinn and Forecasted volume, 2003 - 2014
20
02
20
03
20
04
20
05
20
06
20
07
20
08
20
09
20
10
20
11
20
12
20
13
20
14f
Total Stock New Construction Expected Construction
55050045040035030025020015010050
0
Thou
sand
s, s
qm
Distribution of Retail space in tallinn by type
Shopping Centre Hypermarket DIY Hypermarket
18
11
8
69%
14%
17%
Number of Retail Objects % of Total Retail GLA
Source: Colliers International
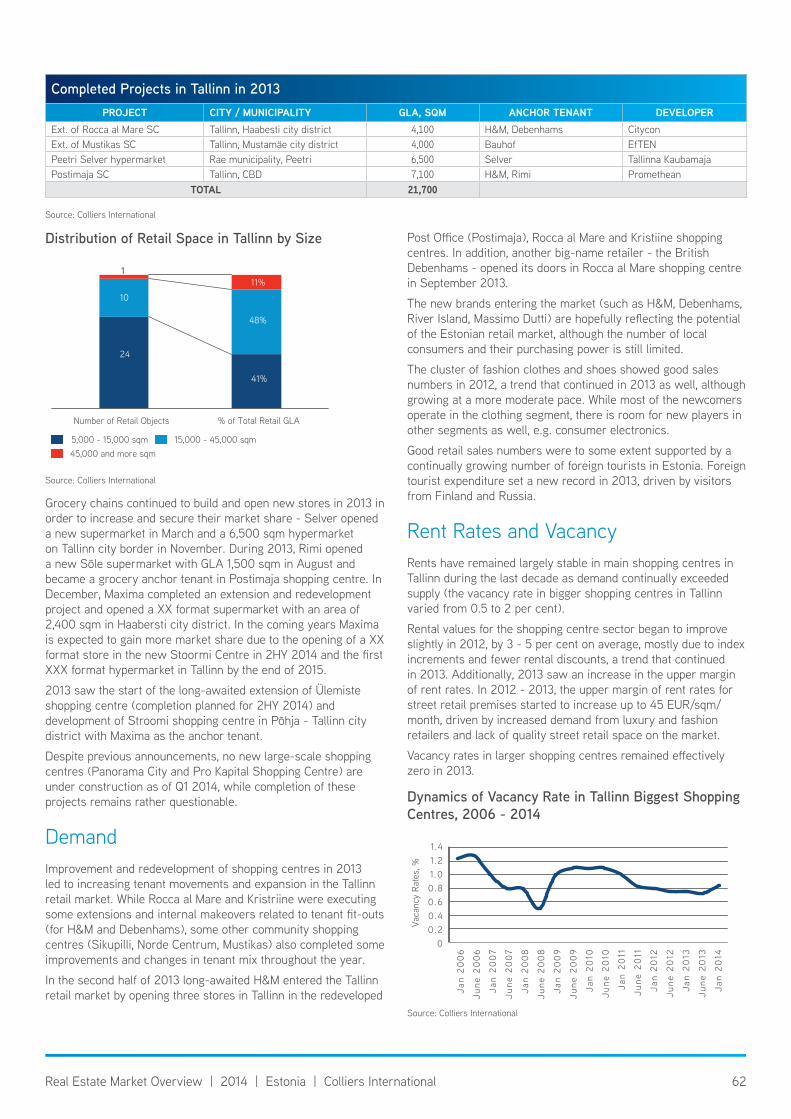
62Real Estate Market Overview | 2014 | Estonia | Colliers International
Grocery chains continued to build and open new stores in 2013 in order to increase and secure their market share - Selver opened a new supermarket in March and a 6,500 sqm hypermarket on Tallinn city border in November. During 2013, Rimi opened a new Sõle supermarket with GLA 1,500 sqm in August and became a grocery anchor tenant in Postimaja shopping centre. In December, Maxima completed an extension and redevelopment project and opened a XX format supermarket with an area of 2,400 sqm in Haabersti city district. In the coming years Maxima is expected to gain more market share due to the opening of a XX format store in the new Stoormi Centre in 2HY 2014 and the first XXX format hypermarket in Tallinn by the end of 2015.
2013 saw the start of the long-awaited extension of Ülemiste shopping centre (completion planned for 2HY 2014) and development of Stroomi shopping centre in Põhja - Tallinn city district with Maxima as the anchor tenant.
Despite previous announcements, no new large-scale shopping centres (Panorama City and Pro Kapital Shopping Centre) are under construction as of Q1 2014, while completion of these projects remains rather questionable.
DemandImprovement and redevelopment of shopping centres in 2013 led to increasing tenant movements and expansion in the Tallinn retail market. While Rocca al Mare and Kristriine were executing some extensions and internal makeovers related to tenant fit-outs (for H&M and Debenhams), some other community shopping centres (Sikupilli, Norde Centrum, Mustikas) also completed some improvements and changes in tenant mix throughout the year.
In the second half of 2013 long-awaited H&M entered the Tallinn retail market by opening three stores in Tallinn in the redeveloped
Post Office (Postimaja), Rocca al Mare and Kristiine shopping centres. In addition, another big-name retailer - the British Debenhams - opened its doors in Rocca al Mare shopping centre in September 2013.
The new brands entering the market (such as H&M, Debenhams, River Island, Massimo Dutti) are hopefully reflecting the potential of the Estonian retail market, although the number of local consumers and their purchasing power is still limited.
The cluster of fashion clothes and shoes showed good sales numbers in 2012, a trend that continued in 2013 as well, although growing at a more moderate pace. While most of the newcomers operate in the clothing segment, there is room for new players in other segments as well, e.g. consumer electronics.
Good retail sales numbers were to some extent supported by a continually growing number of foreign tourists in Estonia. Foreign tourist expenditure set a new record in 2013, driven by visitors from Finland and Russia.
Rent Rates and VacancyRents have remained largely stable in main shopping centres in Tallinn during the last decade as demand continually exceeded supply (the vacancy rate in bigger shopping centres in Tallinn varied from 0.5 to 2 per cent).
Rental values for the shopping centre sector began to improve slightly in 2012, by 3 - 5 per cent on average, mostly due to index increments and fewer rental discounts, a trend that continued in 2013. Additionally, 2013 saw an increase in the upper margin of rent rates. In 2012 - 2013, the upper margin of rent rates for street retail premises started to increase up to 45 EUR/sqm/month, driven by increased demand from luxury and fashion retailers and lack of quality street retail space on the market.
Vacancy rates in larger shopping centres remained effectively zero in 2013.
Distribution of Retail space in tallinn by size
5,000 - 15,000 sqm 15,000 - 45,000 sqm45,000 and more sqm
24
10
1
41%
48%
11%
Number of Retail Objects % of Total Retail GLA
Source: Colliers International
Completed Projects in tallinn in 2013PRoJect cIty / munIcIPalIty Gla, sQm ancHoR tenant DeVeloPeR
Ext. of Rocca al Mare SC Tallinn, Haabesti city district 4,100 H&M, Debenhams CityconExt. of Mustikas SC Tallinn, Mustamäe city district 4,000 Bauhof EfTENPeetri Selver hypermarket Rae municipality, Peetri 6,500 Selver Tallinna KaubamajaPostimaja SC Tallinn, CBD 7,100 H&M, Rimi Promethean
total 21,700
Source: Colliers International
Dynamics of vacancy Rate in tallinn Biggest shopping Centres, 2006 - 2014
Vaca
ncy
Rate
s, %
1.41.21.00.80.60.40.2
0
Jan
20
06
June
20
06
Jan
20
07
June
20
07
Jan
20
08
June
20
08
Jan
20
09
June
20
09
Jan
20
10
June
20
10
Jan
20
11
June
20
11
Jan
20
12
June
20
12
Jan
20
13
June
20
13
Jan
20
14
Source: Colliers International

63Real Estate Market Overview | 2014 | Estonia | Colliers International
Forecasts > Despite improved confidence in the retail sector and among consumers in the second half of the year, private consumption growth and retail sales are expected to slow in 2014. According to a Bank of Estonia forecast, private consumption is expected to continue growing by 3.4 per cent in 2014 and by 3.9 per cent in 2015.
> Further steady growth in consumption indicates that by 2014 the turnover of regional shopping centres will reach boom-period levels of 2008.
> Several grocery retailers (e.g. Maxima, RIMI, Selver) continue to seek possibilities for further expansion and opening of new stores during the next two years in Tallinn and its suburbs.
> 2HY 2014 will see completion of Ülemiste shopping centre’s expansion by 21,000 sqm and the opening of Stroomi shopping centre in Põhja - Tallinn city district. After its expansion Ülemiste is expected to become the biggest shopping centre in Tallinn.
> The most intensive retail development is expected to occur during the next 2 years in Lasnamäe, Põhja - Tallinn and probably Mustamäe and Haabersti city districts.
> Vacancy rates in larger shopping centres will remain effectively zero in 2014.
> In 2014, rent rates are expected to remain more or less stable, with a slight improvement of 3 - 5 per cent on average likely due to index increments. Rent rates for anchor tenants are expected to remain stable.
> Shopping centres will continue to make changes in tenant mix in 2014 in order to strengthen their positions among growing competition.
> Completion of several big retail projects announced by developers in 2012 is postponed to 2016 / 2017. No new large - scale projects are expected to enter the market during the next two years, although some middle scale developments are expected to start in 2014.
> Despite the fact that the retail market in Tallinn is clearly shopping centre oriented, street retail saw some activity and growing demand in 2013 with the trend expected to continue in 2014.
> The retail market in Tallinn still does not feel considerable pressure from e-commerce, although its popularity is expected to grow exponentially in the coming years.
> Although the Tallinn shopping centre market is close to saturation, some room remains for additions and the possibility for the emergence of a few new shopping centres in the mid-term perspective.
vacancy Rates and tendencies in shopping Centres in tallinn
class Vacancy tRenDsMajor shopping centres 0.8 - 1.0 %
- stableSource: Colliers International
Rent Rates and tendencies in shopping Centres in tallinn
class Rent Rates tRenDsLarge retail unit (anchor tenants) 7.0 - 12.0
Medium retail unit (150 - 350 sqm) 10.5 - 31.5
Small retail unit (up to 100 sqm) 13.5 - 48.0, up to 100
* - asking rent rate (EUR/sqm/month) excluding VAT and operating expenses - stable, - slight increaseSource: Colliers International
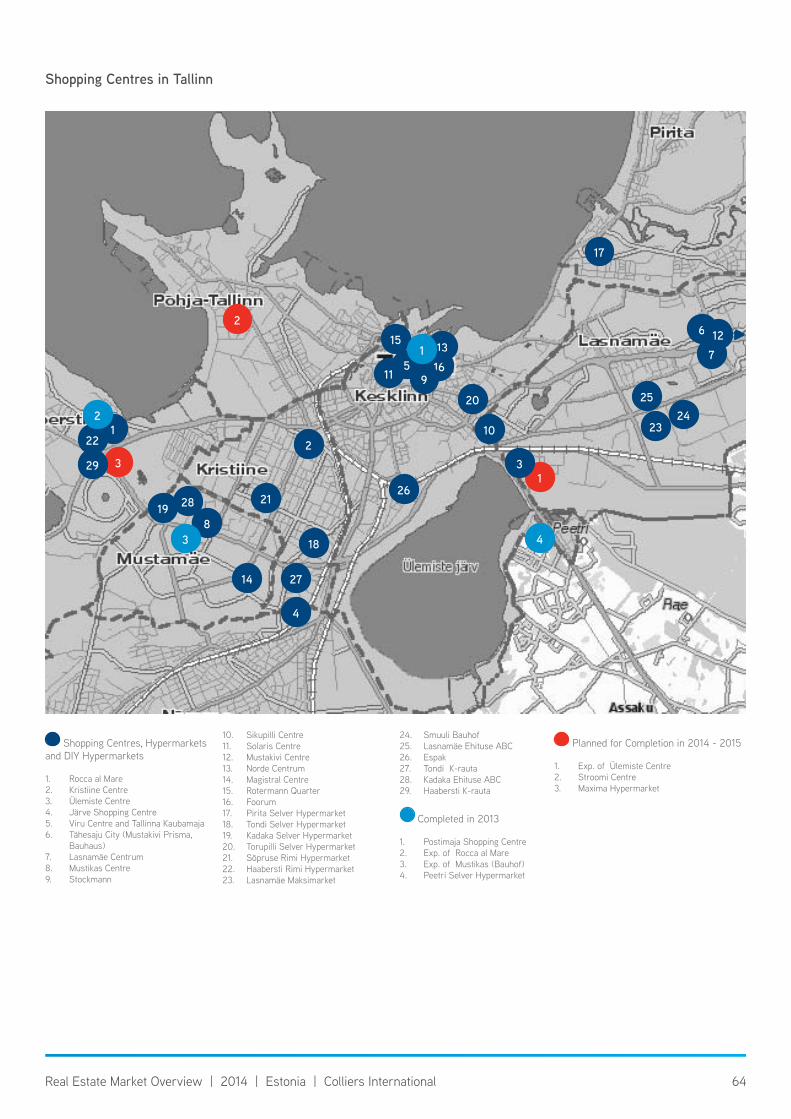
64Real Estate Market Overview | 2014 | Estonia | Colliers International
shopping Centres in tallinn
Shopping Centres, Hypermarkets and DIY Hypermarkets
1. Rocca al Mare2. Kristiine Centre3. Ülemiste Centre4. Järve Shopping Centre5. Viru Centre and Tallinna Kaubamaja6. Tähesaju City (Mustakivi Prisma,
Bauhaus)7. Lasnamäe Centrum8. Mustikas Centre9. Stockmann
10. Sikupilli Centre11. Solaris Centre12. Mustakivi Centre13. Norde Centrum14. Magistral Centre15. Rotermann Quarter16. Foorum17. Pirita Selver Hypermarket18. Tondi Selver Hypermarket19. Kadaka Selver Hypermarket20. Torupilli Selver Hypermarket21. Sõpruse Rimi Hypermarket22. Haabersti Rimi Hypermarket 23. Lasnamäe Maksimarket
24. Smuuli Bauhof25. Lasnamäe Ehituse ABC26. Espak27. Tondi K-rauta28. Kadaka Ehituse ABC29. Haabersti K-rauta
Completed in 2013
1. Postimaja Shopping Centre2. Exp. of Rocca al Mare3. Exp. of Mustikas (Bauhof)4. Peetri Selver Hypermarket
Planned for Completion in 2014 - 2015
1. Exp. of Ülemiste Centre2. Stroomi Centre3. Maxima Hypermarket
7
221
2
31
4
2714
17
6
2324
25
511
3
1316
9
15
20
10
18
2128
29
198
2
4
1
2
3
26
12 ▷
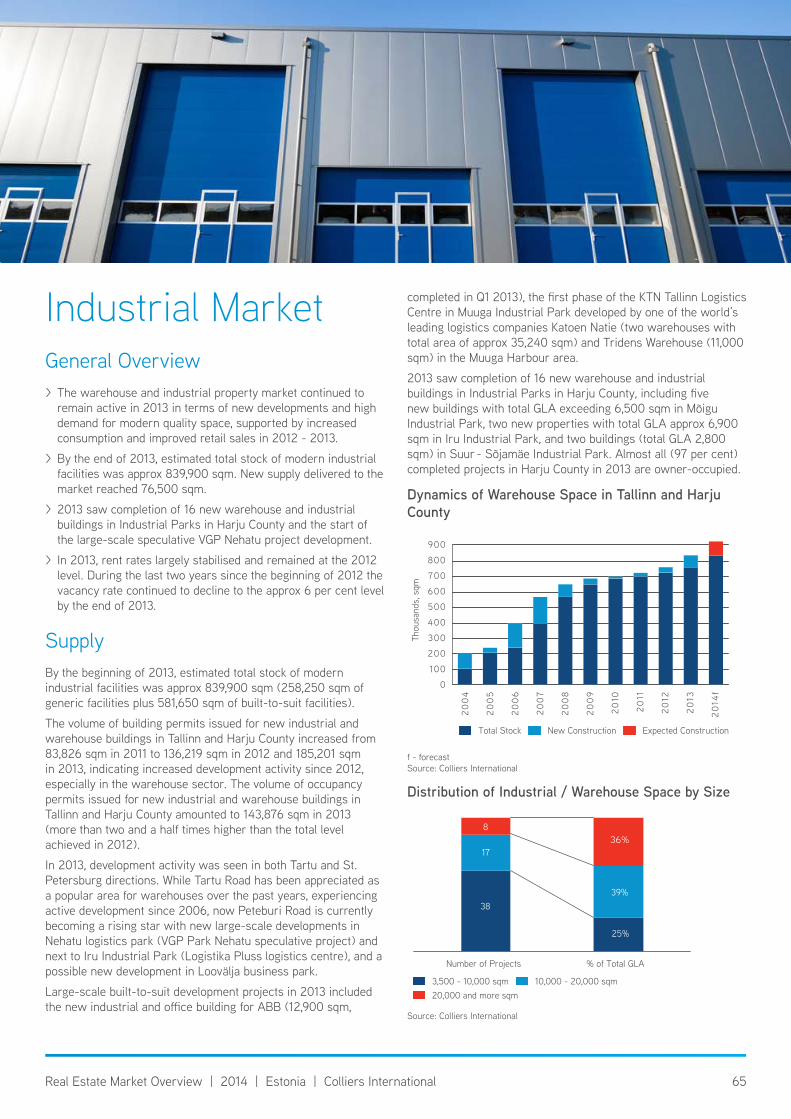
65Real Estate Market Overview | 2014 | Estonia | Colliers International
Industrial MarketGeneral Overview > The warehouse and industrial property market continued to remain active in 2013 in terms of new developments and high demand for modern quality space, supported by increased consumption and improved retail sales in 2012 - 2013.
> By the end of 2013, estimated total stock of modern industrial facilities was approx 839,900 sqm. New supply delivered to the market reached 76,500 sqm.
> 2013 saw completion of 16 new warehouse and industrial buildings in Industrial Parks in Harju County and the start of the large-scale speculative VGP Nehatu project development.
> In 2013, rent rates largely stabilised and remained at the 2012 level. During the last two years since the beginning of 2012 the vacancy rate continued to decline to the approx 6 per cent level by the end of 2013.
SupplyBy the beginning of 2013, estimated total stock of modern industrial facilities was approx 839,900 sqm (258,250 sqm of generic facilities plus 581,650 sqm of built-to-suit facilities).
The volume of building permits issued for new industrial and warehouse buildings in Tallinn and Harju County increased from 83,826 sqm in 2011 to 136,219 sqm in 2012 and 185,201 sqm in 2013, indicating increased development activity since 2012, especially in the warehouse sector. The volume of occupancy permits issued for new industrial and warehouse buildings in Tallinn and Harju County amounted to 143,876 sqm in 2013 (more than two and a half times higher than the total level achieved in 2012).
In 2013, development activity was seen in both Tartu and St. Petersburg directions. While Tartu Road has been appreciated as a popular area for warehouses over the past years, experiencing active development since 2006, now Peteburi Road is currently becoming a rising star with new large-scale developments in Nehatu logistics park (VGP Park Nehatu speculative project) and next to Iru Industrial Park (Logistika Pluss logistics centre), and a possible new development in Loovälja business park.
Large-scale built-to-suit development projects in 2013 included the new industrial and office building for ABB (12,900 sqm,
completed in Q1 2013), the first phase of the KTN Tallinn Logistics Centre in Muuga Industrial Park developed by one of the world’s leading logistics companies Katoen Natie (two warehouses with total area of approx 35,240 sqm) and Tridens Warehouse (11,000 sqm) in the Muuga Harbour area.
2013 saw completion of 16 new warehouse and industrial buildings in Industrial Parks in Harju County, including five new buildings with total GLA exceeding 6,500 sqm in Mõigu Industrial Park, two new properties with total GLA approx 6,900 sqm in Iru Industrial Park, and two buildings (total GLA 2,800 sqm) in Suur - Sõjamäe Industrial Park. Almost all (97 per cent) completed projects in Harju County in 2013 are owner-occupied.
f - forecastSource: Colliers International
Dynamics of warehouse space in tallinn and harju County
20
04
20
05
20
06
20
07
20
08
20
09
20
10
20
11
20
12
20
13
20
14f
Total Stock New Construction Expected Construction
900
800
700
600
500
400
300
200
100
0
Thou
sand
s, s
qm
Distribution of industrial / warehouse space by size
3,500 - 10,000 sqm 10,000 - 20,000 sqm20,000 and more sqm
38
17
8
25%
39%
36%
Number of Projects % of Total GLA
Source: Colliers International
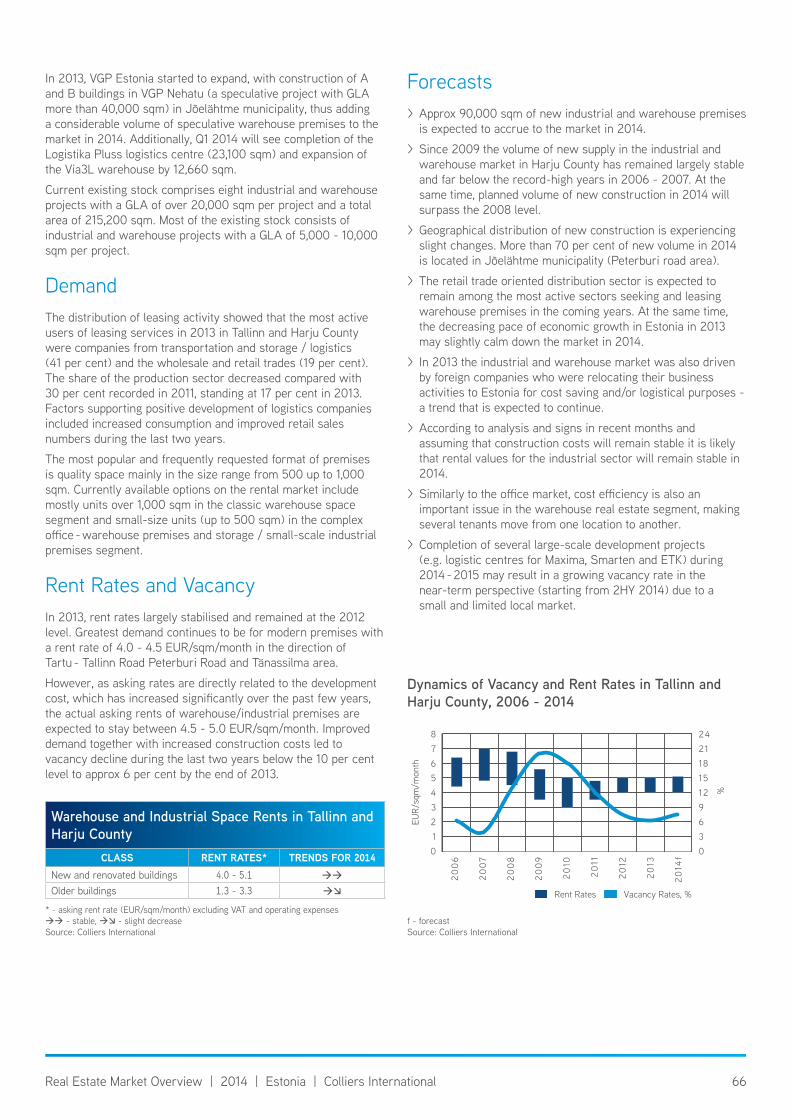
66Real Estate Market Overview | 2014 | Estonia | Colliers International
In 2013, VGP Estonia started to expand, with construction of A and B buildings in VGP Nehatu (a speculative project with GLA more than 40,000 sqm) in Jõelähtme municipality, thus adding a considerable volume of speculative warehouse premises to the market in 2014. Additionally, Q1 2014 will see completion of the Logistika Pluss logistics centre (23,100 sqm) and expansion of the Via3L warehouse by 12,660 sqm.
Current existing stock comprises eight industrial and warehouse projects with a GLA of over 20,000 sqm per project and a total area of 215,200 sqm. Most of the existing stock consists of industrial and warehouse projects with a GLA of 5,000 - 10,000 sqm per project.
Demand The distribution of leasing activity showed that the most active users of leasing services in 2013 in Tallinn and Harju County were companies from transportation and storage / logistics (41 per cent) and the wholesale and retail trades (19 per cent). The share of the production sector decreased compared with 30 per cent recorded in 2011, standing at 17 per cent in 2013. Factors supporting positive development of logistics companies included increased consumption and improved retail sales numbers during the last two years.
The most popular and frequently requested format of premises is quality space mainly in the size range from 500 up to 1,000 sqm. Currently available options on the rental market include mostly units over 1,000 sqm in the classic warehouse space segment and small-size units (up to 500 sqm) in the complex office - warehouse premises and storage / small-scale industrial premises segment.
Rent Rates and Vacancy In 2013, rent rates largely stabilised and remained at the 2012 level. Greatest demand continues to be for modern premises with a rent rate of 4.0 - 4.5 EUR/sqm/month in the direction of Tartu - Tallinn Road Peterburi Road and Tänassilma area.
However, as asking rates are directly related to the development cost, which has increased significantly over the past few years, the actual asking rents of warehouse/industrial premises are expected to stay between 4.5 - 5.0 EUR/sqm/month. Improved demand together with increased construction costs led to vacancy decline during the last two years below the 10 per cent level to approx 6 per cent by the end of 2013.
Forecasts > Approx 90,000 sqm of new industrial and warehouse premises is expected to accrue to the market in 2014.
> Since 2009 the volume of new supply in the industrial and warehouse market in Harju County has remained largely stable and far below the record-high years in 2006 - 2007. At the same time, planned volume of new construction in 2014 will surpass the 2008 level.
> Geographical distribution of new construction is experiencing slight changes. More than 70 per cent of new volume in 2014 is located in Jõelähtme municipality (Peterburi road area).
> The retail trade oriented distribution sector is expected to remain among the most active sectors seeking and leasing warehouse premises in the coming years. At the same time, the decreasing pace of economic growth in Estonia in 2013 may slightly calm down the market in 2014.
> In 2013 the industrial and warehouse market was also driven by foreign companies who were relocating their business activities to Estonia for cost saving and/or logistical purposes - a trend that is expected to continue.
> According to analysis and signs in recent months and assuming that construction costs will remain stable it is likely that rental values for the industrial sector will remain stable in 2014.
> Similarly to the office market, cost efficiency is also an important issue in the warehouse real estate segment, making several tenants move from one location to another.
> Completion of several large-scale development projects (e.g. logistic centres for Maxima, Smarten and ETK) during 2014 - 2015 may result in a growing vacancy rate in the near-term perspective (starting from 2HY 2014) due to a small and limited local market.
warehouse and industrial space Rents in tallinn and harju County
class Rent Rates* Trends For 2014New and renovated buildings 4.0 - 5.1
Older buildings 1.3 - 3.3
* - asking rent rate (EUR/sqm/month) excluding VAT and operating expenses - stable, - slight decreaseSource: Colliers International
f - forecastSource: Colliers International
Dynamics of vacancy and Rent Rates in tallinn and harju County, 2006 - 2014
EUR/
sqm
/mon
th
876543210
24211815129630
%
20
06
20
07
20
08
20
09
20
10
20
11
20
12
20
13
20
14f
Rent Rates Vacancy Rates, %
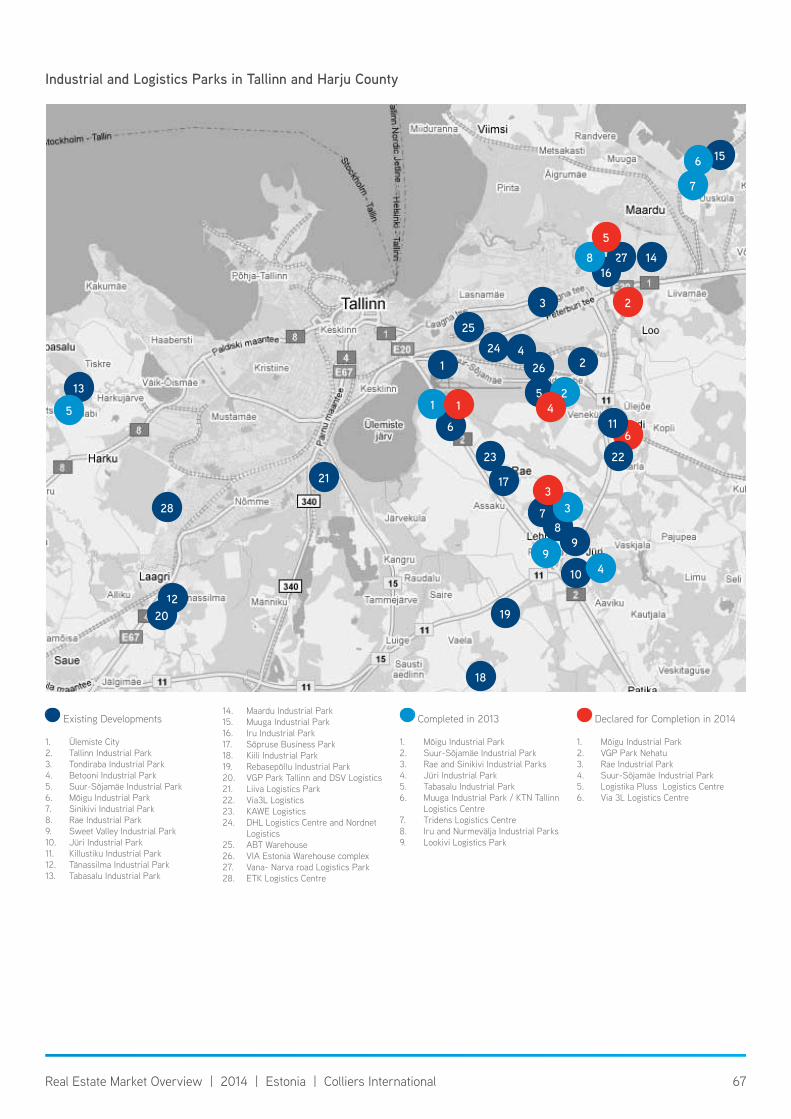
67Real Estate Market Overview | 2014 | Estonia | Colliers International
industrial and Logistics Parks in tallinn and harju County
Existing Developments
1. Ülemiste City2. Tallinn Industrial Park 3. Tondiraba Industrial Park4. Betooni Industrial Park5. Suur-Sõjamäe Industrial Park6. Mõigu Industrial Park7. Sinikivi Industrial Park8. Rae Industrial Park9. Sweet Valley Industrial Park10. Jüri Industrial Park 11. Killustiku Industrial Park12. Tänassilma Industrial Park13. Tabasalu Industrial Park
14. Maardu Industrial Park 15. Muuga Industrial Park16. Iru Industrial Park17. Sõpruse Business Park18. Kiili Industrial Park19. Rebasepõllu Industrial Park20. VGP Park Tallinn and DSV Logistics21. Liiva Logistics Park 22. Via3L Logistics23. KAWE Logistics24. DHL Logistics Centre and Nordnet
Logistics25. ABT Warehouse26. VIA Estonia Warehouse complex27. Vana- Narva road Logistics Park28. ETK Logistics Centre
Completed in 2013
1. Mõigu Industrial Park2. Suur-Sõjamäe Industrial Park3. Rae and Sinikivi Industrial Parks4. Jüri Industrial Park5. Tabasalu Industrial Park6. Muuga Industrial Park / KTN Tallinn
Logistics Centre 7. Tridens Logistics Centre8. Iru and Nurmevälja Industrial Parks9. Lookivi Logistics Park
Declared for Completion in 2014
1. Mõigu Industrial Park2. VGP Park Nehatu3. Rae Industrial Park4. Suur-Sõjamäe Industrial Park5. Logistika Pluss Logistics Centre6. Via 3L Logistics Centre
1
156
7
2716
14
24 4
5
7
9
26
9
18
25
6
1
21
13
1220
17
8
19
24
6
1
10
23
2
22
11
3
8
3
5
2
4
3
5
28
68Real Estate Market Overview | 2014 | Estonia | Colliers International
Hotel MarketGeneral Overview > 2011 - 2013 turned out to be successful years for the hotel market in Estonia. Sales of accommodation services by all accommodation establishments continued to increase during these last three years, while the number of tourists continued to set new records in 2012 and 2013.
> International arrivals to Estonia in 2013 showed an upward trend, increasing by 3.6 per cent in Estonia and by 2.1 per cent in Tallinn. Growing domestic tourism in 2013 also reflected in positive results for the hospitality industry in 2013.
> The most important negative factor affecting hotel sector performance in 2013 was the substantial decline in the number of air connections.
> Starting from autumn 2010 the average room price started steadily to increase, a trend that continued in 2011 - 2013. Hotel revenue per available room (RevPAR) in Estonia posted a 4.9 per cent increase in January - August 2013 compared with the same period a year earlier, due to a 7.4 per cent increase in the average daily rate (ADR).
> 2013 saw expansion of Hotel L’Ermitage, the beginning of renovation works at the Palace Hotel and demolition of the Reval Park Hotel building.
Supply After 2009, when the Tallinn hotel segment expanded with the opening of two hotels belonging to the Meriton Hotels Chain, no new hotels entered the Tallinn hotel market in 2010 - 2011.
By December 2013 Hotel L’Ermitage, located in the centre of Tallinn right next to the Old Town, completed renovation and extension of the building, providing 31 new rooms with contemporary furnishings.
In the summer of 2013 Estonian casino operator Olympic Entertainment Group signed a contract with Hilton Worldwide, who will operate a new hotel in City Centre. Located at Gonsiori 20 / F.R.Kreutzwaldi 23, a new 13-storey hotel will be built in place of the former 8-storey Reval Park Hotel building. The deadline is set for late 2015 and a new 202 room Tallinn Hilton with conference centre, spa, restaurant and casino will open in 2016.
At the same time, the Swedish-based Scandic hotel chain sold its property in Tallinn at the beginning of 2013 (Scandic Palace hotel, 86 hotel rooms) and terminated operations in Estonia. Reconstruction of the Palace Hotel by new owners, EfTEN Real Estate Fund and Esraven, started in October 2013 and the fully renovated hotel will open its doors in May 2014. The new operator of the Palace Hotel is TallinnHotels Group which has 5 hotels with 300 hotel rooms in Tallinn.
By the beginning of 2014, the 4-star segment comprised the largest percentage of Tallinn’s available rooms, consisting of 24 hotels with 3,665 rooms, or 56 per cent of all hotel-room stock in Tallinn. The hotel market in Tallinn is dominated by local hotel chains and operators. Among local hotel chains the biggest are the Tallink Hotels chain which has 4 hotels with 1,035 hotel rooms in Tallinn and the Meriton Hotels chain which has 3 hotels with 556 hotel rooms in Tallinn. The largest international
Source: Colliers International, Estonian Hotel and Restaurant Association
number of hotel Rooms Accrued to the tallinn hotel Market in 2001 - 2013
20
01
20
02
20
03
20
04
20
05
20
06
20
07
20
08
20
09
20
10
20
11
20
12
20
13
1 ,400
1 ,200
1 ,000
800
600
400
200
0
number of hotels and Rooms in estonia by stars
staRstallInn estonIa
Hotels Rooms Hotels Rooms5-star 5 414 7 4564-star 24 3,665 39 4,6473-star 21 2,110 89 5,9252-star 7 359 47 1,4631-star 2 23 3 43total 59 6,571 185 12,534
Source: Colliers International, Estonian Hotel and Restaurant Association
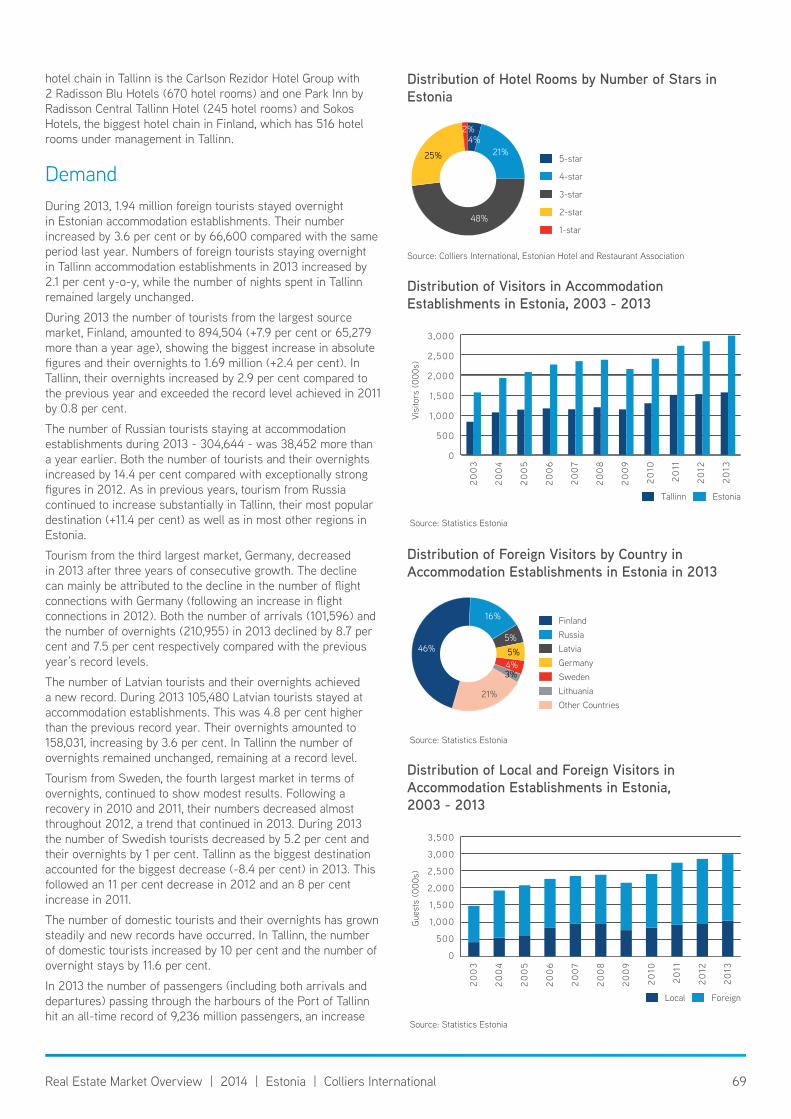
69Real Estate Market Overview | 2014 | Estonia | Colliers International
hotel chain in Tallinn is the Carlson Rezidor Hotel Group with 2 Radisson Blu Hotels (670 hotel rooms) and one Park Inn by Radisson Central Tallinn Hotel (245 hotel rooms) and Sokos Hotels, the biggest hotel chain in Finland, which has 516 hotel rooms under management in Tallinn.
DemandDuring 2013, 1.94 million foreign tourists stayed overnight in Estonian accommodation establishments. Their number increased by 3.6 per cent or by 66,600 compared with the same period last year. Numbers of foreign tourists staying overnight in Tallinn accommodation establishments in 2013 increased by 2.1 per cent y-o-y, while the number of nights spent in Tallinn remained largely unchanged.
During 2013 the number of tourists from the largest source market, Finland, amounted to 894,504 (+7.9 per cent or 65,279 more than a year age), showing the biggest increase in absolute figures and their overnights to 1.69 million (+2.4 per cent). In Tallinn, their overnights increased by 2.9 per cent compared to the previous year and exceeded the record level achieved in 2011 by 0.8 per cent.
The number of Russian tourists staying at accommodation establishments during 2013 - 304,644 - was 38,452 more than a year earlier. Both the number of tourists and their overnights increased by 14.4 per cent compared with exceptionally strong figures in 2012. As in previous years, tourism from Russia continued to increase substantially in Tallinn, their most popular destination (+11.4 per cent) as well as in most other regions in Estonia.
Tourism from the third largest market, Germany, decreased in 2013 after three years of consecutive growth. The decline can mainly be attributed to the decline in the number of flight connections with Germany (following an increase in flight connections in 2012). Both the number of arrivals (101,596) and the number of overnights (210,955) in 2013 declined by 8.7 per cent and 7.5 per cent respectively compared with the previous year’s record levels.
The number of Latvian tourists and their overnights achieved a new record. During 2013 105,480 Latvian tourists stayed at accommodation establishments. This was 4.8 per cent higher than the previous record year. Their overnights amounted to 158,031, increasing by 3.6 per cent. In Tallinn the number of overnights remained unchanged, remaining at a record level.
Tourism from Sweden, the fourth largest market in terms of overnights, continued to show modest results. Following a recovery in 2010 and 2011, their numbers decreased almost throughout 2012, a trend that continued in 2013. During 2013 the number of Swedish tourists decreased by 5.2 per cent and their overnights by 1 per cent. Tallinn as the biggest destination accounted for the biggest decrease (-8.4 per cent) in 2013. This followed an 11 per cent decrease in 2012 and an 8 per cent increase in 2011.
The number of domestic tourists and their overnights has grown steadily and new records have occurred. In Tallinn, the number of domestic tourists increased by 10 per cent and the number of overnight stays by 11.6 per cent.
In 2013 the number of passengers (including both arrivals and departures) passing through the harbours of the Port of Tallinn hit an all-time record of 9,236 million passengers, an increase
Source: Statistics Estonia
Distribution of visitors in Accommodation establishments in estonia, 2003 - 2013
Visi
tors
(000
s)
20
03
20
04
20
05
20
06
20
07
20
08
20
09
20
10
20
11
20
12
20
13
3 ,000
2,500
2,000
1,500
1,000
500
0
Tallinn Estonia
Source: Statistics Estonia
Distribution of Foreign visitors by Country in Accommodation establishments in estonia in 2013
46%
21%
4%3%
5%5%
16% FinlandRussiaLatviaGermanySwedenLithuaniaOther Countries
Source: Statistics Estonia
Distribution of Local and Foreign visitors in Accommodation establishments in estonia, 2003 - 2013
Gues
ts (0
00s)
20
03
20
04
20
05
20
06
20
07
20
08
20
09
20
10
20
11
20
12
20
13
3 ,500
3,000
2,500
2,000
1,500
1,000
500
0
Local Foreign
Source: Colliers International, Estonian Hotel and Restaurant Association
Distribution of hotel Rooms by number of stars in estonia
21%
48%
25%
2%4%
5-star
4-star
3-star
2-star
1-star
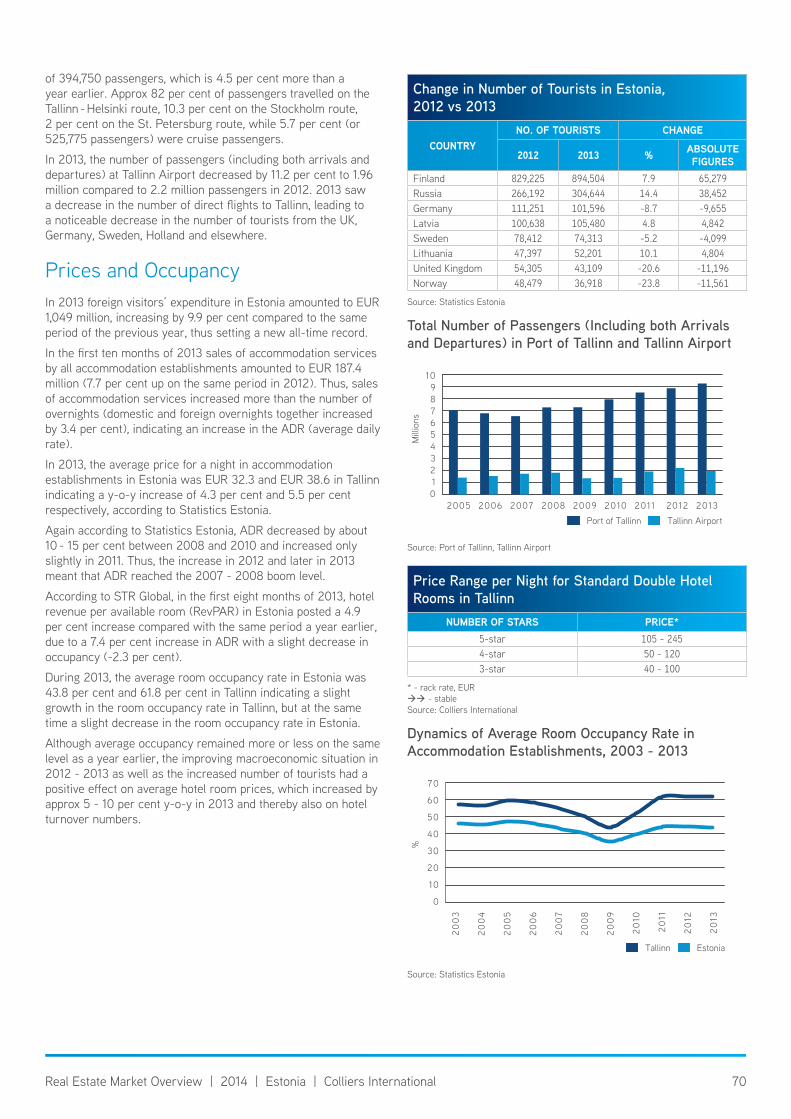
70Real Estate Market Overview | 2014 | Estonia | Colliers International
of 394,750 passengers, which is 4.5 per cent more than a year earlier. Approx 82 per cent of passengers travelled on the Tallinn - Helsinki route, 10.3 per cent on the Stockholm route, 2 per cent on the St. Petersburg route, while 5.7 per cent (or 525,775 passengers) were cruise passengers.
In 2013, the number of passengers (including both arrivals and departures) at Tallinn Airport decreased by 11.2 per cent to 1.96 million compared to 2.2 million passengers in 2012. 2013 saw a decrease in the number of direct flights to Tallinn, leading to a noticeable decrease in the number of tourists from the UK, Germany, Sweden, Holland and elsewhere.
Prices and OccupancyIn 2013 foreign visitors’ expenditure in Estonia amounted to EUR 1,049 million, increasing by 9.9 per cent compared to the same period of the previous year, thus setting a new all-time record.
In the first ten months of 2013 sales of accommodation services by all accommodation establishments amounted to EUR 187.4 million (7.7 per cent up on the same period in 2012). Thus, sales of accommodation services increased more than the number of overnights (domestic and foreign overnights together increased by 3.4 per cent), indicating an increase in the ADR (average daily rate).
In 2013, the average price for a night in accommodation establishments in Estonia was EUR 32.3 and EUR 38.6 in Tallinn indicating a y-o-y increase of 4.3 per cent and 5.5 per cent respectively, according to Statistics Estonia.
Again according to Statistics Estonia, ADR decreased by about 10 - 15 per cent between 2008 and 2010 and increased only slightly in 2011. Thus, the increase in 2012 and later in 2013 meant that ADR reached the 2007 - 2008 boom level.
According to STR Global, in the first eight months of 2013, hotel revenue per available room (RevPAR) in Estonia posted a 4.9 per cent increase compared with the same period a year earlier, due to a 7.4 per cent increase in ADR with a slight decrease in occupancy (-2.3 per cent).
During 2013, the average room occupancy rate in Estonia was 43.8 per cent and 61.8 per cent in Tallinn indicating a slight growth in the room occupancy rate in Tallinn, but at the same time a slight decrease in the room occupancy rate in Estonia.
Although average occupancy remained more or less on the same level as a year earlier, the improving macroeconomic situation in 2012 - 2013 as well as the increased number of tourists had a positive effect on average hotel room prices, which increased by approx 5 - 10 per cent y-o-y in 2013 and thereby also on hotel turnover numbers.
Change in number of tourists in estonia, 2012 vs 2013
countRyno. oF TourIsTs cHanGe
2012 2013 % aBsolute FIgures
Finland 829,225 894,504 7.9 65,279Russia 266,192 304,644 14.4 38,452Germany 111,251 101,596 -8.7 -9,655Latvia 100,638 105,480 4.8 4,842Sweden 78,412 74,313 -5.2 -4,099Lithuania 47,397 52,201 10.1 4,804United Kingdom 54,305 43,109 -20.6 -11,196Norway 48,479 36,918 -23.8 -11,561
Source: Statistics Estonia
Source: Port of Tallinn, Tallinn Airport
total number of Passengers (including both Arrivals and Departures) in Port of tallinn and tallinn Airport
Mill
ions
109876543210
2005 2006 2007 2008 2009 2010 2011 2012 2013
Port of Tallinn Tallinn Airport
Price Range per night for standard Double hotel Rooms in tallinn
nuMber oF sTArs PRIce*5-star 105 - 2454-star 50 - 1203-star 40 - 100
* - rack rate, EUR - stableSource: Colliers International
Source: Statistics Estonia
Dynamics of Average Room Occupancy Rate in Accommodation establishments, 2003 - 2013
%
70
60
50
40
30
20
10
0
20
03
20
04
20
05
20
06
20
07
20
08
20
09
20
10
20
11
20
12
20
13
Tallinn Estonia

71Real Estate Market Overview | 2014 | Estonia | Colliers International
Forecasts > Despite ongoing economic challenges, the growth of international arrivals worldwide is expected to continue in 2014. Inbound tourism is expected to grow by approx 2.1 per cent in 2014 and 4.9 per cent in 2015 respectively in Central Europe and the Baltic States.
> In 2014 growth in the number of tourists accommodated in Estonia is expected to significantly slow down due to continually growing ADR and a high reference base.
> The number of Russian tourists staying at accommodation establishments is expected to continue growing in 2014, although at slower pace.
> As development of inbound tourism is substantially dependent on the volume of Estonia’s air travel, then the decreased number of flight connections is already having a negative impact on the numbers of tourists arriving from countries with no quick/convenient ferry, train or bus connections and especially on tourism related to conferences and larger entertainment events.
> The Port of Tallinn expects the number of passengers in 2014 to remain at the record level of 2013.
> New hotel chains (Hilton, Accor) are expected to enter the Tallinn hotel market in the 2 - 3 year perspective. The new Tallinn Hilton hotel will open its doors in 2016.
72Real Estate Market Overview | 2014 | Estonia | SORAINEN
Legal OverviewMost commercial properties owned for investment purposes in Estonia are held in single asset or portfolio special purpose companies. Commercial property can therefore be sold either by selling the real estate (asset transaction) or by selling 100 per cent of the shares of the property holding company (share transaction). Both options are widely used. An asset transfer may constitute a business transfer in which case it will be similar to a share deal since the obligations of the seller will transfer to the buyer along with the asset.
Asset Transfer DealsAn important issue to consider is whether transfer of assets also constitutes transfer of a business as a going concern. This can happen if the asset comes with operational lease agreements, if the asset is for a specialised purpose or if other unique factors are involved. If the asset transfer constitutes a business transfer, the following issues must also be considered:
> merger clearance may be needed;
> obligations of the business transfer to the buyer;
> employees of the business must be notified of the transfer.
Main Steps Usually in practice sale of real estate by one party (seller) to another party (buyer) would be completed within 2 - 6 months mostly following these main steps:
1. The parties sign a letter of intent (LOI or HOT) on the anticipated transaction, stating the main terms of the deal (e.g. purchase price, payment mechanism, terms of conducting due diligence and the prospective time schedule for the transaction). Note that in Estonia the obligation to buy or sell real estate must be notarised in order to be binding. However, if a LOI or HOT sets out the parties’ obligation not to negotiate with third parties (so-called exclusivity), this agreement is considered valid and binding even without notarisation. Moreover, in commercial transactions, the LOI or HOT usually only regulates the structure and time-schedule of negotiations. Breach of the exclusivity obligation entitles the aggrieved party to compensation by way of damages, including payment of specific contractual penalties.
2. Negotiations with banks on financing, local municipalities and potential building contractors and conduct of legal, financial, environmental and technical due diligence of the property.
3. Often, prior to or simultaneously with the due diligence, the parties negotiate an asset purchase agreement (APA). This is usually signed after completion of the due diligence review. The APA must be notarized and state all necessary terms and conditions of the transaction (e.g. purchase price, conditions of closing). Often a preliminary notation is also entered into the Land Register for the benefit of the buyer.
4. In the case of business transfer, applying for merger clearance and fulfilment of other conditions precedent (e.g. issue of building permit, adoption of detailed plan).
5. Closing, i.e. conclusion of the real right agreement, transfer of the purchase price (whether from notary escrow or by the
financing bank), payment of stamp duties followed by filing the purchase agreement with the Land Registry.
6. Registration of the new owner and other pertinent changes (e.g. new mortgages) at the Land Registry (within 4 weeks as of filing at the latest). In some cases, payment of the purchase price is a condition of transfer of title, i.e. the purchase price is paid by the Buyer after the Buyer has been entered into the Land Register as the new owner. This is rare, though the most buyer-friendly set up of the asset transfer transaction.
Issues to Consider > Asset transfer involves payment of notary fees and state duty, so is more expensive than a share transfer.
> Notarised agreements are usually in Estonian and seldom in English.
> Limited scope of due diligence investigation since the review concerns only the target real estate unless the transaction qualifies as a business transfer.
> Lease agreements survive change of ownership of the target asset, i.e. agreements transfer to the purchaser.
> Agreements on supply of utilities and other services must be assigned or concluded anew.
> LOI or HOT setting forth the parties’ obligation not to negotiate with third parties (so-called exclusivity) is considered valid and binding without notarisation; the obligation to buy or sell must be in notarised form.
> An asset transaction may qualify as a business transfer, in which case all obligations (including employees) associated with the business acquired are transferred from seller to buyer.
Share Transfer Deals
Main StepsAs a compulsory rule, the shares of a public limited liability company must be kept in the securities account of the shareholder(s) opened with an Estonian commercial bank at the moment of establishing the company. The shares are registered and the shareholders’ list is kept at the Estonian Central Register of Securities (ECRS).
This means that sale of shares of a public limited liability company (property holding company) is via bank transactions by transferring the share(s) from the securities account of the seller to the securities account of the purchaser.
In the case of a private limited liability company the share(s) may either be registered at the ECRS or not. Registration of share(s) of a private liability company at the ECRS is voluntary and requires a shareholder(s) resolution. If the share(s) are not registered at the ECRS the share transfer must be executed via notarised share purchase agreement. If the share(s) are registered at the ECRS, the sale of shares can be executed by concluding a share purchase agreement in simple written form and transferring the share(s) via bank transactions by transferring the share(s) from the securities account of the seller to the securities account of the purchaser.
73Real Estate Market Overview | 2014 | Estonia | SORAINEN
General StepsGeneral steps on selling shares via the ECRS are as follows:
1. In the case of a private limited liability company which does not yet have its share(s) registered at the ECRS, the shareholder(s) must open a securities account for themselves with an Estonian commercial bank. Securities accounts are always linked to a regular bank account.
2. To register share(s) at the ECRS the shareholder(s) have to adopt a resolution to that effect and the management board of the company files the application with the ECRS. The share(s) will be registered within 1 - 5 days.
3. The parties conclude a share purchase agreement in simple written form.
4. To transfer shares, the seller instructs the administrator of its securities account (the bank) to transfer the shares to the securities account of the purchaser, and the purchaser gives counter instructions to its securities account to acquire the shares.
5. The shares of the company can be transferred via two methods: FOP (free of payment) or DVP (delivery versus payment).
6. FOP transfer allows payment for the shares by instalments, on a different date than the closing date and from and to accounts not linked to the securities account and thus also not in a bank registered in Estonia.
7. DVP requires total payment to be made at the same time as the shares are transferred and from and to the accounts of the parties which are linked to their respective securities accounts in a bank in Estonia.
8. To execute the transaction, the seller must issue an irrevocable and unconditional instruction to the bank administering its securities account to transfer its shares in the company to the purchaser’s securities account. In the case of DVP, the instruction is made and executed only against payment for the shares.
9. To execute the transaction, the purchaser must issue irrevocable and unconditional instructions to the bank administering its securities account to accept the shares of the company. In the case of DVP, the acceptance instruction is accompanied by an instruction to transfer the purchase price for the shares to the seller’s current account. In that event, the shares are transferred only against payment for the shares.
10. Thereafter automatic changes are made to the list of shareholders in the company maintained by the ECRS. Transfer of title to the share(s) takes place at the moment the share(s) are registered in the securities account of the purchaser, if the time for transfer of title is not agreed otherwise in the share purchase agreement.
General steps for selling shares by concluding a notarised share purchase agreement (only private limited liability companies whose shares are not registered at the ECRS) are as follows:
1. A notarised share purchase agreement is concluded by the parties. The notary fee depends on the transaction value of the share(s).
2. Changes in the shareholders’ list are made by the management board of the company.
Key Issues to Take into Account > Notary fees and state duty arising from real estate sales are saved from transaction costs where sale of shares of a private or public limited company (whose shares are registered at the ECRS) is completed without notarisation as an electronic share transfer via banks and the ECRS.
> Notary fees apply in the case of a share transfer by notarised share purchase agreement, which makes the transaction more expensive than executing via securities transaction via the ECRS.
> Ownership of shares is transferred as agreed in the sale agreement, usually at the time of closing the transaction, or (in the case of transfer via the ECRS), upon registration, which takes only a few days, whereas in an asset deal transfer of title takes 2 - 4 weeks (registration with the Land Register).
> Scope of due diligence investigation is extended because in a share deal the entire company transfers to the purchaser (with all known and unknown rights and liabilities) as opposed to due diligence of target real estate only.
> Financial assistance rules apply (the target company may not use its own assets to secure a loan taken by the buyer to finance acquisition).
> Deferred tax issues.
Title to Real Estate, Land BookOwnership of real estate is registered in the Land Book. This is a national register, which includes information about ownership, details of real estate, and related encumbrances. Entries in the Land Book are assumed correct and valid vis-à-vis third persons acting in good faith.
The Land Book is a public register and everyone with a legitimate interest may access registered information. The register is maintained electronically.
Acquisition of Real Estate
GeneralReal estate consists of land and things permanently attached to it, such as buildings and standing forest. In general, transfer of a building separately from the underlying land is not permissible, except if building title is established and so transferred. In that case, the building forms an essential part of the building title, not of land.
Change of OwnershipTitle to real estate is considered transferred on registration of ownership in the Land Book, not on signing the agreement. Ownership is usually registered within 2-4 weeks as of filing an application with the Land Book along with the signed and notarised real right agreement.
Form of AgreementsTransfer of title to real estate requires a sale agreement (setting the terms and conditions of sale) and a real property rights agreement (agreement to transfer title). These may be contained in one document but may also be separate.
74Real Estate Market Overview | 2014 | Estonia | SORAINEN
All transactions related to the obligation to sell and purchase real estate require notarisation in order to create legally binding obligations. The notary verifies the authorisation of the signatories to the agreement, the content of the agreement, and the will of the parties, who must appear before the notary to conclude the agreement.
Language RequirementsNotarised contracts are usually signed in Estonian. Notaries with sufficient language skills may consent to attest a contract in English or other foreign language. If agreements are verified in Estonian, foreigners may ask for a written translation or obtain the help of an interpreter before signing.
As the Land Book is maintained in Estonian, any documents in foreign languages must be filed with the Land Book with a notarised translation into Estonian.
Due DiligenceIt is advisable to carry out legal due diligence of the target real estate/holding company before concluding a purchase. Due diligence involves checking title, encumbrances, planning issues, building rights, third party rights, public restrictions, permits, environmental issues, disputes and other matters. This gives the buyer more security or bargaining power.
Right of First RefusalRights of first refusal may be created by contract or law. For example, a co-owner of real estate has a statutory right of first refusal upon sale of a legal share of the real estate to third persons. Further, the state or local government have a statutory right of first refusal upon transfer of real estate located within the boundaries of a shore or shore bank building exclusion zone or if real estate is located in certain nature protection zones, or if a heritage protection object is located on real estate.
Rights of first refusal may be exercised within two months after receiving notification of a sale agreement.
Typical Purchase Price ArrangementsThe buyer may be required to pay a deposit on the purchase price to a broker’s or seller’s account before a real estate purchase agreement is signed.
Often the purchase price is transferred to a notary’s deposit account before concluding the sale agreement. The notary releases the purchase price to the seller after the agreement is signed and filed with the Land Book and no other applications are filed in the Land Book that would hinder transfer of title.
Restrictions
Restrictions on Acquisition of Real EstateIn general, no restrictions are imposed on foreigners acquiring real estate in Estonia. Exceptions include forestry and agricultural land, plus some island and sea coast and state border areas.
Acquiring real estate where the intended purpose of which is profit-yielding land consisting of ten or more hectares of agricultural or forestry land is unrestricted only for:
> Estonian citizens.
> Citizens of a state which is a contracting party to the EEA Agreement
> Citizens of a member state of the Organisation for Economic Cooperation and Development.
> A legal person, with its seat in Estonia, from a country which is a contracting party to the EEA Agreement or in a member state of the Organisation for Economic Cooperation and Development which has been engaged in production of agricultural products or forest management for three years immediately preceding the year in which it makes the transaction to acquire the immovable.
Other persons may own such land but on limited grounds and on approval of the county governor. Transfer of land on smaller islands and certain border areas to non-citizens or legal persons of states not contracting parties to the EEA agreement requires permission of the Estonian Government.
Merger (Concentration) Control Transfer of real estate (both asset and share transfers) may be subject to concentration control by the competition authorities.
Public RestrictionsPublic restrictions may apply to use of real estate in the following areas: natural protection and coastal areas, Natura 2000 protection areas, heritage protection zones, protected zones of power lines, railways, roads, and other utility networks. Restrictions may mean that part of the real estate may not be used for building or the owner must avoid activity in protected zones, or that building or other activities require consent from utility networks, the operator, or the governing body (e.g. heritage protection authorities, local government, environmental protection authorities).
EncumbrancesThe following rights, which are entered in the Land Book, may encumber real estate: usufruct, servitudes, building title, rights of first refusal and mortgages. In general, these rights may be used in real estate transactions and are entered in the Land Book under notarised agreements to secure the interest of the parties, third persons, or neighbouring real estate owners.
The Land Book may register notation of a lease agreement, which ensures that upon transfer of real estate the new owner may not terminate the lease agreement within three months of acquisition citing urgent personal need to use the premises.
Property ManagementMaintenance of real estate is usually carried out by the owner or by a professional management company which provides technical support, accounting, and other related services. Apartment owners may establish an apartment owners’ association for the common management of property.
75Real Estate Market Overview | 2014 | Estonia | SORAINEN
Lease Agreements
GeneralFor residential leases the law provides extensive mandatory regulation protecting the tenant.
Business leases are much more flexible but a set of mandatory rules also applies.
On transfer of real estate, lease agreements survive change of ownership. However, an owner who needs the premises urgently for own use may terminate a lease agreement within three months of acquisition. This right may not be exercised if a notation of the lease agreement has been entered in the Land Book.
Duration and Expiry of Lease AgreementLease agreements may be either for specified or unspecified terms. If the parties have not agreed otherwise, either party to a lease agreement for an unspecified term may terminate a residential or business lease by giving at least three months’ notice.
A lease agreement for a specified term expires at the end of the term. Extraordinary termination is allowed for material breach of agreements for both unspecified and specified terms.
If the tenant continues to use the leased premises after expiry of a lease agreement, the lease is taken to have become a lease agreement entered into for an unspecified term unless the owner or tenant expresses some other intention to the other party within two weeks of expiry of the lease agreement (applies to the tenant) and as of when the owner learns that the tenant is continuing to use the leased premises (applies to the owner).
Lease Payment and Accessory Expenses (Utilities)Rent is usually paid once a month to the bank account of the landlord. The rent is typically indexed (e.g. changes in local CPI may be capped at e.g. 3 - 5 per cent per annum). The tenant commonly pays a deposit (or provides a first demand bank guarantee) of one to three months’ rent.
Accessory expenses (utilities) such as electricity and water are considered included in the rent if not otherwise agreed in the lease agreement. Prevailing market practice is that the tenant pays for utilities and other expense items in addition to the rent in accordance with invoices from service providers or the landlord.
Distressed Asset PurchasesDistressed sales may be facilitated or controlled by banks that have been financing real estate projects which run into difficulties. The risk of seller insolvency has to be taken into account when planning distressed purchases because a transaction made on conditions detrimental to the seller may be revoked in later insolvency proceedings. This risk is higher during the first six months following appointment of an interim trustee for the seller. No purchase price pre-payments should be made to a seller who is potentially insolvent.
If a distressed asset is sold through enforcement proceedings, then statutory auction rules are applied so that the bankruptcy trustee or bailiff will arrange the auction. The other option is that
the asset is sold outside the insolvency proceedings. Real estate from insolvency or enforcement auctions can be bought using bank financing.
A distressed asset is usually sold “as is”, which makes thorough due diligence even more important.
Lease contracts concluded by previous owners under terms adverse to the new owner may be difficult to terminate. As eviction of tenants is allowed only by court order then the process may be time consuming and costly.
Urmas Volens Specialist Counsel, Head of the Real Estate & Construction TeamSORAINEN EstoniaPärnu mnt 15, 10141 TallinnPhone +372 6 400 [email protected]
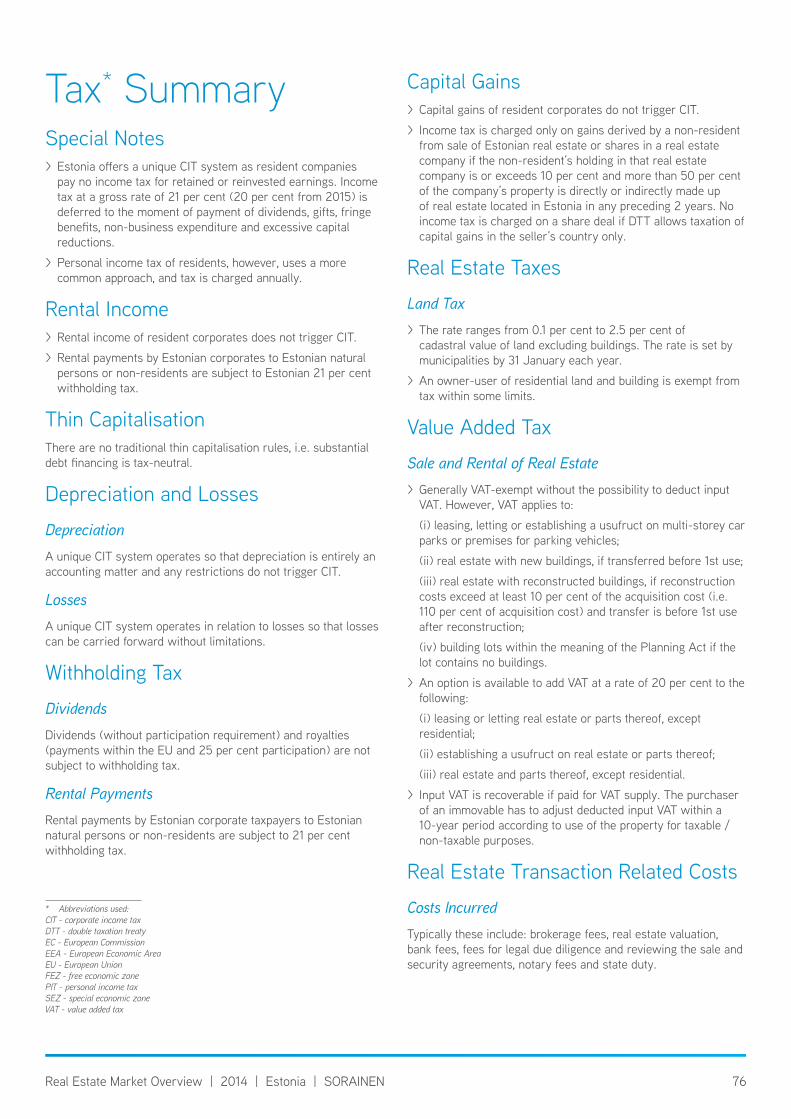
76Real Estate Market Overview | 2014 | Estonia | SORAINEN
Tax* SummarySpecial Notes > Estonia offers a unique CIT system as resident companies pay no income tax for retained or reinvested earnings. Income tax at a gross rate of 21 per cent (20 per cent from 2015) is deferred to the moment of payment of dividends, gifts, fringe benefits, non-business expenditure and excessive capital reductions.
> Personal income tax of residents, however, uses a more common approach, and tax is charged annually.
Rental Income > Rental income of resident corporates does not trigger CIT.
> Rental payments by Estonian corporates to Estonian natural persons or non-residents are subject to Estonian 21 per cent withholding tax.
Thin CapitalisationThere are no traditional thin capitalisation rules, i.e. substantial debt financing is tax-neutral.
Depreciation and Losses
DepreciationA unique CIT system operates so that depreciation is entirely an accounting matter and any restrictions do not trigger CIT.
LossesA unique CIT system operates in relation to losses so that losses can be carried forward without limitations.
Withholding Tax
DividendsDividends (without participation requirement) and royalties (payments within the EU and 25 per cent participation) are not subject to withholding tax.
Rental PaymentsRental payments by Estonian corporate taxpayers to Estonian natural persons or non-residents are subject to 21 per cent withholding tax.
* Abbreviations used: CIT - corporate income taxDTT - double taxation treaty EC - European CommissionEEA - European Economic AreaEU - European UnionFEZ - free economic zonePIT - personal income taxSEZ - special economic zoneVAT - value added tax
Capital Gains > Capital gains of resident corporates do not trigger CIT.
> Income tax is charged only on gains derived by a non-resident from sale of Estonian real estate or shares in a real estate company if the non-resident’s holding in that real estate company is or exceeds 10 per cent and more than 50 per cent of the company’s property is directly or indirectly made up of real estate located in Estonia in any preceding 2 years. No income tax is charged on a share deal if DTT allows taxation of capital gains in the seller’s country only.
Real Estate Taxes
Land Tax > The rate ranges from 0.1 per cent to 2.5 per cent of cadastral value of land excluding buildings. The rate is set by municipalities by 31 January each year.
> An owner-user of residential land and building is exempt from tax within some limits.
Value Added Tax
Sale and Rental of Real Estate > Generally VAT-exempt without the possibility to deduct input VAT. However, VAT applies to:
(i) leasing, letting or establishing a usufruct on multi-storey car parks or premises for parking vehicles;
(ii) real estate with new buildings, if transferred before 1st use;
(iii) real estate with reconstructed buildings, if reconstruction costs exceed at least 10 per cent of the acquisition cost (i.e. 110 per cent of acquisition cost) and transfer is before 1st use after reconstruction;
(iv) building lots within the meaning of the Planning Act if the lot contains no buildings.
> An option is available to add VAT at a rate of 20 per cent to the following:
(i) leasing or letting real estate or parts thereof, except residential;
(ii) establishing a usufruct on real estate or parts thereof;
(iii) real estate and parts thereof, except residential.
> Input VAT is recoverable if paid for VAT supply. The purchaser of an immovable has to adjust deducted input VAT within a 10-year period according to use of the property for taxable / non-taxable purposes.
Real Estate Transaction Related Costs
Costs IncurredTypically these include: brokerage fees, real estate valuation, bank fees, fees for legal due diligence and reviewing the sale and security agreements, notary fees and state duty.

77Real Estate Market Overview | 2014 | Estonia | SORAINEN
Sharing CostsSharing transaction costs is a matter for agreement between the parties. Usually, the buyer pays state duties for registering ownership, whilst notary fees are shared equally between the parties and the seller pays state duties for deleting old encumbrances (e.g. mortgages).
State and Transfer Stamp Duties
State DutyIs paid for registration of ownership and encumbrances in the Land Book. The amount depends on transaction value and is a fixed sum laid down by law. For instance, duty for registering a new owner of real estate at a purchase price of EUR 500,000 is approx. EUR 767. Notary fees and state duty are usually less than 0.5 per cent of transaction value.
Stamp DutyNone.
Notary FeesFees are set by law. In sale transactions the fee for notarising the purchase agreement depends on the value of the transaction. For instance, the notary fee on sale of real estate for EUR 500,000 is approx. EUR 1,548 plus VAT. Notary fees and state duty are usually less than 0.5 per cent of transaction value.
Mortgage > Real estate purchase is often financed by a loan. Usually, a mortgage is established on real estate as security in favour of the bank financing the purchase. The mortgage agreement is usually concluded at the same time and in the same document as the sale agreement.
> If a mortgage already encumbers real estate before sale and the purchaser needs a mortgage for its own financing purposes, the existing mortgage is typically transferred to the bank financing payment of the purchase price. This transaction structure is more cost-efficient compared to deleting the existing mortgage and establishing a new one, since it saves on both notary fees and state duty.
Kaido Loor Partner, Head of the Tax & Customs TeamSORAINEN EstoniaPärnu mnt 15, 10141 TallinnPhone +372 6 400 [email protected]
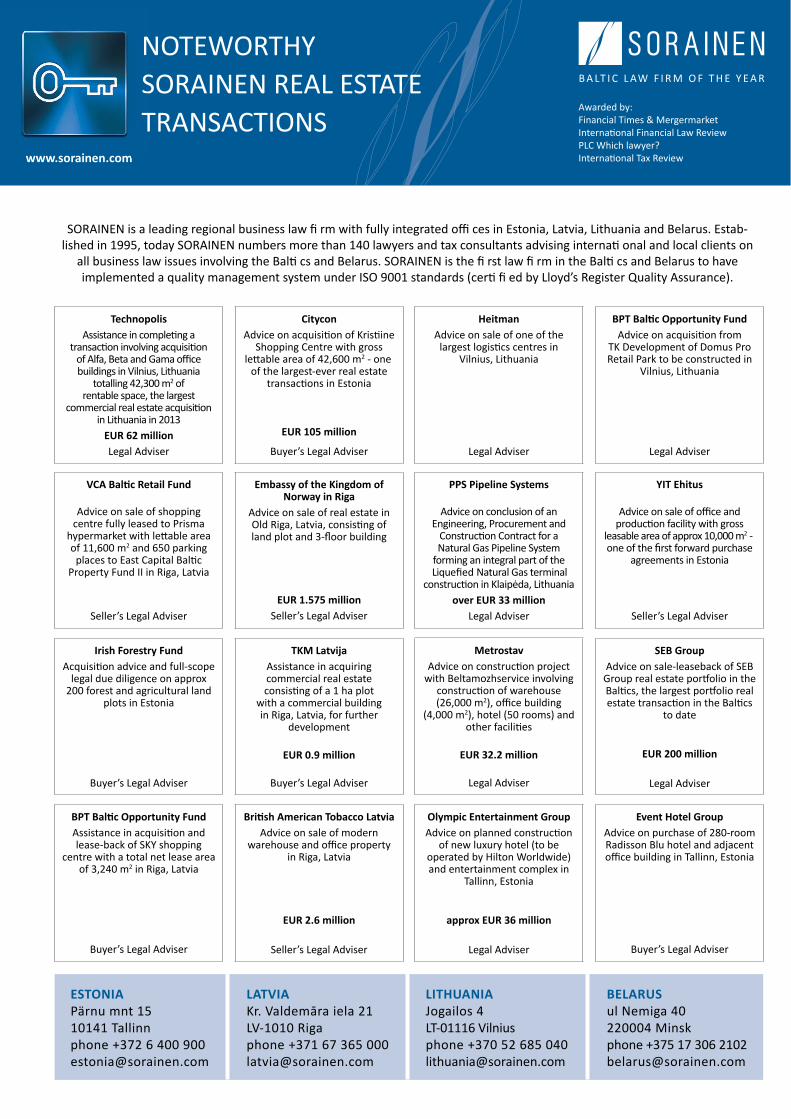
www.sorainen.com
B A LT I C L AW F I R M O F T H E Y E A R
Awarded by:Financial Times & Mergermarket Interna onal Financial Law Review PLC Which lawyer? Interna onal Tax Review
NOTEWORTHY SORAINEN REAL ESTATETRANSACTIONS
www sorainen com
NST
SORAINEN is a leading regional business law fi rm with fully integrated offi ces in Estonia, Latvia, Lithuania and Belarus. Estab-lished in 1995, today SORAINEN numbers more than 140 lawyers and tax consultants advising internati onal and local clients on
all business law issues involving the Balti cs and Belarus. SORAINEN is the fi rst law fi rm in the Balti cs and Belarus to have implemented a quality management system under ISO 9001 standards (certi fi ed by Lloyd’s Register Quality Assurance).
ESTONIAPärnu mnt 1510141 Tallinnphone +372 6 400 [email protected]
LATVIAKr. Valdemāra iela 21LV-1010 Rigaphone +371 67 365 [email protected]
LITHUANIAJogailos 4LT-01116 Vilniusphone +370 52 685 [email protected]
BELARUSul Nemiga 40220004 Minskphone +375 17 306 [email protected]
TechnopolisAssistance in comple ng a
transac on involving acquisi on of Alfa, Beta and Gama offi ce buildings in Vilnius, Lithuania
totalling 42,300 m2 of rentable space, the largest
commercial real estate acquisi on in Lithuania in 2013
EUR 62 millionLegal Adviser
Citycon Advice on acquisi on of Kris ine
Shopping Centre with gross le able area of 42,600 m2 - one
of the largest-ever real estate transac ons in Estonia
EUR 105 million
Buyer’s Legal Adviser
HeitmanAdvice on sale of one of the
largest logis cs centres in Vilnius, Lithuania
Legal Adviser
BPT Bal c Opportunity FundAdvice on acquisi on from
TK Development of Domus Pro Retail Park to be constructed in
Vilnius, Lithuania
Legal Adviser
VCA Bal c Retail Fund
Advice on sale of shopping centre fully leased to Prisma
hypermarket with le able area of 11,600 m2 and 650 parking
places to East Capital Bal c Property Fund II in Riga, Latvia
Seller’s Legal Adviser
Embassy of the Kingdom of Norway in Riga
Advice on sale of real estate in Old Riga, Latvia, consis ng of land plot and 3-� oor building
EUR 1.575 millionSeller’s Legal Adviser
PPS Pipeline Systems
Advice on conclusion of an Engineering, Procurement and
Construc on Contract for a Natural Gas Pipeline System
forming an integral part of the Liquefied Natural Gas terminal
construc on in Klaipėda, Lithuaniaover EUR 33 million
Legal Adviser
YIT Ehitus
Advice on sale of offi ce and produc on facility with gross
leasable area of approx 10,000 m2 - one of the � rst forward purchase
agreements in Estonia
Seller’s Legal Adviser
Irish Forestry FundAcquisi on advice and full-scope
legal due diligence on approx 200 forest and agricultural land
plots in Estonia
Buyer’s Legal Adviser
TKM Latvija Assistance in acquiring commercial real estate consis ng of a 1 ha plot
with a commercial building in Riga, Latvia, for further
development
EUR 0.9 million
Buyer’s Legal Adviser
MetrostavAdvice on construc on project
with Beltamozhservice involving construc on of warehouse (26,000 m2), offi ce building
(4,000 m2), hotel (50 rooms) and other facili es
EUR 32.2 million
Legal Adviser
SEB GroupAdvice on sale-leaseback of SEB
Group real estate por olio in the Bal cs, the largest por olio real estate transac on in the Bal cs
to date
EUR 200 million
Legal Adviser
BPT Bal c Opportunity FundAssistance in acquisi on and lease-back of SKY shopping
centre with a total net lease area of 3,240 m2 in Riga, Latvia
Buyer’s Legal Adviser
Bri sh American Tobacco LatviaAdvice on sale of modern
warehouse and offi ce property in Riga, Latvia
EUR 2.6 million
Seller’s Legal Adviser
Olympic Entertainment GroupAdvice on planned construc on
of new luxury hotel (to be operated by Hilton Worldwide) and entertainment complex in
Tallinn, Estonia
approx EUR 36 million
Legal Adviser
Event Hotel GroupAdvice on purchase of 280-room Radisson Blu hotel and adjacent offi ce building in Tallinn, Estonia
Buyer’s Legal Adviser
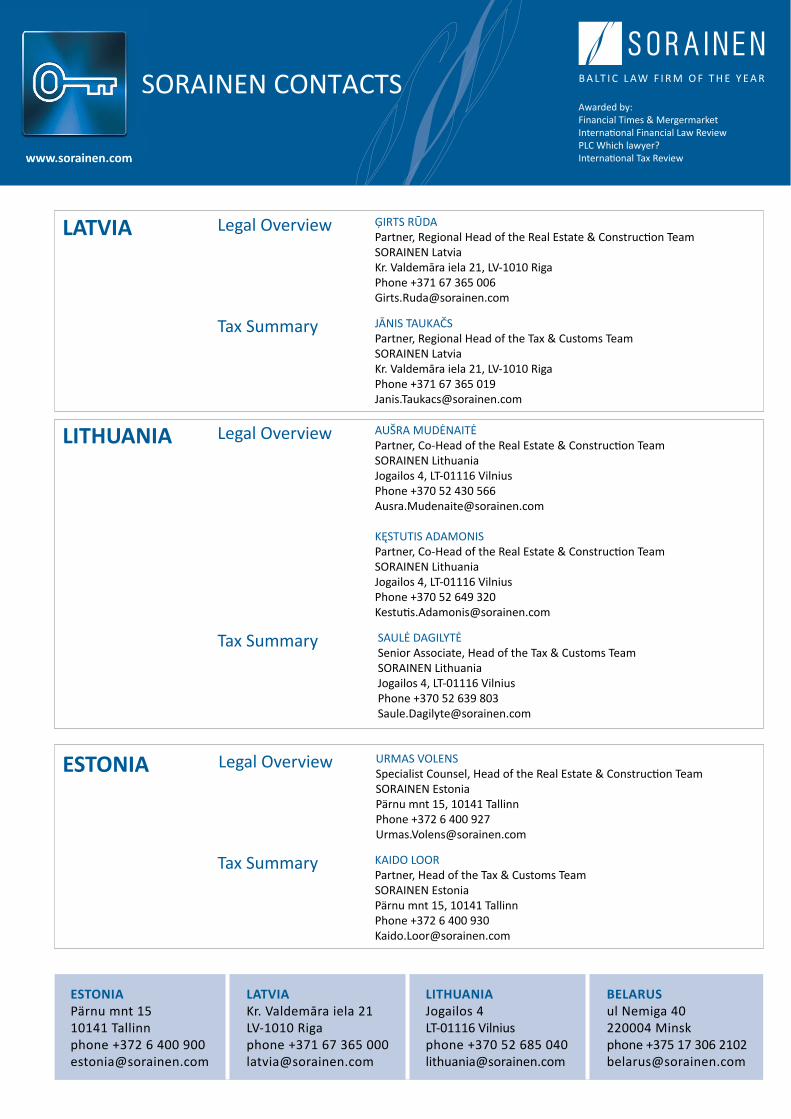
www.sorainen.com
B A LT I C L AW F I R M O F T H E Y E A R
Awarded by:Financial Times & Mergermarket Interna onal Financial Law Review PLC Which lawyer? Interna onal Tax Review
SORAINEN CONTACTS
www sorainen com
S
ESTONIAPärnu mnt 1510141 Tallinnphone +372 6 400 [email protected]
LATVIAKr. Valdemāra iela 21LV-1010 Rigaphone +371 67 365 [email protected]
LITHUANIAJogailos 4LT-01116 Vilniusphone +370 52 685 [email protected]
BELARUSul Nemiga 40220004 Minskphone +375 17 306 [email protected]
LATVIA ĢIRTS RŪDAPartner, Regional Head of the Real Estate & Construction TeamSORAINEN LatviaKr. Valdemāra iela 21, LV-1010 RigaPhone +371 67 365 [email protected]
JĀNIS TAUKAČSPartner, Regional Head of the Tax & Customs TeamSORAINEN LatviaKr. Valdemāra iela 21, LV-1010 RigaPhone +371 67 365 [email protected]
Legal Overview
Tax Summary
LITHUANIA AUŠRA MUDĖNAITĖPartner, Co-Head of the Real Estate & Construction Team SORAINEN LithuaniaJogailos 4, LT-01116 VilniusPhone +370 52 430 [email protected]
KĘSTUTIS ADAMONISPartner, Co-Head of the Real Estate & Construction Team SORAINEN LithuaniaJogailos 4, LT-01116 VilniusPhone +370 52 649 [email protected]
SAULĖ DAGILYTĖ Senior Associate, Head of the Tax & Customs Team SORAINEN LithuaniaJogailos 4, LT-01116 VilniusPhone +370 52 639 [email protected]
Legal Overview
Tax Summary
ESTONIA URMAS VOLENSSpecialist Counsel, Head of the Real Estate & Construction Team SORAINEN EstoniaPärnu mnt 15, 10141 TallinnPhone +372 6 400 [email protected]
KAIDO LOORPartner, Head of the Tax & Customs Team SORAINEN EstoniaPärnu mnt 15, 10141 TallinnPhone +372 6 400 [email protected]
Legal Overview
Tax Summary
Accelerating success.
Copyright © 2014 Colliers International.
The information contained herein has been obtained from sources deemed reliable. While every reasonable effort has been made to ensure its accuracy, we cannot guarantee it. No responsibility is assumed for any inaccuracies. Readers are encouraged to consult their professional advisors prior to acting on any of the material contained in this report.
About Colliers international
Colliers International is a global leader in commercial real estate services, with over 13,500 professionals operating out of more than 482 offices in 62 countries. A subsidiary of FirstService Corporation, Colliers International delivers a full range of services to real estate users, owners and investors worldwide, including global corporate solutions, brokerage, property and asset management, hotel investment sales and consulting, valuation, consulting and appraisal services, mortgage banking and insightful research. The latest annual survey by the Lipsey Company ranked Colliers International as the second-most recognized commercial real estate firm in the world.
colliers.com
482 offices in 62 countries on 6 continentsUnited States: 140 Canada: 42 Latin America: 20 Asia Pacific: 195 EMEA: 85
$2billion in annual revenue
1.12billion square feet under management
13,500professionals and staff
Authors:
Deniss kairans | Partner, Managing DirectorColliers International Advisors | Latvia Office
K. Valdemara Street 21 Riga | Latvia Phone +371 6778 3333Fax +371 6778 3334E-mail [email protected] www.colliers.com
Ramune Askiniene | Partner, Managing DirectorColliers International Advisors | Lithuania Office
A. Gostauto Street 40B Vilnius | Lithuania Phone +370 5 249 1212Fax +370 5 249 1211E-mail [email protected] www.colliers.com
Avo Roomussaar | Partner, Managing DirectorColliers International Advisors | Estonia Office
Lootsa 2a Tallinn | Estonia Phone +372 6160 777Fax +372 6160 771E-mail [email protected]