real estate office - zacks investment research: stock research
TRANSCRIPT

Skyline broker survey suggests strong leasing activity carrying into 2H13. We expect
that strong Office employment gains over the trailing three-month (+1.9% ann.) and
twelve-month (+1.9%) periods led by technology and business services should continue to
support positive absorption and enhanced net effective rent growth for Office. In particular,
we are incrementally positive on HIW, PKY and CUZ given the positive assessments
regarding tenant size, geography and amenities that are driving the greatest among of
tenant leasing activity.
■ Baird Skyline. Our survey of top Office leasing brokers suggests strong activity in
Secondary U.S. metropolitan areas--driven primarily by smaller footprint tenants--that is
resulting in incrementally better net effective rents. We expect that HIW, PKY and CUZ
should be primary beneficiaries of the trends noted in our detailed write-up that follows.
■ Key Takeaways From Broker Commentary Include:
- Small tenants continue to drive market activity. Tenants seeking 10-25k spaces
are driving market activity higher and reflect greater incremental volume from the
5-10k average lease size 12 months ago. Value-oriented spaces in live, work and play
environments remain most active. Energy, technology and housing remain active
drivers of absorption.
- Net effective rents are improving across most major markets. While face rents
are moving higher in a small number of markets, declining free rent periods (now a
1mo./yr) are driving effective rents higher across most major metro areas.
- Densification active among professional services firms. Despite broader
management commentary regarding a moderation in the trend toward downsizing, it
appears that legal, accounting and financial firms continue to drive "densification" in
renewals and intra-market relocations. Parking, however, is limiting some of the
densification that tenants would like to achieve.
- "For Rent" amenities increasingly attractive to tenants. Building renovations that
include "For Rent" conference facilities (as well as traditional amenities including
on-site food and fitness) are attracting tenants seeking to minimize space utilization.
- Office development limited by Multifamily, Hotel activity. Although most U.S.
metro areas do not yet support speculative Office development, the strongest of
geographies are experiencing heavy competition for land and redevelopment from
Multifamily and Hotel builders/operators.
■ Most intriguing comment: Restroom size is a limiting factor for tenant densification
and is incrementally important in negotiations. [San Diego suburbs]
■ Office employment favors Secondary markets. While few investors are likely to be
surprised that Houston, Austin and Dallas are in the "Top 10" metro areas for 3-month
and 12-month Office employment growth, these cities are joined by Nashville, Denver
and L.A. in both categories as well.
INDUSTRY UPDATE
Prices as of 7/8/13
Ticker PriceMkt Cap
(mil)Rating Risk
DRE $15.74 $5,075 O A
FPO $13.63 $724 N H
FSP $13.50 $1,119 O A
IRET $8.69 $1,027 N A
OFC $26.22 $2,237 O A
PDM $18.29 $3,069 O A
SLG $90.81 $8,563 N A
WRE $27.07 $1,800 O A
Baird covered companies
July 9, 2013 Baird Equity ResearchReal Estate
Real Estate OfficeSkyline: Broker Comments Suggest Office Leasing Fundamentals Improving
David B. Rodgers, CFA
216.737.7341
Jonathan Pong
203.425.2740
Mathew R. Spencer
414.298.5053
[Please refer to Appendix- Important Disclosuresand Analyst Certification]

July 9, 2013 | Real Estate Office
Employment Growth by Market
Total Estimated Change In Office Employment - 3-Month Total Estimated Change In Office Employment - 12-Month
Prof. & Business Services Employment 2.7% Prof. & Business Services Employment 4.2%
Information Employment 2.2% Information Employment 1.9%
Total Office 1.9% Total Office 1.9%
Government Employment 1.9% Financial Employment 1.5%
Other Services Employment 1.3% Other Services Employment 1.4%
Financial Employment 0.5% Government Employment -0.3%
Source: BLS and Baird Research. Source: BLS and Baird Research.
Total Office Employment -- 3-Month Change Total Office Employment -- 12-Month Change
Nashville 3.3% Nashville 5.4%
Denver 3.2% San Francisco 4.3%
Pittsburgh 3.2% Dallas 4.2%
Los Angeles 2.9% Raleigh 3.9%
Charlotte 2.9% Denver 3.8%
Houston 2.6% Houston 3.1%
Austin 2.6% Austin 3.1%
Dallas 2.4% Boston 3.0%
Chicago 2.4% Los Angeles 2.5%
Baltimore 2.3% San Diego 2.5%
Tampa 2.1% Tampa 2.2%
New York City 1.8% Seattle 2.1%
Boston 1.8% Pittsburgh 2.1%
Philadelphia 1.7% Norfolk 1.9%
Raleigh 1.7% Charlotte 1.9%
Triad 1.7% Atlanta 1.9%
Atlanta 1.6% Phoenix 1.8%
Norfolk 1.5% Chicago 1.6%
Phoenix 1.5% Minneapolis 1.6%
Minneapolis 1.4% Memphis 1.3%
San Diego 1.4% Washington, D.C. 1.2%
Washington, D.C. 1.4% Jacksonville 1.0%
Miami 1.2% Baltimore 0.9%
Memphis 1.1% New York City 0.7%
Richmond 1.1% Richmond 0.5%
Jacksonville 1.0% Philadelphia 0.3%
Seattle 0.9% Miami 0.1%
San Francisco 0.7% Triad -0.9%
Total Office Employment 1.9% Total Office Employment 1.9%
Source: BLS and Baird Research. Source: BLS and Baird Research.
Details
2Robert W. Baird & Co.

July 9, 2013 | Real Estate Office
Atlanta
Solid leasing activity in ATL, picked up significantly in the past 12 months
Tenant negotiations remain protracted First time in five years tenants are doing expansion leases
Businesses are expanding operations and hiring new workers Current space cannot hold new employee hires
Flight to quality window is over Landlords are holding rents for high-quality space Rental rates in high-quality space have priced out deal seekers
Rental rates are trickling up, Central Perimeter and Buckhead to benefit Bullish commentary on rental rates from brokers
Expectation is for 5% y/y growth in rental rates (forecast) ’14 could see significant increases due to limited blocks of space
Positive environment could help increase future leasing budgets Brokers are trying to get deals done this year
Buckhead and Central Perimeter markets are peaking tenant interests Could see incremental activity in these submarkets Rental rates are set to outpace the overall market Expectation for lower TIs from the current ~$35/SF (10-yr term)
Corporate relocations are occurring in Atlanta State Farm is looking to build 800k SF in the Central Perimeter Coke is moving its IT group downtown; 250k SF AIG is looking at the North Fulton submarket for its 300k SF roll 2016 Pulte Homes is relocating to Buckhead; 100k SF
Barriers are limiting development activity No new major developments currently Developers are no longer able to underwrite spec projects Spec activity in ’07 is now full and is no longer pressuring the market
Densification trend will continue; parking employees could be a challenge SF/employee will continue to go down Parking the employees will be a challenge, focus in negotiations
Key amenities are allowing tenants to use space more efficiently Large conferencing facilities available for rent are in popular demand
The facilities can hold 50-60 people Available for rent on a per-use basis Reduces space needs for tenants Increases space efficiency for tenants
Atlanta
Office SF % of TotalCUZ 4,757,000 40.2%PKY 2,019,122 17.0%GOV 947,759 9.3%FSP 773,870 8.4%PDM 1,062,521 5.0%HIW 1,203,888 3.5%DRE 582,177 0.4%CWH 244,000 0.3%
Source: SNL Financial and Baird research
3Robert W. Baird & Co.

Baird's Skyline
Atlanta Office Market Fundamentals -- Central Business District (CBD)
Class A Class B Total
Size Of Atlanta Office Market (MSF) 48.4 26.8 75.3
% of total market 64.3% 35.7% 100.0%
Office Employment, Estimated ('000) 222.0 136.3 358.2
1-year historical employment growth 1.4%
5-year historical employment growth -0.3%
10-year historical employment growth 0.8%
Vacancy (%) 18.5% 9.7% 15.4%
Direct 17.3% 9.4% 14.4%
Sublet 1.2% 0.3% 0.9%
Effective Rents ($/SF) $23.65 $18.61 $21.85
1-year historical rent growth 0.0% 4.3% 1.5%
5-year historical rent growth 0.6% 0.5% 0.6%
10-year historical rent growth -0.1% -0.7% -0.3%
Vacancy Change Needed For Rent Growth 6.4%
SF of Absorption Needed For Equilibrium (MSF) 4.1
Employment Needed For Equilibrium 23,065
Office Employment Growth Needed For Equilibrium 6.4%
Estimated Time To Reach Market Equilibrium (yrs) 1.7
Current Replacement Cost $283
Acquisition Cost Estimate $209 $149 $187
Discount To Replacement Cost 26.1% 47.4% 33.7%
Current Development Yield 7.0%
Current Acquisition Yield 7.0% 8.0% 7.4%
Public REIT Exposure SF ('000) % of port.
CUZ 4,217 35.7%
PKY 1,263 10.7%
GOV 948 9.3%
HIW 492 1.4%
DRE 436 0.3%
CWH 164 0.2%
Vacancy, Rent & Construction Analysis
Source: Bureau of Labor Statistics, CoStar, and Baird estimates Source: Bureau of Labor Statistics, CoStar, and Baird estimates
Source: CoStar and Baird Research Source: CoStar and Baird Research
Development Yield & Replacement Cost Analysis
Source: CoStar and Baird estimates Source: CBRE, Colliers, Grubb & Ellis, Jones Lang LaSalle, Real Capital Analytics, RSMeans, and
Baird estimates
ATL Employment BreakdownATL Statistics at a Glance -- CBD
ATL Development Yield -- CBD ATL Replacement Cost & Historical Trades -- CBD
ATL Vacancy & Employment ATL Demand Requirement For Equilibrium -- CBD
ATL Vacancy & Effective Rents -- CBD ATL Vacancy & Annualized New Construction -- CBD
0%
1%
2%
3%
4%
5%
6%
7%
8%
9%
10%
0.0%
2.0%
4.0%
6.0%
8.0%
10.0%
12.0%
14.0%
16.0%
18.0%
20.0%
1Q
98
3Q
98
1Q
99
3Q
99
1Q
00
3Q
00
1Q
01
3Q
01
1Q
02
3Q
02
1Q
03
3Q
03
1Q
04
3Q
04
1Q
05
3Q
05
1Q
06
3Q
06
1Q
07
3Q
07
1Q
08
3Q
08
1Q
09
3Q
09
1Q
10
3Q
10
1Q
11
3Q
11
1Q
12
3Q
12
Rep
lacem
en
t Y
ield
& 1
0-Y
ea
r
Sp
rea
d
New
Co
nstr
ucti
on
, %
Of
Exis
tin
g
Sto
ck, A
nn
ua
lized
Class A Starts Class A Replacement Yield Dev Spread To 10-YR
0%
15%
30%
45%
60%
75%
90%
$0
$50
$100
$150
$200
$250
$300
1980
1981
1982
1983
1984
1985
1986
1987
1988
1989
1990
1991
1992
1993
1994
1995
1996
1997
1998
1999
2000
2001
2002
2003
2004
2005
2006
2007
2008
2009
2010
2011
Dis
co
un
t T
o R
ep
lacem
en
t C
ost
Asset
Va
lue (
$/S
F)
% discount - Class A % discount - Class B Replacement CostTrading Price Class A Trading Price Class B
0%
3%
6%
9%
12%
15%
18%
21%
24%
27%
$0
$2
$4
$6
$8
$10
$12
$14
$16
$18
1Q
98
3Q
98
1Q
99
3Q
99
1Q
00
3Q
00
1Q
01
3Q
01
1Q
02
3Q
02
1Q
03
3Q
03
1Q
04
3Q
04
1Q
05
3Q
05
1Q
06
3Q
06
1Q
07
3Q
07
1Q
08
3Q
08
1Q
09
3Q
09
1Q
10
3Q
10
1Q
11
3Q
11
1Q
12
3Q
12
1Q
13 Va
ca
nc
y (
Dir
ec
t &
In
dir
ec
t) -
- B
ars
Eff
ec
tive
Re
nts
($
/ S
F)
-- L
ine
s
Vacancy, Total, Class A Vacancy, Total, Class B Effective Rent, Class A Effective Rent, Class B
0%
5%
10%
15%
20%
25%
1Q
98
3Q
98
1Q
99
3Q
99
1Q
00
3Q
00
1Q
01
3Q
01
1Q
02
3Q
02
1Q
03
3Q
03
1Q
04
3Q
04
1Q
05
3Q
05
1Q
06
3Q
06
1Q
07
3Q
07
1Q
08
3Q
08
1Q
09
3Q
09
1Q
10
3Q
10
1Q
11
3Q
11
1Q
12
3Q
12
1Q
13
Va
ca
nc
y (
Dir
ec
t &
In
dir
ec
t)
Vacancy, Direct, Class A Vacancy, Indirect, Class A Class A Starts
-9.0
-6.0
-3.0
0.0
3.0
6.0
9.0
-45,000
-30,000
-15,000
0
15,000
30,000
45,000
1Q
98
3Q
98
1Q
99
3Q
99
1Q
00
3Q
00
1Q
01
3Q
01
1Q
02
3Q
02
1Q
03
3Q
03
1Q
04
3Q
04
1Q
05
3Q
05
1Q
06
3Q
06
1Q
07
3Q
07
1Q
08
3Q
08
1Q
09
3Q
09
1Q
10
3Q
10
1Q
11
3Q
11
1Q
12
3Q
12
1Q
13
SF
Of
Ab
so
rpti
on
Ne
ed
ed
Fo
r R
en
t G
row
th -
- B
ars
(In
Millio
ns)
Em
plo
ye
es N
ee
de
d T
o A
bso
rb S
F
To
Va
ca
nc
y E
qu
ilib
riu
m -
- L
ine
-15.0%
-10.0%
-5.0%
0.0%
5.0%
10.0%
15.0%
0%
5%
10%
15%
20%
25%
30%
1Q
98
3Q
98
1Q
99
3Q
99
1Q
00
3Q
00
1Q
01
3Q
01
1Q
02
3Q
02
1Q
03
3Q
03
1Q
04
3Q
04
1Q
05
3Q
05
1Q
06
3Q
06
1Q
07
3Q
07
1Q
08
3Q
08
1Q
09
3Q
09
1Q
10
3Q
10
1Q
11
3Q
11
1Q
12
3Q
12
1Q
13
Em
plo
ym
en
t G
row
th -
- T
railin
g
Fo
ur
Qu
art
er
YO
Y G
row
th
Va
ca
nc
y (
Dir
ec
t &
In
dir
ec
t)
Vacancy, Direct -- Total Vacancy, Indirect -- Total Employment Growth
Trade Transportation and
Utilities 23%
Professional and Business Services
18%
Government 13%
Education and Health Services
12%
Leisure and Hospitality
10%
Manufacturing 6%
Financial Activities 6%
Other Services 4%
Construction 4%
Information 4%
4Robert W. Baird & Co.

July 9, 2013 | Real Estate Office
Austin
White-hot market has cooled off a bit from 12 months prior
Activity has fallen off some from the really hot period a year ago Market is still healthy, but has leveled off to a steady pace Southwest submarket is the healthiest in the MSA Average deal size is 5-7k SF
Rental rates continue to climb upward Rental rates are at or close to replacement rents TPGI has controlled the CBD market and is setting rates
Low $30/NNN rental rates for high-quality space Overall CBD market is realizing $25-30/NNN rental rates New lease TIs of $3.5/SF/yr Renewal lease TIs of $2.5/SF/yr Free rent is 1 mo/3 years of lease term
Southwest market is realizing rents in the $23-24/SF range New lease TIs of $3/SF/yr Renewal lease TIs of $2/SF/yr Free rent is around 1 mo/4 years of lease term
Northwest market is achieving $20-22/SF rents TI package is similar to the Southwest Free rent is around 1 mo/2 years of lease term
Tech and Social Media are driving CBD; Financials and Law firms are flat Tech/Social Media firms are driving the growth downtown Financials and Law Firms are steady with no growth
Two Law Firms leased space at CUZ’s CBD development Vacancy and replacement rental rates justify construction
Expectation is for increased development given a relatively tight market Low vacancy percentage
Southwest market will likely see a lot of construction activity Recent deal rates are at replacement rents
Apple bought land near existing campus; building 300k SF Two development projects in the CBD including Colorado Tower
Multifamily and Hotel competition for parking could limit densification MF and Hotels have swallowed a lot of the good sites and parking lots Offsite parking options are limited Densification will likely be limited by parking options
Tenants are hoping employees will live downtown MF rental rates are $3/SF/mo Pricing some of the employees out of the CBD market
Austin
Office SF % of TotalTPGI 2,615,749 24.9%BDN 1,626,811 5.1%PDM 195,230 0.9%CWH 170,052 0.2%
Source: SNL Financial and Baird research
5Robert W. Baird & Co.

July 9, 2013 | Real Estate Office
Boston
Boston is starting to become a landlord’s market
Leasing activity has increased quite a bit with more tenants in the market Faster negotiation times shifting towards the landlords’ favor Market is being driven by 10-30k SF tenants
A lot of 5k SF tenants going to 10-15k SF Larger institutional tenants are shrinking floor plates Tenants are moving downtown from neighboring suburbs Class B office space is “hot” along with Class A low-rise space
Class A rents are going up, Sea Port rents have gone up 20-30% Back Bay rents were the first to increase with pricing being very high
Landlords are being patient to achieve desired pricing Sea Port rents have gone up 20-30% and is an “unbelievably hot market” Financial District submarket is starting to see rents creep up
Tenants are looking for value right now Only “value space” available is in the Financial District
Suburbs TIs are ~$40/SF for a 10-year lease Small Tech firms are growing organically, driving the overall market health
5k SF Tech firms are growing rapidly and require more space needs I.e. DataXu Inc. going from 5k SF to ~30k SF
Tech firms are also moving from Cambridge/suburbs to CBD Sea Port and suburbs likely to see build-to-suit developments
Big users are looking at the Sea Port for BTS opportunities PWC is a likely candidate for a BTS or move into the Sea Port
Moving from 125 High St., owned by Tishman Speyer 291k SF in the building, going to potentially 350k SF
Sea Port could begin to see infrastructure issues ~10k employees to move to the area Needs improvements to transportation/parking options
Large blocks of space in the suburbs are “not great” Will likely lead to build-to-suit projects
Work, live, play in full swing for Boston Tenants are looking for proximity of entertainment for employees
Need to be close to the excitement; bars, food, shopping BXP is looking to convert to more ground floor retail at 100 Federal St.
Will be much needed for the area Brown Brothers Harriman & Co. is moving nearby
Access to public transportation is important in making a leasing decision
Boston
Office SF % of TotalBXP 13,055,187 30.9%PDM 1,294,307 6.1%SIR 495,967 2.0%BPO 1,032,000 1.3%CWH 448,723 0.6%
Source: SNL Financial and Baird research
6Robert W. Baird & Co.

Baird's Skyline
Boston Office Market Fundamentals -- Central Business District (CBD)
Class A Class B Total
Size Of Boston Office Market (MSF) 71.2 39.1 110.3
% of total market 64.6% 35.4% 100.0%
Office Employment, Estimated ('000) 274.1 154.4 428.5
1-year historical employment growth 3.4%
5-year historical employment growth 0.5%
10-year historical employment growth 0.4%
Vacancy (%) 10.8% 8.4% 8.8%
Direct 10.1% 8.3% 8.4%
Sublet 0.7% 0.1% 0.4%
Effective Rents ($/SF) $44.01 $28.50 $38.52
1-year historical rent growth 3.2% 9.1% 5.3%
5-year historical rent growth 1.1% 0.7% 0.9%
10-year historical rent growth -0.5% -1.6% -0.9%
Vacancy Change Needed For Rent Growth 0.0%
SF of Absorption Needed For Equilibrium (MSF) 1.0
Employment Needed For Equilibrium 4,442
Office Employment Growth Needed For Equilibrium 1.0%
Estimated Time To Reach Market Equilibrium (yrs) 0.1
Current Replacement Cost $500
Acquisition Cost Estimate $521 $354 $462
Discount To Replacement Cost -4.1% 29.2% 7.7%
Current Development Yield 7.2%
Current Acquisition Yield 4.4% 4.5% 4.4%
Public REIT Exposure SF ('000) % of port.
BXP 6,378 15.1%
BPO 1,032 1.3%
CWH 133 0.2%
Vacancy, Rent & Construction Analysis
Source: Bureau of Labor Statistics, CoStar, and Baird estimates Source: Bureau of Labor Statistics, CoStar, and Baird estimates
Source: CoStar and Baird Research Source: CoStar and Baird Research
Development Yield & Replacement Cost Analysis
Source: CoStar and Baird estimates Source: CBRE, Colliers, Grubb & Ellis, Jones Lang LaSalle, Real Capital Analytics, RSMeans, and Baird estimates
BOS Employment BreakdownBOS Statistics at a Glance -- CBD
BOS Development Yield -- CBD BOS Replacement Cost & Historical Trades -- CBD
BOS Vacancy & Employment BOS Demand Requirement For Equilibrium -- CBD
BOS Vacancy & Effective Rents -- CBD BOS Vacancy & Annualized New Construction -- CBD
Education and Health Services
21%
Professional and Business Services
17%
Trade Transportation and
Utilities 16%
Government 12%
Leisure and Hospitality
9%
Manufacturing 8%
Financial Activities 7%
Other Services 4%
Construction 3%
Information 3%
0%
2%
4%
6%
8%
10%
12%
14%
16%
18%
20%
0.0%
2.0%
4.0%
6.0%
8.0%
10.0%
12.0%
14.0%
16.0%
18.0%
20.0%
1Q
98
3Q
98
1Q
99
3Q
99
1Q
00
3Q
00
1Q
01
3Q
01
1Q
02
3Q
02
1Q
03
3Q
03
1Q
04
3Q
04
1Q
05
3Q
05
1Q
06
3Q
06
1Q
07
3Q
07
1Q
08
3Q
08
1Q
09
3Q
09
1Q
10
3Q
10
1Q
11
3Q
11
1Q
12
3Q
12
1Q
13
Rep
lacem
en
t Y
ield
& 1
0-Y
ear
S
pre
ad
New
Co
nstr
ucti
on
, %
Of
Exis
tin
g
Sto
ck, A
nn
uali
zed
Class A Starts Class A Replacement Yield Dev Spread To 10-YR
0%
15%
30%
45%
60%
75%
90%
$0
$100
$200
$300
$400
$500
$600
1980
1981
1982
1983
1984
1985
1986
1987
1988
1989
1990
1991
1992
1993
1994
1995
1996
1997
1998
1999
2000
2001
2002
2003
2004
2005
2006
2007
2008
2009
2010
2011
Dis
co
un
t T
o R
ep
lacem
en
t C
ost
Asset
Valu
e (
$/S
F)
% discount - Class A % discount - Class B Replacement CostTrading Price Class A Trading Price Class B
0%
3%
6%
9%
12%
15%
18%
21%
24%
$0
$5
$10
$15
$20
$25
$30
$35
$40
1Q
98
3Q
98
1Q
99
3Q
99
1Q
00
3Q
00
1Q
01
3Q
01
1Q
02
3Q
02
1Q
03
3Q
03
1Q
04
3Q
04
1Q
05
3Q
05
1Q
06
3Q
06
1Q
07
3Q
07
1Q
08
3Q
08
1Q
09
3Q
09
1Q
10
3Q
10
1Q
11
3Q
11
1Q
12
3Q
12
1Q
13 V
acan
cy (
Dir
ect &
In
dir
ect)
--
Bars
Eff
ecti
ve R
en
ts (
$ / S
F)
-- L
ines
Vacancy, Total, Class A Vacancy, Total, Class B Effective Rent, Class A Effective Rent, Class B
0%
5%
10%
15%
20%
25%
1Q
98
3Q
98
1Q
99
3Q
99
1Q
00
3Q
00
1Q
01
3Q
01
1Q
02
3Q
02
1Q
03
3Q
03
1Q
04
3Q
04
1Q
05
3Q
05
1Q
06
3Q
06
1Q
07
3Q
07
1Q
08
3Q
08
1Q
09
3Q
09
1Q
10
3Q
10
1Q
11
3Q
11
1Q
12
3Q
12
1Q
13
Vacan
cy (
Dir
ect &
In
dir
ect)
Vacancy, Direct, Class A Vacancy, Indirect, Class A Class A Starts
-9.0
-6.0
-3.0
0.0
3.0
6.0
9.0
-30,000
-20,000
-10,000
0
10,000
20,000
30,000
1Q
98
3Q
98
1Q
99
3Q
99
1Q
00
3Q
00
1Q
01
3Q
01
1Q
02
3Q
02
1Q
03
3Q
03
1Q
04
3Q
04
1Q
05
3Q
05
1Q
06
3Q
06
1Q
07
3Q
07
1Q
08
3Q
08
1Q
09
3Q
09
1Q
10
3Q
10
1Q
11
3Q
11
1Q
12
3Q
12
1Q
13 S
F O
f A
bso
rpti
on
Need
ed
Fo
r R
en
t G
row
th -
- B
ars
(In
Mil
lio
ns)
Em
plo
yees N
eed
ed
To
Ab
so
rb S
F
To
Vacan
cy E
qu
ilib
riu
m -
- L
ine
-15.0%
-10.0%
-5.0%
0.0%
5.0%
10.0%
15.0%
0%
5%
10%
15%
20%
25%
30%
1Q
98
3Q
98
1Q
99
3Q
99
1Q
00
3Q
00
1Q
01
3Q
01
1Q
02
3Q
02
1Q
03
3Q
03
1Q
04
3Q
04
1Q
05
3Q
05
1Q
06
3Q
06
1Q
07
3Q
07
1Q
08
3Q
08
1Q
09
3Q
09
1Q
10
3Q
10
1Q
11
3Q
11
1Q
12
3Q
12
1Q
13 Em
plo
ym
en
t G
row
th -
- T
rail
ing
F
ou
r Q
uart
er
YO
Y G
row
th
Vacan
cy (
Dir
ect &
In
dir
ect)
Vacancy, Direct -- Total Vacancy, Indirect -- Total Employment Growth
7Robert W. Baird & Co.

July 9, 2013 | Real Estate Office
Charlotte
Activity is really good right now in Charlotte
A lot of companies coming into the market including: MetLife
500k SF requirement bringing 1400 jobs to the city Chiquita Brands United Technologies
Tenants are demanding more space and longer terms Average deal size in the suburbs was 5-10k SF, now 10-12k SF In Uptown was 15-20k SF and that is getting bigger as well
Both the suburbs and CBD are experiencing solid leasing activity Strong rental rates and lower concessions are being realized
Rental rates declined 20-30% in downturn, now back to that level Uptown and SouthPark
TIs were $40/SF 24 months ago, now $30/SF Free rent is 0.5-months/year
The one market where Financial Services firms are growing Demand drivers in the market include Energy and Financial Services Tenants are looking for a mixed-use type environment Employees still want to work close to home
Suburbs/CBD are both doing well due to this trend Definitely getting more dense
Charlotte is experiencing the National market trend of densification Recent lease started at 4 employees/1,000 SF; signed at 7/1,000 SF
Charlotte
Office SF % of TotalPKY 1,693,182 14.3%CUZ 1,065,000 9.0%FSP 171,886 1.9%
Source: SNL Financial and Baird research
8Robert W. Baird & Co.

July 9, 2013 | Real Estate Office
Chicago
Leasing activity has slowed after working through pent-up demand
Leasing activity has slowed over the past 6-12 months The pent-up demand is gone and companies are not growing rapidly Not many large deals out in the market today Small- and Mid-size deals are what’s driving the market
5k SF tenants are going to 25k SF Demand is coming from new economy-based companies
Tenants are moving up in building quality; a flight to quality Buildings that have had improvements are performing better
Negotiation times are speeding up slightly Tenants are more comfortable with business environment
Image and location are important in signing leases New developments should perform well despite overall market vacancy
McDermott Will & Emery signed a 225k SF lease at 444 W. Lake William Blair is entering the market soon DLA Piper is a likely candidate for a development
Location and space efficiency is key for tenants Tenants want the image, location and newness at their location
Large floor plates near transportation could be top performers in market 111 North Canal is a loft-type building in a good location
Can accommodate large floor plate users in the 50k SF range Tech companies are looking for this type of space
Merchandise Mart Complex is very attractive for similar reasons
Chicago
Office SF % of TotalPDM 4,972,538 23.5%FSP 746,709 8.1%CWH 3,923,656 5.0%GOV 57,770 0.6%DRE 99,538 0.1%
Source: SNL Financial and Baird research
9Robert W. Baird & Co.

Baird's Skyline
Chicago Office Market Fundamentals -- Central Business District (CBD)
Class A Class B Total
Size Of Chicago Office Market (MSF) 83.0 68.5 151.5
% of total market 54.8% 45.2% 100.0%
Office Employment, Estimated ('000) 433.8 370.4 804.2
1-year historical employment growth 1.5%
5-year historical employment growth -0.6%
10-year historical employment growth 0.1%
Vacancy (%) 15.0% 12.1% 12.9%
Direct 13.8% 11.1% 12.0%
Sublet 1.2% 1.1% 0.8%
Effective Rents ($/SF) $30.34 $27.35 $28.99
1-year historical rent growth -2.3% 5.7% 1.3%
5-year historical rent growth 0.1% 3.8% 1.8%
10-year historical rent growth -0.4% 0.7% 0.1%
Vacancy Change Needed For Rent Growth 2.9%
SF of Absorption Needed For Equilibrium (MSF) 5.6
Employment Needed For Equilibrium 34,724
Office Employment Growth Needed For Equilibrium 4.3%
Estimated Time To Reach Market Equilibrium (yrs) 1.4
Current Replacement Cost $346
Acquisition Cost Estimate $413 $179 $307
Discount To Replacement Cost -19.2% 48.3% 11.4%
Current Development Yield 8.9%
Current Acquisition Yield 4.8% 8.3% 6.4%
Public REIT Exposure SF ('000) % of port.
PDM 3,654 17.2%
CWH 3,591 4.6%
FSP 375 4.1%
Vacancy, Rent & Construction Analysis
Source: Bureau of Labor Statistics, CoStar, and Baird estimates Source: Bureau of Labor Statistics, CoStar, and Baird estimates
Source: CoStar and Baird Research Source: CoStar and Baird Research
Development Yield & Replacement Cost Analysis
Source: CoStar and Baird estimates Source: CBRE, Colliers, Grubb & Ellis, Jones Lang LaSalle, Real Capital Analytics, RSMeans, and Baird estimates
CHI Employment BreakdownCHI Statistics at a Glance -- CBD
CHI Development Yield -- CBD CHI Replacement Cost & Historical Trades -- CBD
CHI Vacancy & Employment CHI Demand Requirement For Equilibrium -- CBD
CHI Vacancy & Effective Rents -- CBD CHI Vacancy & Annualized New Construction -- CBD
Trade Transportation and
Utilities 21%
Professional and Business Services
17%
Education and Health Services
15%
Government 13%
Leisure and Hospitality
9%
Manufacturing 9%
Financial Activities 7%
Other Services 4%
Construction 3%
Information 2%
0%
1%
2%
3%
4%
5%
6%
7%
8%
9%
10%
0.0%
2.0%
4.0%
6.0%
8.0%
10.0%
12.0%
14.0%
16.0%
18.0%
20.0%
1Q
98
3Q
98
1Q
99
3Q
99
1Q
00
3Q
00
1Q
01
3Q
01
1Q
02
3Q
02
1Q
03
3Q
03
1Q
04
3Q
04
1Q
05
3Q
05
1Q
06
3Q
06
1Q
07
3Q
07
1Q
08
3Q
08
1Q
09
3Q
09
1Q
10
3Q
10
1Q
11
3Q
11
1Q
12
3Q
12
1Q
13
Rep
lacem
en
t Y
ield
& 1
0-Y
ea
r
Sp
rea
d
Ne
w C
on
str
ucti
on
, %
Of
Exis
tin
g
Sto
ck, A
nn
ua
lized
Class A Starts Class A Replacement Yield Dev Spread To 10-YR
0%
15%
30%
45%
60%
75%
90%
$0
$100
$200
$300
$400
$500
$600
1980
1981
1982
1983
1984
1985
1986
1987
1988
1989
1990
1991
1992
1993
1994
1995
1996
1997
1998
1999
2000
2001
2002
2003
2004
2005
2006
2007
2008
2009
2010
2011
Dis
co
un
t T
o R
ep
lacem
en
t C
ost
Asset
Va
lue (
$/S
F)
% discount - Class A % discount - Class B Replacement CostTrading Price Class A Trading Price Class B
0%
5%
10%
15%
20%
25%
$0
$5
$10
$15
$20
$25
1Q
98
3Q
98
1Q
99
3Q
99
1Q
00
3Q
00
1Q
01
3Q
01
1Q
02
3Q
02
1Q
03
3Q
03
1Q
04
3Q
04
1Q
05
3Q
05
1Q
06
3Q
06
1Q
07
3Q
07
1Q
08
3Q
08
1Q
09
3Q
09
1Q
10
3Q
10
1Q
11
3Q
11
1Q
12
3Q
12
1Q
13 Va
ca
nc
y (
Dir
ec
t &
In
dir
ec
t) -
- B
ars
Eff
ecti
ve R
en
ts (
$ / S
F)
-- L
ines
Vacancy, Total, Class A Vacancy, Total, Class B Effective Rent, Class A Effective Rent, Class B
0%
5%
10%
15%
20%
25%
1Q
98
3Q
98
1Q
99
3Q
99
1Q
00
3Q
00
1Q
01
3Q
01
1Q
02
3Q
02
1Q
03
3Q
03
1Q
04
3Q
04
1Q
05
3Q
05
1Q
06
3Q
06
1Q
07
3Q
07
1Q
08
3Q
08
1Q
09
3Q
09
1Q
10
3Q
10
1Q
11
3Q
11
1Q
12
3Q
12
1Q
13
Va
ca
nc
y (
Dir
ec
t &
In
dir
ec
t)
Vacancy, Direct, Class A Vacancy, Indirect, Class A Class A Starts
-12.0
-8.0
-4.0
0.0
4.0
8.0
12.0
-60,000
-40,000
-20,000
0
20,000
40,000
60,000
1Q
98
3Q
98
1Q
99
3Q
99
1Q
00
3Q
00
1Q
01
3Q
01
1Q
02
3Q
02
1Q
03
3Q
03
1Q
04
3Q
04
1Q
05
3Q
05
1Q
06
3Q
06
1Q
07
3Q
07
1Q
08
3Q
08
1Q
09
3Q
09
1Q
10
3Q
10
1Q
11
3Q
11
1Q
12
3Q
12
1Q
13 S
F O
f A
bso
rpti
on
Ne
ed
ed
Fo
r R
en
t G
row
th -
- B
ars
(In
Millio
ns)
Em
plo
ye
es N
ee
de
d T
o A
bso
rb S
F
To
Va
ca
nc
y E
qu
ilib
riu
m -
- L
ine
-15.0%
-10.0%
-5.0%
0.0%
5.0%
10.0%
15.0%
0%
5%
10%
15%
20%
25%
30%
1Q
98
3Q
98
1Q
99
3Q
99
1Q
00
3Q
00
1Q
01
3Q
01
1Q
02
3Q
02
1Q
03
3Q
03
1Q
04
3Q
04
1Q
05
3Q
05
1Q
06
3Q
06
1Q
07
3Q
07
1Q
08
3Q
08
1Q
09
3Q
09
1Q
10
3Q
10
1Q
11
3Q
11
1Q
12
3Q
12
1Q
13
Em
plo
ym
en
t G
row
th -
- T
railin
g
Fo
ur
Qu
art
er
YO
Y G
row
th
Va
ca
nc
y (
Dir
ec
t &
In
dir
ec
t)
Vacancy, Direct -- Total Vacancy, Indirect -- Total Employment Growth
10Robert W. Baird & Co.

July 9, 2013 | Real Estate Office
Dallas
Things are getting better; leasing activity is improving
Dallas has performed well with some submarkets really taking off Uptown, Far North Dallas, and Las Colinas seeing good activity
Two-fold market with Mid- and Small-sized deal activity Average deal size is 20-50k SF Entrepreneurial businesses are growing around 1-4k SF
Companies are looking to create a presence in Dallas; satellite offices State Farm signed 9k SF as a corporate relocation out of CA
Deal negotiations have been taking a little longer Decreasing free rent is helping the market’s overall net effective rent
Rents are starting to rise for the overall Dallas MSA Tenants are still requesting more and more TIs every year
Class A TIs for a 5-year term is $20-30/SF 10-year deals could get up to $40/SF in TIs Free rent for a 5-year deal is 2-3 months
Underperforming markets could see 7-9 months Las Colinas is 1 month per year of lease term
Mortgage servicing groups and Tech firms are active in the market Mortgage servicing groups are growing and driving the market Tech tenants are active in the market as well
Uptown and Las Colinas, different feels but each meeting tenants’ needs The Uptown and Las Colinas submarkets are both performing well
Uptown: Work, live, play environment Employee retention is a huge focus for tenants Amenity rich submarket; shops, residential, bars A lot of land to do BTS projects Starting to see spec developments take place
Las Colinas: Historically, a regional HQ driven submarket Doing really well since the recovery Access to labor pools and close to the airport
Development activity is well underway including some spec office For the first time since 2007, Dallas is seeing some spec office projects Several proposed sites in the Uptown submarket
One project landed KPMG as its anchor tenant Will begin “putting the shovel in the ground” soon
1.0MSF is under construction, developers targeting 40-50% pre-leasing Buildings will lease fast with demand spilling into other buildings
Densification is occurring in Dallas Cramming more people in the same space Market is realizing 5-6 employees/1,000SF
Dallas
Office SF % of TotalFSP 1,467,714 15.9%CUZ 1,047,000 8.9%PDM 1,279,944 6.0%PSB 715,000 2.5%SIR 607,549 2.5%BDN 150,000 0.5%
Source: SNL Financial and Baird research
11Robert W. Baird & Co.

July 9, 2013 | Real Estate Office
Denver
Downtown is where the majority of the leasing activity is occurring
The Denver CBD is outpacing the decent overall MSA activity level Nobody is looking to vacate the Denver market Law firms are the No. 1 occupier of space in the market
Rental rates are definitely increasing, TIs remaining steady Increased leasing activity is driving rents higher TIs for the market are $4-6/SF/year of term
Max is ~$50/SF with landlords trying not to go over $40/SF Free rent is 1 month/year of lease term with max being 5-6 months
Energy sector is driving the incremental demand in the market Energy is the key driver of growth Some Law firms that are expanding their space needs
Construction is occurring in the LoDo area of the CBD 16M is a mixed-use development that will have 130k SF of office space
The project is located just a couple blocks from Union Station The development started spec but is now leased
Law firms and Energy companies are not reducing the space per employee Not seeing the densification among Law firms or Energy companies Realizing some reduction of space by other industries Densification doesn’t seem as prevalent as other markets
Not making a meaningful impact Best-in-class buildings in the CBD
Wells Fargo Center Republic Plaza (BPO owned) 1801 California (BPO owned)
Major renovations attracting tenants from outside the MSA
Denver
Office SF % of TotalFSP 1,358,213 14.7%BPO 3,735,000 4.9%GOV 422,973 4.1%IRET 152,603 1.2%CWH 672,465 0.9%PDM 148,200 0.7%SIR 140,162 0.6%
Source: SNL Financial and Baird research
12Robert W. Baird & Co.

July 9, 2013 | Real Estate Office
Houston
Nothing really to say but that it’s a “white hot” market
90% of Energy companies are growing on their renewals Hottest submarket is the Energy Corridor
Woodlands and Westchase to 249 are on fire The Galleria submarket is very stable
So much money in Houston right now Want the best product with the best amenities Absorption is going to new construction
Net new demand could come from foreign companies looking to enter Foreign companies are beginning to move to Houston
Generally speaking, everyone is growing BHP Billiton had 350k SF; now has 1.2MSF of space in 4 Oaks
Building recently purchased by CUZ (Post Oak Central) New construction rents are going up daily for Class A space
Demand for new construction is driving rates up daily Class B+ buildings are having rents go up as well TIs are in the $40-75/SF range for 12-15 year leases
3 months free rent New construction is drawing tenants from Class B space
Class B assets could be pressured given the move to new construction The majority of developments have some pre-leasing in place
Houston
Office SF % of TotalTPGI 2,453,492 23.4%PKY 2,182,012 18.4%FSP 1,191,630 12.9%BPO 9,173,000 11.9%CUZ 1,280,000 10.8%PDM 312,564 1.5%DRE 159,175 0.1%LRY 43,200 0.1%
Source: SNL Financial and Baird research
13Robert W. Baird & Co.

Baird's Skyline
Houston Office Market Fundamentals -- Suburban (SUB)
Class A Class B Total
Size Of Houston Office Market (MSF) 75.8 93.2 169.0
% of total market 44.8% 55.2% 100.0%
Office Employment, Estimated ('000) 525.0 615.7 1,140.7
1-year historical employment growth 3.9%
5-year historical employment growth 1.6%
10-year historical employment growth 1.7%
Vacancy (%) 10.3% 14.5% 12.7%
Direct 9.8% 14.1% 12.1%
Sublet 0.6% 0.5% 0.5%
Effective Rents ($/SF) $29.37 $18.99 $23.64
1-year historical rent growth 3.9% 1.7% 2.7%
5-year historical rent growth 5.3% 1.7% 3.3%
10-year historical rent growth 3.8% 1.4% 2.5%
Vacancy Change Needed For Rent Growth 0.7%
SF of Absorption Needed For Equilibrium (MSF) 1.1
Employment Needed For Equilibrium 8,507
Office Employment Growth Needed For Equilibrium 0.7%
Estimated Time To Reach Market Equilibrium (yrs) 0.2
Current Replacement Cost $213
Acquisition Cost Estimate $222 $124 $168
Discount To Replacement Cost -4.5% 41.7% 21.0%
Current Development Yield 8.2%
Current Acquisition Yield 5.7% 8.3% 7.1%
Public REIT Exposure SF ('000) % of port.
PKY 2,182 18.4%
FSP 1,192 12.9%
CUZ 1,280 10.8%
PDM 313 1.5%
DRE 159 0.1%
LRY 43 0.1%
Vacancy, Rent & Construction Analysis
Source: Bureau of Labor Statistics, CoStar, and Baird estimates Source: Bureau of Labor Statistics, CoStar, and Baird estimates
Source: CoStar and Baird Research Source: CoStar and Baird Research
Development Yield & Replacement Cost Analysis
Source: CoStar and Baird estimates Source: CBRE, Colliers, Grubb & Ellis, Jones Lang LaSalle, Real Capital Analytics, RSMeans, and Baird estimates
HOU Employment BreakdownHOU Statistics at a Glance -- SUB
HOU Development Yield -- SUB HOU Replacement Cost & Historical Trades -- SUB
HOU Vacancy & Employment HOU Demand Requirement For Equilibrium -- SUB
HOU Vacancy & Effective Rents -- SUB HOU Vacancy & Annualized New Construction -- SUB
Trade Transportation and
Utilities 21%
Professional and Business Services
15%
Government 14% Education and
Health Services 12%
Leisure and Hospitality
10%
Manufacturing 9%
Construction 7%
Financial Activities 5%
Other Services 3%
Mining and Logging
4%
0%
2%
4%
6%
8%
10%
12%
0%
5%
10%
15%
20%
25%
30%
1Q
99
3Q
99
1Q
00
3Q
00
1Q
01
3Q
01
1Q
02
3Q
02
1Q
03
3Q
03
1Q
04
3Q
04
1Q
05
3Q
05
1Q
06
3Q
06
1Q
07
3Q
07
1Q
08
3Q
08
1Q
09
3Q
09
1Q
10
3Q
10
1Q
11
3Q
11
1Q
12
3Q
12
1Q
13
Rep
lacem
en
t Y
ield
& 1
0-Y
ear
S
pre
ad
New
Co
nstr
ucti
on
, %
Of
Exis
tin
g
Sto
ck, A
nn
uali
zed
Class A Starts Class A Replacement Yield Dev Spread To 10-YR
0%
15%
30%
45%
60%
75%
90%
$0
$50
$100
$150
$200
$250
$300
1980
1981
1982
1983
1984
1985
1986
1987
1988
1989
1990
1991
1992
1993
1994
1995
1996
1997
1998
1999
2000
2001
2002
2003
2004
2005
2006
2007
2008
2009
2010
2011
Dis
co
un
t T
o R
ep
lacem
en
t C
ost
Asset
Valu
e (
$/S
F)
% discount - Class A % discount - Class B Replacement CostTrading Price Class A Trading Price Class B
0%
5%
10%
15%
20%
25%
$0
$5
$10
$15
$20
$25
1Q
99
3Q
99
1Q
00
3Q
00
1Q
01
3Q
01
1Q
02
3Q
02
1Q
03
3Q
03
1Q
04
3Q
04
1Q
05
3Q
05
1Q
06
3Q
06
1Q
07
3Q
07
1Q
08
3Q
08
1Q
09
3Q
09
1Q
10
3Q
10
1Q
11
3Q
11
1Q
12
3Q
12
1Q
13 V
acan
cy (
Dir
ect &
In
dir
ect)
--
Bars
Eff
ecti
ve R
en
ts (
$ / S
F)
-- L
ines
Vacancy, Total, Class A Vacancy, Total, Class B Effective Rent, Class A Effective Rent, Class B
0%
5%
10%
15%
20%
25%
1Q
99
3Q
99
1Q
00
3Q
00
1Q
01
3Q
01
1Q
02
3Q
02
1Q
03
3Q
03
1Q
04
3Q
04
1Q
05
3Q
05
1Q
06
3Q
06
1Q
07
3Q
07
1Q
08
3Q
08
1Q
09
3Q
09
1Q
10
3Q
10
1Q
11
3Q
11
1Q
12
3Q
12
1Q
13
Vacan
cy (
Dir
ect &
In
dir
ect)
Vacancy, Direct, Class A Vacancy, Indirect, Class A Class A Starts
-15.0
-10.0
-5.0
0.0
5.0
10.0
15.0
-75,000
-50,000
-25,000
0
25,000
50,000
75,000
1Q
99
3Q
99
1Q
00
3Q
00
1Q
01
3Q
01
1Q
02
3Q
02
1Q
03
3Q
03
1Q
04
3Q
04
1Q
05
3Q
05
1Q
06
3Q
06
1Q
07
3Q
07
1Q
08
3Q
08
1Q
09
3Q
09
1Q
10
3Q
10
1Q
11
3Q
11
1Q
12
3Q
12
1Q
13 S
F O
f A
bso
rpti
on
Need
ed
Fo
r R
en
t G
row
th -
- B
ars
(In
Mil
lio
ns)
Em
plo
yees N
eed
ed
To
Ab
so
rb S
F
To
Vacan
cy E
qu
ilib
riu
m -
- L
ine
-15%
-10%
-5%
0%
5%
10%
15%
0%
5%
10%
15%
20%
25%
30%
1Q
99
3Q
99
1Q
00
3Q
00
1Q
01
3Q
01
1Q
02
3Q
02
1Q
03
3Q
03
1Q
04
3Q
04
1Q
05
3Q
05
1Q
06
3Q
06
1Q
07
3Q
07
1Q
08
3Q
08
1Q
09
3Q
09
1Q
10
3Q
10
1Q
11
3Q
11
1Q
12
3Q
12
1Q
13
Em
plo
ym
en
t G
row
th -
- T
rail
ing
F
ou
r Q
uart
er
YO
Y G
row
th
Vacan
cy (
Dir
ect &
In
dir
ect)
Vacancy, Direct -- Total Vacancy, Indirect -- Total Employment Growth
14Robert W. Baird & Co.

July 9, 2013 | Real Estate Office
Jacksonville
Major tenants could move from the suburbs to downtown and vice versa
Stein Mart and Carolina Casualty are both considering space options Looking for long-term deals and are assessing their options
Excess space in the market with known move-outs downtown Rental rates are soft
Rental rates are in the $20-22/SF range TIs for the market are close to $35/SF
New construction will enter the market Large blocks of space are limited downtown Will likely see BTS options in the suburbs to accommodate tenant needs
Jacksonville
Office SF % of TotalPKY 1,459,678 12.3%LRY 1,041,353 1.3%CWH 318,997 0.4%
Source: SNL Financial and Baird research
15Robert W. Baird & Co.

July 9, 2013 | Real Estate Office
Los Angeles
Leasing volume has been slow, Playa Vista seeing increased demand
Playa Vista is the new hot market driven by new retail development Cheaper rents and new amenities are attracting tenants
Red Bull is looking at Playa Vista; 250k SF Riot Games looking at submarket; 300k SF
Adding electric charging stations, a popular demand by tenants Santa Monica has outpaced the overall market the past 18 months
Tech companies are driving demand in the submarket Average deal size was 5-10k SF but is increasing
Financial services firms are all decreasing space needs Advertising, marketing and entertainment are increasing space
Tenants are seeking cheaper rent alternatives Playa Vista is seeing incremental demand from Santa Monica
Playa Vista is realizing rents around $3.00/SF/month Santa Monica is realizing rents of ~$4.50/SF/month
TIs in Santa Monica are lower than the overall MSA West LA TI packages and free rent include:
First-generation space of $40-60/SF Second-generation space of $20-40/SF
~$5-10/SF/year of lease term Free rent is around 1 month/year of lease term
Migration occurring from Bunker Hill to LA Live and the Staples Center Professional services firms are still under pressure There is less demand for the Bunker Hill area of the CBD
Densification is limited given the parking restrictions Most employees drive to work and need access to parking The rail system is currently in place through Culver City
Will likely reach Santa Monica by 2015 Could alleviate some of the parking constraints
Los Angeles
Office SF % of TotalDEI 9,864,043 67.2%MPG 5,154,849 56.1%HPP 1,899,457 35.6%KRC 4,002,310 29.1%TPGI 2,496,084 23.8%BPO 5,184,000 6.8%PDM 998,792 4.7%VNO 355,000 0.5%CWH 212,000 0.3%
Source: SNL Financial and Baird research
16Robert W. Baird & Co.

Baird's Skyline
LA Office Market Fundamentals -- Central Business District (CBD)
Class A Class B Total
Size Of LA Office Market (MSF) 37.9 18.9 56.8
% of total market 66.8% 33.2% 100.0%
Office Employment, Estimated ('000) 287.7 148.1 435.8
1-year historical employment growth 2.9%
5-year historical employment growth -1.4%
10-year historical employment growth -0.3%
Vacancy (%) 15.2% 12.3% 14.3%
Direct 14.7% 12.3% 13.9%
Sublet 0.5% 0.1% 0.3%
Effective Rents ($/SF) $21.46 $14.38 $19.10
1-year historical rent growth -2.1% 2.1% -0.7%
5-year historical rent growth 2.7% 2.4% 2.6%
10-year historical rent growth 3.2% 0.6% 2.4%
Vacancy Change Needed For Rent Growth 3.3%
SF of Absorption Needed For Equilibrium (MSF) 1.9
Employment Needed For Equilibrium 16,572
Office Employment Growth Needed For Equilibrium 3.8%
Estimated Time To Reach Market Equilibrium (yrs) 0.3
Current Replacement Cost $498
Acquisition Cost Estimate $344 $274 $321
Discount To Replacement Cost 30.9% 44.9% 35.5%
Current Development Yield 3.9%
Current Acquisition Yield 5.0% 5.0% 5.0%
Public REIT Exposure SF ('000) % of port.
MPG 4,959 54.0%
TPGI 2,496 23.8%
DEI 2,595 17.7%
KRC 851 6.2%
BPO 3,517 4.6%
HPP 241 4.5%
VNO 243 0.3%
Vacancy, Rent & Construction Analysis
Source: Bureau of Labor Statistics, CoStar, and Baird estimates Source: Bureau of Labor Statistics, CoStar, and Baird estimates
Source: CoStar and Baird Research Source: CoStar and Baird Research
Development Yield & Replacement Cost Analysis
Source: CoStar and Baird estimates Source: CBRE, Colliers, Grubb & Ellis, Jones Lang LaSalle, Real Capital Analytics, RSMeans, and
Baird estimates
LA Employment BreakdownLA Statistics at a Glance -- CBD
LA Development Yield -- CBD LA Replacement Cost & Historical Trades -- CBD
LA Vacancy & Employment LA Demand Requirement For Equilibrium -- CBD
LA Vacancy & Effective Rents -- CBD LA Vacancy & Annualized New Construction -- CBD
Trade Transportation and
Utilities 20%
Professional and Business Services
16%
Education and Health Services
14%
Government 13%
Leisure and Hospitality
11%
Manufacturing 10%
Financial Activities 6%
Information 4%
Other Services 3%
Construction 3%
0%
1%
2%
3%
4%
5%
6%
7%
8%
9%
10%
0%
1%
2%
3%
4%
5%
6%
7%
8%
9%
10%
1Q
98
3Q
98
1Q
99
3Q
99
1Q
00
3Q
00
1Q
01
3Q
01
1Q
02
3Q
02
1Q
03
3Q
03
1Q
04
3Q
04
1Q
05
3Q
05
1Q
06
3Q
06
1Q
07
3Q
07
1Q
08
3Q
08
1Q
09
3Q
09
1Q
10
3Q
10
1Q
11
3Q
11
1Q
12
3Q
12
1Q
13
Rep
lacem
en
t Y
ield
& 1
0-Y
ea
r
Sp
rea
d
New
Co
nstr
ucti
on
, %
Of
Exis
tin
g
Sto
ck, A
nn
ua
lized
Class A Starts Class A Replacement Yield Dev Spread To 10-YR
0%
15%
30%
45%
60%
75%
90%
$0
$100
$200
$300
$400
$500
$600
1980
1981
1982
1983
1984
1985
1986
1987
1988
1989
1990
1991
1992
1993
1994
1995
1996
1997
1998
1999
2000
2001
2002
2003
2004
2005
2006
2007
2008
2009
2010
2011 D
isco
un
t T
o R
ep
lacem
en
t C
ost
Asset
Va
lue (
$/S
F)
% discount - Class A % discount - Class B Replacement CostTrading Price Class A Trading Price Class B
0%
5%
10%
15%
20%
25%
$0
$5
$10
$15
$20
$25
1Q
98
3Q
98
1Q
99
3Q
99
1Q
00
3Q
00
1Q
01
3Q
01
1Q
02
3Q
02
1Q
03
3Q
03
1Q
04
3Q
04
1Q
05
3Q
05
1Q
06
3Q
06
1Q
07
3Q
07
1Q
08
3Q
08
1Q
09
3Q
09
1Q
10
3Q
10
1Q
11
3Q
11
1Q
12
3Q
12
1Q
13 V
ac
an
cy
(D
ire
ct
& In
dir
ec
t) -
- B
ars
Eff
ec
tive
Re
nts
($
/ S
F)
-- L
ine
s
Vacancy, Total, Class A Vacancy, Total, Class B Effective Rent, Class A Effective Rent, Class B
0%
5%
10%
15%
20%
25%
1Q
98
3Q
98
1Q
99
3Q
99
1Q
00
3Q
00
1Q
01
3Q
01
1Q
02
3Q
02
1Q
03
3Q
03
1Q
04
3Q
04
1Q
05
3Q
05
1Q
06
3Q
06
1Q
07
3Q
07
1Q
08
3Q
08
1Q
09
3Q
09
1Q
10
3Q
10
1Q
11
3Q
11
1Q
12
3Q
12
1Q
13
Va
ca
nc
y (
Dir
ec
t &
In
dir
ec
t)
Vacancy, Direct, Class A Vacancy, Indirect, Class A Class A Starts
-9.0
-6.0
-3.0
0.0
3.0
6.0
9.0
-60,000
-40,000
-20,000
0
20,000
40,000
60,000
1Q
98
3Q
98
1Q
99
3Q
99
1Q
00
3Q
00
1Q
01
3Q
01
1Q
02
3Q
02
1Q
03
3Q
03
1Q
04
3Q
04
1Q
05
3Q
05
1Q
06
3Q
06
1Q
07
3Q
07
1Q
08
3Q
08
1Q
09
3Q
09
1Q
10
3Q
10
1Q
11
3Q
11
1Q
12
3Q
12
1Q
13
SF
Of
Ab
so
rpti
on
Need
ed
Fo
r R
en
t G
row
th -
- B
ars
(In
Millio
ns)
Em
plo
yees N
eed
ed
To
Ab
so
rb S
F
To
Va
ca
nc
y E
qu
ilib
riu
m -
- L
ine
-15.0%
-10.0%
-5.0%
0.0%
5.0%
10.0%
15.0%
0%
5%
10%
15%
20%
25%
30%
1Q
98
3Q
98
1Q
99
3Q
99
1Q
00
3Q
00
1Q
01
3Q
01
1Q
02
3Q
02
1Q
03
3Q
03
1Q
04
3Q
04
1Q
05
3Q
05
1Q
06
3Q
06
1Q
07
3Q
07
1Q
08
3Q
08
1Q
09
3Q
09
1Q
10
3Q
10
1Q
11
3Q
11
1Q
12
3Q
12
1Q
13
Em
plo
ym
en
t G
row
th -
- T
railin
g
Fo
ur
Qu
art
er
YO
Y G
row
th
Va
ca
nc
y (
Dir
ec
t &
In
dir
ec
t)
Vacancy, Direct -- Total Vacancy, Indirect -- Total Employment Growth
17Robert W. Baird & Co.

July 9, 2013 | Real Estate Office
Miami
Market in general has definitely rebounded with fundamentals stabilizing
Market was flooded by spec buildings that hit the market near the peak Those buildings have since filled up alleviating the pressure
Fundamentals have stabilized with incremental demand Definitely still seeing a flight to quality from Class B assets Investment activity has outpaced overall leasing fundamentals
Buying on cap rate compression speculation Average tenant in the CBD is 6k SF on average
Only 10-15 tenants that occupy over 100k SF Downtown is recovering better with Miami Airport only doing “okay” Aventura is a heavily dense area that does not get overbuilt
Should perform well Expectations for gradual increases in rents, TIs remaining level
Landlords are a bit more bullish on the market and starting to push rents Higher rents are generally met with higher concessions
New leases downtown seeing TIs of $5/SF/year TIs for new leases in the suburbs are $4/SF/year Second gen. space is seeing $80/SF for 10-year term Free rent is 1 month/year up to 5-6 months for the term
Market is unlike any other, driven by Sovereign wealth The market is being driven by Latin American wealth purchasing homes
Residential developments are taking the best plots of land Limits the viable options for office developments Reduces new construction in the market
Sovereign wealth trickles in to increase office demand Still an immature market for office space; not institutionally relevant
Starting to change with a lot of institutional activity Northern Trust to move into Brickell World Plaza
Northern Trust is expected to move into 600 Brickell Ave. Taking 75k SF of space and will move in September ‘13
Foram Group owns the building which was developed in ‘11
Miami
Office SF % of TotalFSP 212,619 2.3%PKY 215,812 1.8%LRY 1,128,580 1.4%PDM 148,368 0.7%DRE 946,865 0.7%
Source: SNL Financial and Baird research
18Robert W. Baird & Co.

Baird's Skyline
Miami Office Market Fundamentals -- Central Business District (CBD)
Class A Class B Total
Size Of Miami Office Market (MSF) 7.2 8.4 15.6
% of total market 46.2% 53.8% 100.0%
Office Employment, Estimated ('000) 46.5 57.0 103.5
1-year historical employment growth 0.5%
5-year historical employment growth -1.5%
10-year historical employment growth 0.4%
Vacancy (%) 19.6% 15.4% 16.0%
Direct 19.2% 14.6% 15.7%
Sublet 0.4% 0.8% 0.3%
Effective Rents ($/SF) $37.91 $27.18 $32.13
1-year historical rent growth -2.8% -0.1% -1.3%
5-year historical rent growth 2.1% 1.9% 2.0%
10-year historical rent growth 2.1% 1.8% 1.9%
Vacancy Change Needed For Rent Growth 4.0%
SF of Absorption Needed For Equilibrium (MSF) 0.8
Employment Needed For Equilibrium 6,693
Office Employment Growth Needed For Equilibrium 6.5%
Estimated Time To Reach Market Equilibrium (yrs) 1.4
Current Replacement Cost $356
Acquisition Cost Estimate $415 $289 $347
Discount To Replacement Cost -16.5% 18.9% 2.5%
Current Development Yield 7.4%
Current Acquisition Yield 4.8% 4.9% 4.9%
Public REIT Exposure SF ('000) % of port.
PKY 111 0.9%
Vacancy, Rent & Construction Analysis
Source: Bureau of Labor Statistics, CoStar, and Baird estimates Source: Bureau of Labor Statistics, CoStar, and Baird estimates
Source: CoStar and Baird Research Source: CoStar and Baird Research
Development Yield & Replacement Cost Analysis
Source: CoStar and Baird estimates Source: CBRE, Colliers, Grubb & Ellis, Jones Lang LaSalle, Real Capital Analytics, RSMeans, and Baird estimates
MIA Employment BreakdownMIA Statistics at a Glance -- CBD
MIA Development Yield -- CBD MIA Replacement Cost & Historical Trades -- CBD
MIA Vacancy & Employment MIA Demand Requirement For Equilibrium -- CBD
MIA Vacancy & Effective Rents -- CBD MIA Vacancy & Annualized New Construction -- CBD
0%
3%
6%
9%
12%
15%
18%
0.0%
10.0%
20.0%
30.0%
40.0%
50.0%
60.0%
3Q
99
1Q
00
3Q
00
1Q
01
3Q
01
1Q
02
3Q
02
1Q
03
3Q
03
1Q
04
3Q
04
1Q
05
3Q
05
1Q
06
3Q
06
1Q
07
3Q
07
1Q
08
3Q
08
1Q
09
3Q
09
1Q
10
3Q
10
1Q
11
3Q
11
1Q
12
3Q
12
1Q
13
Rep
lacem
en
t Y
ield
& 1
0-Y
ear
S
pre
ad
New
Co
nstr
ucti
on
, %
Of
Exis
tin
g
Sto
ck, A
nn
uali
zed
Class A Starts Class A Replacement Yield Dev Spread To 10-YR
0%
15%
30%
45%
60%
75%
90%
$0
$100
$200
$300
$400
$500
$600
1980
1981
1982
1983
1984
1985
1986
1987
1988
1989
1990
1991
1992
1993
1994
1995
1996
1997
1998
1999
2000
2001
2002
2003
2004
2005
2006
2007
2008
2009
2010
2011
Dis
co
un
t T
o R
ep
lacem
en
t C
ost
Asset
Valu
e (
$/S
F)
% discount - Class A % discount - Class B Replacement Cost
Trading Price Class A Trading Price Class B
0%
5%
10%
15%
20%
25%
30%
$0
$5
$10
$15
$20
$25
$30
3Q
99
1Q
00
3Q
00
1Q
01
3Q
01
1Q
02
3Q
02
1Q
03
3Q
03
1Q
04
3Q
04
1Q
05
3Q
05
1Q
06
3Q
06
1Q
07
3Q
07
1Q
08
3Q
08
1Q
09
3Q
09
1Q
10
3Q
10
1Q
11
3Q
11
1Q
12
3Q
12
1Q
13
Vacan
cy (
Dir
ect &
In
dir
ect)
--
Bars
Eff
ecti
ve R
en
ts (
$ / S
F)
-- L
ines
Vacancy, Total, Class A Vacancy, Total, Class B Effective Rent, Class A Effective Rent, Class B
0%
10%
20%
30%
40%
50%
60%
3Q
99
1Q
00
3Q
00
1Q
01
3Q
01
1Q
02
3Q
02
1Q
03
3Q
03
1Q
04
3Q
04
1Q
05
3Q
05
1Q
06
3Q
06
1Q
07
3Q
07
1Q
08
3Q
08
1Q
09
3Q
09
1Q
10
3Q
10
1Q
11
3Q
11
1Q
12
3Q
12
1Q
13
Vacan
cy (
Dir
ect &
In
dir
ect)
Vacancy, Direct, Class A Vacancy, Indirect, Class A Class A Starts
-3.0
-2.0
-1.0
0.0
1.0
2.0
3.0
-15,000
-10,000
-5,000
0
5,000
10,000
15,000
3Q
99
1Q
00
3Q
00
1Q
01
3Q
01
1Q
02
3Q
02
1Q
03
3Q
03
1Q
04
3Q
04
1Q
05
3Q
05
1Q
06
3Q
06
1Q
07
3Q
07
1Q
08
3Q
08
1Q
09
3Q
09
1Q
10
3Q
10
1Q
11
3Q
11
1Q
12
3Q
12
1Q
13
SF
Of
Ab
so
rpti
on
Need
ed
Fo
r R
en
t G
row
th -
- B
ars
(In
Mil
lio
ns)
Em
plo
yees N
eed
ed
To
Ab
so
rb S
F
To
Vacan
cy E
qu
ilib
riu
m -
- L
ine
-15.0%
-10.0%
-5.0%
0.0%
5.0%
10.0%
15.0%
0%
5%
10%
15%
20%
25%
30%
3Q
99
1Q
00
3Q
00
1Q
01
3Q
01
1Q
02
3Q
02
1Q
03
3Q
03
1Q
04
3Q
04
1Q
05
3Q
05
1Q
06
3Q
06
1Q
07
3Q
07
1Q
08
3Q
08
1Q
09
3Q
09
1Q
10
3Q
10
1Q
11
3Q
11
1Q
12
3Q
12
1Q
13
Em
plo
ym
en
t G
row
th -
- T
rail
ing
F
ou
r Q
uart
er
YO
Y G
row
th
Vacan
cy (
Dir
ect &
In
dir
ect)
Vacancy, Direct -- Total Vacancy, Indirect -- Total Employment Growth
Government 24%
Professional and Business Services
16%
Education and Health Services
16%
Manufacturing 13%
Leisure and Hospitality
11%
Construction 7%
Financial Activities 4%
Information 4%
Other Services 3%
Trade Transportation and
Utilities 2%
19Robert W. Baird & Co.
July 9, 2013 | Real Estate Office
New York
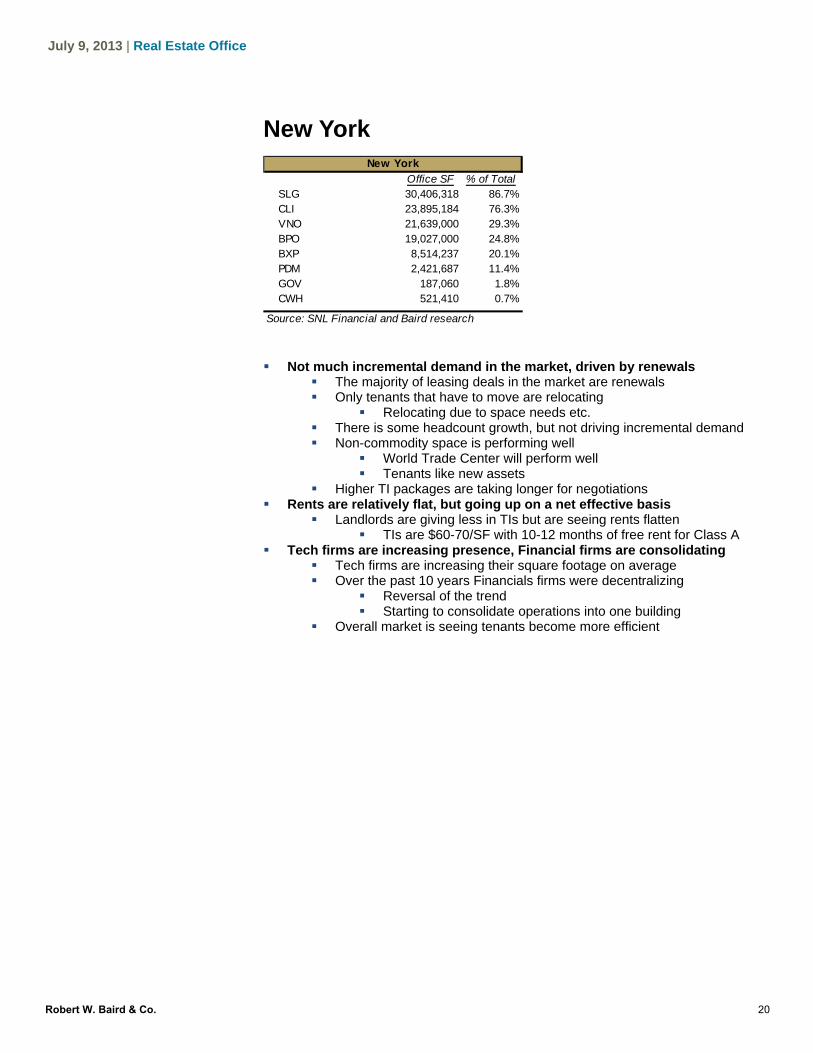
Not much incremental demand in the market, driven by renewals
The majority of leasing deals in the market are renewals Only tenants that have to move are relocating
Relocating due to space needs etc. There is some headcount growth, but not driving incremental demand Non-commodity space is performing well
World Trade Center will perform well Tenants like new assets
Higher TI packages are taking longer for negotiations Rents are relatively flat, but going up on a net effective basis
Landlords are giving less in TIs but are seeing rents flatten TIs are $60-70/SF with 10-12 months of free rent for Class A
Tech firms are increasing presence, Financial firms are consolidating Tech firms are increasing their square footage on average Over the past 10 years Financials firms were decentralizing
Reversal of the trend Starting to consolidate operations into one building
Overall market is seeing tenants become more efficient
New York
Office SF % of TotalSLG 30,406,318 86.7%CLI 23,895,184 76.3%VNO 21,639,000 29.3%BPO 19,027,000 24.8%BXP 8,514,237 20.1%PDM 2,421,687 11.4%GOV 187,060 1.8%CWH 521,410 0.7%
Source: SNL Financial and Baird research
20Robert W. Baird & Co.

Baird's Skyline
Midtown Office Market Fundamentals -- Central Business District (CBD)
Class A Class B Total
Size Of Midtown Office Market (MSF) 228.9 118.1 347.0
% of total market 66.0% 34.0% 100.0%
Office Employment, Estimated ('000) 969.1 514.3 1,483.4
1-year historical employment growth 0.7%
5-year historical employment growth -0.1%
10-year historical employment growth 0.3%
Vacancy (%) 8.4% 5.8% 7.6%
Direct 7.3% 5.0% 6.5%
Sublet 1.1% 0.8% 1.1%
Effective Rents ($/SF) $43.23 $32.46 $39.56
1-year historical rent growth 0.6% 10.1% 3.8%
5-year historical rent growth -1.4% 3.1% 0.1%
10-year historical rent growth 1.1% 2.8% 1.7%
Vacancy Change Needed For Rent Growth 0.1%
SF of Absorption Needed For Equilibrium (MSF) 0.0
Employment Needed For Equilibrium 199
Office Employment Growth Needed For Equilibrium 0.0%
Estimated Time To Reach Market Equilibrium (yrs) 0.0
Current Replacement Cost $1,095
Acquisition Cost Estimate $920 $770 $869
Discount To Replacement Cost 16.0% 29.7% 20.7%
Current Development Yield 3.8%
Current Acquisition Yield 3.9% 3.1% 3.7%
Public REIT Exposure SF ('000) % of port.
SLG 21,596 61.6%
BXP 8,100 19.2%
BPO 1,148 1.5%
Vacancy, Rent & Construction Analysis
Source: Bureau of Labor Statistics, CoStar, and Baird estimates Source: Bureau of Labor Statistics, CoStar, and Baird estimates
Source: CoStar and Baird Research Source: CoStar and Baird Research
Development Yield & Replacement Cost Analysis
Source: CoStar and Baird estimates Source: CBRE, Colliers, Grubb & Ellis, Jones Lang LaSalle, Real Capital Analytics, RSMeans, and Baird estimates
NYC - Midtown Employment BreakdownNYC - Midtown Statistics at a Glance
NYC - Midtown Development Yield NYC - Midtown Replacement Cost & Historical Trades
NYC - Midtown Vacancy & Employment NYC - Midtown Demand Requirement For Equilibrium
NYC - Midtown Vacancy & Effective Rents NYC - Midtown Vacancy & Annualized New Construction
0%
2%
4%
6%
8%
10%
0%
5%
10%
15%
20%
25%
1Q
98
3Q
98
1Q
99
3Q
99
1Q
00
3Q
00
1Q
01
3Q
01
1Q
02
3Q
02
1Q
03
3Q
03
1Q
04
3Q
04
1Q
05
3Q
05
1Q
06
3Q
06
1Q
07
3Q
07
1Q
08
3Q
08
1Q
09
3Q
09
1Q
10
3Q
10
1Q
11
3Q
11
1Q
12
3Q
12
1Q
13
Rep
lacem
en
t Y
ield
& 1
0-Y
ear
S
pre
ad
New
Co
nstr
ucti
on
, %
Of
Exis
tin
g
Sto
ck, A
nn
uali
zed
Class A Starts Class A Replacement Yield Dev Spread To 10-YR
0%
15%
30%
45%
60%
75%
90%
$0
$200
$400
$600
$800
$1,000
$1,200
1980
1981
1982
1983
1984
1985
1986
1987
1988
1989
1990
1991
1992
1993
1994
1995
1996
1997
1998
1999
2000
2001
2002
2003
2004
2005
2006
2007
2008
2009
2010
2011
Dis
co
un
t T
o R
ep
lacem
en
t C
ost
Asset
Valu
e (
$/S
F)
% discount - Class A % discount - Class B Replacement CostTrading Price Class A Trading Price Class B
0%
4%
8%
12%
16%
20%
24%
$0
$10
$20
$30
$40
$50
$60
1Q
98
3Q
98
1Q
99
3Q
99
1Q
00
3Q
00
1Q
01
3Q
01
1Q
02
3Q
02
1Q
03
3Q
03
1Q
04
3Q
04
1Q
05
3Q
05
1Q
06
3Q
06
1Q
07
3Q
07
1Q
08
3Q
08
1Q
09
3Q
09
1Q
10
3Q
10
1Q
11
3Q
11
1Q
12
3Q
12
1Q
13 Vacan
cy (
Dir
ect &
In
dir
ect)
--
Bars
Eff
ecti
ve R
en
ts (
$ / S
F)
-- L
ines
Vacancy, Total, Class A Vacancy, Total, Class B Effective Rent, Class A Effective Rent, Class B
0%
5%
10%
15%
20%
1Q
98
3Q
98
1Q
99
3Q
99
1Q
00
3Q
00
1Q
01
3Q
01
1Q
02
3Q
02
1Q
03
3Q
03
1Q
04
3Q
04
1Q
05
3Q
05
1Q
06
3Q
06
1Q
07
3Q
07
1Q
08
3Q
08
1Q
09
3Q
09
1Q
10
3Q
10
1Q
11
3Q
11
1Q
12
3Q
12
1Q
13
Vacan
cy (
Dir
ect &
In
dir
ect)
Vacancy, Direct, Class A Vacancy, Indirect, Class A Class A Starts
-21.0
-14.0
-7.0
0.0
7.0
14.0
21.0
-105,000
-70,000
-35,000
0
35,000
70,000
105,000
1Q
98
3Q
98
1Q
99
3Q
99
1Q
00
3Q
00
1Q
01
3Q
01
1Q
02
3Q
02
1Q
03
3Q
03
1Q
04
3Q
04
1Q
05
3Q
05
1Q
06
3Q
06
1Q
07
3Q
07
1Q
08
3Q
08
1Q
09
3Q
09
1Q
10
3Q
10
1Q
11
3Q
11
1Q
12
3Q
12
1Q
13 S
F O
f A
bso
rpti
on
Need
ed
Fo
r R
en
t G
row
th -
- B
ars
(In
Mil
lio
ns)
Em
plo
yees N
eed
ed
To
Ab
so
rb S
F
To
Vacan
cy E
qu
ilib
riu
m --
Lin
e
-15%
-10%
-5%
0%
5%
10%
15%
0%
5%
10%
15%
20%
25%
30%
1Q
98
3Q
98
1Q
99
3Q
99
1Q
00
3Q
00
1Q
01
3Q
01
1Q
02
3Q
02
1Q
03
3Q
03
1Q
04
3Q
04
1Q
05
3Q
05
1Q
06
3Q
06
1Q
07
3Q
07
1Q
08
3Q
08
1Q
09
3Q
09
1Q
10
3Q
10
1Q
11
3Q
11
1Q
12
3Q
12
1Q
13
Em
plo
ym
en
t G
row
th -
- T
rail
ing
F
ou
r Q
uart
er
YO
Y G
row
th
Vacan
cy (
Dir
ect &
In
dir
ect)
Vacancy, Direct -- Total Vacancy, Indirect -- Total Employment Growth
Trade Transportation and
Utilities 19%
Education and Health Services
19%
Professional and Business Services
16%
Government 14%
Leisure and Hospitality
9%
Financial Activities 9%
Other Services 4%
Manufacturing 4%
Mining Logging and Construction
3% Information
3%
21Robert W. Baird & Co.

July 9, 2013 | Real Estate Office
Phoenix
Market has changed the past two years, now a landlord’s market
Tenants had the advantage in the downturn but that is changing There is large tenant demand out there in different pockets
State Farm Insurance is building a 2.0MSF campus in Tempe LifeLock is expanding by 23k SF at Hayden Ferry II (PKY) Wells Fargo just signed a 100k SF lease GoDaddy just announced a 120k SF BTS in Tempe
Average deal size in the market is 10-20k SF Has started to see this number increase
Rents are starting to increase in the market Lower vacancy rates are starting to allow for some rent increases First-generation TIs are $40-50/SF for a 5-year lease deal
5-6 months of free rent Second-generation TIs are $10-20/SF on a 5-year lease deal
Construction activity has started to pick up There are currently some spec buildings mixed with BTS projects
Phoenix
Office SF % of TotalPKY 896,426 7.6%PDM 564,144 2.7%GOV 97,145 1.0%LRY 745,212 0.9%SIR 100,500 0.4%
Source: SNL Financial and Baird research
22Robert W. Baird & Co.

July 9, 2013 | Real Estate Office
San Diego
Market fundamentals are quality, location dependent
Premier submarkets are realizing good positive absorption for Class A Fourteen straight quarters of positive net absorption Steady improvement from quarter to quarter
Central SD Class A has a vacancy rate at ~8% Tenant demand levels are strengthening
Average deal size is 5-10k SF and has stabilized Forecast for rent growth of 5-10% year-over-year
The market is seeing rent growth but still below prior peak rates Rates are nearing replacement rents
Development sites might be able to be monetized near-term Limited large blocks of space Tenants could be willing to pay replacement rents Currently no speculative developments
TIs for brand new space is $40-55/SF Could be lower for high quality space if well configured
Free rent of 1 month/year of lease term Market is being driven by a diversified industry base
Medical device and life science are creating incremental demand Office landlords are housing space not configured for biotech
Includes operations, sales team, etc. Telecommunications companies are growing significantly
Densification has entered SD but is limited by parking and restroom size Tenant parking is a key factor in lease deals
Need a place to park the employees Restroom size, yes restroom size is also playing a role in negotiations
San Diego continues to be location specific Tenants are focused on being close to their employee base Deals are heavily focused on the location of the asset Creative space has not yet been a game changer for the market
San Diego
Office SF % of TotalKRC 5,244,564 38.1%AAT 668,869 11.5%GOV 427,779 4.2%HPP 112,300 2.1%BDN 247,233 0.8%SIR 95,000 0.4%
Source: SNL Financial and Baird research
23Robert W. Baird & Co.

Baird's Skyline
San Diego Office Market Fundamentals -- Suburban (SUB)
Class A Class B Total
Size Of San Diego Office Market (MSF) 25.5 40.1 65.6
% of total market 38.9% 61.1% 100.0%
Office Employment, Estimated ('000) 197.5 300.5 498.1
1-year historical employment growth 2.8%
5-year historical employment growth -0.1%
10-year historical employment growth 0.5%
Vacancy (%) 10.6% 13.4% 12.3%
Direct 9.8% 12.5% 11.5%
Sublet 0.7% 0.9% 0.8%
Effective Rents ($/SF) $33.20 $24.58 $27.93
1-year historical rent growth 7.5% 0.3% 3.1%
5-year historical rent growth -2.4% -2.8% -2.6%
10-year historical rent growth 0.8% -0.2% 0.2%
Vacancy Change Needed For Rent Growth 0.3%
SF of Absorption Needed For Equilibrium (MSF) 0.2
Employment Needed For Equilibrium 1,565
Office Employment Growth Needed For Equilibrium 0.3%
Estimated Time To Reach Market Equilibrium (yrs) 0.1
Current Replacement Cost $352
Acquisition Cost Estimate $321 $274 $293
Discount To Replacement Cost 8.8% 22.2% 17.0%
Current Development Yield 8.9%
Current Acquisition Yield 7.0% 6.1% 6.4%
Public REIT Exposure SF ('000) % of port.
KRC 5,245 38.1%
AAT 212 3.6%
BDN 247 0.8%
SIR 95 0.4%
Vacancy, Rent & Construction Analysis
Source: Bureau of Labor Statistics, CoStar, and Baird estimates Source: Bureau of Labor Statistics, CoStar, and Baird estimates
Source: CoStar and Baird Research Source: CoStar and Baird Research
Development Yield & Replacement Cost Analysis
Source: CoStar and Baird estimates Source: CBRE, Colliers, Grubb & Ellis, Jones Lang LaSalle, Real Capital Analytics, RSMeans, and Baird estimates
SD Employment BreakdownSD Statistics at a Glance -- SUB
SD Development Yield -- SUB SD Replacement Cost & Historical Trades -- SUB
SD Vacancy & Employment SD Demand Requirement For Equilibrium -- SUB
SD Vacancy & Effective Rents -- SUB SD Vacancy & Annualized New Construction -- SUB
Government 18%
Professional and Business Services
18%
Trade Transportation and
Utilities 16%
Leisure and Hospitality
13%
Education and Health Services
12%
Manufacturing 7%
Financial Activities 5%
Construction 5%
Other Services 4%
Information 2%
0%
2%
4%
6%
8%
10%
12%
14%
0%
5%
10%
15%
20%
25%
30%
35%
2Q
99
4Q
99
2Q
00
4Q
00
2Q
01
4Q
01
2Q
02
4Q
02
2Q
03
4Q
03
2Q
04
4Q
04
2Q
05
4Q
05
2Q
06
4Q
06
2Q
07
4Q
07
2Q
08
4Q
08
2Q
09
4Q
09
2Q
10
4Q
10
2Q
11
4Q
11
2Q
12
4Q
12
Rep
lacem
en
t Y
ield
& 1
0-Y
ear
S
pre
ad
New
Co
nstr
ucti
on
, %
Of
Exis
tin
g
Sto
ck, A
nn
uali
zed
Class A Starts Class A Replacement Yield Dev Spread To 10-YR
0%
15%
30%
45%
60%
75%
90%
$0
$100
$200
$300
$400
$500
$600
1980
1981
1982
1983
1984
1985
1986
1987
1988
1989
1990
1991
1992
1993
1994
1995
1996
1997
1998
1999
2000
2001
2002
2003
2004
2005
2006
2007
2008
2009
2010
2011
Dis
co
un
t T
o R
ep
lacem
en
t C
ost
Asset
Valu
e (
$/S
F)
% discount - Class A % discount - Class B Replacement CostTrading Price Class A Trading Price Class B
0%
5%
10%
15%
20%
25%
30%
$0
$5
$10
$15
$20
$25
$30
2Q
99
4Q
99
2Q
00
4Q
00
2Q
01
4Q
01
2Q
02
4Q
02
2Q
03
4Q
03
2Q
04
4Q
04
2Q
05
4Q
05
2Q
06
4Q
06
2Q
07
4Q
07
2Q
08
4Q
08
2Q
09
4Q
09
2Q
10
4Q
10
2Q
11
4Q
11
2Q
12
4Q
12 Vacan
cy (
Dir
ect &
In
dir
ect)
--
Bars
Eff
ecti
ve R
en
ts (
$ / S
F)
-- L
ines
Vacancy, Total, Class A Vacancy, Total, Class B Effective Rent, Class A Effective Rent, Class B
0%
5%
10%
15%
20%
25%
30%
35%
40%
2Q
99
4Q
99
2Q
00
4Q
00
2Q
01
4Q
01
2Q
02
4Q
02
2Q
03
4Q
03
2Q
04
4Q
04
2Q
05
4Q
05
2Q
06
4Q
06
2Q
07
4Q
07
2Q
08
4Q
08
2Q
09
4Q
09
2Q
10
4Q
10
2Q
11
4Q
11
2Q
12
4Q
12
Vacan
cy (
Dir
ect &
In
dir
ect)
Vacancy, Direct, Class A Vacancy, Indirect, Class A Class A Starts
-12.0
-8.0
-4.0
0.0
4.0
8.0
12.0
-90,000
-60,000
-30,000
0
30,000
60,000
90,0002Q
99
4Q
99
2Q
00
4Q
00
2Q
01
4Q
01
2Q
02
4Q
02
2Q
03
4Q
03
2Q
04
4Q
04
2Q
05
4Q
05
2Q
06
4Q
06
2Q
07
4Q
07
2Q
08
4Q
08
2Q
09
4Q
09
2Q
10
4Q
10
2Q
11
4Q
11
2Q
12
4Q
12 S
F O
f A
bso
rpti
on
Need
ed
Fo
r R
en
t G
row
th -
- B
ars
(In
Mil
lio
ns)
Em
plo
yees N
eed
ed
To
Ab
so
rb S
F
To
Vacan
cy E
qu
ilib
riu
m -
- L
ine
-15%
-10%
-5%
0%
5%
10%
15%
0%
5%
10%
15%
20%
25%
30%
2Q
99
4Q
99
2Q
00
4Q
00
2Q
01
4Q
01
2Q
02
4Q
02
2Q
03
4Q
03
2Q
04
4Q
04
2Q
05
4Q
05
2Q
06
4Q
06
2Q
07
4Q
07
2Q
08
4Q
08
2Q
09
4Q
09
2Q
10
4Q
10
2Q
11
4Q
11
2Q
12
4Q
12
Em
plo
ym
en
t G
row
th -
- T
rail
ing
F
ou
r Q
uart
er
YO
Y G
row
th
Vacan
cy (
Dir
ect &
In
dir
ect)
Vacancy, Direct -- Total Vacancy, Indirect -- Total Employment Growth
24Robert W. Baird & Co.

July 9, 2013 | Real Estate Office
San Francisco
Leasing activity in San Francisco has been on a roll
The market has seen record absorption the past two years Average tenant size is 7k SF Has been a lot of large Tech deals
Despite being only 25% of the market, tech is driving demand The known 440k SF SalesForce.com lease is one example
Moving into 350 Mission St. (KRC owned) in 2015 Rents are increasing quite significantly with landlords pushing rates
Landlords are pushing rental rates but are allowing for higher TIs Tenants need to reconfigure space requiring more investment TIs for a 5-year deal are $30-40/SF
3-6 months of free rent TIs for a 10-year deal are $50-70/SF
6-12 months of free rent 225 Bush St. was renovated in 2010 and has performed well
“Cool space” with open plan and open ceilings Five spec developers are in the market and could be a concern
The prior cycle only saw one spec project, now SF is seeing five Banks and Law firms are increasing density at the workplace
As leases expire, Banks and Law firms are reconfiguring their space Refreshing the look and redesigning the use of the space
AKA: taking less space
San Francisco
Office SF % of TotalHPP 1,850,977 34.7%KRC 2,621,184 19.1%BXP 4,087,427 9.7%AAT 519,548 8.9%VNO 1,795,000 2.4%BDN 554,534 1.7%SIR 100,728 0.4%
Source: SNL Financial and Baird research
25Robert W. Baird & Co.
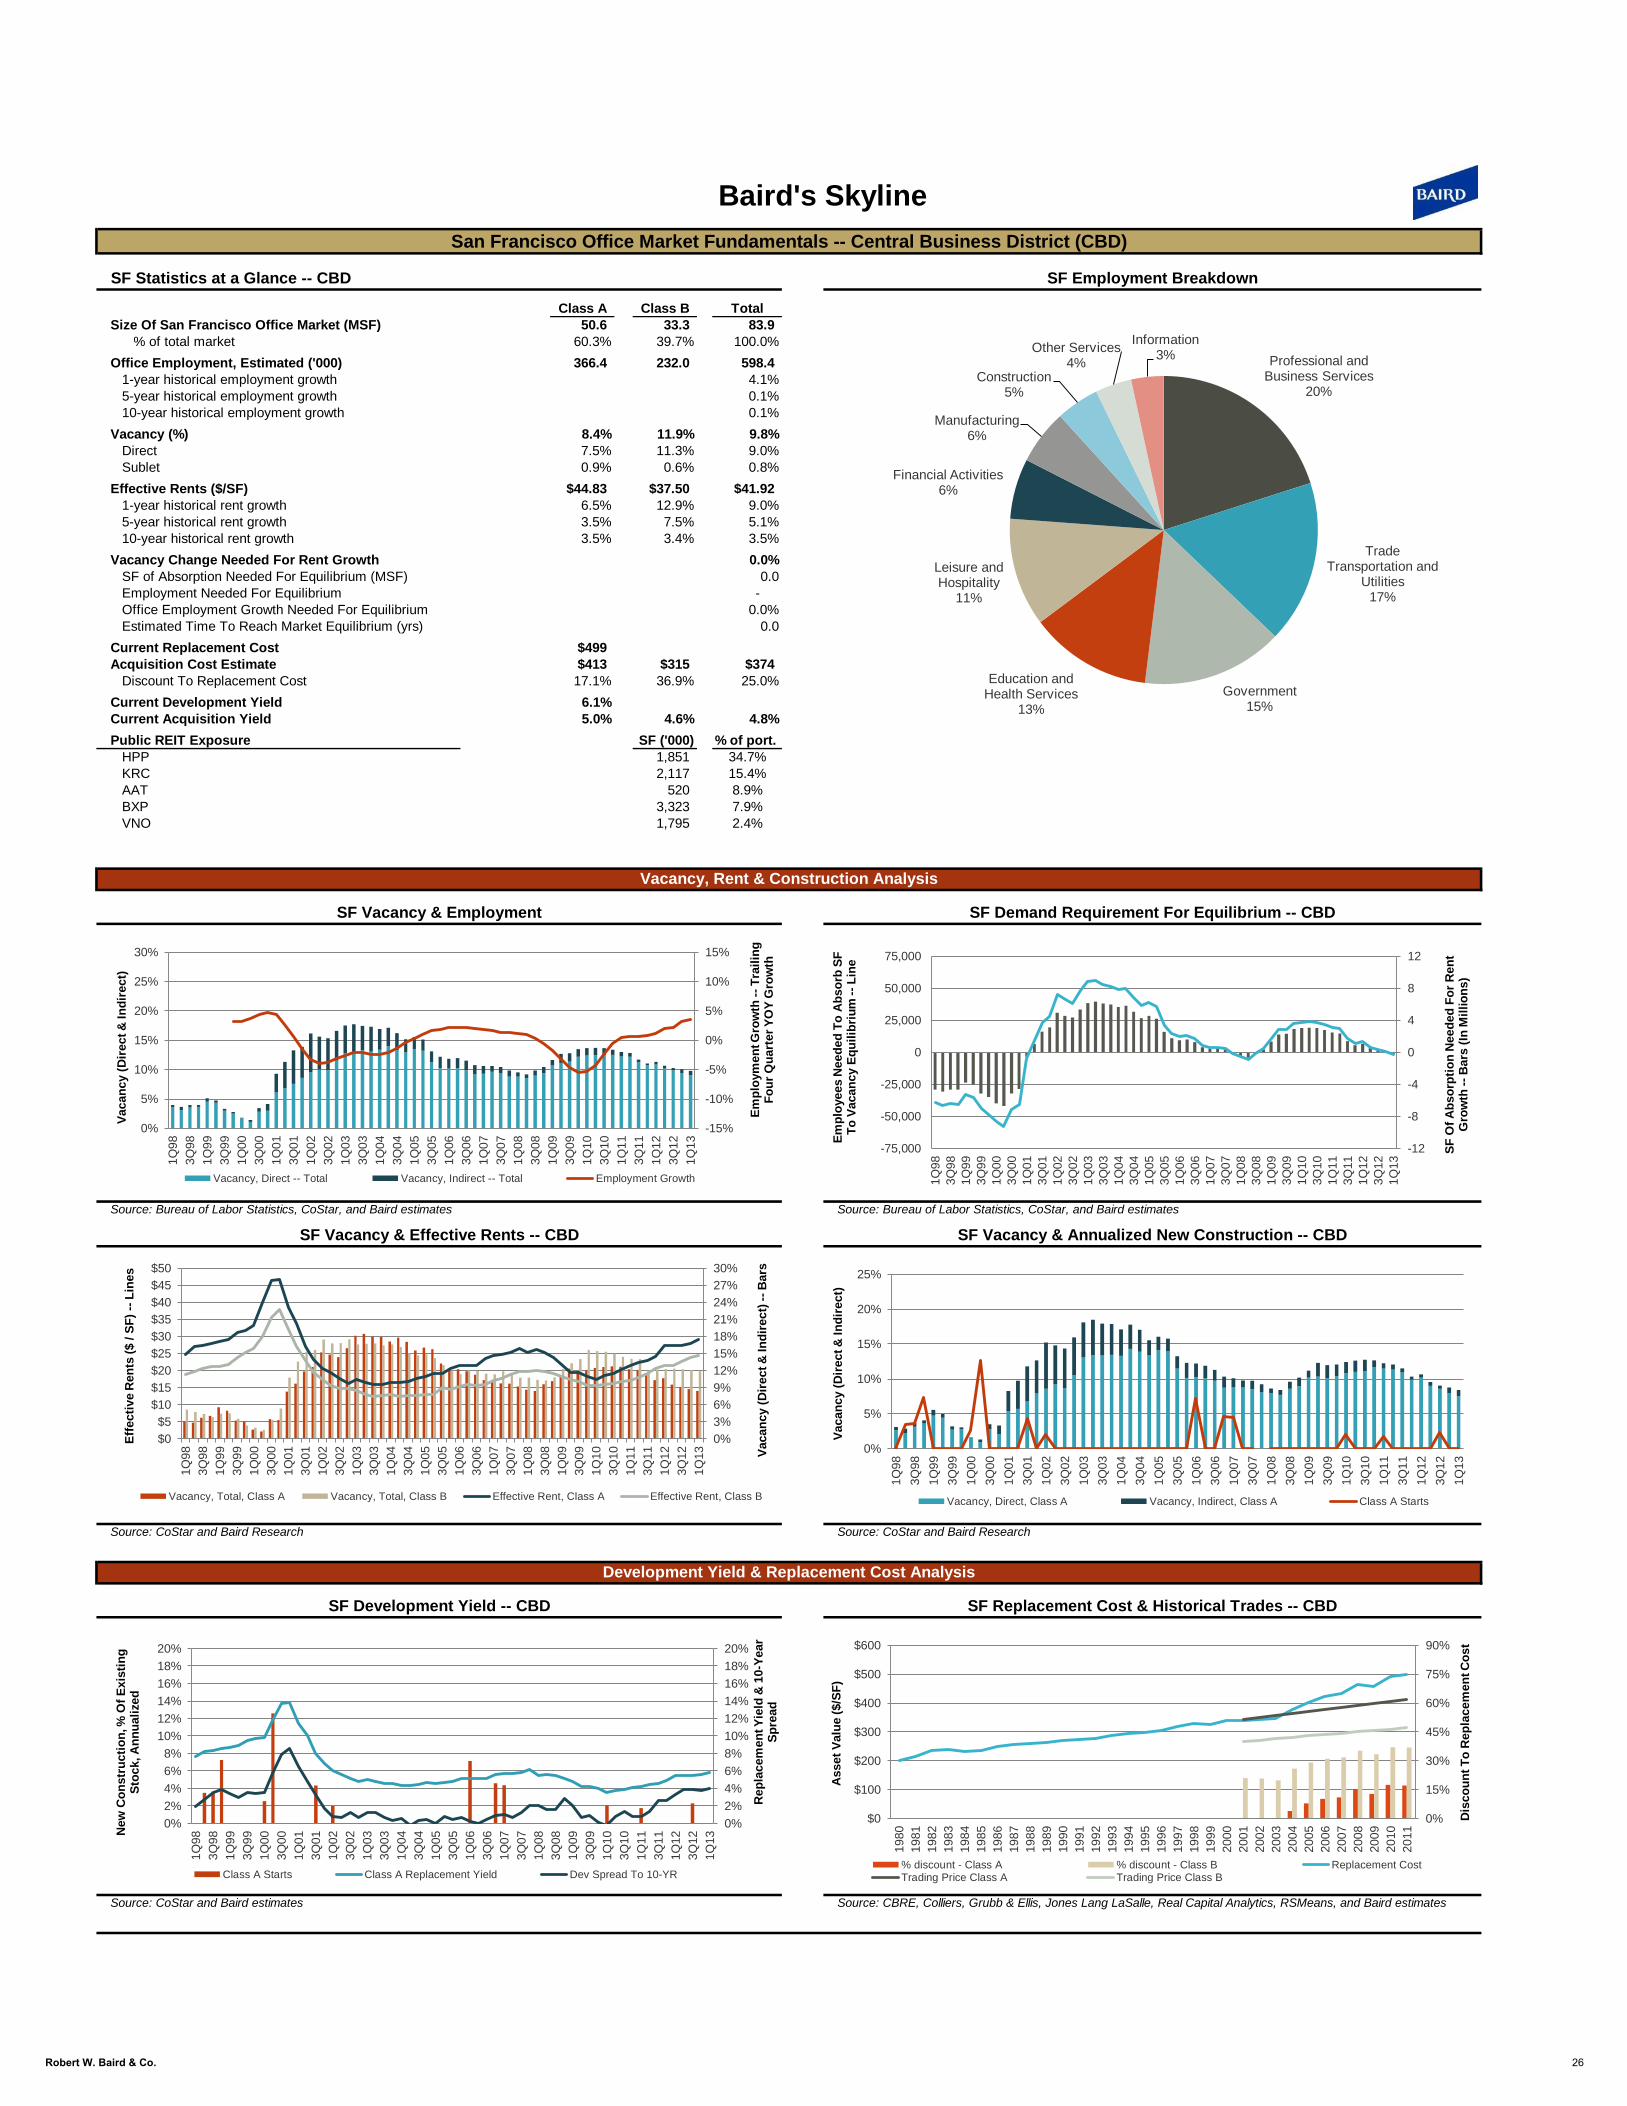
Baird's Skyline
San Francisco Office Market Fundamentals -- Central Business District (CBD)
Class A Class B Total
Size Of San Francisco Office Market (MSF) 50.6 33.3 83.9
% of total market 60.3% 39.7% 100.0%
Office Employment, Estimated ('000) 366.4 232.0 598.4
1-year historical employment growth 4.1%
5-year historical employment growth 0.1%
10-year historical employment growth 0.1%
Vacancy (%) 8.4% 11.9% 9.8%
Direct 7.5% 11.3% 9.0%
Sublet 0.9% 0.6% 0.8%
Effective Rents ($/SF) $44.83 $37.50 $41.92
1-year historical rent growth 6.5% 12.9% 9.0%
5-year historical rent growth 3.5% 7.5% 5.1%
10-year historical rent growth 3.5% 3.4% 3.5%
Vacancy Change Needed For Rent Growth 0.0%
SF of Absorption Needed For Equilibrium (MSF) 0.0
Employment Needed For Equilibrium -
Office Employment Growth Needed For Equilibrium 0.0%
Estimated Time To Reach Market Equilibrium (yrs) 0.0
Current Replacement Cost $499
Acquisition Cost Estimate $413 $315 $374
Discount To Replacement Cost 17.1% 36.9% 25.0%
Current Development Yield 6.1%
Current Acquisition Yield 5.0% 4.6% 4.8%
Public REIT Exposure SF ('000) % of port.
HPP 1,851 34.7%
KRC 2,117 15.4%
AAT 520 8.9%
BXP 3,323 7.9%
VNO 1,795 2.4%
Vacancy, Rent & Construction Analysis
Source: Bureau of Labor Statistics, CoStar, and Baird estimates Source: Bureau of Labor Statistics, CoStar, and Baird estimates
Source: CoStar and Baird Research Source: CoStar and Baird Research
Development Yield & Replacement Cost Analysis
Source: CoStar and Baird estimates Source: CBRE, Colliers, Grubb & Ellis, Jones Lang LaSalle, Real Capital Analytics, RSMeans, and Baird estimates
SF Employment BreakdownSF Statistics at a Glance -- CBD
SF Development Yield -- CBD SF Replacement Cost & Historical Trades -- CBD
SF Vacancy & Employment SF Demand Requirement For Equilibrium -- CBD
SF Vacancy & Effective Rents -- CBD SF Vacancy & Annualized New Construction -- CBD
Professional and Business Services
20%
Trade Transportation and
Utilities 17%
Government 15%
Education and Health Services
13%
Leisure and Hospitality
11%
Financial Activities 6%
Manufacturing 6%
Construction 5%
Other Services 4%
Information 3%
0%
2%
4%
6%
8%
10%
12%
14%
16%
18%
20%
0%
2%
4%
6%
8%
10%
12%
14%
16%
18%
20%
1Q
98
3Q
98
1Q
99
3Q
99
1Q
00
3Q
00
1Q
01
3Q
01
1Q
02
3Q
02
1Q
03
3Q
03
1Q
04
3Q
04
1Q
05
3Q
05
1Q
06
3Q
06
1Q
07
3Q
07
1Q
08
3Q
08
1Q
09
3Q
09
1Q
10
3Q
10
1Q
11
3Q
11
1Q
12
3Q
12
1Q
13
Rep
lacem
en
t Y
ield
& 1
0-Y
ear
S
pre
ad
New
Co
nstr
ucti
on
, %
Of
Exis
tin
g
Sto
ck, A
nn
uali
zed
Class A Starts Class A Replacement Yield Dev Spread To 10-YR
0%
15%
30%
45%
60%
75%
90%
$0
$100
$200
$300
$400
$500
$600
1980
1981
1982
1983
1984
1985
1986
1987
1988
1989
1990
1991
1992
1993
1994
1995
1996
1997
1998
1999
2000
2001
2002
2003
2004
2005
2006
2007
2008
2009
2010
2011
Dis
co
un
t T
o R
ep
lacem
en
t C
ost
Asset
Valu
e (
$/S
F)
% discount - Class A % discount - Class B Replacement CostTrading Price Class A Trading Price Class B
0%
3%
6%
9%
12%
15%
18%
21%
24%
27%
30%
$0
$5
$10
$15
$20
$25
$30
$35
$40
$45
$50
1Q
98
3Q
98
1Q
99
3Q
99
1Q
00
3Q
00
1Q
01
3Q
01
1Q
02
3Q
02
1Q
03
3Q
03
1Q
04
3Q
04
1Q
05
3Q
05
1Q
06
3Q
06
1Q
07
3Q
07
1Q
08
3Q
08
1Q
09
3Q
09
1Q
10
3Q
10
1Q
11
3Q
11
1Q
12
3Q
12
1Q
13 Vacan
cy (
Dir
ect &
In
dir
ect)
--
Bars
Eff
ecti
ve R
en
ts (
$ / S
F)
-- L
ines
Vacancy, Total, Class A Vacancy, Total, Class B Effective Rent, Class A Effective Rent, Class B
0%
5%
10%
15%
20%
25%
1Q
98
3Q
98
1Q
99
3Q
99
1Q
00
3Q
00
1Q
01
3Q
01
1Q
02
3Q
02
1Q
03
3Q
03
1Q
04
3Q
04
1Q
05
3Q
05
1Q
06
3Q
06
1Q
07
3Q
07
1Q
08
3Q
08
1Q
09
3Q
09
1Q
10
3Q
10
1Q
11
3Q
11
1Q
12
3Q
12
1Q
13
Vacan
cy (
Dir
ect &
In
dir
ect)
Vacancy, Direct, Class A Vacancy, Indirect, Class A Class A Starts
-12
-8
-4
0
4
8
12
-75,000
-50,000
-25,000
0
25,000
50,000
75,000
1Q
98
3Q
98
1Q
99
3Q
99
1Q
00
3Q
00
1Q
01
3Q
01
1Q
02
3Q
02
1Q
03
3Q
03
1Q
04
3Q
04
1Q
05
3Q
05
1Q
06
3Q
06
1Q
07
3Q
07
1Q
08
3Q
08
1Q
09
3Q
09
1Q
10
3Q
10
1Q
11
3Q
11
1Q
12
3Q
12
1Q
13
SF
Of
Ab
so
rpti
on
Need
ed
Fo
r R
en
t G
row
th -
- B
ars
(In
Mil
lio
ns)
Em
plo
yees N
eed
ed
To
Ab
so
rb S
F
To
Vacan
cy E
qu
ilib
riu
m -
- L
ine
-15%
-10%
-5%
0%
5%
10%
15%
0%
5%
10%
15%
20%
25%
30%
1Q
98
3Q
98
1Q
99
3Q
99
1Q
00
3Q
00
1Q
01
3Q
01
1Q
02
3Q
02
1Q
03
3Q
03
1Q
04
3Q
04
1Q
05
3Q
05
1Q
06
3Q
06
1Q
07
3Q
07
1Q
08
3Q
08
1Q
09
3Q
09
1Q
10
3Q
10
1Q
11
3Q
11
1Q
12
3Q
12
1Q
13
Em
plo
ym
en
t G
row
th -
- T
rail
ing
F
ou
r Q
uart
er
YO
Y G
row
th
Vacan
cy (
Dir
ect &
In
dir
ect)
Vacancy, Direct -- Total Vacancy, Indirect -- Total Employment Growth
26Robert W. Baird & Co.

July 9, 2013 | Real Estate Office
Virginia Beach
Town Center is achieving the highest rates and holding steady
Surrounding developments near Town Center are seeing lower rates Advertising lower rates to try and get out of the ground
Rents range from $21 - low $30s/SF highly dependent on location Town Center is achieving the highest rental rates
TI packages range from $25-40/SF Free rent ranges from 2-6 months for the lease term Market is still being driven by Law firms
Virginia Beach
Office SF % of TotalAHH 697,273 19.8%FPO 1,356,355 9.4%LRY 1,219,468 1.5%
Source: SNL Financial and Baird research
27Robert W. Baird & Co.

July 9, 2013 | Real Estate Office
Washington, D.C.
DC MSA is still a bifurcated market with some activity in the District
The District is outperforming suburban Virginia and Maryland The leasing activity in NoVA is based upon lease expirations
New leasing contracts are near non-existent in NoVA Market is hindered by government contractors 70% of tenants are renewing in place and not relocating
If relocating becoming 30-40% more efficient The expectation is that deal activity will pick up in the 2H13 Not seeing a lot of growth due to the government being stagnant Virtually no space >250k SF Avg. deals are 75-100k SF with Class A space playing “musical chairs”
Market still favors the tenants and will likely do so for the next 12 months DC MSA will continue to be a tenant’s market for the next 12 months
In 12 months, the majority of the large spaces will be taken Concessions and rates have stayed flat in the District TIs for Tyson’s Corner have gone up to $55-80/SF with 1-year free rent
Large Class A space is being driven by shrinking Law firms Law firms are becoming more efficient in how they use their space
Looking for top floor of buildings/an upgrade of space Arnold & Porter signed a pre-lease to commit to the East End
~375k SF Class B space has come out “okay” in the downturn
The flight to quality could change this very soon Class B buildings “might be left behind”
Buildings seeing increased activity include: 600 13th St. (Hines owned) 799 9th St. (BPO owned) 700 13th St. (Beacon Capital Partners)
Washington D.C.
Office SF % of TotalWRE 4,673,000 43.6%FPO 4,577,056 31.7%BXP 10,953,514 25.9%VNO 16,107,000 21.8%OFC 3,804,517 19.5%PDM 3,389,299 16.0%GOV 1,531,311 15.0%BPO 10,050,000 13.1%BDN 3,108,843 9.7%PSB 1,588,424 5.6%FSP 385,894 4.2%CLI 1,292,807 4.1%TPGI 367,487 3.5%CWH 540,283 0.7%LRY 176,058 0.2%DRE 98,624 0.1%
Source: SNL Financial and Baird research
28Robert W. Baird & Co.

Baird's Skyline
Washington D.C. Office Market Fundamentals -- District Of Columbia
Class A Class B Total
Size Of District Of Columbia Office Market (MSF) 87.3 46.1 133.4
% of total market 65.5% 34.5% 100.0%
Office Employment, Estimated ('000) 429.1 232.3 661.3
1-year historical employment growth 1.1%
5-year historical employment growth 0.9%
10-year historical employment growth 1.6%
Vacancy (%) 11.1% 8.7% 10.3%
Direct 10.2% 8.2% 9.5%
Sublet 0.9% 0.5% 0.8%
Effective Rents ($/SF) $34.61 $27.95 $32.31
1-year historical rent growth 0.5% 1.1% 0.7%
5-year historical rent growth 2.2% 2.2% 2.2%
10-year historical rent growth 2.5% 2.4% 2.5%
Vacancy Change Needed For Rent Growth 0.0%
SF of Absorption Needed For Equilibrium (MSF) 0.0
Employment Needed For Equilibrium -
Office Employment Growth Needed For Equilibrium 0.0%
Estimated Time To Reach Market Equilibrium (yrs) 0.0
Current Replacement Cost $753
Acquisition Cost Estimate $578 $499 $551
Discount To Replacement Cost 23.2% 33.7% 26.8%
Current Development Yield 4.4%
Current Acquisition Yield 5.0% 4.6% 4.9%
Public REIT Exposure SF ('000) % of port.
WRE 1,304 12.2%
BXP 4,617 10.9%
PDM 1,613 7.6%
BPO 4,353 5.7%
FPO 718 5.0%
GOV 494 4.8%
VNO 3,552 4.8%
OFC 362 1.9%
CLI 329 1.0%
CWH 428 0.5%
LRY 176 0.2%
Vacancy, Rent & Construction Analysis
Source: Bureau of Labor Statistics, CoStar, and Baird estimates Source: Bureau of Labor Statistics, CoStar, and Baird estimates
Source: CoStar and Baird Research Source: CoStar and Baird Research
Development Yield & Replacement Cost Analysis
Source: CoStar and Baird estimates Source: CBRE, Colliers, Grubb & Ellis, Jones Lang LaSalle, Real Capital Analytics, RSMeans, and Baird estimates
Washington D.C. Employment BreakdownWashington D.C. Statistics at a Glance -- District Of Columbia
Washington D.C. Development Yield -- District of Columbia Washington D.C. Replacement Cost & Historical Trades -- District of Columbia
Washington D.C. Vacancy & Employment -- District of Columbia Washington D.C. Demand Requirement For Equilibrium -- District of Columbia
Washington D.C. Vacancy & Effective Rents -- District of Columbia Washington D.C. Vacancy & Annualized New Construction -- District of Columbia
0%
2%
4%
6%
8%
10%
12%
14%
16%
18%
20%
0%
2%
4%
6%
8%
10%
12%
14%
16%
18%
20%
1Q
98
3Q
98
1Q
99
3Q
99
1Q
00
3Q
00
1Q
01
3Q
01
1Q
02
3Q
02
1Q
03
3Q
03
1Q
04
3Q
04
1Q
05
3Q
05
1Q
06
3Q
06
1Q
07
3Q
07
1Q
08
3Q
08
1Q
09
3Q
09
1Q
10
3Q
10
1Q
11
3Q
11
1Q
12
3Q
12
1Q
13
Rep
lacem
en
t Y
ield
& 1
0-Y
ear
S
pre
ad
New
Co
nstr
ucti
on
, %
Of
Exis
tin
g
Sto
ck,
An
nu
alize
d
Class A Starts Class A Replacement Yield Dev Spread To 10-YR
0%
15%
30%
45%
60%
75%
90%
$0
$200
$400
$600
$800
$1,000
$1,200
198
0
198
1
198
2
198
3
198
4
198
5
198
6
198
7
198
8
198
9
199
0
199
1
199
2
199
3
199
4
199
5
199
6
199
7
199
8
199
9
200
0
200
1
200
2
200
3
200
4
200
5
200
6
200
7
200
8
200
9
201
0
201
1
Dis
co
un
t T
o R
ep
lacem
en
t C
ost
Asset
Valu
e (
$/S
F)
% discount - Class A % discount - Class B Replacement CostTrading Price Class A Trading Price Class B
0%
3%
6%
9%
12%
15%
18%
21%
24%
$0
$5
$10
$15
$20
$25
$30
$35
$40
1Q
98
3Q
98
1Q
99
3Q
99
1Q
00
3Q
00
1Q
01
3Q
01
1Q
02
3Q
02
1Q
03
3Q
03
1Q
04
3Q
04
1Q
05
3Q
05
1Q
06
3Q
06
1Q
07
3Q
07
1Q
08
3Q
08
1Q
09
3Q
09
1Q
10
3Q
10
1Q
11
3Q
11
1Q
12
3Q
12
1Q
13 Vacan
cy
(D
irect
& I
nd
irect)
--
Bars
Eff
ecti
ve R
en
ts (
$ /
SF
) --
Lin
es
Vacancy, Total, Class A Vacancy, Total, Class B Effective Rent, Class A Effective Rent, Class B
0%
5%
10%
15%
20%
25%
1Q
98
3Q
98
1Q
99
3Q
99
1Q
00
3Q
00
1Q
01
3Q
01
1Q
02
3Q
02
1Q
03
3Q
03
1Q
04
3Q
04
1Q
05
3Q
05
1Q
06
3Q
06
1Q
07
3Q
07
1Q
08
3Q
08
1Q
09
3Q
09
1Q
10
3Q
10
1Q
11
3Q
11
1Q
12
3Q
12
1Q
13
Vacan
cy
(D
irect
& I
nd
irect)
Vacancy, Direct, Class A Vacancy, Indirect, Class A Class A Starts
-12.0
-8.0
-4.0
0.0
4.0
8.0
12.0
-60,000
-40,000
-20,000
0
20,000
40,000
60,000
1Q
98
3Q
98
1Q
99
3Q
99
1Q
00
3Q
00
1Q
01
3Q
01
1Q
02
3Q
02
1Q
03
3Q
03
1Q
04
3Q
04
1Q
05
3Q
05
1Q
06
3Q
06
1Q
07
3Q
07
1Q
08
3Q
08
1Q
09
3Q
09
1Q
10
3Q
10
1Q
11
3Q
11
1Q
12
3Q
12
1Q
13 S
F O
f A
bso
rpti
on
Need
ed
Fo
r R
en
t G
row
th -
- B
ars
(In
Millio
ns)
Em
plo
yees N
eed
ed
To
Ab
so
rb S
F
To
Vacan
cy
Eq
uilib
riu
m -
- L
ine
-15.0%
-10.0%
-5.0%
0.0%
5.0%
10.0%
15.0%
0%
5%
10%
15%
20%
25%
30%
1Q
98
3Q
98
1Q
99
3Q
99
1Q
00
3Q
00
1Q
01
3Q
01
1Q
02
3Q
02
1Q
03
3Q
03
1Q
04
3Q
04
1Q
05
3Q
05
1Q
06
3Q
06
1Q
07
3Q
07
1Q
08
3Q
08
1Q
09
3Q
09
1Q
10
3Q
10
1Q
11
3Q
11
1Q
12
3Q
12
1Q
13
Em
plo
ym
en
t G
row
th -
- T
railin
g
Fo
ur
Qu
art
er
YO
Y G
row
th
Vacan
cy
(D
irect
& I
nd
irect)
Vacancy, Direct -- Total Vacancy, Indirect -- Total Employment Growth
Professional and Business Services
23%
Government 23%
Education and Health Services
13%
Trade Transportation and Utilities
13%
Leisure and Hospitality
9%
Other Services 6%
Financial Activities 5%
Mining, Logging, and Construction
5%
Information 2% Manufacturing
1%
29Robert W. Baird & Co.

July 9, 2013 | Real Estate Office
Price Target Justification and Risks Cousins Properties (Outperform; $12/sh price target) - Our $12/sh price target for shares of CUZ is based upon a cash flow based value of $8.65/sh adjusted lower by $1.30/sh for corporate overhead accounted for on a cash basis and adjusted higher by $1.68/sh related to potential balance sheet utilization longer term, by $0.32/sh related to Baird's value of land held for future development, by $0.87/sh related to near-term upside potential of adjusting portfolio occupancy and rents to market and by $1.38/sh representing our estimate of the stabilized value of properties under construction. Risks to CUZ include a geographically concentrated portfolio, a portfolio transition that could be dilutive to earnings, and significant JV investments that could complicate portfolio decision making. Highwoods Properties (Outperform; $39/sh price target) - Our $39/sh price target for shares of HIW is based upon a cash-flow value of $38.31/sh adjusted lower by $4.42/sh for corporate overhead accounted for on a cash basis and adjusted higher by $0.68/sh related to potential balance sheet utilization longer term, by $1.18/sh related to Baird's value of land held for development, by $2.22/sh related to the near-term upside potential of adjusting portfolio occupancy and rents to market and by $1.18/sh representing our estimate of the stabilized value of properties under construction. Risks to HIW include a geographic concentration in low-barriers-to-entry markets, improving the portfolio quality could be dilutive, and a significant land-bank held for development. Parkway Properties (Outperform; $21/sh price target) - Our $21/sh price target for shares of PKY is based upon a cash flow value of $20.15/sh adjusted lower by $1.78/sh for corporate overhead accounted for on a cash basis and adjusted higher by $1.68/sh related to potential balance sheet utilization longer term and by $1.16/sh related to the near-term upside potential of adjusting portfolio occupancy and rents to market. Risks to PKY include market fundamentals are highly dependent on local economies, lease-up acquisitions could require significant capital to secure tenants, and seeking a credit rating could lead to future deleveraging.
30Robert W. Baird & Co.

Appendix - Important Disclosures and Analyst Certification
Covered Companies Mentioned
All stock prices below are the July 8, 2013 closing price.
Armada Hoffler Properties Inc. (AHH - $11.47 - Outperform)Boston Properties, Inc. (BXP - $105.47 - Outperform)Corporate Office Properties Trust (OFC - $26.22 - Outperform)Cousins Properties, Inc. (CUZ - $10.27 - Outperform)Duke Realty Corp. (DRE - $15.74 - Outperform)First Potomac Realty Trust (FPO - $13.63 - Neutral)Franklin Street Properties (FSP - $13.50 - Outperform)Highwoods Properties, Inc. (HIW - $35.21 - Outperform)Investors Real Estate Trust (IRET - $8.69 - Neutral)Kilroy Realty Corporation (KRC - $53.34 - Neutral)Parkway Properties, Inc. (PKY - $17.69 - Outperform)Piedmont Office Realty Trust Inc. (PDM - $18.29 - Outperform)SL Green Realty Corp. (SLG - $90.81 - Neutral)Thomas Properties Group, Inc. (TPGI - $5.47 - Outperform)Washington Real Estate Investment Trust (WRE - $27.07 - Outperform)(See recent research reports for more information)
Robert W. Baird & Co. Incorporated and/or its affiliates expect to receive or intend to seek investment banking related compensationfrom the company or companies mentioned in this report within the next three months.Robert W. Baird & Co. Incorporated may not be licensed to execute transactions in all foreign listed securities directly. Transactions inforeign listed securities may be prohibited for residents of the United States. Please contact a Baird representative for more information.Investment Ratings: Outperform (O) - Expected to outperform on a total return, risk-adjusted basis the broader U.S. equity marketover the next 12 months. Neutral (N) - Expected to perform in line with the broader U.S. equity market over the next 12 months.Underperform (U) - Expected to underperform on a total return, risk-adjusted basis the broader U.S. equity market over the next 12months.Risk Ratings: L - Lower Risk - Higher-quality companies for investors seeking capital appreciation or income with an emphasis onsafety. Company characteristics may include: stable earnings, conservative balance sheets, and an established history of revenue andearnings. A - Average Risk - Growth situations for investors seeking capital appreciation with an emphasis on safety. Companycharacteristics may include: moderate volatility, modest balance-sheet leverage, and stable patterns of revenue and earnings. H -Higher Risk - Higher-growth situations appropriate for investors seeking capital appreciation with the acceptance of risk. Companycharacteristics may include: higher balance-sheet leverage, dynamic business environments, and higher levels of earnings and pricevolatility. S - Speculative Risk - High-growth situations appropriate only for investors willing to accept a high degree of volatility and risk.Company characteristics may include: unpredictable earnings, small capitalization, aggressive growth strategies, rapidly changingmarket dynamics, high leverage, extreme price volatility and unknown competitive challenges.Valuation, Ratings and Risks. The recommendation and price target contained within this report are based on a time horizon of 12months but there is no guarantee the objective will be achieved within the specified time horizon. Price targets are determined by asubjective review of fundamental and/or quantitative factors of the issuer, its industry, and the security type. A variety of methods may beused to determine the value of a security including, but not limited to, discounted cash flow, earnings multiples, peer group comparisons,and sum of the parts. Overall market risk, interest rate risk, and general economic risks impact all securities. Specific informationregarding the price target and recommendation is provided in the text of our most recent research report.Distribution of Investment Ratings. As of June 28, 2013, Baird U.S. Equity Researchcovered 690 companies, with 51% ratedOutperform/Buy, 47% rated Neutral/Holdand 2% rated Underperform/Sell. Within these rating categories, 14% ofOutperform/Buy-ratedand 10% of Neutral/Hold-rated companies have compensatedBaird for investment banking services in the past 12 months and/orBairdmanaged or co-managed a public offering of securities for these companies inthe past 12 months.Analyst Compensation. Analyst compensation is based on: 1) The correlation between the analyst's recommendations and stock priceperformance; 2) Ratings and direct feedback from our investing clients, our institutional and retail sales force (as applicable) and fromindependent rating services; 3) The analyst's productivity, including the quality of the analyst's research and the analyst's contribution tothe growth and development of our overall research effort and 4) Compliance with all of Robert W. Baird’s internal policies andprocedures. This compensation criteria and actual compensation is reviewed and approved on an annual basis by Baird's ResearchOversight Committee.Analyst compensation is derived from all revenue sources of the firm, including revenues from investment banking. Baird does notcompensate research analysts based on specific investment banking transactions.A complete listing of all companies covered by Baird U.S. Equity Research and applicable research disclosures can be accessed athttp://www.rwbaird.com/research-insights/research/coverage/research-disclosure.aspx .You can also call 1-800-792-2473 or write: Robert W. Baird & Co., Equity Research, 24th Floor, 777 E. Wisconsin Avenue, Milwaukee,
July 9, 2013 | Real Estate Office
31Robert W. Baird & Co.

WI 53202.Analyst Certification. The senior research analyst(s) certifies that the views expressed in this research report and/or financial modelaccurately reflect such senior analyst's personal views about the subject securities or issuers and that no part of his or her compensationwas, is, or will be directly or indirectly related to the specific recommendations or views contained in the research report.DisclaimersBaird prohibits analysts from owning stock in companies they cover.This is not a complete analysis of every material fact regarding any company, industry or security. The opinions expressed here reflectour judgment at this date and are subject to change. The information has been obtained from sources we consider to be reliable, but wecannot guarantee the accuracy.ADDITIONAL INFORMATION ON COMPANIES MENTIONED HEREIN IS AVAILABLE UPON REQUESTThe Dow Jones Industrial Average, S&P 500, S&P 400 and Russell 2000 are unmanaged common stock indices used to measure andreport performance of various sectors of the stock market; direct investment in indices is not available.Baird is exempt from the requirement to hold an Australian financial services license. Baird is regulated by the United States Securitiesand Exchange Commission, FINRA, and various other self-regulatory organizations and those laws and regulations may differ fromAustralian laws. This report has been prepared in accordance with the laws and regulations governing United States broker-dealers andnot Australian laws.Copyright 2013 Robert W. Baird & Co. IncorporatedOther DisclosuresThe information and rating included in this report represent the Analyst’s long-term (12 month) view as described above. The researchanalyst(s) named in this report may at times, discuss, at the request of our clients, including Robert W. Baird & Co. salespersons andtraders, or may have discussed in this report, certain trading strategies based on catalysts or events that may have a near-term impacton the market price of the equity securities discussed in this report. These trading strategies may differ from the analysts’ published pricetarget or rating for such securities. Any such trading strategies are distinct from and do not affect the analysts’ fundamental long-term (12month) rating for such securities, as described above. In addition, Robert W. Baird & Co. Incorporated and/or its affiliates (Baird) mayprovide to certain clients additional or research supplemental products or services, such as outlooks, commentaries and other detailedanalyses, which focus on covered stocks, companies, industries or sectors. Not all clients who receive our standard company-specificresearch reports are eligible to receive these additional or supplemental products or services. Baird determines in its sole discretion theclients who will receive additional or supplemental products or services, in light of various factors including the size and scope of theclient relationships. These additional or supplemental products or services may feature different analytical or research techniques andinformation than are contained in Baird’s standard research reports. Any ratings and recommendations contained in such additional orresearch supplemental products are consistent with the Analyst’s long-term ratings and recommendations contained in more broadlydisseminated standard research reports.UK disclosure requirements for the purpose of distributing this research into the UK and other countries for which Robert W.Baird Limited holds an ISD passport.This report is for distribution into the United Kingdom only to persons who fall within Article 19 or Article 49(2) of the Financial Servicesand Markets Act 2000 (financial promotion) order 2001 being persons who are investment professionals and may not be distributed toprivate clients. Issued in the United Kingdom by Robert W. Baird Limited, which has offices at Mint House 77 Mansell Street, London, E18AF, and is a company authorized and regulated by the Financial Conduct Authority. For the purposes of the Financial ConductAuthority requirements, this investment research report is classified as objective.Robert W. Baird Limited ("RWBL") is exempt from the requirement to hold an Australian financial services license. RWBL is regulated bythe Financial Conduct Authority ("FCA") under UK laws and those laws may differ from Australian laws. This document has beenprepared in accordance with FCA requirements and not Australian laws.
Ask the analyst a question Click here to unsubscribe
July 9, 2013 | Real Estate Office
32Robert W. Baird & Co.