real estate outlook denver multifamily market watch · denver multifamily market watch ......
TRANSCRIPT
DENVER MULTIFAMILY MARKET WATCHTHIRD QUARTER 2016
REAL ESTATE OUTLOOK
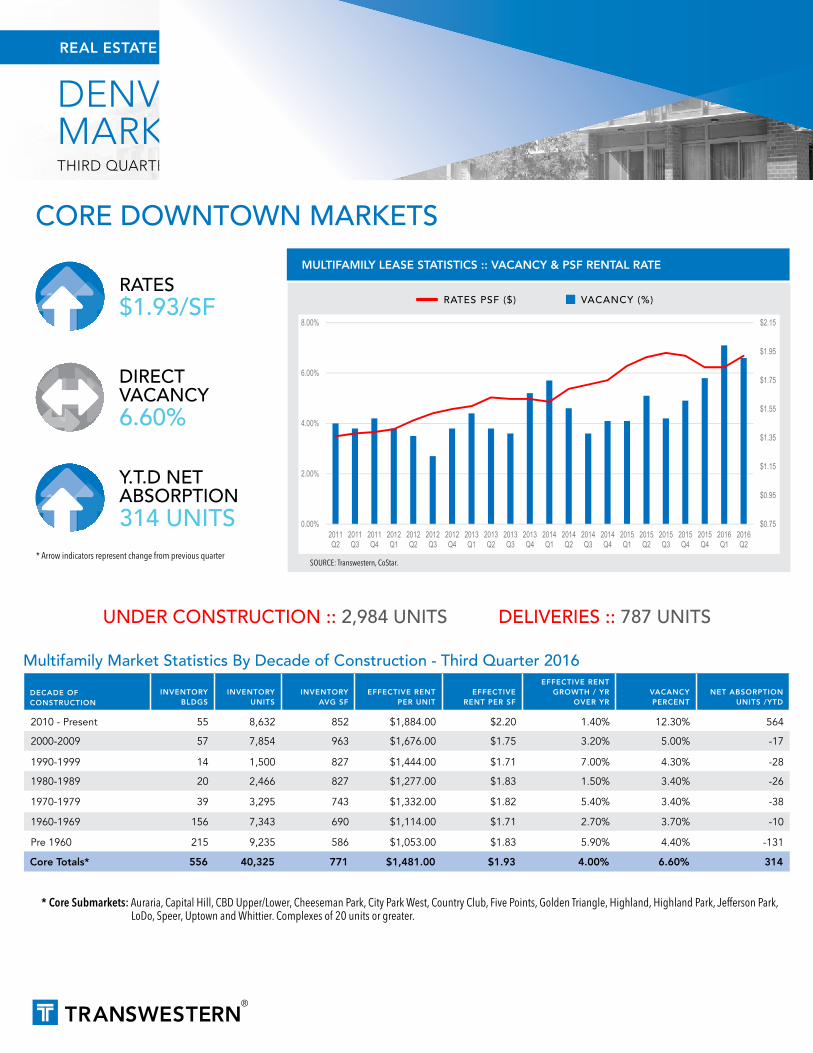
MULTIFAMILY LEASE STATISTICS :: VACANCY & PSF RENTAL RATE
RATES PSF ($) VACANCY (%)
$0.75
$0.95
$1.15
$1.35
$1.55
$1.75
$1.95
$2.15
0.00%
2.00%
4.00%
6.00%
8.00%
2011Q2
2011Q3
2011Q4
2012Q1
2012Q2
2012Q3
2012Q4
2013Q1
2013Q2
2013Q3
2013Q4
2014Q1
2014Q2
2014Q3
2014Q4
2015Q1
2015Q2
2015Q3
2015Q4
2015Q4
2016Q1
2016Q2
Downtown/Core SubmarketsVacancy Rates PSF ($)
SOURCE: Transwestern, CoStar.
Multifamily Market Statistics By Decade of Construction - Third Quarter 2016
DECADE OF CONSTRUCTION
INVENTORY BLDGS
INVENTORY UNITS
INVENTORY AVG SF
EFFECTIVE RENT PER UNIT
EFFECTIVE RENT PER SF
EFFECTIVE RENT GROWTH / YR
OVER YRVACANCY PERCENT
NET ABSORPTION UNITS /YTD
2010 - Present 55 8,632 852 $1,884.00 $2.20 1.40% 12.30% 564
2000-2009 57 7,854 963 $1,676.00 $1.75 3.20% 5.00% -17
1990-1999 14 1,500 827 $1,444.00 $1.71 7.00% 4.30% -28
1980-1989 20 2,466 827 $1,277.00 $1.83 1.50% 3.40% -26
1970-1979 39 3,295 743 $1,332.00 $1.82 5.40% 3.40% -38
1960-1969 156 7,343 690 $1,114.00 $1.71 2.70% 3.70% -10
Pre 1960 215 9,235 586 $1,053.00 $1.83 5.90% 4.40% -131
Core Totals* 556 40,325 771 $1,481.00 $1.93 4.00% 6.60% 314
* Core Submarkets: Auraria, Capital Hill, CBD Upper/Lower, Cheeseman Park, City Park West, Country Club, Five Points, Golden Triangle, Highland, Highland Park, Jefferson Park, LoDo, Speer, Uptown and Whittier. Complexes of 20 units or greater.
RATES $1.93/SF
DIRECT VACANCY 6.60%
Y.T.D NET ABSORPTION 314 UNITS
* Arrow indicators represent change from previous quarter
CORE DOWNTOWN MARKETS
UNDER CONSTRUCTION :: 2,984 UNITS DELIVERIES :: 787 UNITS

DENVER MULTIFAMILY MARKET WATCHTHIRD QUARTER 2016
2 REAL ESTATE OUTLOOK DENVER MULTIFAMILY MARKET Q3 2016
MULTIFAMILY LEASE STATISTICS :: VACANCY & PSF RENTAL RATE
RATES PSF ($) VACANCY (%)
$0.75
$0.85
$0.95
$1.05
$1.15
$1.25
$1.35
$1.45
$1.55
0.00%
2.00%
4.00%
6.00%
2011Q2
2011Q3
2011Q4
2012Q1
2012Q2
2012Q3
2012Q4
2013Q1
2013Q2
2013Q3
2013Q4
2014Q1
2014Q2
2014Q3
2014Q4
2015Q1
2015Q2
2015Q3
2015Q4
2015Q4
2016Q1
2016Q2
Suburban SubmarketsVacancy Rates PSF ($)
SOURCE: Transwestern, CoStar.
Multifamily Market Statistics By Decade of Construction - Third Quarter 2016
DECADE OF CONSTRUCTION
INVENTORY BLDGS
INVENTORY UNITS
INVENTORY AVG SF
EFFECTIVE RENT PER UNIT
EFFECTIVE RENT PER SF
EFFECTIVE RENT GROWTH / YR
OVER YRVACANCY PERCENT
NET ABSORPTION UNITS /YTD
2010 - Present 131 24,650 944 $1,514.00 $1.64 -1.40% 11.30% 3,884
2000-2009 191 40,448 955 $1,358.00 $1.43 -0.60% 3.50% 18
1990-1999 110 27,068 939 $1,397.00 $1.49 0.00% 4.30% -274
1980-1989 207 43,512 847 $1,211.00 $1.43 0.40% 3.50% -316
1970-1979 402 52,183 742 $1,004.00 $1.36 3.50% 3.40% -816
1960-1969 274 16,230 770 $1,002.00 $1.30 1.80% 3.10% -157
Pre 1960 100 4,891 812 $1,059.00 $1.26 4.00% 3.40% -34
Suburban Totals* 1,415 208,982 859 $1,235.00 $1.44 0.90% 4.60% 2,305
* Suburban Submarkets: All other markets in the metro area south to Castle Rock, north to Louisville/Lafayette and Broomfield. Boulder is excluded. Complexes of 20 units or greater.
RATES $1.44/SF
DIRECT VACANCY 4.60%
Y.T.D NET ABSORPTION 2,305 UNITS
* Arrow indicators represent change from previous quarter
SUBURBAN MARKETS
UNDER CONSTRUCTION :: 9,858 UNITS DELIVERIES :: 814 UNITS

DENVER MULTIFAMILY MARKET WATCHTHIRD QUARTER 2016
3 REAL ESTATE OUTLOOK DENVER MULTIFAMILY MARKET Q3 2016
Denver
CentennialAirport
Int'lAirport
BuckleyAir Force
Base
CherryCreek
Reservoir
ChatfieldLake
StandleyLake
BarrLakeBroomfield
Brighton
Thorton
CommerceCity
HighlandsRanch
Parker
Aurora
GreenwoodVillage
CastleRock
Arvada
Lafayette
Lakewood
Louisville
Denver
RubyHill
Park
CityPark
Cheeseman
DenverCC
CivicCenterPark
Capitol
Park
WashingtonPark
Invesco
CoorsField
PepsiCenterElitch
Gardens
Cherry CreekMall
Field AtMile High
DenverZoo
University
AurariaCampus
Of Denver
Suburban Markets
Core Downtown Markets
DENVER MULTIFAMILY MARKET WATCHTHIRD QUARTER 2016
Copyright © 2016 Transwestern. All rights reserved. No part of this work may be reproduced or distributed to third parties without written permission of the copyright owner. The information contained in this report was gathered by Transwestern from CoStar and other primary and secondary sources believed to be reliable. Transwestern, however, makes no representation concerning the accuracy or completeness of such information and expressly disclaims any responsibility for any inaccuracy contained herein.
T 303.639.3000 www.transwestern.com/denver
4643 S. Ulster Street, Suite 300Denver, CO 80237
About Denver Multifamily The Denver Multifamily team focuses on maximizing value for real estate investors through dispositions, consulting, and acquisitions. Our engaged sales approach provides assurance of achieving the highest market value for every asset. With a wealth of proficiency in executing multifamily transactions, in depth market knowledge, and a highly technical valuation platform, our team provides owners, sellers and buyers with an unparalleled multifamily expertise.
SEATTLE
WALNUT CREEK
LOS ANGELES
SALT LAKECITY
DENVER
MINNEAPOLIS
MILWAUKEE
ST. LOUIS
CHICAGO
DETROIT GREENWICHNEW YORK
NEW JERSEY
BALTIMORENORTHERNVIRGINIA
BETHESDAWASHINGTON DC
DALLASFORTWORTH
HOUSTONAUSTIN
SAN ANTONIO
OKLAHOMACITY
NEW ORLEANS
ATLANTA
FORT LAUDERDALEORLANDO
MIAMI-DADE
SANFRANCISCO
PHOENIXORANGE COUNTY
SAN DIEGO
BOSTON
SILICONVALLEY
Transwestern Locations
CONTACT:
MULTIFAMILY
CONTACT:
Kevin Roberts :: President, Southwest713.270.3347 :: [email protected]
Tom Wanberg :: Senior Vice President303.952.5592 :: [email protected]
Bill Lawrence :: Senior Vice President303.407.1460 :: [email protected]
John Blackshire :: Broker Associate303.952.5603 :: [email protected]
Jeffrey Buckingham :: Research Analyst303.952.5606 :: [email protected]
Danielle Brown :: Marketing Coordinator303.952.5604 :: [email protected]
*Source Transwestern, CoStar. The information in this report is the result of a compilation of information on the multifamily properties located in the Denver metropolitan area. This report includes multifamily complexes of 20 units or greater.
Net absorption occurs when a lease is signed, not when physically occupied, pre-leased space counts as net absorption when a building delivers. Vacant space that is not available for direct lease is excluded, sublease space is excluded.
About Transwestern Transwestern is a privately held real estate firm of collaborative entrepreneurs who deliver a higher level of personalized service — The Transwestern Experience. Specializing in Agency Leasing, Management, Tenant Advisory, Capital Markets, Research and Sustainability services, our fully integrated global enterprise adds value for investors, owners and occupiers of all commercial property types. We leverage market insights and operational expertise from members of the Transwestern family of companies specializing in development, real estate investment management and research. Transwestern has 34 U.S. offices and assists clients through more than 180 offices in 37 countries as part of a strategic alliance with BNP Paribas Real Estate.
Experience Extraordinary at Transwestern.com/denver and @TranswesternCO.