real sector propagation of the recent global … filei staff paper no. 83 real sector propagation of...
TRANSCRIPT

i
Staff Paper No. 83
REAL SECTOR PROPAGATION OF THE RECENT GLOBAL FINANCIAL CRISIS: AN INTEGRATIVE REPORT
Reza Siregar and C.S. Lim, Vincent
The South East Asian Central Banks (SEACEN) Research and Training Centre
(The SEACEN Centre) Kuala Lumpur, Malaysia
ii
Staff Paper No. 83
REAL SECTOR PROPAGATION OF THE RECENT GLOBAL FINANCIAL CRISIS: AN INTEGRATIVE REPORT
Reza Siregar and C.S. Lim, Vincent
June 2011

iii
Table of Contents
Page Abstract iv 1. Background and Motivation 1 2. Taking Stock of Economic Wide Impacts 6 2.1 Capital Flows 6 2.2 Tourism 8 2.3 Export Performance 13 3. Trade Collapse: Demand versus Financing 21 3.1 Literature Review on Trade Financing 21 3.2 Empirical Approach 23 3.3 Empirical Results 24 4. Selected Policy Perspectives and Concluding Remarks 28 References 32
List of Tables
Table 1: Soundness Indicators of Selected East and
Southeast Asian Economies 3 Table 2: The Tale of Two Crises 4 Table 3: Trade Openness 5 Table 4: Asia’s Subprime Loss 6 Table 5: Travel and Tourism Contribution to GDP 10 Table 6: Travel & Tourism: Total Contribution to Employment 12 Table 7: Rates of Contraction in World Export during
the Sub-prime Crisis 13 Table 8: Estimation Results of Export Equation 26 Table 9: Summary of Empirical Results 27
List of Figures
Figure 1: Capital Flows in the SEACEN Region 7 Figure 2: Export Performance of Indonesia during 1997 Crisis
and 2008 Sub-prime Crisis 15 Figure 3: Export Performance of Cambodia, Jan 1995 – Nov 2010 16 Figure 4: Export Performance of Indonesia, Jan 1995- Nov 2010 16 Figure 5: Export Performance of Korea, Jan 1995- Nov 2010 17 Figure 6: Export Performance of Malaysia, Jan 1995 – Nov 2010 17 Figure 7: Export Performance of Philippines, Jan 1995 – Nov 2010 18 Figure 8: Export Performance of Thailand, Jan 1995 – Nov 2010 18 Figure 9: Ratio of (Export to China) to (Export to US) for
Selected East and Southeast Asian Economies 20

iv
Abstract
This paper attempts to examine the real sector propagation of the recent global financial crisis in the SEACEN economies. The study is of particular interest as SEACEN economies are known for their trade-oriented nature. The paper shows that weak demand, particularly in traditional markets of SEACEN economies like the United States, Japan and European markets, has an adverse effect on exports. The study also identifies the non- availability of trade financing as another potential channel to weakening of exports. This implies that during the time of crisis, particularly when external demand is at its weakest, the availability of trade finance is of vital importance.
In general, it is noted that ensuring the soundness of the overall financial system to
create a conducive environment for the credit markets is a key feature that can contribute positively to the promotion of exports. The study also provides indications of policy stances towards making trade financing more accessible.
1
1. Background and Motivation
Two contrasting trends emerged at the outset of the recent global financial crisis (GFC) in a number of key SEACEN economies. On the one hand, the resilient financial sectors, particularly the banking sector, of this group of emerging markets generally withstood the crisis and emerged relatively unscathed. In contrast to the period of the 1997 East Asian financial crisis, the capital adequacy and liquidity positions of the banking sector of these economies remain above the Basel requirements, while non-performing loans have been kept at very low levels in the recent years (Table 1). Inflows of capital to SEACEN economies have also been adversely affected by the subprime crisis. However, the impacts have, fortunately, been limited to a relatively short window of period, predominantly between the last quarter of 2008 and first quarter of 2009, while very limited impacts have been reported on direct investments.
Yet exports of key SEACEN economies have been indiscriminately impaired by the recent global financial meltdown. As will be further demonstrated, the impact of the GFC 2008 on the real sectors came predominantly through trade channels. For those economies most acutely affected by the 1997 financial crisis, namely Indonesia, Thailand and Korea, export declines were significantly more severe during the GFC than in 1997 (Table 2). In fact, the rate of decline in global trade during the recent sub-prime crisis has been more severe and more widely spread than during the era of Great Depression of the 1930s.
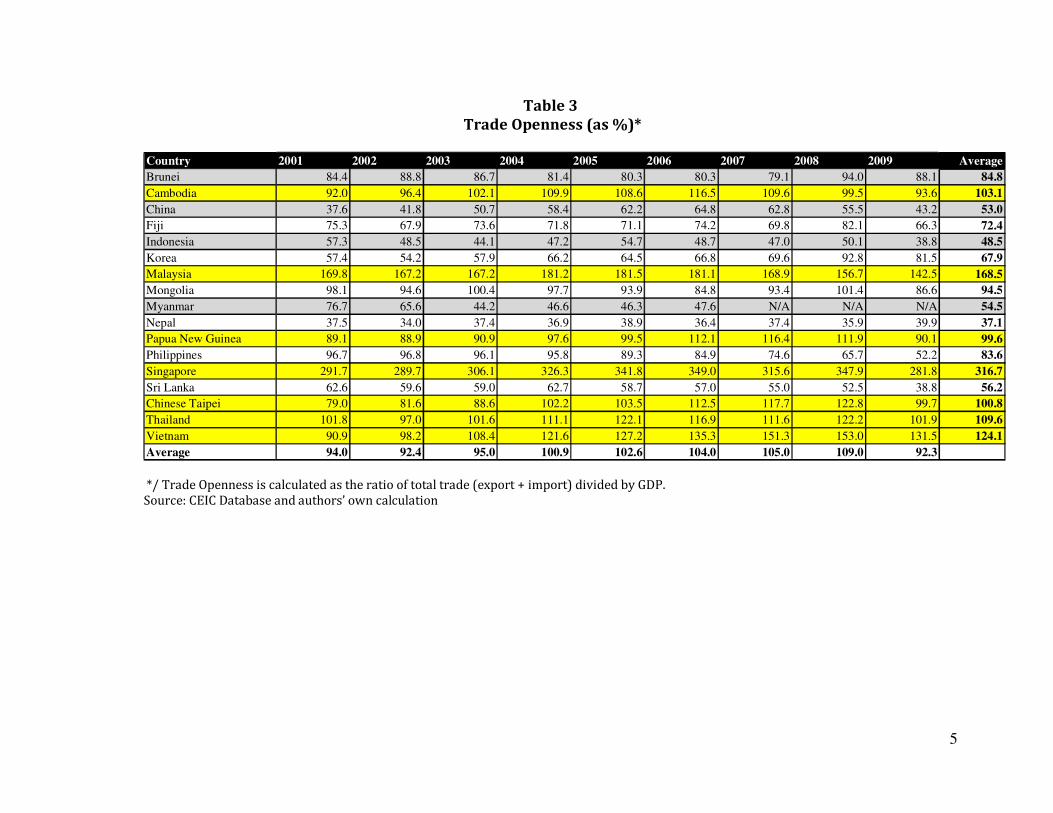
SEACEN economies have largely been known for their trade-oriented nature. At the peak in 2009, the average ratio of total trade (export and import) over GDP of this group of economies was well above 100 percent (Table 3). At the lower end, the total trade of China, Indonesia, Nepal and Sri Lanka ranged at around 40 percent of GDP in 2009. At the high end of the spectrum, the total trade of Malaysia, Singapore, Thailand and Vietnam were well above 100 percent of their GDPs, with Singapore’s trade reported to be about almost three times of its GDP. It is, therefore, understandable that policy makers of SEACEN economies are apprehensive that the sub-prime financial crisis would engulf their domestic real sectors via trade deterioration. After all, the link between financial crisis and balance of payment of crisis has been well established in the past. A seminal work of Kaminsky and Reinhart (1999) on financial, currency and balance of payment crises for the period of 1970 - mid-1995 claims that the beginning of banking-sector problems predate balance of payment-crisis. Some have even argued that economic activity of major Asian economies has come to depend heavily on exports, and has become highly vulnerable to their interruption (Akyuz (2001)).
During the 1997 financial crisis, two key factors have frequently been underlined by early studies as the root causes of poor export/trade performance in the East and Southeast Asian economies (Lane, 1999; Stephens, 1998). The first factor is the exchange rate factor. The large swings, especially severe depreciation, of the local currencies have exacerbated the fundamental weaknesses of the affected economies. Depreciated currencies brought many financial institutions and their customers into insolvency. The second factor is the scarcity of short-term trade financing facilities.

2
Supporting these early works on the 1997 financial crisis, more recent studies have included Asmundson, et.al. (2011) and Raddatz (2008), who further expounded on the importance of trade financing in explaining slowdowns in trade activities. Accompanying the sharp fall in global trade, the joint IMF–Banker’s Association for Trade and Finance (BAFT) Survey further found that the decrease in the value of trade finance accelerated between October 2008 and January 2009 in almost every region of the world (BAFT, 2009). The World Bank estimates that 85–90 percent of the fall in world trade since the second half of 2008 is due to falling international demand, and 10–15 percent is attributable to a fall in the supply of trade finance (Auboin, 2009). Raddatz (2008) has further claimed that the role of trade financing has been strengthened by the structure of production lines through regional supply chains and the move to the greater importance of cross-border dispersion of component production and assemblies within vertically integrated production processes in Asia.
The objective of this research project is to empirically assess the impacts of the recent global financial crisis on the real sectors of the SEACEN economies. We will observe and analyse investment activities of these economies and also the performance of the service industry, especially the tourism sector. But more importantly, we will spend a large portion of our Report on the international trade sector. Empirical testing will be conducted to appraise factors contributing to the performance of exports in the SEACEN region. Accordingly, the following set of policy concerns will be examined. First, what factors contributed to the recent sudden export drops during the GFC? Has the decline in the demand of our products, especially by the advanced and most severely affected economies by the recent GFC, indeed been the major factor? Have we seen the repeat of the 1997 East Asian crisis whereby trade financing contracted sharply and led to the severe collapse of export production? In particular, has the export sector’s degree of dependence on trade financing heightened during times of economic crisis? Establishing possible links between trade financing and trade sector performance is, indeed, crucial to gather a better understanding of the impacts of a financial sector meltdown on real sectors. The links between financial sector conditions and the performance of the real sectors of the economy, often referred to as macro-financial linkages, have been under close scrutiny following the recent sub-prime global financial crisis.
In this integrative report, we would in particular pay close attention to the experiences of the following economies, namely Cambodia, Indonesia, Malaysia, Mongolia, Philippines, Papua New Guinea, Chinese Taipei, Thailand and Sri Lanka. Some of these economies, such as Indonesia, Malaysia, Philippines, Thailand and Korea were among the worst affected by the acute collapse in trade financing during the 1997 East Asian financial crisis. Yet, despite the severity of this recent crisis, hardly any empirical work has assessed the dependency of these economies’ export sectors on the availability of trade financing on a economy-by-economy case. The availability of official data on trade financing or credit remains a major hurdle to carrying out comprehensive empirical studies, which partly explains why early works on trade financing for emerging markets are relatively scarce and are mostly based on panel testing.

3
Table 1 Soundness Indicators of Selected East and Southeast Asian Economies
Source: Questionnaire Replies from Member Banks
Non-Performing Loans Risk-Weighted Capital Bank Return on
(% of Bank Loans) Adequacy Ratio Assets
1999 2007 2009 2010 1999 2007 2009 2010 1999 2007 2009 2010
Brunei - - - - - - - - - - - -
Cambodia - 3.4 6.1 Sep/ - - 23.6 32.2 Sep/ - - - - -
Fiji - 6.0 3.3 Sep/ - - 13.2 16.2 Sep/ - - - - -
Indonesia 32.9 4.0 3.3 2.5 -6.7 19.2 17.4 17.2 -8.7 2.8 2.6 2.9
Korea 8.3 0.6 1.2 1.9 10.8 12.0 14.4 14.6 -1.3 1.1 0.4 0.5
Malaysia 16.6 6.4 3.6 3.4 12.5 13.2 15.4 14.6 0.7 1.5 1.3 1.5
Mongolia - 3.2 16.5 Sep/ - - 14.2 7.5 Sep/ - - - - -
Myanmar - 2.4 2.6 Sep/ - - 43.4 57.28 Sep/ - - - - -
Nepal - 10.3 3.64 Sep/ - - -1.71 4.34 Jun/ - - - - -
Papua New Guinea - 1.7 1.35 Jun/ - - - - - - - - -
Philippines 14.6 4.5 4.1 4.3 Sep/ 17.5 15.9 15.8 16.2 June/ 0.4 1.3 1.2 1.4 Sep/
Singapore 5.3 1.5 2.4 1.8 Sep/ 20.6 13.5 17.3 18.6 1.2 1.3 1.1 1.2 Sep/
Sri Lanka - 5.0 8.6 Sep/ - - 13.6 14.1 Sep/ - - - - -
Chinese Taipei 4.9 Dec/ 1.8 1.2 0.6 11.2 Dec/ 10.8 11.6 Sep/ - 0.5 0.14 Dec/ 0.3 Jun/ -
Thailand 38.6 7.3 5.3 3.9 12.4 15.4 15.8 16.0 -5.7 0.1 1.0 1.1
Vietnam - 1.5 2.2 Sep/ - - - - - - - - -

4
Table 2 The Tale of Two Crises*
Economy The 1997 Financial Crisis The Sub-prime Crisis Export Trade Financing Export Trade Financing
Indonesia –27% (Quarter 3, 1997–
Quarter 1, 1999) –38% (Quarter 3, 1997– Quarter 3, 1998)
–38% (Quarter 3, 2008– Quarter 1, 2009)
–22% (Quarter 3, 2008– Quarter 1, 2009)
Korea
–17% (Quarter 4, 1997– Quarter 3, 1998)
–17% (Quarter 2, 1997 – Quarter 1, 1998)
–35% (Quarter 3, 2008 – Quarter 1, 2009)
–7% (Quarter 3, 2008 – Quarter 3, 2009)
Thailand
–11% (Quarter 4, 1997– Quarter 2, 1998)
–35% (Quarter 1, 1997– Quarter 3, 1998)
–31% (Quarter 3, 2008– Quarter 1, 2009)
–38% (Quarter 3, 2008– Quarter 1, 2009)
*Note: We limit the observation period to an 8-quarter span following the peak amount prior to the outbreak of the crisis. Source: CEIC Database, the websites of Bank Indonesia, Bank of Korea and Bank of Thailand, and the authors’ own calculation.
5
Table 3 Trade Openness (as %)*
Country 2001 2002 2003 2004 2005 2006 2007 2008 2009 Average
Brunei 84.4 88.8 86.7 81.4 80.3 80.3 79.1 94.0 88.1 84.8
Cambodia 92.0 96.4 102.1 109.9 108.6 116.5 109.6 99.5 93.6 103.1
China 37.6 41.8 50.7 58.4 62.2 64.8 62.8 55.5 43.2 53.0
Fiji 75.3 67.9 73.6 71.8 71.1 74.2 69.8 82.1 66.3 72.4
Indonesia 57.3 48.5 44.1 47.2 54.7 48.7 47.0 50.1 38.8 48.5
Korea 57.4 54.2 57.9 66.2 64.5 66.8 69.6 92.8 81.5 67.9
Malaysia 169.8 167.2 167.2 181.2 181.5 181.1 168.9 156.7 142.5 168.5
Mongolia 98.1 94.6 100.4 97.7 93.9 84.8 93.4 101.4 86.6 94.5
Myanmar 76.7 65.6 44.2 46.6 46.3 47.6 N/A N/A N/A 54.5
Nepal 37.5 34.0 37.4 36.9 38.9 36.4 37.4 35.9 39.9 37.1
Papua New Guinea 89.1 88.9 90.9 97.6 99.5 112.1 116.4 111.9 90.1 99.6
Philippines 96.7 96.8 96.1 95.8 89.3 84.9 74.6 65.7 52.2 83.6
Singapore 291.7 289.7 306.1 326.3 341.8 349.0 315.6 347.9 281.8 316.7
Sri Lanka 62.6 59.6 59.0 62.7 58.7 57.0 55.0 52.5 38.8 56.2
Chinese Taipei 79.0 81.6 88.6 102.2 103.5 112.5 117.7 122.8 99.7 100.8
Thailand 101.8 97.0 101.6 111.1 122.1 116.9 111.6 122.2 101.9 109.6
Vietnam 90.9 98.2 108.4 121.6 127.2 135.3 151.3 153.0 131.5 124.1
Average 94.0 92.4 95.0 100.9 102.6 104.0 105.0 109.0 92.3 */ Trade Openness is calculated as the ratio of total trade (export + import) divided by GDP. Source: CEIC Database and authors’ own calculation
6
The rest of the Chapter will be as follows. The next Section takes stock of the
impacts of the recent global financial crisis on various key real sectors of the SEACEN economies. Section 3 starts with a literature review and close examination of export performance of selected SEACEN economies. Next, we will discuss the empirical approaches, including model specification and econometric testing, to further examine various contributing factors to export performance during the recent global financial crisis. Discussions on the appropriateness of the stimulus policy measures implemented in these economies are presented in Section 4. A brief concluding section ends the paper. 2. Taking Stock of Economic Wide Impacts 2.1 Capital Flows
The adverse impact of capital flows into the SEACEN region was much
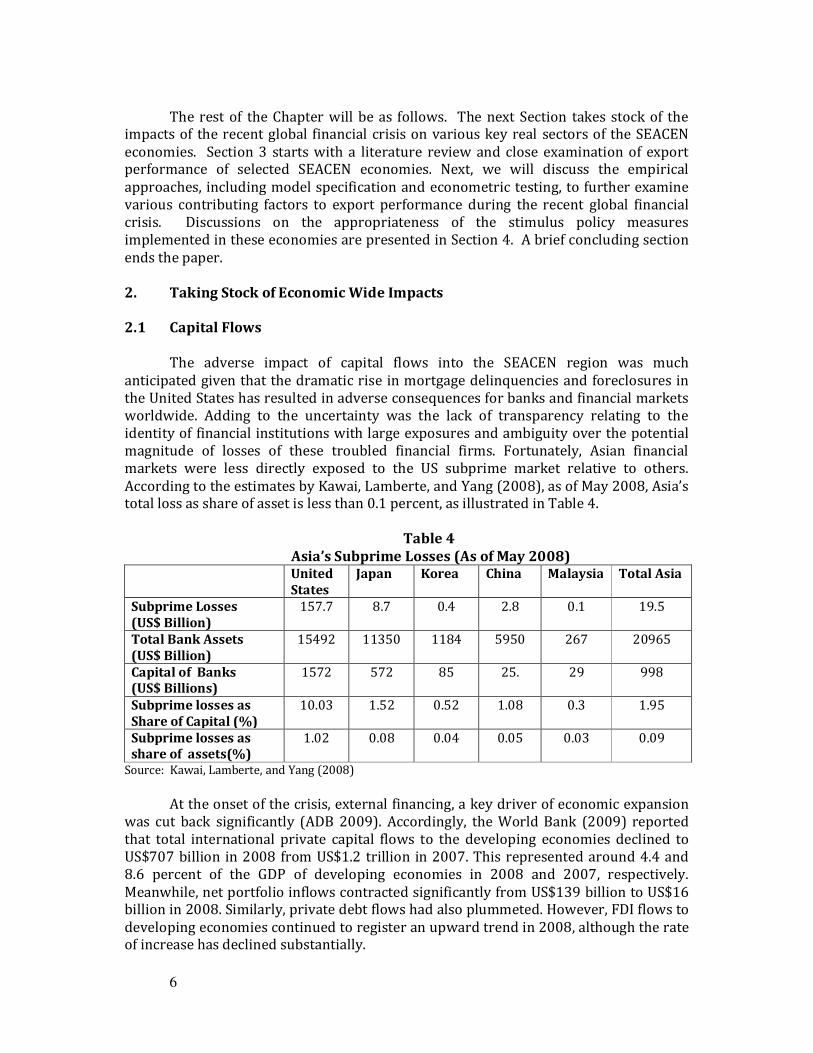
anticipated given that the dramatic rise in mortgage delinquencies and foreclosures in the United States has resulted in adverse consequences for banks and financial markets worldwide. Adding to the uncertainty was the lack of transparency relating to the identity of financial institutions with large exposures and ambiguity over the potential magnitude of losses of these troubled financial firms. Fortunately, Asian financial markets were less directly exposed to the US subprime market relative to others. According to the estimates by Kawai, Lamberte, and Yang (2008), as of May 2008, Asia’s total loss as share of asset is less than 0.1 percent, as illustrated in Table 4.
Table 4
Asia’s Subprime Losses (As of May 2008) United
States Japan Korea China Malaysia Total Asia
Subprime Losses (US$ Billion)
157.7 8.7 0.4 2.8 0.1 19.5
Total Bank Assets (US$ Billion)
15492 11350 1184 5950 267 20965
Capital of Banks (US$ Billions)
1572 572 85 25. 29 998
Subprime losses as Share of Capital (%)
10.03 1.52 0.52 1.08 0.3 1.95
Subprime losses as share of assets(%)
1.02 0.08 0.04 0.05 0.03 0.09
Source: Kawai, Lamberte, and Yang (2008)
At the onset of the crisis, external financing, a key driver of economic expansion
was cut back significantly (ADB 2009). Accordingly, the World Bank (2009) reported that total international private capital flows to the developing economies declined to US$707 billion in 2008 from US$1.2 trillion in 2007. This represented around 4.4 and 8.6 percent of the GDP of developing economies in 2008 and 2007, respectively. Meanwhile, net portfolio inflows contracted significantly from US$139 billion to US$16 billion in 2008. Similarly, private debt flows had also plummeted. However, FDI flows to developing economies continued to register an upward trend in 2008, although the rate of increase has declined substantially.
7
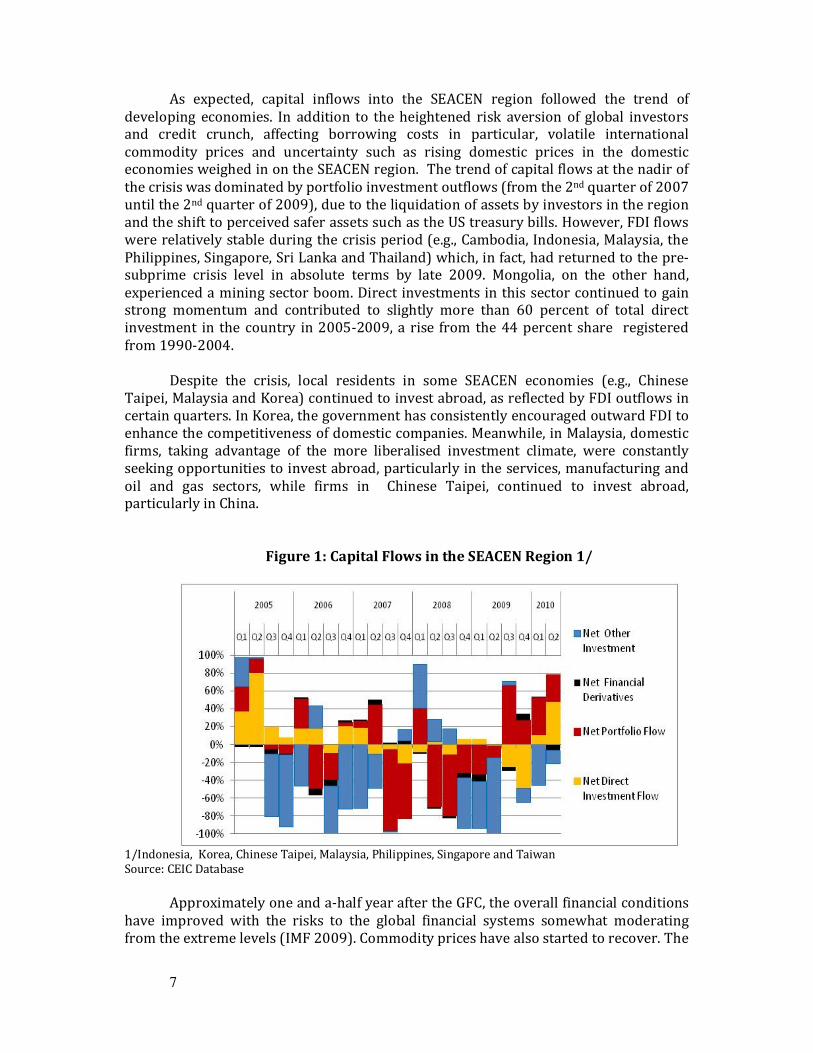
As expected, capital inflows into the SEACEN region followed the trend of developing economies. In addition to the heightened risk aversion of global investors and credit crunch, affecting borrowing costs in particular, volatile international commodity prices and uncertainty such as rising domestic prices in the domestic economies weighed in on the SEACEN region. The trend of capital flows at the nadir of the crisis was dominated by portfolio investment outflows (from the 2nd quarter of 2007 until the 2nd quarter of 2009), due to the liquidation of assets by investors in the region and the shift to perceived safer assets such as the US treasury bills. However, FDI flows were relatively stable during the crisis period (e.g., Cambodia, Indonesia, Malaysia, the Philippines, Singapore, Sri Lanka and Thailand) which, in fact, had returned to the pre-subprime crisis level in absolute terms by late 2009. Mongolia, on the other hand, experienced a mining sector boom. Direct investments in this sector continued to gain strong momentum and contributed to slightly more than 60 percent of total direct investment in the country in 2005-2009, a rise from the 44 percent share registered from 1990-2004.
Despite the crisis, local residents in some SEACEN economies (e.g., Chinese
Taipei, Malaysia and Korea) continued to invest abroad, as reflected by FDI outflows in certain quarters. In Korea, the government has consistently encouraged outward FDI to enhance the competitiveness of domestic companies. Meanwhile, in Malaysia, domestic firms, taking advantage of the more liberalised investment climate, were constantly seeking opportunities to invest abroad, particularly in the services, manufacturing and oil and gas sectors, while firms in Chinese Taipei, continued to invest abroad, particularly in China.
Figure 1: Capital Flows in the SEACEN Region 1/
1/Indonesia, Korea, Chinese Taipei, Malaysia, Philippines, Singapore and Taiwan Source: CEIC Database
Approximately one and a-half year after the GFC, the overall financial conditions
have improved with the risks to the global financial systems somewhat moderating from the extreme levels (IMF 2009). Commodity prices have also started to recover. The

8
unprecedented coordinated and stabilisation efforts in the form of monetary and fiscal policies in major developed economies have prevented a deeper global recession. By the third quarter of 2009, in the wake of better global conditions underpinned by improved liquidity in the global financial markets, SEACEN economies started to experience net capital inflows, dominated by portfolio flows. Proportion-wise, foreign direct investments have also started to pick up during the first-half of 2010. By the fourth quarter of 2010, capital flows into the SEACEN region can be analysed in the context of two major events - the second quantitative easing by the US Federal Reserve and the Ireland Banking Crisis.
The second quantitative easing (QE2) of the Federal Reserve, while did not result
in any direct effect on capital flows, did set off a chain of events. According to the IMF (2011), U.S. residents’ net purchases of foreign securities recovered but not enough to make any significant impact on cross-border flows which were still below the pre-crisis level. However, QE2 together with the ZIRP (zero-interest rate policy) resulted in US investors looking for better yields and more liquid markets for emerging assets. It is noted that debt inflows, particularly, government bonds were significant during this period, again due to their higher yields.
The other major event, the Ireland Banking Crisis of November 2010, dented
confidence in an already uncertain financial market in the Euro region, further widening the earning potential between emerging Asian and matured markets. This contributed to investors’ preference for emerging market assets. Thus, in general, the shift in global asset allocation combined with ample domestic liquidity has led to pressures in the asset price markets and at the same time, heightened volatility in the currency market in some SEACEN economies. Inflationary pressures also have been generally higher than those of developed economies. To avoid overheating in such an environment of closing output gaps and higher inflation, SEACEN economies have started to implement various macro-prudential measures.1 This has included, for instance, setting loan-to-value ratio (LVT) (Korea, Malaysia, Singapore), limiting banks’ foreign exchange exposure (Korea) and selective capital controls on inflows (non-residents are not permitted to open short-term time deposit accounts (Chinese Taipei)). All these measures are aimed at not only managing capital flows but also preserving the soundness of financial systems. In addition, the adverse effects of large capital reversal have largely been cushioned by sound domestic banking systems with relatively minimal exposure to risky/toxic assets as well as relatively high official reserves. It is, however, worth noting that the continuous uncertainties surrounding the sovereign debt crisis in a number of European economies and accelerating inflation will continue to plague the SEACEN economies.
2.2 Tourism
The travel and tourism sector of the SEACEN economies has, undoubtedly, been adversely affected by the recent subprime crisis. This strategic sector is closely intertwined with other sectors of the economy such as transportation, tours and retail sales. From 2000 to 2010, the travel and tourism and related industries contributed
1 Malaysia, Philippines and Singapore have indicated that there are no plans to implement any form of
capital flow restrictions in the near future.

9
between 5 percent to over 20 percent of the GDPs of the SEACEN economies (Tables 5-5b). Moreover, these sectors absorbed anywhere from 5 percent to 14 percent of total employment of SEACEN economies (Table 6).
In general, tourist arrivals in the SEACEN region from North America and Europe
have declined substantially following the subprime crisis, resulting in lower tourism receipts. Tourist arrivals within the region had also declined substantially. The tourism business in Myanmar, for example, started to drop at the end of 2007 and continued in 2008 which coincided with the deadly cyclone Nargis. Looking at the total contribution of the travel and tourism sector to GDP, it is clear that most SEACEN economies experienced a decline in terms of growth. The average growth rates of this sector during the subprime crisis period (2008-2010) for most SEACEN economies as listed in Table 6, were significantly less than the rates during the pre-crisis (2000-2007). This included Korea, Cambodia, Chinese Taipei, Malaysia, Papua New Guinea, Philippines, Singapore, Thailand and Vietnam (World Travel and Tourism Council).2
It is clear, however, that three tourism dependent economies of Cambodia, Philippines and Thailand have been most adversely affected. Cambodia, for instance, had seen its travel and tourism sector contract by an average of 6.8 percent in 2008 and 2009. This was in sharp contrast to strong growths which averaged above 24 percent per annum from 2000 to 2007. After a contraction of around 8 percent in 2008, the travel and tourism industry of the Philippines experienced another year of negative growth of 15 percent in 2009. At its peak in 2004-2006, this sector contributed over 15 percent of the total employment in the country. At the end of 2010, the contribution dropped to about 12 percent, the lowest since the 1997 East Asian financial crisis.
2 GDP generated by industries by direct Travel and Tourism industry plus the indirect and induced contributions, including the contribution of capital investment spending.

10
Table 5
Travel and Tourism Contribution to GDP
Source: World Travel and Tourism Council

11
Table 5b
Travel and Tourism Contribution to GDP (cont’d)
Travel & Tourism
Total Contribution
to GDP 1995 1996 1997 1998 1999 2000 2001 2002 2003 2004 2005 2006 2007 2008 2009 2010
Papua New Guinea
US$ bn 0.132 0.149 0.129 0.09 0.111 0.141 0.106 0.123 0.125 0.162 0.167 0.139 0.146 0.18 0.22 0.271
Real growth (%) -16.2 13 -15.5 0.6 30.6 21.6 -13.7 18.5 -13.1 16 -7.7 -25.2 -1.5 4.1 28.8 16.3
% share 2.7 2.9 2.6 2.5 3.2 4 3.4 4 3.3 3.8 3.4 2.5 2.3 2.2 2.7 3
Philippines
US$ bn 8.485 9.856 10.517 9.297 12.065 11.365 10.71 11.579 11.107 13.648 15.487 18.389 22.123 22.654 18.502 21.632
Real growth (%) 1.5 9.8 12.9 11.1 14.8 0.1 2.2 4.6 -2.9 19.8 4.7 5.1 5.1 -8.2 -14.6 6.4
% share 11.4 11.8 12.7 14.2 15.8 14.9 15 15 13.9 15.7 15.6 15.6 15.3 13.5 11.4 11.4
Singapore
US$ bn 10.998 11.48 12.22 10.689 9.99 9.705 6.556 7.64 6.97 9.983 10.855 11.582 15.893 16.363 15.788 17.529
Real growth (%) 6.3 2.8 10.7 0 -0.5 -4.6 -28.2 17.5 -9.8 33.2 4.9 0.2 22.2 -4.2 1.1 4.2
% share 12.6 12 12.3 12.5 11.7 10.2 7.4 8.4 7.2 8.8 8.6 7.9 8.9 8.4 8.6 7.8
Sri Lanka
US$ bn 0.913 0.847 1.018 1.028 1.073 0.856 1.11 1.515 1.677 1.938 2.106 2.438 2.71 3.206 3.155 3.714
Real growth (%) 34 -10.8 18.2 1.7 9.4 -18.5 33.9 30.3 6.2 11.3 -2.2 7.5 3.7 -0.4 -1.1 10.7
% share 7 6 6.7 6.5 6.8 5.2 7 8.8 8.8 9.3 8.6 8.6 8.3 7.8 7.5 7.7
Thailand
US$ bn 18.341 22.838 20.312 16.66 18.608 20.214 19.124 21.944 23.654 27.827 27.711 34.651 43.643 46.022 41.409 46.66
Real growth (%) 17.4 21.8 4.6 -0.1 6.7 13.8 2.5 10 2.7 10.5 -4.7 11.7 3.5 3.7 -8.1 0.7
% share 10.9 12.5 13.3 14.8 15.2 16.5 16.5 17.3 16.6 17.2 15.7 16.7 16.4 16.7 15.7 14.7
Vietnam
US$ bn 1.548 1.487 2.489 2.714 2.595 2.789 3.041 3.469 3.325 4.534 5.592 7.876 5.689 10.141 10.667 9.424
Real growth (%) 39.1 -11.6 66.3 13.7 -4.9 5.6 11.1 13.8 -8.8 27.9 14.8 32.4 -32.8 47.7 3.8 -9.1 Source: World Travel and Tourism Council.

12
Table 6
Travel & Tourism: Total Contribution to Employment
Travel & Tourism
Total Contribution
to Employment 1995 1996 1997 1998 1999 2000 2001 2002 2003 2004 2005 2006 2007 2008 2009 2010
Korea
% share 7.7 7.1 6.2 6.4 6.3 6.1 6.1 5.6 5.4 5.4 5.6 5.9 5.4
Brunei
% share 6.5 6.1 6.4 4.9 5 6.8 8.7 6.5 8.2 7.8 8.2 7.2 7.5 7.1 7.2 6.8
Cambodia
% share 1.9 4.8 4.2 5.4 8.4 12.3 14.7 16.7 14.2 18.6 20.4 20.5 21.3 18.5 17.7 17.6
Chinese Taipei
% share 5 5.6 5.2 4.9 5 4.8 4.7 5.2 4.4 3.8 3.8 4.1 4.2 4.1 4.1 4.4
Indonesia
% share 10 10.6 11.1 11.6 11 10.2 10.4 9.5 8.8 8.7 8.7 8.2 8.3 8.5 8.5 8
Malaysia
% share 11.3 13.3 12.9 10.1 12.1 11.8 12.9 12.6 11.3 12.4 12.9 12.6 15 13.4 14.5 13.7
Nepal
% share 7.8 8.2 7.3 8.6 7.6 8.3 8.3 6.6 7.6 7.5 5.9 5.1 5.3 6.1 6 5.8
Papua New Guinea
% share 2.3 2.5 2.2 2.1 2.8 3.4 3 3.5 2.9 3.3 2.9 2.1 2 1.9 2.4 2.6
Philippines
% share 10.6 10.9 11 13.4 13.4 15.2 15 15.1 14.2 15.4 15.3 15.3 15 13.8 12.3 12.1
Singapore
% share 9.5 8.2 8.6 8.9 8.5 8.2 5.5 6.3 4.9 6.7 6.7 6.2 7.3 6.8 6.4 6
Sri Lanka
% share 6.1 5.3 5.8 5.6 5.9 4.5 6.1 7.7 7.7 8.2 7.5 7.5 7.3 6.9 6.6 6.8
Thailand
% share 12.6 12.6 12.4 12.5 12.2 13.2 13.5 14.1 13.2 14.1 12.4 13.5 13.3 13.5 12.7 11.8
Vietnam
% share 6.4 5.2 8 8.6 7.8 7.7 8 8.5 7.2 8.6 9.1 11.1 6.9 9.6 9.4 8 Source: World Travel and Tourism Council

13
2.3 Export Performance The recent global crisis has been accompanied by an unprecedented collapse in
world trade. The fear of severe and prolonged collapse of exports was felt in the SEACEN region and other emerging markets. Within a period of 8 months from the last quarter of 2008 to the first quarter of 2009, world trade had contracted by 25 percent (Table 7). Furthermore, a pattern of trade falling deeper and faster than industrial production was consistently reported across different parts of the world, with a few exception such as Japan. In emerging economies, the divergence was particularly striking - the drop in industrial production was equal to 9 percent spread over a period of 7 months, while trade fall was three times bigger (28 percent) and took as little as 3 months to materialise. Interestingly, the collapse bottomed out in May 2009 for most of the rich nations and even earlier for the Asian emerging markets. Based on the trends reported in Table 7, the great trade collapse was primarily driven by a sudden, synchronised and severe drop in demand. This suggests that trade may recover rapidly as demand recovers. To confirm this, the significant role of the demand factor has been tested for a number of SEACEN cases and will be reported in the later part of the paper.
Table 7
Rates of Contraction in World Export during the Sub-prime Crisis
Goods Exports (cumulative change in %)
No. Months (peak to trough)
Through Month
Industrial Production Index (cumulative change)
No. Months
World -25% 8 2009 M05 -13% 11
All Industrialised Economies
-24%
8
2009 M05
-17%
12
US -23% 7 2009 M05 -14% 14
Japan -22% 8 2009 M06 -36% 12
Emerging Markets
-28%
3
2009 M01
-9%
7
China -26% 3 2009 M01 -2% 5 Korea -25% 3 2009 M01 -22% 6
Chinese Taipei -38% 2 2008 M12 -36% 5
Source: Baldwin and Taglioni (2009)
For some SEACEN economies, the fear of a worse export meltdown than that during
the 1997 East Asian crisis was keenly felt. The total exports of Indonesia, for instance, contracted by around 35 percent year-on-year within three months from the initial decline in October 2008 (Figure 2). In comparison, the 1997/1998 crisis saw a more gradual meltdown of the export sector, taking about 14 months for the total export value of the economy to reach the bottom, recording about 27 percent contraction year-on-year by end

14
of 1998. Similarly, the recovery process was much quicker during the 1997/1998 Asian financial crisis. Similar experiences were reported for other SEACEN economies (Table 2).
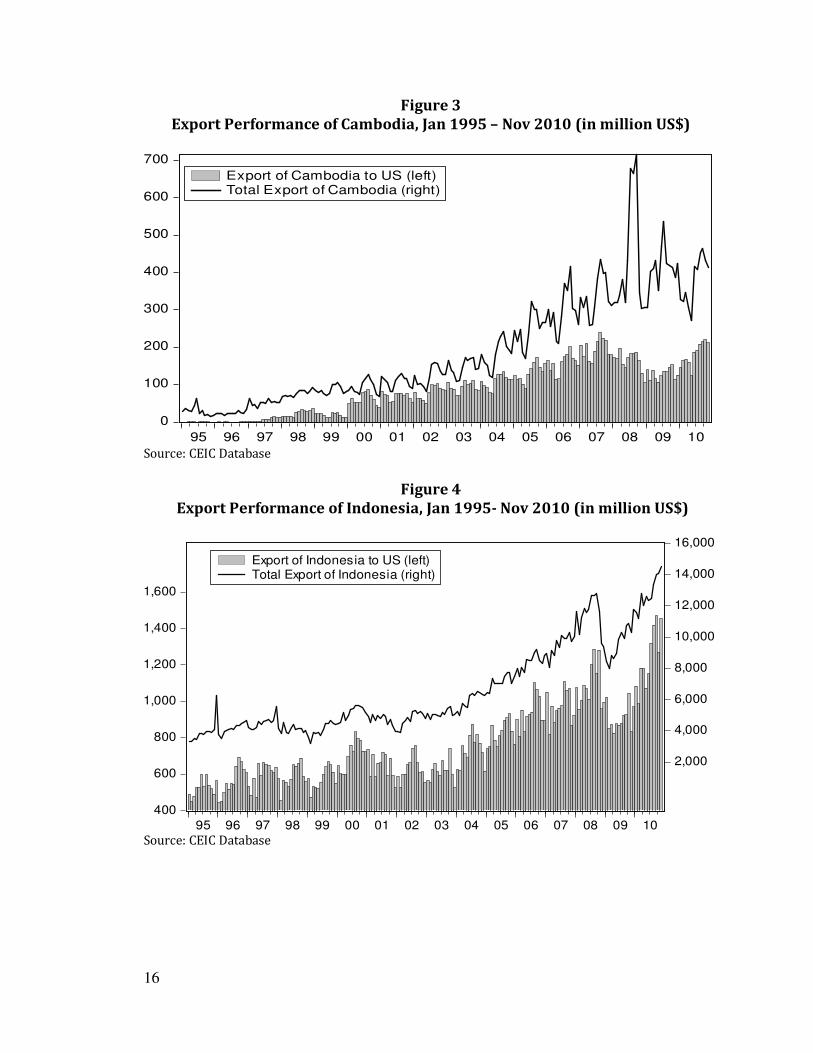
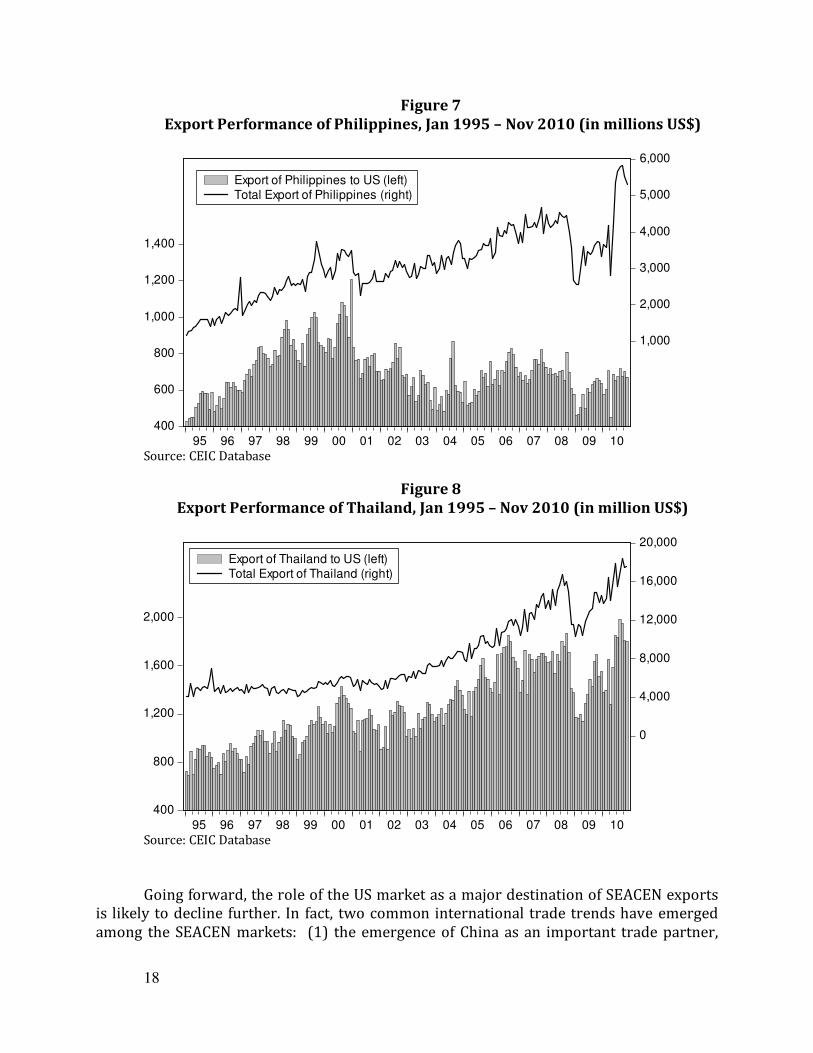
It is clear that the slowdown in the US economy has impacted exports of the SEACEN
economies to the US during the recent subprime crisis, as demonstrated by selected cases in Figures 3-8. However, it is important to acknowledge that the “direct” impact of the decline in the exports to US on total contractions of the exports of these SEACEN economies has been limited in most parts. The monthly exports of these economies to US have continued to decline in the past decade. For instance, the US economy only absorbed around 10 percent of total exports of Korea in 2009. Furthermore, the annual changes in the exports of Korea to US at the end of 2008 and 2009 contributed only around 1 and 4.5 percent of the changes in the total exports of Korea for these particular periods, respectively. On the other hand, for an emerging economy like Cambodia, the role of the US economy remains important, absorbing more than 30 percent of total exports. Nonetheless, the export share of Cambodia to US economy has declined substantially from around 65 percent in 2000 to about 31 percent in 2009.

15
Figure 2 Export Performance of Indonesia during 1997 Crisis and 2008 Sub-prime Crisis
Note: a). 1997 Crisis: t0 = October 1997 and t17 = March 1999 b). 2008 Sub-prime crisis: t0 = October 2008 and t11= September 2009 Source: CEIC Database.
16
Figure 3 Export Performance of Cambodia, Jan 1995 – Nov 2010 (in million US$)
0
100
200
300
400
500
600
700
95 96 97 98 99 00 01 02 03 04 05 06 07 08 09 10
Export of Cambodia to US (left)Total Export of Cambodia (right)
Source: CEIC Database
Figure 4
Export Performance of Indonesia, Jan 1995- Nov 2010 (in million US$)
400
600
800
1,000
1,200
1,400
1,600
2,000
4,000
6,000
8,000
10,000
12,000
14,000
16,000
95 96 97 98 99 00 01 02 03 04 05 06 07 08 09 10
Export of Indonesia to US (left)Total Export of Indonesia (right)
Source: CEIC Database

17
Figure 5 Export Performance of Korea, Jan 1995- Nov 2010 (in million US$)
1,000
2,000
3,000
4,000
5,000
0
10,000
20,000
30,000
40,000
50,000
95 96 97 98 99 00 01 02 03 04 05 06 07 08 09 10
Export of Korea to US (left)Total Export of Korea (right)
Source: CEIC Database
Figure 6 Export Performance of Malaysia, Jan 1995 – Nov 2010 (in millions US$)
500
1,000
1,500
2,000
2,500
3,000
4,000
8,000
12,000
16,000
20,000
24,000
95 96 97 98 99 00 01 02 03 04 05 06 07 08 09 10
Export of Malaysia to US (left)Total Export of Malaysia (right)
Source: CEIC Database
18
Figure 7 Export Performance of Philippines, Jan 1995 – Nov 2010 (in millions US$)
400
600
800
1,000
1,200
1,400
1,000
2,000
3,000
4,000
5,000
6,000
95 96 97 98 99 00 01 02 03 04 05 06 07 08 09 10
Export of Philippines to US (left)Total Export of Philippines (right)
Source: CEIC Database
Figure 8 Export Performance of Thailand, Jan 1995 – Nov 2010 (in million US$)
400
800
1,200
1,600
2,000
0
4,000
8,000
12,000
16,000
20,000
95 96 97 98 99 00 01 02 03 04 05 06 07 08 09 10
Export of Thailand to US (left)Total Export of Thailand (right)
Source: CEIC Database
Going forward, the role of the US market as a major destination of SEACEN exports
is likely to decline further. In fact, two common international trade trends have emerged among the SEACEN markets: (1) the emergence of China as an important trade partner,

19
and (2) the increased intraregional trade, with corresponding decline in share with developed economies. For example, in the Philippines, during the 1997 crisis, more than half (55 percent) of Philippine exports went to North America and Europe while exports to Asian economies stood at 43 percent. In 2009, the trend has reversed, with Asia absorbing 56 percent of Philippine exports, while exports to North America and Europe accounted for only around 40 percent. Similarly, in Indonesia, by export destination, the importance of the Japan, EU, and US markets has declined in recent years, in contrast to the expanding share of Indonesia’s exports to China.
Turning to Malaysia’s direction of trade, its exports to the advanced G-3 economies
(US, Japan & the EU) accounted for about half of total exports in 2000. This share has been progressively been reduced to about 30 percent in 2009. In contrast, exports to regional economies have increased to nearly half of total exports in 2009. In particular, Malaysia’s exports to China have increased by approximately six times in value, from 3.1 percent of total exports in 2000 to 12.2 percent in 2009, making China the second largest export destination after Singapore. In Thailand, the major destinations for its exports have been the U.S., EU and Japan or G3 markets until 2008. The share of Thai exports to the G3 markets has fallen from an average of 48.4 percent of total exports during 1995-2007 to 33.2 percent in 2009. This has been replaced by new markets such as ASEAN, China and the Middle East. For Chinese Taipei; China (including Hong Kong) has become the largest destination for its merchandise exports, accounting for slightly over 40 percent of total exports in 2009, replacing the US. Even then, the share of merchandise exports to the six ASEAN countries reached 14.80 percent in 2009, which is higher than the share of the US total of 11.56 percent. The main trading partner of Mongolia (mainly minerals) and Myanmar (mainly energy in the form of gas) is also China. The only exception is Papua New Guinea, whose main trading partner is Australia due to geographical proximity.
Figure 9 demonstrates vividly the fast changing nature of the trade relationship of a
number of SEACEN economies with the US market relative to the Chinese market. In the last decade, China has become both a major exporter and importer of tradable goods in Asia. This economy, which is second largest in the world, ultimately accounts for about 50 percent of all trade flows in imported inputs in Asia in 2009, which is more than double its share in 1995 (IMF (2011)). At the same time, China’s share in direct and indirect intermediate goods exports within Asia has doubled to nearly 30 percent in 2009, from 15 percent a decade earlier.
A simple calculation of export ratios for all five Asian economies in terms of their
bilateral trade patterns with China and US consistently reveal the fast and emerging dominant role of China as a major destination for export goods (Figure 9). The steep increase in total exports to China started to be noticeable in the early period of 2000s, only a few years following the 1997 East Asian crisis in all the five SEACEN economies examined. In 1995, exports of these five SEACEN economies to China were averaging around 20 percent of their exports to the US market. By end of 2010, exports to China on average almost doubled those to the US. In particular, this phenomenon of the rapid rise of bilateral trade of China with its regional neighbours, is most evident in the case of Korea.

20
By end of 2010, Korea’s monthly export to China was averaging around 2.5 times of the economy’s exports with the traditional markets of the US and Japan.
More importantly for the policy makers of the SEACEN region, maintaining trade
surpluses with China has become critical to achieving strong overall current account positions. With the exception of Indonesia and Singapore, and to a lesser extent the Philippines, the other three major SEACEN economies have successfully maintained trade surplus positions during the past decade with China. Korea and Thailand, in particular, have seen growing trade surpluses with China during the latter half of the last decade. Indonesia, on the other hand, saw its monthly marginal trade surplus of around US$70 million during the first half of 2000s (until 2006) turn into a deficit of around US$150 million following the subprime crisis.
Figure 9
Ratio of (Exports to China) to (Exports to US) for Selected East and Southeast Asian Economies
0.0
0.4
0.8
1.2
1.6
1996 1998 2000 2002 2004 2006 2008 2010
Indonesia
0.0
0.5
1.0
1.5
2.0
2.5
3.0
3.5
1996 1998 2000 2002 2004 2006 2008 2010
Korea
0.0
0.5
1.0
1.5
2.0
2.5
1996 1998 2000 2002 2004 2006 2008 2010
Malaysia
0.0
0.5
1.0
1.5
2.0
2.5
1996 1998 2000 2002 2004 2006 2008 2010
Philippines
0.0
0.2
0.4
0.6
0.8
1.0
1.2
1.4
1996 1998 2000 2002 2004 2006 2008 2010
Thailand
Source: Authors’ own calculation and CEIC Database
21
To understand further the influence of Chinese trade on these five SEACEN economies, it is imperative to look further into the structures of trade of this second largest economy. It is estimated that processing trade accounted for more than 40 percent of China’s total trade by the mid 2000s. These processing trades explain most of China’s trade balances with its trading partners globally (Xing (2011)).3 Four of the SEACEN economies, namely Korea, Philippines, Thailand and Singapore have been competing in this processing trade and in 2008, these four economies have, in fact, been listed as among the top ten sources of China’s processing imports (Xing (2011)). Korea, for example, exported around US$60 billion of China’s processing imports, while the processing exports of Thailand, Philippines and Singapore were around US$12.5 billion, US$10 billion and US$8.8 billion, respectively. 3. Trade Collapse: Demand versus Financing
In view of the above, how then do we explain the sharp collapse of exports from some SEACEN economies during the recent global financial crisis? Has this been a consequence of another round of trade financing shortage, as experienced during the 1997 East Asian financial crisis? Has the weak demand instead been more of a dominant factor contributing to the sharp fall of the SEACEN exports? Moreover, given the volatile commodity prices during the pre- and post-subprime crisis period, has the price or terms of trade factor contributed as well? To address these pertinent questions, this Section first discusses a number of key literatures on the determinants of export performance. It will then be followed by a brief presentation of a basic empirical model on export demand used to carry out empirical testing on selected SEACEN cases (see the project papers of member banks). A summary of the empirical test finding on factors behind the export downturns will bebpresented at the final sub-section. 3.1 Literature Review on Trade Financing
Does trade financing matter for export activities? To our knowledge, a number of
studies have attempted to address this question directly and indirectly. However, it is important to first underscore that trade financing, especially trade credit, is offered by both financial and non-financial institutions. The role of non-financial firms in providing trade credits is particularly more important in an economy where the quality of financial intermediation is low (Fisman and Love (2003)). In short, trade credit may provide access to capital for firms that are unable to raise it through more traditional channels, such as the banking sector. Why do industrial firms extend trade credit when financial institutions, such as banks, can provide that facility? There are a number of possible motives which have also been theoretically supported (Petersen and Rajan (1997)).
3 A typical example of processing trade is iPhone trade between the People’s Republic of China (PRC) and the US. This advanced mobile phone is exclusively assembled in China. However, all components are produced in Germany; Japan; Republic of Korea; Chinese Taipei and the US. These components are shipped to PRC and final products are fully assembled in PRC, before being finally exported to the rest of the world (Xing (2011)).

22
In terms of the financing motive, imperfect capital markets enable suppliers to finance borrowing firms at a lower cost than financial institutions (Smith (1987)). In their work, Petersen and Rajan (1995) demonstrate that the supplier of trade credit has a long-term interest in the survival of the borrower. The credit supplier is willing to subsidise borrowers with lower interest rates since they expect to reap a higher return from future activities.
In addition, according to transaction theory of trade credit, firms can economise on
the joint costs of exchange by using trade credits. Many have demonstrated theoretically that trade credit providers have information advantages to sort ‘buyers’ of their trade financing (Brennan, et.al. (1998) and Smith (1987)). Banks could also get the necessary information but through their normal course of business activities while firms may be able to get them faster and more accurately. In addition, suppliers of trade credit have the advantage over the collaterals. Furthermore, the more durable the goods exchanged in the business transactions, the better the collateral provided and the greater the credit the supplier can extend (Mian and Smith (1992)). Ferris (1981) has also demonstrated that trade credit may reduce transaction costs for the borrower. Rather than paying bills every time goods are delivered, the firm might want to schedule the payment on a monthly basis for instance. Transaction costs could also be lowered as trade finance could allow the firm to stock inventory and manage it better.
On the empirical works, some focus more on the link between the availability of
finance and firm/sector performance. They find that, indeed, the growth of the firms depends heavily on the availability of trade finance. Fisman and Love (2003), for instance, further claim that where the quality of financial intermediation is low, firms relying more on trade finance tend to grow faster. Studies have also arrived to a general agreement that the role of trade finance/credit on export performance is even more formidable during crisis or recessionary periods. Dell’ Ariccia, et.al. (2008) show that during periods of financial distress, external finance dependent industries were hurt disproportionally more. In a related study, Borensztein and Panizza (2006) find that industries with higher propensity to export are more adversely affected during periods of sovereign defaults. Similarly, Braun and Larrain (2005) demonstrate that during a recession, industries that depend relatively more on external finance get hurt more.
In the past decade, the inter-linkage between the real and the financial sector has
increased tremendously. One clear evidence where this linkage can be captured is the fluctuations of international bank claims on the region. In their recent paper, Siregar and Choy (2010) found that the size of international bank lending from private banks in seven Organization for Economic Cooperation and Development (OECD) economies to nine East Asian economies fluctuate in tandem with the economic performance of the recipient economies. Accompanying the slowdown of economic growth in the East Asian economies was a sharp decline in loans from commercial banks based in the seven OECD economies. The hardest hit economies, namely Indonesia, Korea, Malaysia, the Philippines and Thailand, which had experienced net private inflows averaging from around US$160 billion per annum in 1995 and 1996, saw total foreign liabilities drop by around 45 percent in 1998, as international banks were unwilling to roll over existing loans. Siregar and Choy
23
(2010) examined a number of plausible push and pull factors of the OECD banks’ claims on the East Asian economies. Among the key factors, they found that bilateral trade between the Asian economies and the OECD economies contributed significantly to the flows of cross-border bank lending, underscoring again the importance of macrofinancial linkages.
Similarly in the subprime crisis, while the pullbacks of funds from most of the EMEs
reflected more of the consequences of financial liquidity pressures in developed economies at the epicenter of the crisis, the tightening of credit conditions affected broader economic activity (Lee and Park (2008). Dooley and Hutchison (2009), in their analysis of the decoupling-recoupling hypothesis, also noted that following the Lehman Brothers bankruptcy in September 2008, emerging markets were unable to shield themselves through their domestic policies in the face of the credit crunch and decline in international trade.
The World Bank estimates that 85–90 percent of the fall in world trade since the
second half of 2008, is due to falling international demand, while 10–15 percent is attributable to a fall in the supply of trade finance (Auboin, 2009). Asmundson, et.al. (2011) found that 90 percent of banks in emerging economies and 70 percent in emerging markets tightened their lending criteria in response to higher probability of default (counterparty risk). Interestingly, the International Chamber of Commerce (ICC 2008) reported that firms which were affected by the liquidity capacity constraint turned to trade financing to support their working capital requirement. However, the availability of trade financing was also eventually severely affected and curtailed. This was particularly evident during the peak of the subprime crisis when the supply of trade financing instruments declined and almost dried-up in late 2008 to early 2009 (ICC, 2010). Despite anecdotal evidence that the contraction of trade financing may have affected trade performance, there has been to date, only a few empirical studies conducted, particularly on the experiences of emerging economies in Asia.
3.2 Empirical Approach
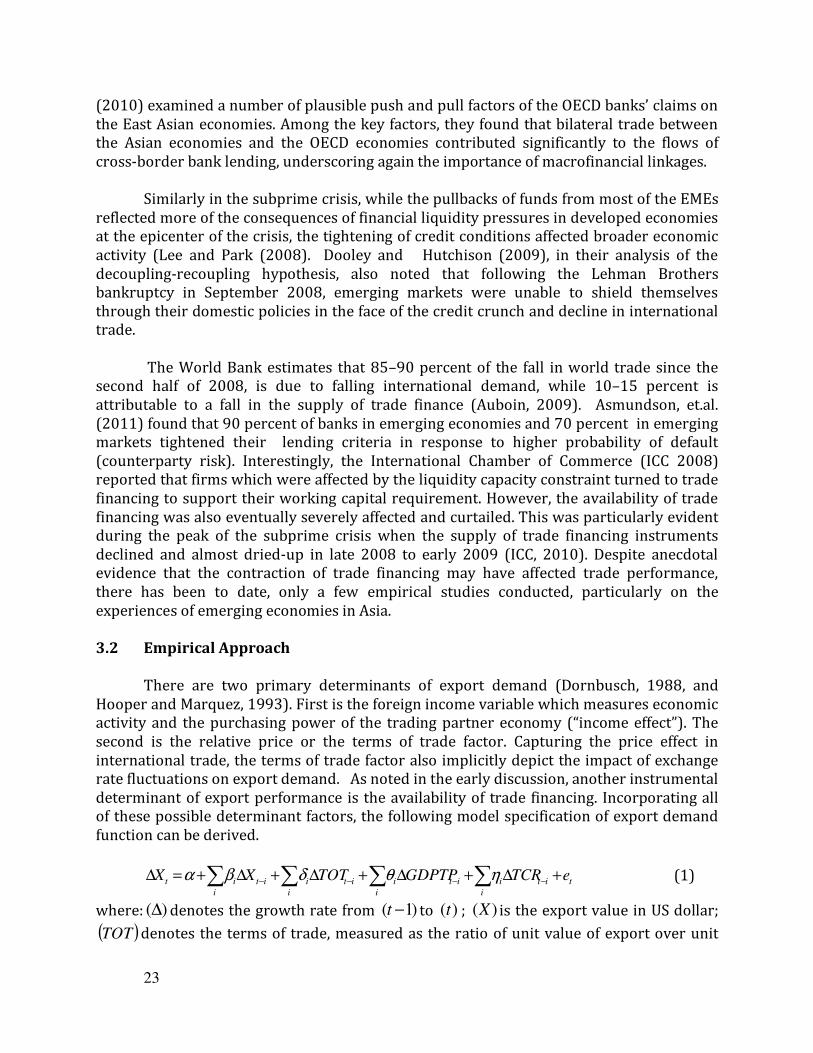
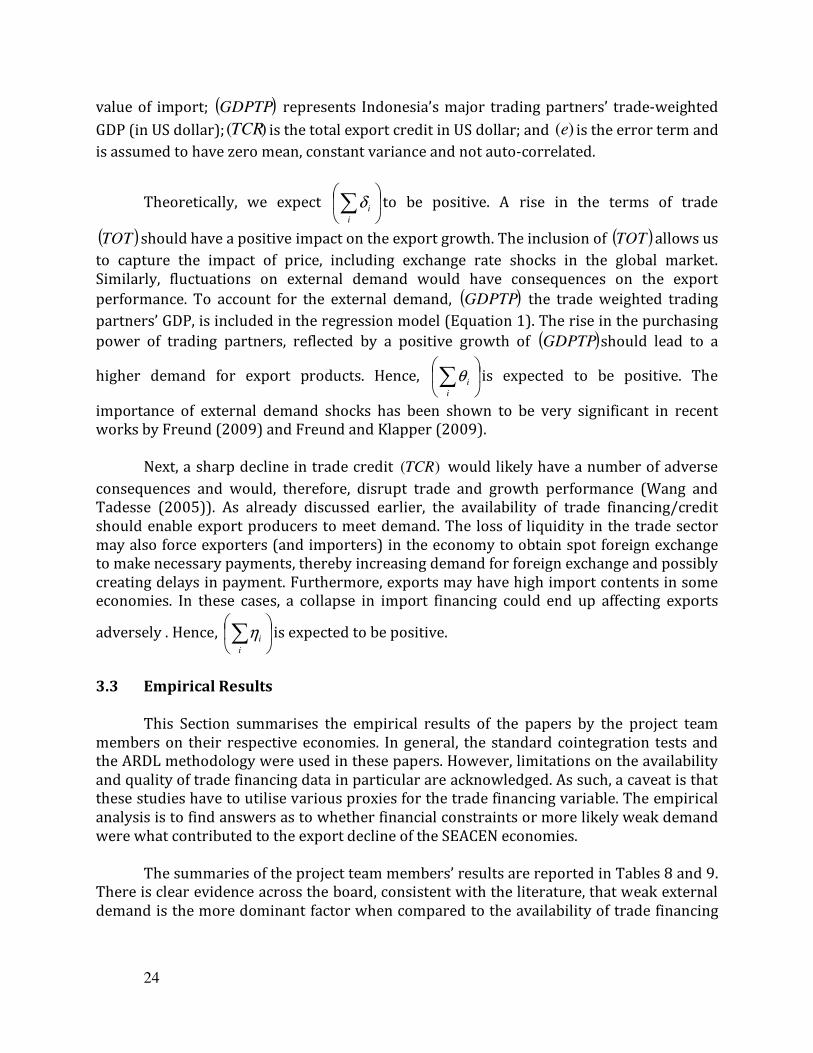
There are two primary determinants of export demand (Dornbusch, 1988, and Hooper and Marquez, 1993). First is the foreign income variable which measures economic activity and the purchasing power of the trading partner economy (“income effect”). The second is the relative price or the terms of trade factor. Capturing the price effect in international trade, the terms of trade factor also implicitly depict the impact of exchange rate fluctuations on export demand. As noted in the early discussion, another instrumental determinant of export performance is the availability of trade financing. Incorporating all of these possible determinant factors, the following model specification of export demand function can be derived.
tit
i
i
i
iti
i
iti
i
ititeTCRGDPTPTOTXX +∆+∆+∆+∆+=∆ −−−− ∑∑∑∑ ηθδβα (1)
where: )(∆ denotes the growth rate from )1( −t to )(t ; )(X is the export value in US dollar;
( )TOT denotes the terms of trade, measured as the ratio of unit value of export over unit
24
value of import; ( )GDPTP represents Indonesia’s major trading partners’ trade-weighted
GDP (in US dollar); )(TCR is the total export credit in US dollar; and )(e is the error term and
is assumed to have zero mean, constant variance and not auto-correlated.
Theoretically, we expect
∑
i
iδ to be positive. A rise in the terms of trade
( )TOT should have a positive impact on the export growth. The inclusion of ( )TOT allows us
to capture the impact of price, including exchange rate shocks in the global market. Similarly, fluctuations on external demand would have consequences on the export
performance. To account for the external demand, ( )GDPTP the trade weighted trading
partners’ GDP, is included in the regression model (Equation 1). The rise in the purchasing
power of trading partners, reflected by a positive growth of ( )GDPTP should lead to a
higher demand for export products. Hence,
∑
i
iθ is expected to be positive. The
importance of external demand shocks has been shown to be very significant in recent works by Freund (2009) and Freund and Klapper (2009).
Next, a sharp decline in trade credit )(TCR would likely have a number of adverse
consequences and would, therefore, disrupt trade and growth performance (Wang and Tadesse (2005)). As already discussed earlier, the availability of trade financing/credit should enable export producers to meet demand. The loss of liquidity in the trade sector may also force exporters (and importers) in the economy to obtain spot foreign exchange to make necessary payments, thereby increasing demand for foreign exchange and possibly creating delays in payment. Furthermore, exports may have high import contents in some economies. In these cases, a collapse in import financing could end up affecting exports
adversely . Hence,
∑
i
iη is expected to be positive.
3.3 Empirical Results
This Section summarises the empirical results of the papers by the project team members on their respective economies. In general, the standard cointegration tests and the ARDL methodology were used in these papers. However, limitations on the availability and quality of trade financing data in particular are acknowledged. As such, a caveat is that these studies have to utilise various proxies for the trade financing variable. The empirical analysis is to find answers as to whether financial constraints or more likely weak demand were what contributed to the export decline of the SEACEN economies.
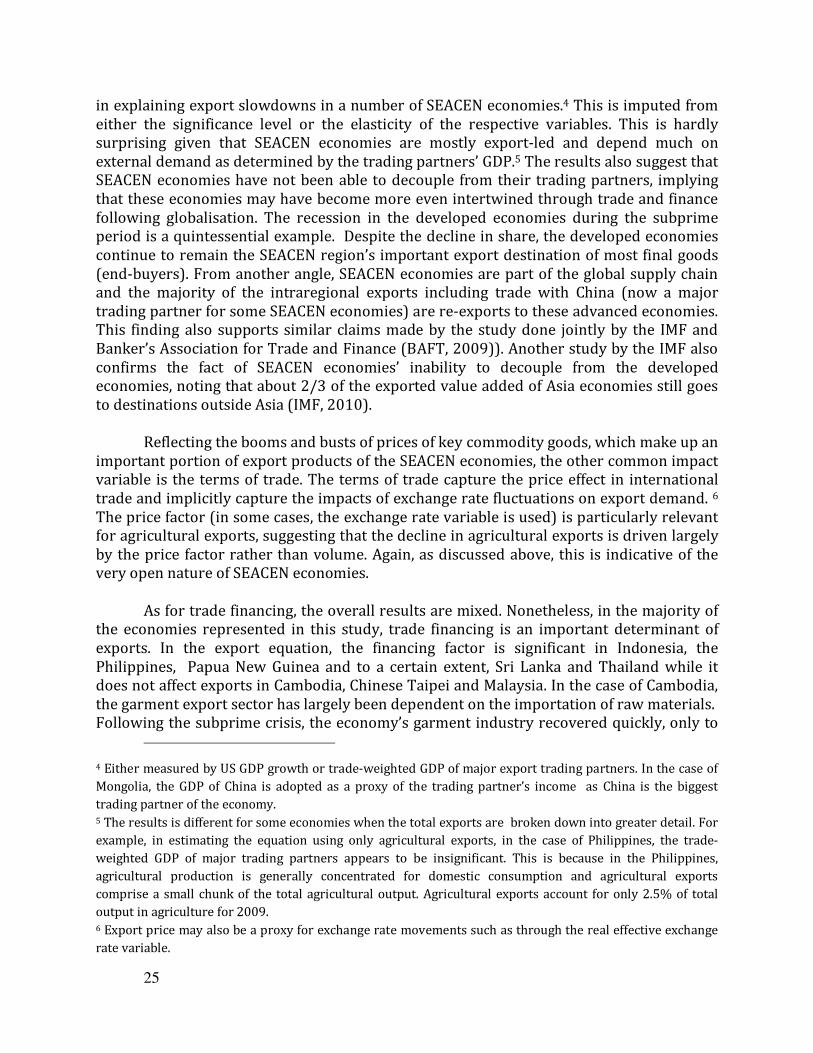
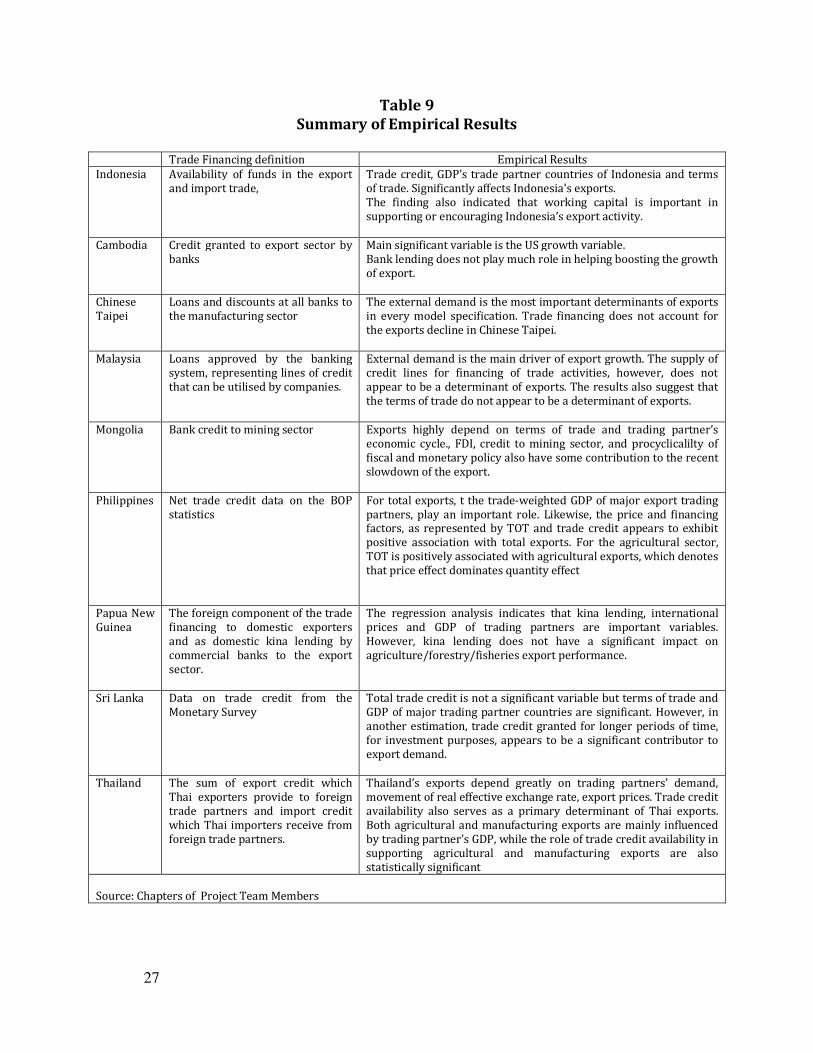
The summaries of the project team members’ results are reported in Tables 8 and 9. There is clear evidence across the board, consistent with the literature, that weak external demand is the more dominant factor when compared to the availability of trade financing
25
in explaining export slowdowns in a number of SEACEN economies.4 This is imputed from either the significance level or the elasticity of the respective variables. This is hardly surprising given that SEACEN economies are mostly export-led and depend much on external demand as determined by the trading partners’ GDP.5 The results also suggest that SEACEN economies have not been able to decouple from their trading partners, implying that these economies may have become more even intertwined through trade and finance following globalisation. The recession in the developed economies during the subprime period is a quintessential example. Despite the decline in share, the developed economies continue to remain the SEACEN region’s important export destination of most final goods (end-buyers). From another angle, SEACEN economies are part of the global supply chain and the majority of the intraregional exports including trade with China (now a major trading partner for some SEACEN economies) are re-exports to these advanced economies. This finding also supports similar claims made by the study done jointly by the IMF and Banker’s Association for Trade and Finance (BAFT, 2009)). Another study by the IMF also confirms the fact of SEACEN economies’ inability to decouple from the developed economies, noting that about 2/3 of the exported value added of Asia economies still goes to destinations outside Asia (IMF, 2010).
Reflecting the booms and busts of prices of key commodity goods, which make up an
important portion of export products of the SEACEN economies, the other common impact variable is the terms of trade. The terms of trade capture the price effect in international trade and implicitly capture the impacts of exchange rate fluctuations on export demand. 6 The price factor (in some cases, the exchange rate variable is used) is particularly relevant for agricultural exports, suggesting that the decline in agricultural exports is driven largely by the price factor rather than volume. Again, as discussed above, this is indicative of the very open nature of SEACEN economies.
As for trade financing, the overall results are mixed. Nonetheless, in the majority of the economies represented in this study, trade financing is an important determinant of exports. In the export equation, the financing factor is significant in Indonesia, the Philippines, Papua New Guinea and to a certain extent, Sri Lanka and Thailand while it does not affect exports in Cambodia, Chinese Taipei and Malaysia. In the case of Cambodia, the garment export sector has largely been dependent on the importation of raw materials. Following the subprime crisis, the economy’s garment industry recovered quickly, only to
4 Either measured by US GDP growth or trade-weighted GDP of major export trading partners. In the case of
Mongolia, the GDP of China is adopted as a proxy of the trading partner’s income as China is the biggest
trading partner of the economy. 5 The results is different for some economies when the total exports are broken down into greater detail. For
example, in estimating the equation using only agricultural exports, in the case of Philippines, the trade-
weighted GDP of major trading partners appears to be insignificant. This is because in the Philippines,
agricultural production is generally concentrated for domestic consumption and agricultural exports
comprise a small chunk of the total agricultural output. Agricultural exports account for only 2.5% of total
output in agriculture for 2009. 6 Export price may also be a proxy for exchange rate movements such as through the real effective exchange
rate variable.

26
be been marginally affected by the drop in demand from the US. For Mongolia, the trade financing factor is not relevant given the nature of its main exports of mineral products. As the mining sector requires a large capital base, advanced technology and machinery to explore and extract mineral products, only a few big companies operate in Mongolia. These big exporting firms have their own channels of access to the international financial market and other funding sources. In the case of Sri Lanka, when trade credit is granted for longer periods of time (for investment purposes) it appears to be a significant contributor to Sri Lanka’s export. For the other two economies of Chinese Taipei and Malaysia, trade financing is not significant. A possible explanation is that although trade financing did decline, it was primarily due to falling demand and not to supply of funds. In Thailand, although the variable is significant, the cumulative impact of trade financing on exports is marginal. However, both agricultural and manufacturing exports were in some ways affected by trade credit availability.
Due to the lack of data, the caveat was that the single equation methodology was used for estimation in all the cases. Thus, it would be difficult to isolate the elements of endogenity between the trade financing variable and the other variables7. Despite this caveat, the results are, nonetheless, indicative of the importance of trade financing in determining exports.
Table 8 Estimation Results of Export Equation
Independent Variables
Cam
bo
dia
Ind
on
esi
a
Ma
lay
sia
Mo
ng
oli
a
Ph
ilip
pin
es
PN
G
Ch
ines
e T
aip
ei
Sri
La
nk
a
Th
ail
an
d
Trade Financing *
N Y N N Y Y N Y** Y(-)
External Demand *
Y Y Y Y Y Y Y Y Y
Price Factor - Y Y Y Y Y Y Y Y
Note: *Dependent Variable is total exports; * Proxied by different variable; Y: significant Y(-): Significant but relatively smaller impact; X: No impact **: When trade credit into its components, credit for working capital and investments. trade credit granted for longer periods of time, for investment purposes, appears to be a significant contributor to export demand Source: Chapters of Project Team Members
7 For example, there is the possibility of dependence between exports and trade financing and also the dependence of trade financing on GDP growth. Via the latter, there would be a direct effect of trade financing on exports, and an indirect effect through GDP growth on the supply of trade finance. The non-significance of trade financing could be due to measurement errors resulting from the use of proxies for trade financing.
27
Table 9 Summary of Empirical Results
Trade Financing definition Empirical Results
Indonesia Availability of funds in the export and import trade,
Trade credit, GDP’s trade partner countries of Indonesia and terms of trade. Significantly affects Indonesia's exports. The finding also indicated that working capital is important in supporting or encouraging Indonesia’s export activity.
Cambodia Credit granted to export sector by banks
Main significant variable is the US growth variable. Bank lending does not play much role in helping boosting the growth of export.
Chinese Taipei
Loans and discounts at all banks to the manufacturing sector
The external demand is the most important determinants of exports in every model specification. Trade financing does not account for the exports decline in Chinese Taipei.
Malaysia Loans approved by the banking system, representing lines of credit that can be utilised by companies.
External demand is the main driver of export growth. The supply of credit lines for financing of trade activities, however, does not appear to be a determinant of exports. The results also suggest that the terms of trade do not appear to be a determinant of exports.
Mongolia Bank credit to mining sector Exports highly depend on terms of trade and trading partner’s economic cycle., FDI, credit to mining sector, and procyclicalilty of fiscal and monetary policy also have some contribution to the recent slowdown of the export.
Philippines Net trade credit data on the BOP statistics
For total exports, t the trade-weighted GDP of major export trading partners, play an important role. Likewise, the price and financing factors, as represented by TOT and trade credit appears to exhibit positive association with total exports. For the agricultural sector, TOT is positively associated with agricultural exports, which denotes that price effect dominates quantity effect
Papua New Guinea
The foreign component of the trade financing to domestic exporters and as domestic kina lending by commercial banks to the export sector.
The regression analysis indicates that kina lending, international prices and GDP of trading partners are important variables. However, kina lending does not have a significant impact on agriculture/forestry/fisheries export performance.
Sri Lanka Data on trade credit from the Monetary Survey
Total trade credit is not a significant variable but terms of trade and GDP of major trading partner countries are significant. However, in another estimation, trade credit granted for longer periods of time, for investment purposes, appears to be a significant contributor to export demand.
Thailand The sum of export credit which Thai exporters provide to foreign trade partners and import credit which Thai importers receive from foreign trade partners.
Thailand’s exports depend greatly on trading partners’ demand, movement of real effective exchange rate, export prices. Trade credit availability also serves as a primary determinant of Thai exports. Both agricultural and manufacturing exports are mainly influenced by trading partner’s GDP, while the role of trade credit availability in supporting agricultural and manufacturing exports are also statistically significant
Source: Chapters of Project Team Members
28
4. Selected Policy Perspectives and Concluding Remarks
It has been argued that while external demand is a vital component for the engine of growth in the SEACEN economies, it is also exogenous to the domestic economies. Therefore, domestic policy options to address it may be limited or too farfetched. Since the crisis, the IMF (2010) has urged Asian economies to increase resilience by reducing their dependence on external demand but instead work towards a rebalance on domestic demand in the longer run. This, according to the IMF, is to increase domestic consumption as well as investments by a large margin and as a region collectively. However, the IMF’s recommendation recognises the need for regional cooperation in implementing reform packages which include fiscal measures, restructuring the labour and the financial markets, improvement in products, raising productivity and greater flexibility in exchange rates. Nevertheless, for SEACEN economies, following the growing momentum in globalisation and trade liberalisation, exports will continue to be viewed as the engine of economic growth. It is in this context that the availability of trade financing, designed to reduce the trade and credit risks, is of vital importance.
Before we discuss some of the policy considerations regarding trade financing, as mentioned above, the current lack of official trade financing data, even at the aggregate levels, has to be urgently addressed for any comprehensive policy analysis can be carried out. The trade credit data adopted for the empirical analysis have largely been sourced from the balance of payments statistics. It is often defined as net trade credit, hence making it difficult to derive the true picture of the role of trade financing in explaining export performance in SEACEN economies. The results of the empirical analysis on financing, reported in Tables 7 and 8 are influenced by the poor quality and lack of data. Indeed, central banks can work together with the relevant authorities to ensure the availability of more disaggregated data on different types of trade financing which could enhance understanding of the role of trade financing in the overall performance of the export sector.
Central banks can indeed play a role in the establishment of export financing facility. In the case of the Philippines for instance, Bangko Sentral ng Pilipinas has contributed P50 million to the Export Promotion Fund (EPF) of the Export Development Council8. The EPF is envisaged as a public-private sector partnership, which will focus on capacity building projects, to help promote the sustained growth and competitiveness of the export sector. Similarly in Indonesia, Lembaga Pembiayaan Ekspor Indonesia (LPEI), the export financing agency, was legally established in January 2009 to replace the state-owned Bank Ekspor Indonesia (Export Bank), established in September 1999 to provide financing and co-financing, and to guarantee facilities for international trading activities. The Bank
8 The Export Development Council was created by virtue of Republic Act 7844, otherwise known as the Export Development Act of 1994. It was created with the purpose of developing and overseeing the implementation of the Philippine Export Development Plan (PEDP) and coordinating the formulation and implementation of policy reforms to support the Plan.

29
Ekspor Indonesia, operating as a state bank, was ineffective in giving out loans since, like any other commercial bank, it relied mostly on short-term deposits to fund lending. Hence, during economic downturns the institution faced significant tightening of its third party liabilities (deposits).
During financial crisis period, the central bank could provide additional financial support to commercial banks to ensure stable financing of export activities. To provide post-shipment guarantees and to reduce the liquidity risks of exporters, commercial banks in Indonesia were allowed to sell (re-discount) export receivables (drafts) to Bank Indonesia, starting in December 2008. Furthermore, to increase on-shore supply of US dollars and to protect against risk of counter-party default, the Indonesian government in January 2009, issued a regulation on mandatory use of a Letter of Credit (L/C) for export payment for certain products (i.e. coffee, CPO, cocoa, rubber, mining products and tin), stipulating that this payment was to be made through the on-shore foreign exchange bank. It is also interesting to note that consistent with risk reduction offered by trade financing, central banks can promote and raise awareness on the various hedging products available in the market to help exporters cope with challenging global economic developments. For instance, Bangko Sentral ng Pilipinas (BSP) established the Peso Rediscount Facility (PRF) as well as the Exporters Dollar and Yen Rediscount Facility (EDYRF) to allow banks to rediscount their existing loans.9 It may be recalled that as part of liquidity-enhancing measures implemented by the BSP at the height of the global financial turmoil, the budget for rediscounting facility was increased from P20 billion to P60 billion. However, as financial markets began to stabilise, the BSP has implemented the withdrawal of liquidity-enhancing measures. Thus, on 11 March 2010, the BSP reduced the peso rediscounting budget from P60 billion to P40 billion. It also restored the loan value of all eligible rediscounting papers from 90 percent to 80 percent of the borrowing bank’s credit instrument. It also brought back the non-performing loan ratio requirement for rediscounting access. Another reduction was implemented effective 3 May 2010, which slashed the rediscounting budget back to P20 billion. In addition, the BSP has set aside a budget of US$500 million for the EDYRF. The rediscounting facilities free-up funds which the banks can use for further lending operations including those intended for exporters. In addition, the BSP has contributed P50 million to the Export Promotion Fund of the Export Development Council (EDC).
It is also important for central banks to engage the relevant stakeholders on their regulations for hedging transactions as well as relevant foreign exchange policies and their implications on exports. For example, the BSP hosted a conference on hedging facilities for exporters on 3 October 2007 to familiarise merchandise and service exporters with various hedging products available in the market as well as with the BSP’s regulations on hedging transactions and relevant foreign exchange policies. This programme was eventually expanded to cover a wider spectrum of external competitiveness and widen participation
9 Rediscounting is a privilege of a qualified bank to obtain loans or advances from the BSP using the eligible
papers of its borrowers as collaterals. It is a standing credit facility provided by the BSP to help banks liquefy
their position by refinancing the loans they extend to their clients.
30
to include other stakeholders exposed to foreign exchange (FX) risks.10 In addition, there is a need for to hold dialogues in the form of consultative meetings with exporters to discuss the short- and medium-term outlook of the export sector to bring the views and concerns of the export sector to the attention of concerned government agencies. To concretise this effort, the BSP has been organising a series of conferences to raise awareness on ways to manage FX exposure and highlight the factors that impact on the economy’s external competitiveness.
Regional and international cooperation should play a more significant role in improving financial stability, including trade financing in the SEACEN region. One excellent example of this cooperation is the Chiang Mai Initiative (CMI), formally launched during the meeting of the ASEAN+3 finance ministers in Chiang Mai, Thailand, in May 2000. The Chiang Mai Initiative Multilateralization (CMIM) Agreement was signed with the following objectives: (i) to address balance-of-payments and short-term liquidity difficulties in the region and (ii) to supplement the existing international financial arrangements. The CMIM, with the total size of US$120 billion, will provide financial support through currency swap transactions to the CMIM participants facing balance-of-payments and short-term liquidity difficulties. A well-integrated and smoothly functioning regional financial system, with more liberalised capital account regimes and interlinked capital markets, will facilitate greater trade and investment flows in the region.
At the beginning of December 2009, the government took additional steps to deal with
the global financial crisis, including the preparation of an export financing facility to generate export activities hit by tight banking liquidity. BI is reported to be ready to issue a financing facility for goods that have been delivered in order to help exporters in case they faced payment failure. This facility, called an export draft re-discount with recourse, will assist banks in obtaining liquidity from the letter of credits (L/C) that had been issued. The government is also preparing another export financing facility for goods before being delivered. It is aimed at assisting exporters to obtain funds for purchasing raw materials
A recent initiative of the ADB’s Trade Finance Facilitation Program (TFFP) which
will provide about US$15 billion by 2013 on a roll-over basis to support trade in the region is another realisation of regional effort (ADB 2009). The TFFP serves three main purposes of providing credit guarantees to regional and international banks:(1) against payment of trade obligations issued by local banks in developing economies, (2) against risk participation product where it provides risk sharing and/or guarantees on a portfolio basis rather than on a transaction-by-transaction basis; (3) providing issuing bank (based on revolving credit products) loans for on-lending to private sector exporters and importers to finance trade-related.
10 Includes importers, organisations of overseas Filipinos, business process outsourcing entities (BPOs) and foreign currency deposit unit (FCDU) borrowers

31
Going forward, monitoring the impacts of ongoing reforms in the financial regulation, such as capital adequacy ratio under Basel III, on trade financing is also warranted. A number of recent reports/studies claim that the changes in the capital requirement under Basel III will likely affect fundamental decisions of banks on their business activities, including their provision of trade financing. Some studies have even argued that the price of trade finance could go up in the range of 40 to 60 percent. The rise in the cost of doing trade finance is due to the changes in the credit conversion factor, when banks will have to account for 100 percent of their trade assets on their balance sheet instead of 20 percent (Hoflich (2010)). Basel III also increases the risk-weighting of lending between financial firms, say the case of the importer’s bank lending money to the exporter’s bank (for example, through a letter of credit) (Masters 2010). As central banks and financial institutions have be aware and raise awareness of the possible consequences of Basel III, it is vital for them to meet regularly and develop communication strategies to arrive at a common understanding during the implementation of Basel III.
Given the diversities of the SEACEN economies, policy perspectives and recommendations can indeed vary. It is, however, clear from research findings of the various SEACEN economies that there are many ways both at the national and regional/international levels that SEACEN economies can do to improve the competitiveness of their export sectors. While trade financing is but a subset of the overall credit flows in the economies, it is nevertheless critical to recognise that conditions in credit markets in general, have a great impact on international trade. For SEACEN central banks in particular, ensuring stable and availability of financing is a key role that they can play in promoting exports.

32
References
ADB, (2009), The Global Economic Crisis Challenges for Developing Asia and ADB’s Response, April.
Akyuz, Y., (2011), “The Global Ecconomic Crisis and Trade and Growth Prospects in
East Asia”, ADB Economic Working Paper Series No. 242, January. Asmundson, I., Dorsey, T., Khachatryan, A., Niculcea, I. and Saito, M., (2011), “Trade
and Trade Finance in the 2008-09 Financial Crisis”, IMF Working Paper 11/16, January. Baldwin, R and Taglioni, D., (2009), The Great Trade Collapse and Trade Imbalances,
VOX, 27 November. Borensztein, E., and U. Panizza, (2006), “Do Sovereign Defaults Hurt Exporters?”,
RES Working Papers 4447, Inter-American Development Bank, Research Department.
Brennan, Michael, V. Maksimovic, and Joseph Zechner, (1998), “Vendor Financing.” Journal of Finance: 1127–41.
Dell’Ariccia, G., E. Detragiache, and R. Rajan, (2008), “The Real Effect of Banking Crises,” Journal of Financial Intermediation, 17(1), pp.89-112.
Dooley MP and Hutchison M.M., (2009), “Transmission Of The U.S. Subprime Crisis To Emerging Markets: Evidence On The Decoupling-Recoupling Hypothesis”, NBER
Working Paper Working Paper 15120, http://www.nber.org/papers/w15120. Dornbusch, R., (1988), Exchange Rate and Inflation, Cambridge, MA: MIT Press.
Ferris, J.S., (1981), “A Transaction Theory of Trade Credit Use”, Quarterly Journal of
Economics 94: 243–70.
Fisman, R., and I. Love, (2003), “Trade Credit, Financial Intermediary Development, and Industry Growth”, Journal of Finance 58, No. 1: 353–74.
Freund, C., (2009), “The Trade Response to Global Downturns: Historical Evidence”, Policy Research Working Paper Series, The World Bank (Forthcoming).
Freund, C., and L. Klapper, (2009), “Has the Decline in the Supply of Financing Affected Trade During the Crisis?”, Mimeo, The World Bank.
33
Hoflich, P., (2010), “Trade Se for Basel III Blockage”, The Asian Banker, Issue 102, December.
Hooper, P., and J. Marquez, (1993), “Exchange Rates, Prices, and External
Adjustments in the United States and Japan”, International Finance Discussion Paper, No. 456, The Board of Governors of the Federal Reserve System.
International Chamber of Commerce, (2008), Trade Financing in the Current Financial Crisis, Preliminary Assessment of Key Issues,
http://www.iccwbo.org/uploadedFiles/ICC_Report_Trade_Finance_11_Nov_2008.pdf.
International Chamber of Commerce, (2010), Rethinking Trade Financing 2010:
Global Survey, An ICC Banking Commission Market Intelligence Report, http://www.ifc.org/ifcext/gfm.nsf/AttachmentsByTitle/TF-BPM3+-+Vin+OBrien+-+Market+Intelligence+Report/$FILE/Vin+IFC+APRIL+2010+Published+Rethinking_Trade_Finance_2010.
IMF, (2009), World Economic Outlook, July. IMF, (2010), Asia and Pacific Leading the Global Recovery Rebalancing for the
Medium Term, Economic and Financial Surveys, Regional Economic Outlook, April, http://www.imf.org/external/pubs/ft/reo/2010/apd/eng/areo0410ch3.pdf
IMF, (2011), Asia Pacific Regional Economic Outlook, April. Kaminsky, G. and Reinhart, C., (1999), “The Twin Crises: The Causes of Banking and
Balance of Payments Problems”, American Economic Review, Vol. 89, No.3, pp. 473-500, June.
Kawai, M. M. Lamberte, and D.Y. Yang, (2008), “Global Shocks, Capital Flows and
Asian Regional Economic Cooperation”, Asian Development Bank Institute, Tokyo. Masters B., (2010), Impact of Basel III: Trade Finance May Become a Casualty,
Financial Times.Com, October 19, http://www.ft.com/cms/s/0/c5535968-db13-11df-a870-00144feabdc0.html#axzz1P2rtQhzL
Mian, S., and C.W. Smith, (1992),. “Accounts Receivable Management Policy: Theory and Evidence”, Journal of Finance 47, no. 1: 169–200.
Petersen, Mitchell A., and Raghuram G. Rajan, (1995), “The Effect of Credit Market Competition on Lending Relationships”, Quarterly Journal of Economics 60: 407–44.

34
Petersen, Mitchell A., and Raghuram G. Rajan, (1997), “Trade Credit: Theory and Evidence”, Review of Financial Studies 10, No. 3: 661–91.
Raddatz, C., (2008), “Credit Chains and Sectoral Comovements: Does the Use of
Trade Credit Amplify Sectoral Shocks?”, Policy Research WP 4525, The World Bank Research Group.
Siregar, R and Choy, K.M., (2010), “Determinants of International Bank Lending from the Developed World to East Asia”, IMF Staff Paper, Vol. 57, No. 2, pp. 484-516.
Smith, Janet, (1987), “Trade Credit and Information Asymmetry”, Journal of Finance, Vol. XLII, No.4, pp. 863-69.
World Travel and Tourism Website, Economic Data Search Tools, http://www.wttc.org/eng/Tourism_Research/Economic_Data_Search_Tool/
Xing, Y., (2011), “Processing Trade, Exchange Rates, and the People’s Republic of China Bilateral Trade Balances”, ADBI Working Paper Series, No. 270, March.