real-time classification of malicious urls on twitter using machine activity data
TRANSCRIPT

Real-time Classification of Malicious URLs on Twitter using Machine Activity Data
Pete Burnap, Amir Javed, Omer Rana & Shahzad Awan
Social Data Science Lab
School of Computer Science and Informatics & School of Social Sciences
Cardiff University
@pbFeed @omerfrana @socdatalab

Social Data Science Lab - @socdatalab
• Formed in 2015 out of the Collaborative Online Social Media Observatory (COSMOS) programme of work (cosmosproject.net)
• Mission is to continue the work of COSMOS in democratising access to big social data (e.g. Twitter, Foursquare, Instagram) amongst the academic, private, public and third sectors.
• Recent grant capture of over £2.7 million through 20 grants
• A significant proportion of these funds have been awarded to collect and analyse social media data in the contexts of Societal Safety and Security e.g. social tension, hate speech, crime reporting and fear
of crime, suicidal ideation
• Working with Metropolitan Police, Department of Health, Food Standards Agency

The Problem
• Our previous research has studied online social networks as “social machines” that enable spread of malicious or potentially dangerous information (e.g. rumour, hate speech, suicidal ideation)
• OSNs widely used around large events where information seeking occurs (e.g. natural disaster, sporting events) – particularly susceptible to spread of drive-by-downloads - URLs pointing to malicious servers but hidden in attractive content
• Most research to date focuses on social network properties of users to identify malicious accounts
• We explore behavioural analysis of malware with “real time” machine activity logs and honeypots

Example
“Check out these awesome pics from #superbowl http://bit.ly/3s5dh3”
Modify registry
Download exploit
Open backdoor

Research Aims
• Develop a ‘real-time’ machine classification system to distinguish between malicious and benign URLs within seconds of the URL being clicked
• Examine and interpret the learned model to explicate the relationship between machine activity and malicious behaviour exhibited by drive-by-downloads on Twitter.
• Identify features/signals that generalize across events
• Understand data volume requirements

Method
• Data collected during two large sporting events – the Superbowl and the Cricket World Cup
• Identify malicious URLs using client honeypot
• Build machine classification models using machine activity logs generated while interacting with URLs extracted from Twitter
• Refine measurable activity metrics to identify most predictive features by examining how they are used to make decisions
• Build a learning-curve chart that demonstrates using 1% of the training data only has a small detrimental effect on performance
Data
• Data collected during two large sporting events – the Superbowl and the Cricket World Cup
• Search using event hashtags and restrict to tweets with URLS
• Superbowl – 122,542 unique URLs
• Cricket (semi and final) – 7,961 unique URLs

Identifying Malicious URLs
• Utilised a high interaction client honeypot (Capture HPC) to visit each URL (for 5 mins) and log changes to system state
• Behaviour analysis avoids issues with static analysis where ‘signatures’ in code of new/dynamic codebases are unseen
• Use an exclusion list of malicious behaviours – changes to registry, file system, running processes – to identify malicious behaviour and tage URLs as malware
• Lists need updating and assumes you are able to capture all potential malicious behaviour (difficult) – but methods exist to support this

Predicting malicious behaviour
Waiting until malicious behaviour occurs is not ideal – it would be useful to have some insight into measurable machine activity metrics that provide a ‘signal’ before the attack occurs
Metrics:
1. CPU usage 2. Connection established/listening (yes/no) 3. Port Number 4. Process ID (number) 5. Remote IP (established or not) 6. Network Interface (type e.g. Wifi, Eth0) 7. Bytes Sent 8. Bytes receive 9. Packets Sent 10. Packets Received 11. Time since start of interaction

Model selection
Sampled 2k tweets for training (Superbowl) and 2k for testing (Cricket) – 1k malicious and 1k benign. 5.5 million obs. Each obs. Is a feature vector containing metrics & malicious/benign annotation
Methodological considerations: • High variance in the mean recorded CPU usage, bytes/packets
sent/received, and ports used between the two datasets suggests identifying similar measurements between events would be challenging
• Standard deviation in both datasets very similar, which suggests the variance is common to both datasets, but the deviation is high, which suggests a large amount of ’noise’ in the data
• Behaviours in both logs are largely benign, creating a large skew in log activity towards the benign type
• Generative or discriminative model?

Phase I Modelling
Baseline experiments - which model would be most appropriate based on prediction accuracy?
Generative models that consider conditional dependencies in
the dataset (BayesNet) or assume conditional independence (Naive Bayes)
Discriminative models that aim to maximise information gain
(J48 Decision Tree) and build multiple models to map input to output via a number of connected nodes, even if the feature space is hard to linearly separate (Multi-layer Perceptron).

Phase I Results

Model performance over time

Best performing model analysis
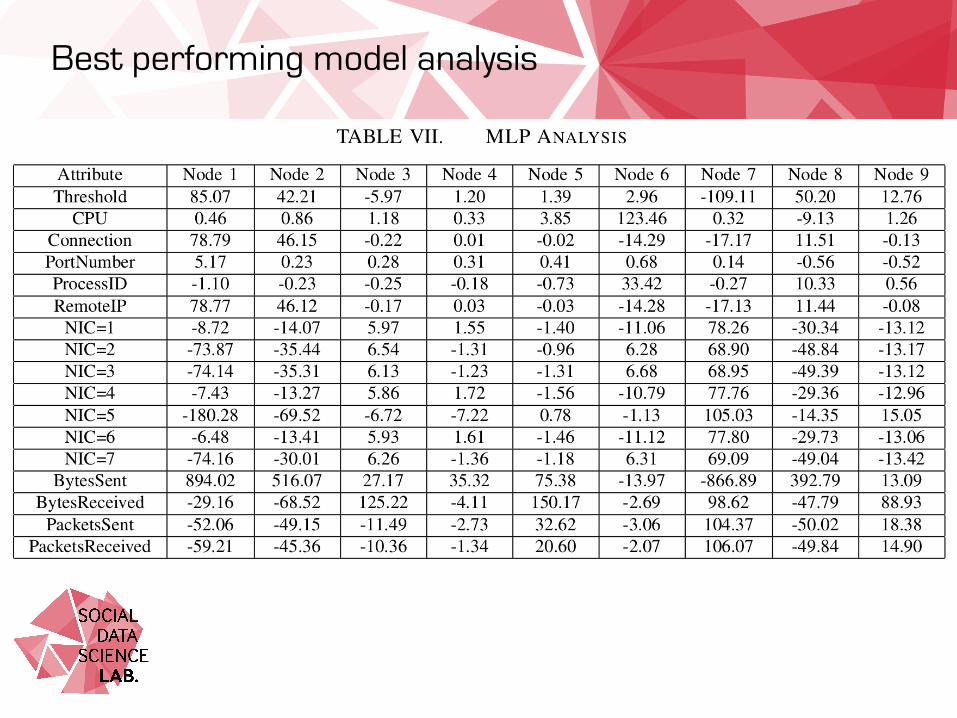
We examine the MLP model during the training phase (t=60) to investigate how the model is representing a learned weighting between features. Model produced 9 hidden nodes with weighting given to each node for each class (malicious or benign)
Nodes 3, 4 and 9 have high weightings towards a particular class. Node 9 stands out as the most discriminative positive weighted node for malicious URLs.
Best performing model analysis

Sampled Learning
Storing Twitter data around ongoing real-world events is an issue given that events can last several weeks = massive data
Less data = less storage space = less computational time required to
extract model features and run models Questions could be asked around whether the training set is missing a
significant proportion of malicious activity given that not all URLs can be visited in real-time given “take downs”
Demonstrating small training sample achieves similar performance to
full samples alleviates these issues to some degree as it demonstrates the most explanatory features present in the smaller sample. We retained the full test dataset and sampled (using no
replacement) from the training data at 1%, 5%, 10% and increments of 10% up to 100.

Sampled Learning
• Sample of 20%, 30% and 40% yields a performance of 68%, only 1% lower than the optimal performance of 69%.
• Performance using a 1% sample is 63% - a drop of only 5% on the optimal performance with a complete sample.
• Based on the mean of two runs for each sample
Conclusions
Multi Layer Perceptron (MLP) approach all worked extremely well during training, achieving over 90% accuracy, up to 97% - machine logs work well for prediction
Discriminative models performed better than generative models in
testing - MLP model performed best overall up to 72% - suggests linearly separable features
Bayesian approach performed best in the early stages of interaction
(within 5 seconds of clicking the URL), achieving 66% accuracy when the model had the least information available (Real time)
Drop in performance on a new event suggests attack vectors
slightly different across events, but with reasonably high degree of accuracy we can claim some independence between predictive features and events in Twitter URLs

Conclusions
MLP model shows key predictive machine activity metric was network activity - particularly packets sent and received
CPU use and process IDs also had clear raised and correlated
weighting in the model, as did the bytes sent from the network when correlating with new connections to remote endpoints, suggesting data exfiltration exercises can be distinguished from general data transfer.
Learning curve using small samples revealed only a small drop in
classification performance when compared to using the full training sample, alleviating some concerns over appropriate sampling mechanisms, lack of a complete log of all Twitter URL activity, and the requirement for large amounts of data storage.
Thanks
Questions?
@pbFeed