real time driver information for congestion · pdf filereal time driver information for...
TRANSCRIPT

Real Time Driver
Information
for Congestion
ManagementSherif Ishak, PhD, PE
Osama Osman
Raju Thapa
Syndney Jenkins
1

Outline
Introduction
Objectives
Methodology
Data Collection
Data Screening/Information Synthesis
Real Time Information Dissemination
Driver Behavior and Active Traffic Management
Strategies
Case Studies
Conclusions and Recommendations
2

Introduction and Objectives
Problem: Traffic Congestion
Conventional Solution: Build our way out of congestion –costly and ineffective!
Alternative Solution: Active Traffic Management Strategies
Focus: Real Time Traffic Information
Impact: Congestion mitigation via Driver’s decision making process at pre-trip planning and en route
Objectives:
Conduct a literature review on past and current research efforts on data collection methods and technologies, data screening and information synthesis, information dissemination, impact on driver’s behavior, and active traffic management strategies
Review selected case studies
3

Real Time Traffic Information4
Data collection
Data screening and
processing
Information Synthesis
Information Dissemination
Driver behaviorCongestion
management and mitigation

STEP 1: DATA
COLLECTION
5

Definition
Backbone of real-time traffic information system
Functionality (point sensors, point-to-point, and area-
wide sensors)
Point sensors (fixed sensors)
Point-to-point (detect vehicles at multiple locations or
floating car data)
Area-wide sensors (fleet of probe vehicles)
6

Data Collection
Technologies/Methods
Manual counts:
Dependent on traffic data observer
Traffic data accuracy may not be acceptable
Pneumatic Tubes:
Rubber tubes placed across the road
Detects vehicles based on pressure changes
Simple but limited lane coverage
Efficiency is highly dependent on the weather, temperature, and traffic conditions
Piezoelectric sensors:
Placed in a groove made along the road surface of the lane(s) of interest
Volumes, speed, classification and weigh-in-motion
7
Data Collection
Technologies/Methods
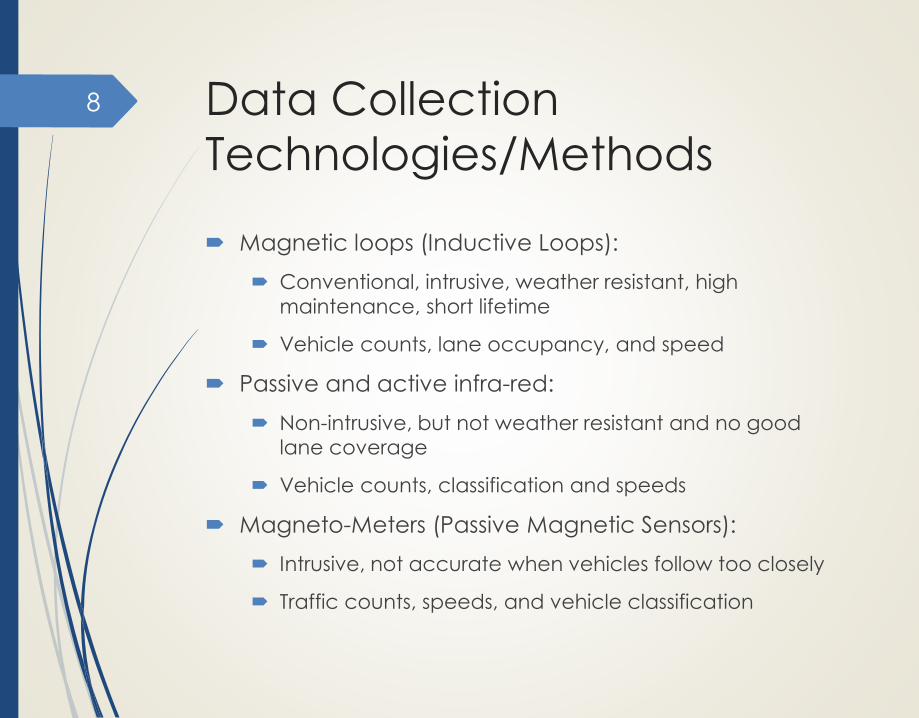
Magnetic loops (Inductive Loops):
Conventional, intrusive, weather resistant, high
maintenance, short lifetime
Vehicle counts, lane occupancy, and speed
Passive and active infra-red:
Non-intrusive, but not weather resistant and no good lane coverage
Vehicle counts, classification and speeds
Magneto-Meters (Passive Magnetic Sensors):
Intrusive, not accurate when vehicles follow too closely
Traffic counts, speeds, and vehicle classification
8
Data Collection
Technologies/Methods
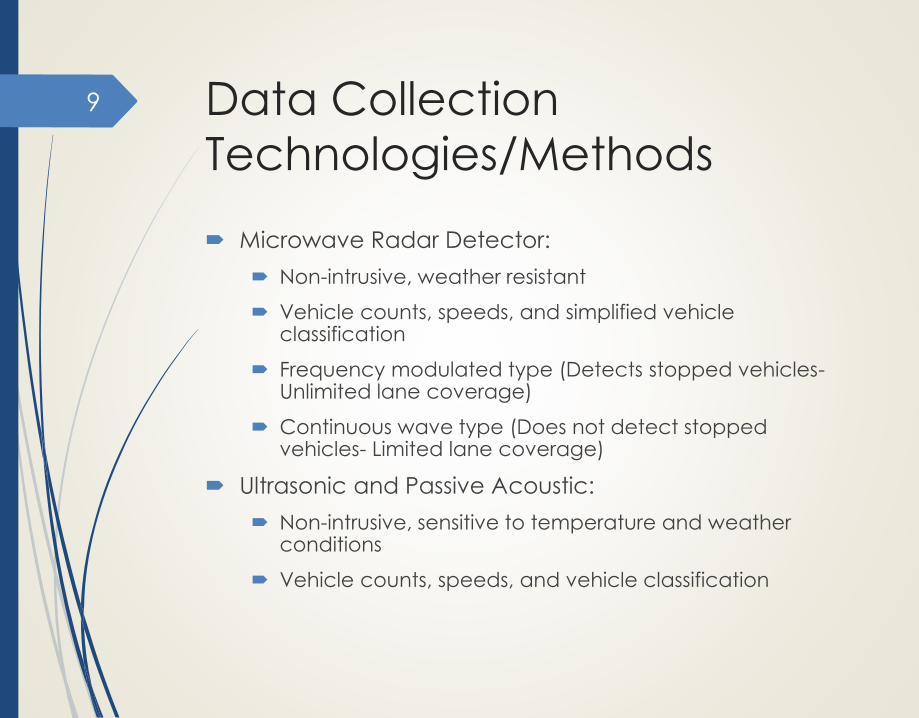
Microwave Radar Detector:
Non-intrusive, weather resistant
Vehicle counts, speeds, and simplified vehicle classification
Frequency modulated type (Detects stopped vehicles-Unlimited lane coverage)
Continuous wave type (Does not detect stopped vehicles- Limited lane coverage)
Ultrasonic and Passive Acoustic:
Non-intrusive, sensitive to temperature and weather conditions
Vehicle counts, speeds, and vehicle classification
9

Data Collection
Technologies/Methods
Video Image Detection:
Non-intrusive, not weather resistant
Vehicle counts, classification, and speed
Floating Car Data (FCD):
Vehicles are equipped with a mobile phone or GPS
Vehicle coordinates, travel time, speed, direction of
travel (section measurement data)
Accurate information on traffic conditions
GPS-based, Cellular-based, Automatic Vehicle Identification (AVI)
10

Data Collection
Technologies/Methods
Bluetooth Technology
Non-intrusive, cost effective, weather resistant, reliable
Media access control (MAC) address for tracking
vehicles and Travel time data
Emerging Technologies
Autonomous vehicles technologies: driverless cars
V2V and V2I Technologies: Wireless communication between vehicles and roadside units
Traffic speed, traffic conditions, OD flows, route choice,
incident locations, and many other data types
11

V2V and V2I
Equipped with wireless devices
DSRC (Seven channels-5.9GHZ band-3000ft)
RSU
V2V and V2I
Vehicle Ad-hoc Network (VANET)
12

16
Data Collection
MethodIntrusiveness Weather Resistance
Data Collected
Mounting Location Main drawbacksTraffic
Coun
ts
Speeds Classification Other
Manual Counts No - Yes Yes Yes - roadside observer- Depends on human
factors
Pneumatic Tubes Yes No Yes Yes No - across the road
- Accuracy depends
on weather
- Limited lane
coverage
Piezoelectric
SensorsYes No Yes Yes Yes
Weigh in
motion
Grooves along road
surface of the lane of
interest
- Limited lane
coverage
Magnetic Loops Yes Yes Yes Yes Yes -Embedded in the road
surface- Short lifetime
Passive and
Active Infra-redNo Yes No Yes Yes - Lane of interest
- Does not work
properly in bad
weather
- Limited lane
coverage
Magneto-Meters Yes Yes Yes Yes Yes - In holes in the pavement
- Not able to
differentiate
between two
vehicles following
too closely.
Microwave Radar
DetectorsNo Yes Yes Yes Yes - At high point on the road
- Some types are not
able to detect
stopped vehicles
Ultrasonic and
Passive Acoustic
Devices
No No Yes Yes Yes -Over the lanes of interest or
roadside
- Sensitive to
temperature and
weather condition
Video Image
DetectionNo No Yes Yes Yes -
At high level on the road
side or at intersections
- Affected by weather
conditions
Floating Car Data NoDepends on the used
GPS and cell phonesYes Yes Yes
Vehicle
coordinates
and routes
information
In Vehicles (GPS or Cell
phones)
- Some care may not
have GPS or cell
phones
Bluetooth
TechnologyNo
Depends on the in-
vehicle Bluetooth
device
Yes Yes No Travel timesRoadside and in-vehicle
Bluetooth devices- Sensitive to weather
Connected
vehicle
Technologies
NoDepends on the used
devicesYes Yes Yes
Vehicle
coordinates,
travel times,
route
information,
… etc
In-vehicle and RSU
- Low market
penetration at first
implementation

STEP 2: DATA
PROCESSING
17
Definition18
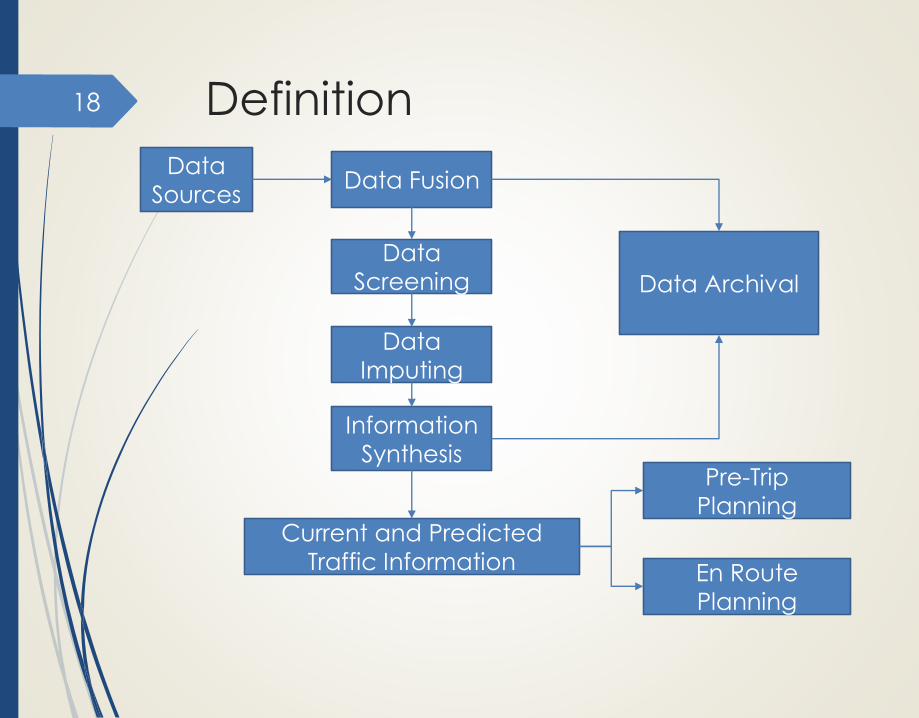
Data
SourcesData Fusion
Data
Screening
Data
Imputing
Information
Synthesis
Data Archival
Current and Predicted
Traffic Information
Pre-Trip
Planning
En Route
Planning

Data Processing
Data summarization
Descriptive statistics (central tendency and dispersion)
Data cleaning
Data errors: detection of errors and outliers
Missing data: data imputing with interpolation-based methods and simple linear regression method from recent and historical data
Data reduction
Multiple data sources-large data sets- difficulty to process (Minimized)
Two levels data reduction approach (at acquisition level and at data fusion level)
19

STEP 3: INFORMATION
DISSEMINATION
21

Definitions
Distribution of extracted information to road user to
influence driver decisions
Information includes:
Travel times
Speeds
Delay
Congestion
Bottlenecks queues and
Incidents downstream
Various technologies are used by state DOTs
22
Highway Advisory Radio
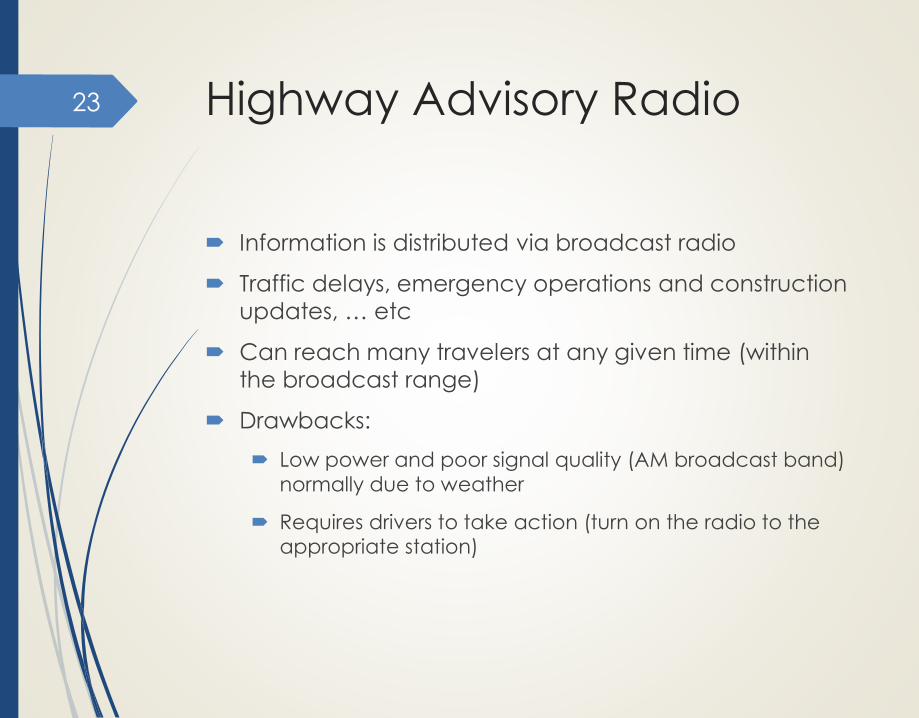
Information is distributed via broadcast radio
Traffic delays, emergency operations and construction
updates, … etc
Can reach many travelers at any given time (within
the broadcast range)
Drawbacks:
Low power and poor signal quality (AM broadcast band)
normally due to weather
Requires drivers to take action (turn on the radio to the appropriate station)
23

Dynamic Message Signs
(DMS)
Also known as CMS and VMS
Can be programmed to display any combination of
characters
Flexibility to be either permanently fixed or portable
devices
Effective message on a DMS must have five elements:
Problem, Location, Effect, Attention, Action
Incident warning, slow-downs, upcoming speed
changes, road work, alternative routes, etc
Must be able to be read at least twice while traveling at the posted speed limit (MUTCD)
24

Telephone Information
Services (511)
“511” currently stands as the U.S. official traveler
information telephone number
Pre-recorded messages telling highway conditions,
transit agencies and other travel information
Operated by state and local transportation agencies
39 states actively use 511
25

Social Media
Most drivers have access
to the social networks via smartphones’
applications (Twitter,
WAZE, INRIX, Way to
Geaux, Beat the Traffic)
Smartphones are used to
inform public of roadway
incidents in real-time
Few studies examined how social media
influences behavior
26
Usage percentages of 41 states and
Washington, DC

REAL TIME
INFORMATION AND
DRIVERS’ BEHAVIOR
28

Impact of Real time information
on drivers’ behavior
Drivers react to information in terms of route choice, trip time choice, travel speed, etc.
One study showed that drivers receiving information with smartphones reacted to daily variation in travel times
Another study showed the effectiveness of DMS in terms of speed reduction and crash rate reduction
Some studies indicated that in-vehicle traffic information could be distracting due to information overload; other studies showed otherwise
Several studies showed that real-time traffic information improves the overall performance of the road network.
29
ACTIVE TRAFFIC
MANAGEMENT
STRATEGIES30
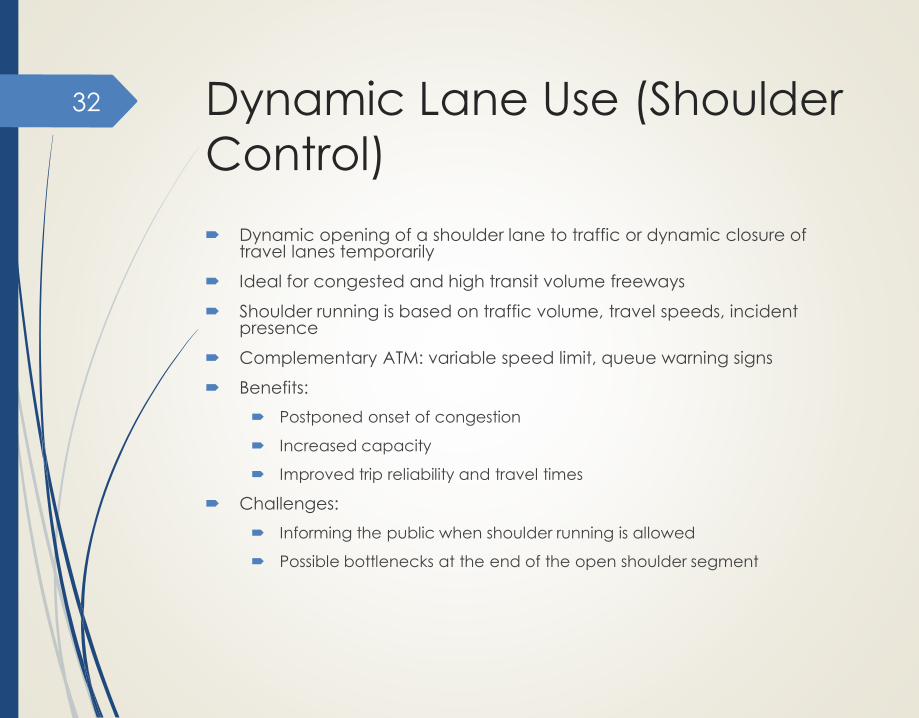
Dynamic Lane Use (Shoulder
Control)
Dynamic opening of a shoulder lane to traffic or dynamic closure of travel lanes temporarily
Ideal for congested and high transit volume freeways
Shoulder running is based on traffic volume, travel speeds, incident presence
Complementary ATM: variable speed limit, queue warning signs
Benefits:
Postponed onset of congestion
Increased capacity
Improved trip reliability and travel times
Challenges:
Informing the public when shoulder running is allowed
Possible bottlenecks at the end of the open shoulder segment
32
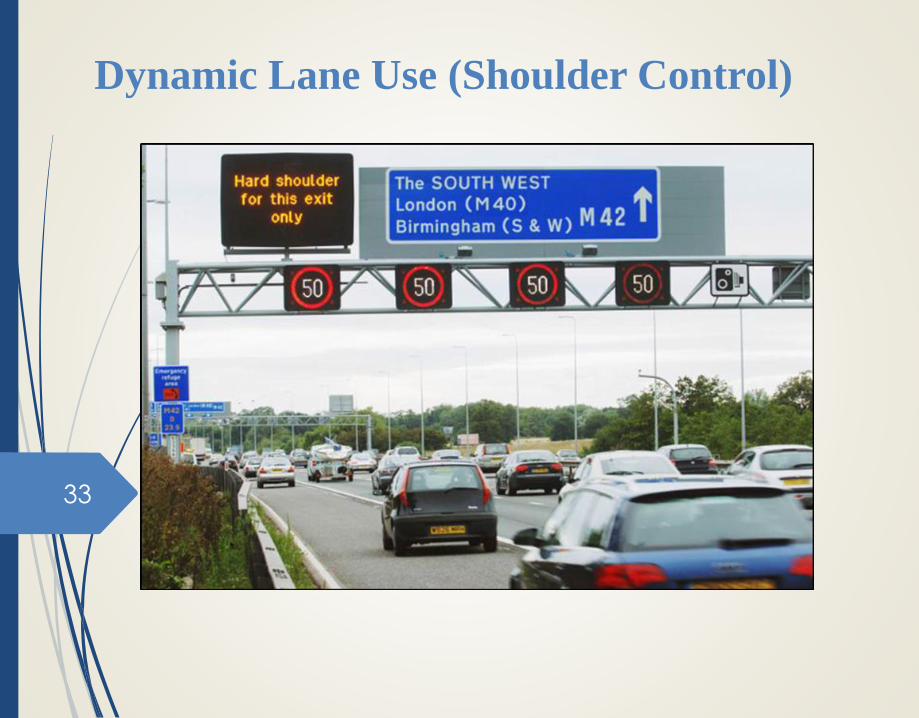
Dynamic Lane Use (Shoulder Control)
33

Dynamic Merge (Junction
Control)
Adjustment or closure of a lane or lanes upstream of an interchange.
Ideal for congested freeway with high merging volumes
Benefits:
Delayed onset of congestion
Increased capacity
Improvement of traffic efficiency and reliability
Challenges:
Gaining public support
Design and operations of the junction control area
Data necessary: Maximum capacity of upstream lanes, Traffic volumes on general purpose lanes and merging ramps, Travel speeds, Incident presence and location
34

Dynamic Merge (Junction
Control)
35
Variable Speed Limits
Changeable signs that reduce the speed limit in 5 mph increments downstream
Ideal for congested freeways and areas prone to adverse weather
Roadway or weather sensors are used with variable speed limits
Benefits:
Improved traffic flow
Uniform traffic slowing or speed harmonization
Few challenges with public support and operations of variable speed limits
Enforcement issues
Data required: Traffic volumes, Travel speeds, Local climate and weather conditions, Incident presence and location
36

Variable Speed Limits37

Queue Warning and Dynamic
Message Signs (DMS)
Queue warning signs alert drivers of queues or backups downstream
Loop detectors are used to help identify possible queues backing up
Benefits:
Reduced congestion
Reduction of rear-end crashes and improved driver safety
Challenges:
Data quality and reliability
Determining appropriate location for sensors
Public awareness
Operations and management
Data required: Traffic volumes, Travel speeds, Travel times, Incident presence and locations.
38

Queue Warning and Dynamic
Message Signs (DMS)39

Dynamic Route Guidance
(DRG)
Develops optimal real-time distribution of traffic
Different algorithms are used according to congestion
levels and real-time traffic conditions
DMS or in-vehicle systems are used to inform drivers
with recommended routes
Data required: Congestion information, Travel times
40

Dynamic Route Guidance
(DRG)
41
Adaptive Ramp Metering
Metering rates are altered according to traffic conditions
Ideal for freeways with recurring breakdowns, congested metropolitan areas and stop-and-go traffic conditions
Benefits:
Decreased crash rates in controlled areas
Increased traffic volumes and speeds
Relatively low construction cost
Challenges:
Potential violations
Negative public perception of ramp delay to local traffic
Data required: Traffic volumes, Travel speeds, Ramp demand and geometry, Crash history
42

Adaptive Ramp Metering43

Advanced Arterial Traffic
Control (AAC) system
Managing traffic flow throughout the arterial network
including signalized intersections
Different sensors (e.g. loop detectors) are used
Signal controllers to continuously adjust signal timing
Allow a platoon of vehicles to pass through few
intersections continuously
Benefits:
Reduce travel time and congestion
Improve safety
44

CASE STUDIES47
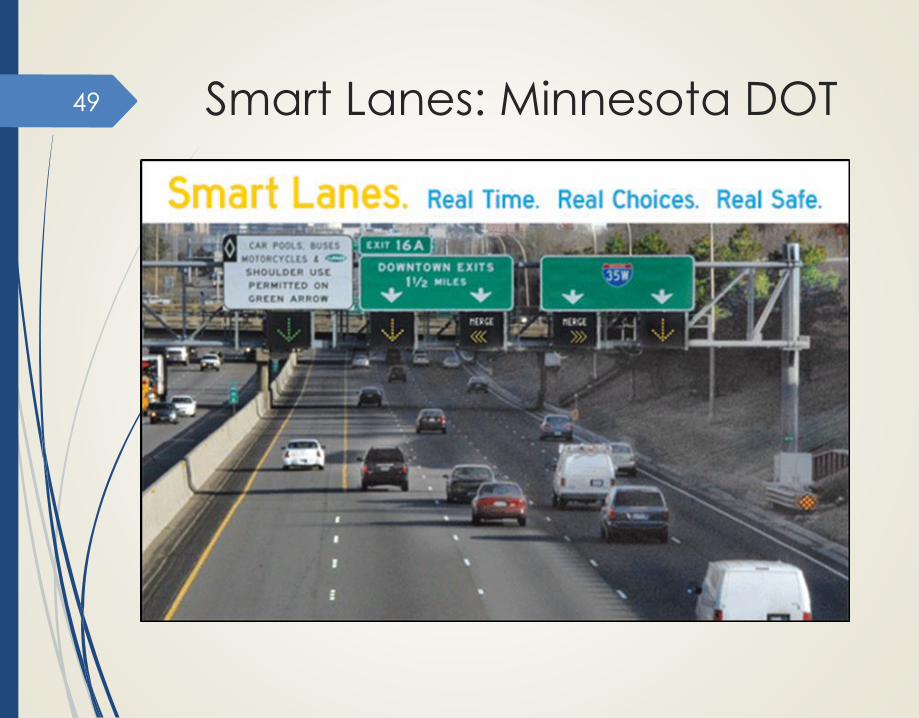
Smart Lanes: Minnesota DOT
Dynamic lane use control, dynamic speed limits,
queue warning and adaptive ramp metering strategies.
Green arrows indicate a lane is open.
Yellow arrows provide warnings to proceed with caution.
Red X signifies the lane is closed-drivers should begin to merge out of the closed lane.
30% reduction in collision and 22% increase in roadway capacity.
48
Smart Lanes: Minnesota DOT49

Multiple ATM Strategies:
Virginia DOT
A major project dealing with active traffic
management on Interstate 66 by 2015.
34 miles along I-66 from the District of Columbia to
Prince William County
Multiple active traffic management strategies and technologies.
Dynamic shoulder use will be allowed.
DMS and lane control systems to alert drivers.
Other ATM strategies and technologies will be
implemented.
50

Multiple ATM Strategies:
Virginia DOT
51
Exact project layout and type of ATM strategy utilized in each
segment

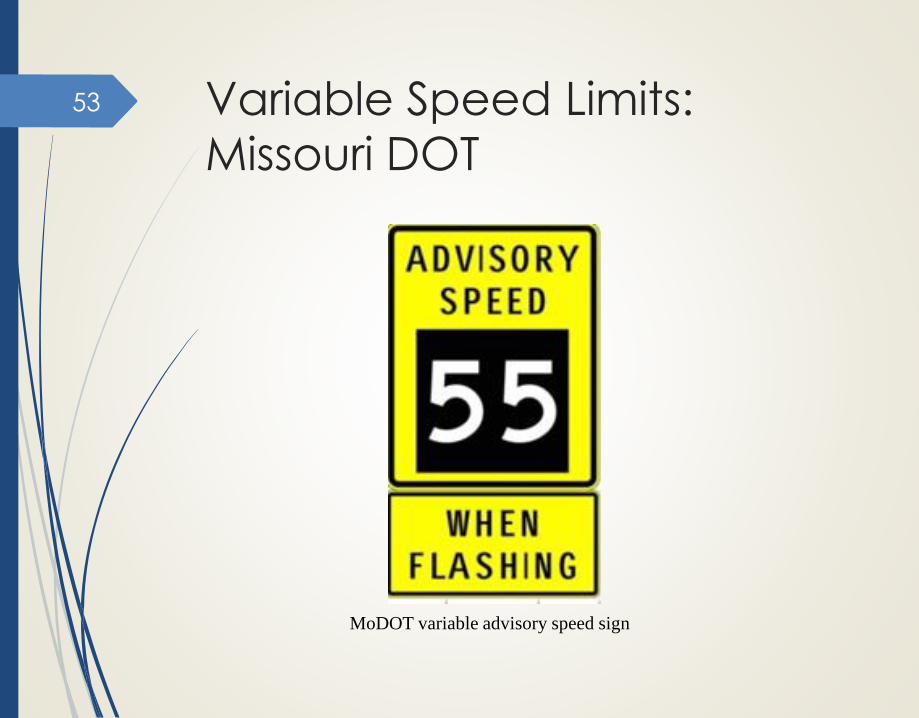
Variable Speed Limits:
Missouri DOT
Variable speed signs along I-270 and I-255 in St. Louis, MO
Aided in the reduction of crashes and some congestion
Enforcement was challenging due to driver confusion
Variable speed limits were converted into variable advisory speeds
Yellow and black color stating “Advisory When Flashing”
Advisory speed range increases from 10mph in extreme congestion, to 60mph during very light traffic
10% increase in average throughput, reduction in congestion
4.5% to 8% crash reduction
Upcoming congestion, inclement weather conditions, work zone lane closures or stopped vehicles ahead
Dynamic Message Signs
52
Variable Speed Limits:
Missouri DOT
53
MoDOT variable advisory speed sign

Multiple ATM Strategies:
Texas DOT (Austin)
Variable speed limits
Harmonized traffic flows, reduced the amount of lane changing conflicts, and provided improved safety on freeways
Reduced the likelihood and severity of conflicts
Shoulder lane use
Reduced traffic density and increased operational speed
Speed at the end of the shoulder use segment decreased
Safety on the corridor was improve
Comprehensive evaluation is required
Ramp Metering Strategy
Reduced the average number of stops per vehicle
Homogenous speed among vehicles
Reduced corridor delay
Overall network delay increased because of vehicles queuing during the peak traffic on ramps
54
Multiple ATM Strategies:
Texas DOT (Houston)
Queue warning system
Combat the a bottleneck issue at an interchange.
Before and after analysis throughout 2008 and early 2009.
Higher average speeds and reduced variance of driver
speeds over all lanes.
5% to 7% reduction in rear-end crashes at I-610, while no significant change at US 59.
Speed variance reduces.
Longer study be conducted.
55

Conclusions
No single data collection technology or method can provide accurate widespread coverage of the network under all weather and traffic conditions
Today’s technology is geared more towards point to point measurements rather than point measurements. Travelers are more interested in such information (e.g. travel time, delay, etc.)
Accurate real time traffic information requires integration of several data sources and advanced data processing tools to remove erroneous data and impute missing data
Next generation technology for V2V and V2I offers a solution to today’s limitations on network coverage at low cost infrastructure, as well as a more efficient and accurate dissemination tool
56

Conclusions
The effect of real time information on pre-trip planning
and en route decision making is evident but difficult to measure
Social media is effective in information dissemination and used by 41 states
DMS is recognized to be the mostly used technology
by different TMCs.
The abundance of data can lead to a wealth of
information and subsequently information overload if
disseminated to travelers. Travelers should customize
the information based on their travel needs
57

Conclusions
Short term predictive information is very useful to
travelers at the pre-trip planning stage
As data sources increase, more advanced data
mining algorithms are required to deal with big data
Current active traffic management strategies rely on traffic information relayed to management centers
and travelers
Case studies reviewed show use of multiple strategies
at the same time is more effective
58

Recommendations
What is the required traffic data accuracy?
What are the most effective traffic data screening
methods to be used?
What are the most effective ways to disseminate the
extracted traffic information to the drivers?
What is the impact of information on drivers’ behavior
and the congestion management?
What Integrated active traffic management strategies
can aid in reducing congestion?
59

THANK YOU!61