real-time formation evaluation for optimal decision making while
TRANSCRIPT

1
1 Bristow, J. F., 2002, Real-time formation evaluation for optimal decisionmaking while drilling: Examples from the southern North Sea, in M.Lovell and N. Parkinson, eds., Geological applications of well logs:AAPG Methods in Exploration No. 13, p. 1–13.
Real-time Formation Evaluation forOptimal Decision Making While Drilling:
Examples from the Southern North Sea
J. F. BristowSchlumberger Data and Consulting Services, Gatwick, U.K.
ABSTRACT
In recent years, rapid growth in horizontal-well completions has been driven by the need to reducefield-development costs. Logging-while-drilling (LWD) technology and geosteering techniques haveadvanced to ensure high rates of success in reaching reservoir targets that are smaller and less clearly
defined than those attempted previously. Three recent examples illustrate the benefits of these techniqueswhere LWD data are acquired at the rig site, transmitted real time to the operator’s office, and interpretedby a multidisciplinary asset team that updates formation models to enable optimal geosteering decisions.
Prior to drilling the horizontal wells, forward modeling based on offset-well data and structural infor-mation from the earth model is used to predict LWD log responses along the well trajectory. While drilling,the formation model is refined to minimize spatial uncertainties within the reservoir and to provide a predic-tive model of the formation relative to the wellpath. This refinement is achieved by correlating the real-timeLWD logs with forward-modeled log responses. Resulting correlations constrain the position of the bit in theformation, so apparent formation dip can be computed. Synthetic LWD logs are predicted for the projectedtrajectory 150 ft (45 m) ahead of the bit. Uncertainties in the formation structural model are reduced furtherby interpreting LWD azimuthal density images retrieved between bit runs. These are processed immediatelyon a workstation in the operator’s office and provide dip information to constrain the structural interpretationand interpretations of lateral differences in stratigraphic thickness. Image data also provide information aboutfacies and help in identifying zones of high permeability.
Three case studies show how geosteering based on predictive real-time modeling can help manage riskassociated with drilling horizontal wells by reducing uncertainties about positioning. They also show howoptimizing placement of wells improves productivity of wells.
INTRODUCTION
As a result of the need to reduce field-development costs, nearly all wells drilled in the southern NorthSea are completed horizontally. New technologies have made drilling and logging these wells less difficult;therefore, fields previously marginal are now economic to develop. Geosteering—defined as the real-timesteering of high-angle and horizontal wells using while-drilling data—has been developed to ensure higher
Bristow_v4.qxd 12/19/02 8:39 AM Page 1

rates of success in reaching reservoir targets that are smallerand less clearly defined than those attempted previously(Lesso and Kashikar, 1996). Geosteering allows wells to beguided to optimal geological destinations, rather than simplyto be steered directionally to predetermined geometric (notnecessarily optimal) locations.
New LWD resistivity tools provide as many as 20 resis-tivity logs. Azimuthal LWD resistivity and density data canprovide azimuthal borehole images, dip information, and aplethora of formation-evaluation data. However, the problemthe operator faces is making the greatest use of data withinthe tight time constraints of drilling. The true value of LWDdata for making decisions is realized fully when the data areused for interpretation while drilling. Updating the structuraland petrophysical model of the reservoir in real time allowscorrective geosteering in response to observed changes in thereservoir, which in turn allows the remaining wellpath to beoptimized. Therefore, real-time interpretation can be appliedas a means for the operator to derive more benefit from theLWD data and so manage risk by reduction of uncertaintiesabout positioning.
This paper aims to show how the value of LWD data isincreased when the interpretation is accomplished within areal-time decision window. Case studies described below arefrom recent work on three gas-development wells in thesouthern North Sea.
BEFORE-THE-JOB PREPARATION
Forward Modeling
Logging-tool response to a layered medium depends onthe angle between the tool axis and the bedding plane. In thecase of horizontal wells, this angular relationship can lead todifficulties in interpreting data from resistivity devices, partic-ularly when adjacent-bed effects are complicated by fluidinvasion and anisotropic formations. Forward modeling oflogs provides insight into possible log responses in a particu-lar well by constructing a catalogue of modeled logs for arange of scenarios that show geology and trajectories. TheIntegrated Forward Modelling (INFORM*) system providesthis facility (Allen et al., 1995). This system enables selectionof the optimal LWD-tool configuration and demonstratesfeasibility of the well-geosteering requirement. It also famil-iarizes the asset team with log responses expected in differentgeologic scenarios and makes the team alert to geometry-dependant events such as polarization horns.
Pilot-well or adjacent-well log data are used to build oneor more “layer columns” to represent the stratigraphic se-quence in the planned well. Offset-well log data—in thesecases, Rt (true resistivity), bulk density, neutron porosity, andgamma ray—are run through deconvolution filters to pro-
duce squared log responses. Deconvolution reduces the num-ber of layers sampled to only those at actual petrophysical dif-ferences. It also enables the analyst to include thin beds thathave not been resolved properly in the original logs but whichmay be significant during geosteering correlation.
The 3-D structural model of the reservoir is combinedwith the petrophysical stratigraphic column and the proposedwell trajectory. Then the petrophysical model is convolvedwith the LWD-tool response functions to generate syntheticlogs along the planned trajectory. Typically, various geologicand structural models are run to visualize uncertainties asso-ciated with input data, such as different formation dips andpotential faults. Forward modeling produces a database of themodeled LWD log responses from 0° to 90° apparent dip.This database is exported to a PC system for use with geo-steering software.
In the “landing” of some wells, predicted lithology andthickness and actual lithology and thickness are significantlydifferent. In these cases the landing data are used to update thestratigraphic column of the model, and a new database of logresponses is generated for the geosteering software. (This wasrequired in Case Study 2; upon landing the well, an extra bedof shale was penetrated. Landing is the location at which thewell trajectory reaches horizontal, 90° deviation.)
Design of Logging Program
The gamma-ray log is the main correlation log used forlanding the well and for identifying major paleohorizontalmarkers in gas reservoirs of the southern North Sea. Resistiv-ity logs are used primarily for estimation of gas saturation andlocally as indicators of distance from the upper boundary ofthe formation. Density- and neutron-porosity logs are used forinferences about reservoir quality and fluid type. In case stud-ies described here, the logging programs involved an inte-grated LWD system of 2-MHz (megahertz) resistivity,gamma-ray, and azimuthal density-neutron tools mounteddirectly behind a steerable motor (Figure 1).
The 2-MHz array-resistivity device (ARC5*) has fivetransmitters and records five phase-shift and five attenuationborehole-compensated resistivities, along with a gamma-raylog (Bonner et al., 1995). The azimuthal density-neutron tool(ADN4*) is equipped with an integral blade stabilizer, tominimize standoff from the borehole wall, and magnetome-ters that allow orientation of measurements (Holenka et al.,1995; Carpenter et al., 1997). As the tool rotates, the densityand photoelectric-factor (PEF) data are binned into 16 equalsectors around the borehole. These 16 sectors are used togenerate oriented density and PEF images of the borehole,which are interpreted manually to calculate bedding-planedip and azimuth, and to gain information about lithofacies.The 16-sector density data are averaged radially to producequadrant density and average density.
Bristow2
* Mark of Schlumberger.
Bristow_v4.qxd 12/19/02 8:39 AM Page 2

During drilling, the amount of data that can be transmit-ted to the surface by measurement while drilling (MWD)telemetry in real time is limited; therefore, a tool configurationcontaining the most significant curves generally is selected.For the three case studies described below, the real-time(transmitted) data typically included the gamma ray, densityquadrant up (ROBU), density quadrant down (ROBB), andresistivities of Phase Shift 34, 10-in. (25.4 cm) (PS34 andPS10) and attenuation 34-in. (86.4 cm) (AT34). The real-time density-up and density-down quadrant data can be use-ful for determining whether the well is cutting the stratigraphicsection upward (i.e., toward younger strata) or downward.
COMMUNICATIONS SETUP
Hardware
A robust link between the rig site and the PC used by theoffice-based interpretation team is a critical part of the geo-steering process. The general communications setup isshown in Figure 1. Data are transferred real time to the
office-based PC, which displays the depth log and directionaldriller’s “tool-face” display as seen on the rig. This PC is usedfor the geosteering correlation work and is networked to aworkstation that is used for petrophysical analysis and forprocessing and interpretation of the density and PEF images.
REAL-TIME INTERPRETATION
Geosteering Software
The core of modeling work is achieved by building a 2-Dstructural model of the formation while drilling. This modelminimizes spatial uncertainties and provides a predictivemodel of the formation relative to the wellpath. This “corre-lation” model is built on the basis of PC geosteering soft-ware. The real-time LWD log data and MWD well trajec-tory are displayed with a forward-modeled synthetic logdrawn from the database modeled before the job. Resultingcorrelations indicate the actual position of the bit in beds ofthe formation and provide a synthetic LWD response for thetrajectory projected 150 ft (45 m) ahead of the bit; thus, the
Real-time Formation Evaluation for Optimal Decision Making While Drilling 3
Figure 1. Geosteering communications setup. Data are transferred by mud-pulse telemetry to the IDEAL* acquisition unit at thesurface and real time by satellite to the office-based PC.
* Mark of Schlumberger.
Bristow_v4.qxd 12/19/02 8:40 AM Page 3

wellpath can be replanned if necessary. Different formationmodels can be applied easily, and faults can be integrated inmodels of the formations.
Memory Data Processing
Using real-time LWD density- or resistivity-imaging toolscan reduce the number of uncertainties associated with thestructural model built by geosteering software. Data sets fromthese imaging tools, too large to be transmitted real time, canbe downloaded between bit runs and processed on the petro-physical workstation. The borehole-azimuth images are ana-lyzed interactively to provide structural dip information forconfirming and constraining the structural correlation model.Even if the density data are of quality insufficient to estimatedips, in most instances, the form of bedding on images per-mits a decision as to whether the well is being drilled upwardor downward through the stratigraphic succession.
In addition to generating image data, LWD memorydata (normally of higher resolution than the transmitted data)can be processed for estimates of porosity and saturation. Incase studies described below, the wells had objectives in termsof cumulative porosity feet, a figure updated with the mem-ory LWD data between bit runs. The ten different resistivitymeasurements on the ARC5 allow an evaluation of Rt thataccounts for the effects of invasion and anisotropy. The key isto process memory data quickly, so that information gainedcan be used to help optimize placement of the well in theremainder of the stratigraphic section.
Data Distribution
Results of the geosteering software correlation work,image interpretation, and petrophysical interpretation are dis-tributed before operation meetings. In the third case studydescribed below, the operator maintained a Web site, whichenabled associated personnel offshore or onshore to accessdata and results.
CASE STUDY 1
Seismic depth-conversion problems, a poorly imagedfault about two-thirds of the way along the horizontal section,and limited well control in the area posed uncertainties in theposition of the target. Uncertainties about depth were causedby variation in thickness and velocity of the Zechsteinsequence, immediately above the reservoir. The purpose wasto drill a 2500-ft (760-m) horizontal well in the upper portionof the Rotliegendes Upper Leman sandstone (Permian),maintaining a standoff from the gas-water contact.
The well was planned as a geometric placement, with noinitial intention of geosteering. Using two offset wells, sever-al structural-geology scenarios were modeled at the well-
planning stage. The most probable “base-scenario” model isshown in Figure 2.
The correlation model built up over six days of drilling(Figure 3) shows the structural geology relative to the drilledtrajectory and the planned trajectory. From the first two cor-relation points within the reservoir, dip was calculated to beabout 1° and the well was landed successfully in reservoirZone 1. A fault was predicted at about 1200 ft (350 m) intothe horizontal section of the borehole. The fault was pene-trated at about 700 ft (200 m); the borehole passed abruptlyfrom the reservoir, through younger beds of the Zechstein,and into the overlying Werra Anhydrite (Figure 3). From thegeosteering software model, the minimal fault throw was cal-culated to be 20 ft (6 m) and the dip of the anhydrite to beabout 15°. The well was steered downward to try to regainthe planned trajectory, but it did not reenter the reservoir.The well was allowed to descend until it reached the “hard-floor” standoff from the gas-water contact. At this stage, sev-eral hundred feet of anhydrite had been drilled and the wellhad not reentered the reservoir.
The geosteering model built from real-time data (Figure3) indicated that the difference in total vertical depth (TVD)of the reservoir with respect to its position leftward from thefault (Figure 3) was 90 ft (27 m), rather than the 45 ft (14 m)predicted from seismic data. The geosteering model indi-cated that the wellbore was only several feet above the reser-voir. At this point, the operator agreed to steer downward; thereservoir was penetrated 10 ft (3 m) TVD deeper. Apparentreservoir dip of 3.5° was calculated from new correlationpoints. The well was leveled off and remained in the pay zoneto total depth. Geosteering of the last several hundred feet ofthe well increased the drain by 550 ft (168 m), or 45%, withrespect to the planned trajectory. Initial production was 80%greater than projected.
A final refined model of the structural geology (Figure 4)was built from the LWD memory data. The operator usedthat interpretation to provide a structural framework for thereservoir-simulation model.
CASE STUDY 2
In the well described here as Case Study 2, uncertaintyin seismic depth conversion resulted from heterogeneity ofthe thick Zechstein sequence, above the Lower Permianreservoir. The log-forward model (Figure 5) shows predictedstructural geology; no faults were expected. A simple, hori-zontal-drain trajectory was planned, but contingency was leftfor geosteering.
The uncertainty in depth conversion was realized earlyin drilling the 6-in.-diameter (15-cm) section; correlations ofthe lower Zechstein indicated that the reservoir would behigher than predicted. In fact, the reservoir was 43 ft (13 m)
Bristow4
Bristow_v4.qxd 12/19/02 8:40 AM Page 4

Real-time Formation Evaluation for Optimal Decision Making While Drilling 5
Figure 3. Case Study 1: Geosteering screen correlation model. Panels are described in descending order. Panel 1: real-time gamma-ray log. Panel 2: Modeled gamma-ray log. Panel 3: Cross section showing planned trajectory of well (blue dotted) and actual trajec-tory (black). TVD = true vertical depth; MD = measured depth.
Figure 2. Before-the-job model, Case Study 1. Lowermost panel: Colors of formations based on scaling of gamma-ray signal.Dashed blue vertical line shows point of entry into reservoir. In descending order, upper three panels show forward-modeledgamma-ray log, density logs, and resistivity logs. TVDSS = true vertical depth subsea; ARC5 = compensated array resistivity tool;ADN = azimthal density neutron tool.
Bristow_v4.qxd 12/19/02 8:40 AM Page 5
Bristow6
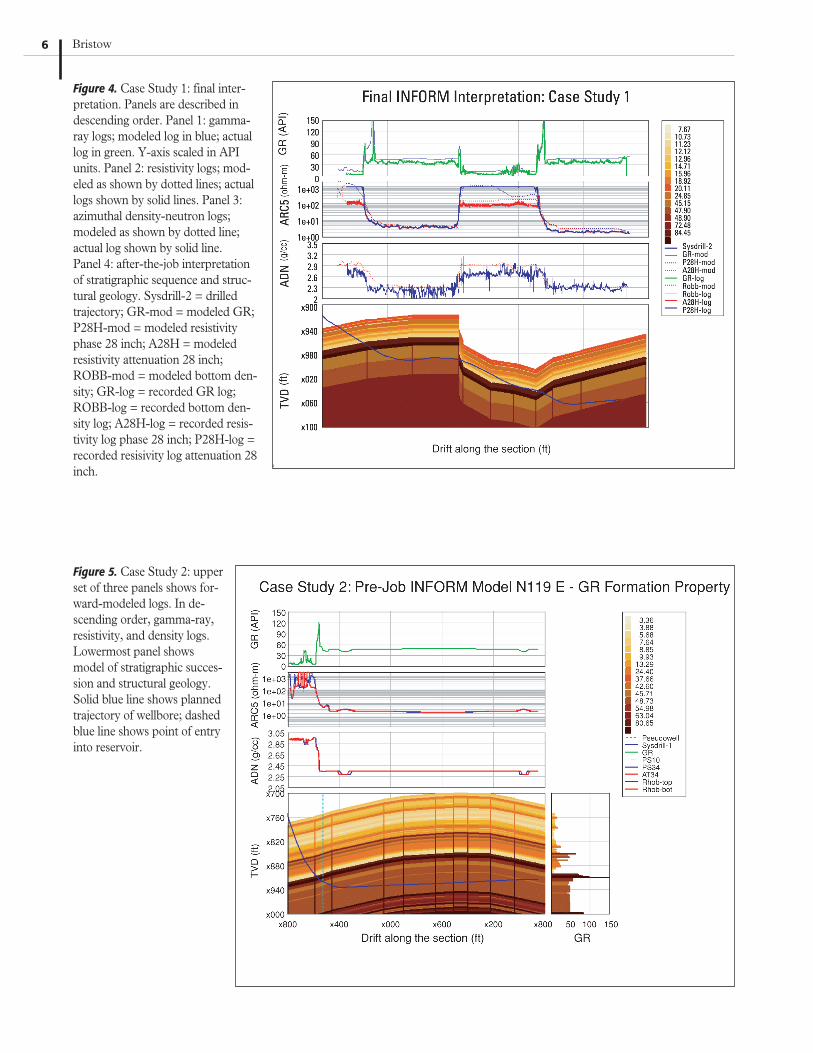
Figure 4. Case Study 1: final inter-pretation. Panels are described indescending order. Panel 1: gamma-ray logs; modeled log in blue; actuallog in green. Y-axis scaled in APIunits. Panel 2: resistivity logs; mod-eled as shown by dotted lines; actuallogs shown by solid lines. Panel 3:azimuthal density-neutron logs;modeled as shown by dotted line;actual log shown by solid line. Panel 4: after-the-job interpretationof stratigraphic sequence and struc-tural geology. Sysdrill-2 = drilledtrajectory; GR-mod = modeled GR;P28H-mod = modeled resistivityphase 28 inch; A28H = modeledresistivity attenuation 28 inch;ROBB-mod = modeled bottom den-sity; GR-log = recorded GR log;ROBB-log = recorded bottom den-sity log; A28H-log = recorded resis-tivity log phase 28 inch; P28H-log =recorded resisivity log attenuation 28inch.
Figure 5. Case Study 2: upperset of three panels shows for-ward-modeled logs. In de-scending order, gamma-ray,resistivity, and density logs.Lowermost panel showsmodel of stratigraphic succes-sion and structural geology.Solid blue line shows plannedtrajectory of wellbore; dashedblue line shows point of entryinto reservoir.
Bristow_v4.qxd 12/19/02 8:41 AM Page 6

higher than anticipated, but the well was landed correctly, 20ft (6 m) TVD into the reservoir (Figure 6). The stratigraphydiffered significantly from that of the offset well; an addi-tional unit of shale was penetrated. The drill bit was changedafter landing the well, and for the geosteering-software data-base, the memory LWD logs were used to update the upperportion of the reservoir model. When drilling recommenced,geosteering-software correlations indicated that stratadipped slightly toward the toe of the well, contradicting thedip expected from the seismic model (Figure 5). Additionalcorrelations based on real-time gamma-ray and resistivitydata (Figures 6 and 7) confirmed this dip and indicated thatthe well was approaching the top of the reservoir. A secondbit trip was made and the azimuthal density image wasprocessed, which confirmed that the well was drillingupward through the stratigraphic sequence. The wellpathwas adjusted downward. Reference to the correlation modelindicated that the adjustment avoided the well’s penetratingthe upper boundary of the reservoir by 2 ft (0.6 m), TVD(Figure 6). The remainder of the drain was drilled success-fully in the upper portion of the reservoir; the well wasdrilled gradually downward through the stratigraphicsequence and then essentially bed-parallel for the last one-third of the horizontal trajectory (Figure 7). Tests showedinitial production of 40% more than predicted.
CASE STUDY 3
At the outset, Case Study 3 involved two principal un-certainties: (1) Structural relief of the reservoir was not wellknown, and (2) the reservoir was comparatively thin (70 ft[21 m]) and of relatively indistinct petrophysical character.These uncertainties increased the risk of drilling through thetop or bottom of the reservoir in the 2500-ft (760-m) hori-zontal section, because the position of the wellbore could bedifficult to establish.
The offset well used to populate the petrophysical modelwas about 1.5 mi (2.4 km) from the heel of the well. Figure 8illustrates the excellent correlation between the synthetic-logresponse and the real-time gamma-ray log, as displayed onthe geosteering software. This correlation was the basis for ahigh level of confidence about the position of the well, whichwas landed within 6 in. (15 cm) vertically of the desiredhorizon.
At about 1500 ft (460 m) of horizontal section drilled, itbecame increasingly difficult to be certain of the bit’s positionin the formation, although the quality of the reservoir wasacceptable. It became more difficult to slide with the mudmotor, so the string was pulled and the drilling assembly waschanged to a rotary system with a variable-gauge stabilizer.Thinness of the reservoir, uncertainty in the seismic depth
Real-time Formation Evaluation for Optimal Decision Making While Drilling 7
Figure 6. Case Study 2:upper set of two panelsshows gamma-ray logs ofthe GeoSteering Screencorrelation model, aslabeled. Lowermost panelshows the updated modelof the geologic cross sec-tion. The actual trajectoryof the well is shown inblack. Gamma-ray logsscaled in API units. TVD= true vertical depth (ft);MD = measured depth (ft).
Bristow_v4.qxd 12/19/02 8:41 AM Page 7

Bristow8
Figure 7. Case Study 2:upper set of two panelsshows resistivity logs of theGeoSteering Screen correla-tion model, as labeled. Low-ermost panel shows theupdated model of the geo-logic cross section. Theactual trajectory of the wellis shown in black. Gamma-ray logs scaled in API units.TVD = true vertical depth(ft); MD = measured depth(ft).
Figure 8. Case Study 3:upper set of two panelsshows gamma-ray logs ofthe GeoSteering Screencorrelation model, aslabeled. Observe the excel-lent correlation between thesynthetic gamma-ray log(black) and the real-timegamma-ray log (red).Gamma-ray logs scaled inAPI units. TVD = true ver-tical depth (ft); MD =measured depth (ft).
Bristow_v4.qxd 12/19/02 8:42 AM Page 8
conversion, and subtle contrast of beds within the reservoirincreased the risk of drilling out the top or bottom of thereservoir. To have done so would have cost many days’ rigtime to plug the hole back and sidetrack it. Figures 9 through11 show the three geosteering-software correlation modelsthat were produced at the time of the bit trip. Figure 9 showsthe formation dipping at -2.7° and models the well’s poten-tial entry into Carboniferous strata. Figure 10 models theformation dipping at 0.75° and the well approaching the topof the reservoir. Figure 11 shows the formation dipping at -1°and the well’s being essentially bed parallel. Note that a differ-ence in dip as subtle as 3.5 degrees (compare Figures 9 and10) could result in the well’s exit from the bottom or top ofthe reservoir. In this situation, close attention to positioningwas critical.
On retrieval of memory data at the bit trip, azimuthal-density data (Figures 12 and 13) were processed and inter-preted. The borehole trajectory relative to beds of the reser-voir was interpreted from oriented density images. From3830 ft (1168 m) measured depth (MD) for about 50 ft (15m), the borehole essentially was parallel to beds of the reser-voir. Through the next 75 ft (23 m), the borehole cut througha bed that is thinner than 6 in. (15 cm). Dip of this bed was
calculated to be 1° southeastward and the well trajectory asN89°E. In the interval from 3980 ft to 4500 ft (1213 m to1372 m) MD, the borehole cut through the stratigraphic sec-tion from older to younger beds, as shown by sinusoidaldirections on the asimuthal density image (Figures 12 and13). At 4550 ft (1388 m), the borehole was effectively paral-lel to bedding (Figure 13); the borehole just touched a bedfrom beneath, then cut the stratigraphic section from youngerto older beds.
When this information was related to the structuralmodel on geosteering software, the correct interpretationbecame evident (Figure 14). This provided the operator withan unequivocal interpretation of the position of the well rela-tive to the formation. Drilling recommenced with a new bit.With risk of exiting the reservoir minimized, it was decided tosteer downward to try to penetrate the lower portion of thereservoir and ensure drainage from these strata.
The density images also yielded important informationrelated to facies. The reservoir is predominantly a fluvialsequence with some dune apron and dune slip-face facies; thelatter generally is the more permeable. The dune slip-facefacies can be seen clearly in images from 4275 to 4350 ft(1303 to 1326 m) MD (Figure 13); they show evidence of
Real-time Formation Evaluation for Optimal Decision Making While Drilling 9
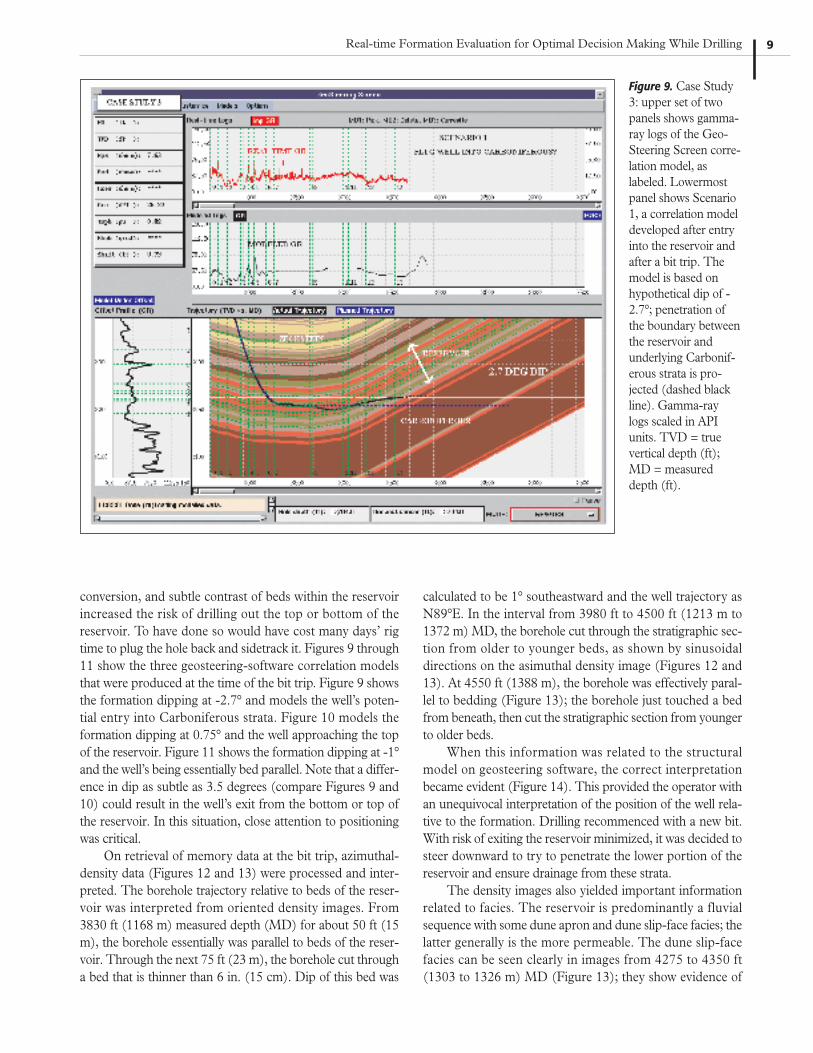
Figure 9. Case Study3: upper set of twopanels shows gamma-ray logs of the Geo-Steering Screen corre-lation model, aslabeled. Lowermostpanel shows Scenario1, a correlation modeldeveloped after entryinto the reservoir andafter a bit trip. Themodel is based onhypothetical dip of -2.7°; penetration ofthe boundary betweenthe reservoir andunderlying Carbonif-erous strata is pro-jected (dashed blackline). Gamma-raylogs scaled in APIunits. TVD = truevertical depth (ft);MD = measureddepth (ft).
Bristow_v4.qxd 12/19/02 8:42 AM Page 9

Bristow10
Figure 11. Case Study 3:upper set of two panelsshows gamma-ray logs ofthe GeoSteering Screen cor-relation model, as labeled.Lowermost panel showsScenario 3, a correlationmodel developed after entryinto the reservoir and after abit trip. The model is basedon hypothetical dip of –1°;under these conditions, tra-jectory of the wellborewould be almost parallel tobedding of the reservoir(dashed black line).Gamma-ray logs scaled inAPI units. TVD = true ver-tical depth (ft); MD = mea-sured depth (ft).
Figure 10. Case Study 3:upper set of two panelsshows gamma-ray logs ofthe GeoSteering Screencorrelation model, aslabeled. Lowermost panelshows Scenario 2, a corre-lation model developedafter entry into the reser-voir and after a bit trip.The model is based onhypothetical dip of 0.75°;penetration of the bound-ary between the reservoirand overlying Permianstrata is projected (dashedblack line). Gamma-raylogs scaled in API units.TVD = true vertical depth(ft); MD = measureddepth (ft).
Bristow_v4.qxd 12/19/02 8:42 AM Page 10

depositional dip of 20° to 30°. The direction of dip indicatessouthwestward paleotransport, consistent with other datafrom the field.
CONCLUSIONSFrom these three case studies the following conclusions
were reached:
1) Risk can be managed by real-time modeling of availableLWD data, which reduces uncertainty about the positionof the borehole.
2) Geosteering optimizes placement of wells and increasestheir production.
3) Azimuthal LWD image data are powerful tools for con-straining the position of a well within a formation.
4) Achieving optimal well placement requires the following: • A multisensor suite of LWD data must be available to
the office-based team, in real time. The team can mon-itor the trajectory continuously and, if necessary, incor-porate the most recently acquired data, reinterpret thegeological conditions, and replan the trajectory.
• Before-the-job modeling and planning enable prepara-tion for contingencies and reduction of uncertaintythrough evaluation of expected LWD responses.
• A close, cooperative working relationship between thegeosteering analyst and the operator asset team achievesa more effective and efficient decision-making process.
Real-time Formation Evaluation for Optimal Decision Making While Drilling 11
Figure 12. Case Study 3:azimuthal density image withLWD memory logs.Gamma-ray, density, neu-tron, and resistivity logs areshown as labeled. On azi-muthal density log, light colors indicate rocks of highdensity; dark colors indicaterocks of low density. Sinu-soidal green lines on azi-muthal density image belowabout 3960 ft indicate thatstrata were penetrated insequence from older toyounger. Leftmost green line= suppressed gamma-ray log;blue dotted line = neutronlog.
Bristow_v4.qxd 12/19/02 8:43 AM Page 11

Figure 13. Case Study 3: azimuthaldensity image with LWD memorylogs. Gamma-ray, density, neutron,and resistivity logs are shown aslabeled. On azimuthal density log, lightcolors indicate rocks of high density;dark colors indicate rocks of low den-sity. Wellbore cut strata in sequencefrom older to younger, to 4550 ft; at4550 ft, wellbore was parallel to bed-ding, in contact with the base of a bed.Below 4550 ft, the wellbore penetratedbeds from younger to older (compareazimuthal density images, Figures 13and 14, and compare both to wellboretrajectory, Figure 14).
Bristow12
Figure 14. Case Study 3: finalGeoSteering Screen correlationmodel, showing correct strati-graphic and structural interpreta-tion. Upper two panels showgamma-ray logs, as labeled. Lower-most panel shows configuration ofwellbore at position of bit trip(right-hand white arrow); from thisposition, the well was drilled down-ward, so as to penetrate the lowerpart of the reservoir. Relativelysteep dips of beds from 4275 to4350 ft are interpreted as evidenceof sand-dune slip-face facies.Gamma-ray logs scaled in APIunits. TVD = true vertical depth(ft); MD = measured depth (ft).
Bristow_v4.qxd 12/19/02 8:43 AM Page 12

ACKNOWLEDGMENTS
Many of the techniques described in this paper weredeveloped with the close cooperation of the staff at ArcoBritish, BG International, and Amerada Hess. I am gratefulfor their support and guidance in developing the workflowand for kindly permitting the use of their data as examples inthis paper. I also thank Steve Crouch of Anadrill UK for tech-nical advice.
REFERENCES CITEDAllen, D., B. Dennis, J. Edwards, S. Franklin, A. Kirkwood, L. Lehtonen, B.
Lyon, and G. Simms, 1995, Modeling logs for horizontal well planningand evaluation: Schlumberger Oilfield Review, winter 1995, p. 47–63.
Bonner, S. D., J. R. Tabanou, P. T. Wu, J. P. Seydoux, K. A. Moriarty,B. K. Seal, E. Y. Kwok, and M. W. Kuchenbecker, 1995, New 2-MHzmultiarray borehole-compensated resistivity tool developed for MWDin slim holes: Society of Petroleum Engineers, Paper 30547.
Carpenter, W., D. Best, and M. Evans, 1997, Application and interpreta-tion of azimuthally sensitive density measurements acquired whiledrilling: Society of Professional Well Log Analysts 38th Annual LoggingSymposium Transactions, Paper EE.
Holenka, J., D. Best, M. Evans, P. Kurkosi, and W. Sloan, 1995, Azimuthalporosity while drilling: Society of Professional Well Log Analysts 36thAnnual Logging Symposium Transactions, Paper BB.
Lesso, W. G., and S. Kashikar, 1996, The principles and procedures ofgeosteering: IADC/SPE Drilling Conference, New Orleans IADC/SPE,Paper 35051, p. 133–145.
Real-time Formation Evaluation for Optimal Decision Making While Drilling 13
Bristow_v4.qxd 12/19/02 8:43 AM Page 13