real-time pathogen surveillance systems using dna sequencing
TRANSCRIPT

Real-time pathogen surveillance systems using DNA sequencing Joshua Quick A thesis submitted to the University of Birmingham for the degree of Doctor of Philosophy Institute of Microbiology and Infection School of Biosciences College of Life and Environmental Sciences University of Birmingham November 2017

University of Birmingham Research Archive
e-theses repository This unpublished thesis/dissertation is copyright of the author and/or third parties. The intellectual property rights of the author or third parties in respect of this work are as defined by The Copyright Designs and Patents Act 1988 or as modified by any successor legislation. Any use made of information contained in this thesis/dissertation must be in accordance with that legislation and must be properly acknowledged. Further distribution or reproduction in any format is prohibited without the permission of the copyright holder.

2
Acknowledgements
I would like to thank my parents, Angela and Justin for their support and
encouragement over the years. They kindled my interest in science from a young age
and made sure I received a brilliant education at Colyton.
I would like thank my supervisors in my first job at Illumina, Carolyn and Bojan for
teaching me about next-generation sequencing, optics and encouraging me to learn
programming.
I would like to thank Mark, Tim and Robin for supporting me through my PhD and
most importantly Nick for the years of mentoring, opportunities and friendship.
I would lastly like to thank my fiancé, Ellis for the love and support over the past five
years. In this time, we have built a life together here in Birmingham and travelled the
world together.
3
Synopsis
Microbiological research has uncovered the basis of fermentation, infectious disease,
vaccination and antibiotics. Now, a technological revolution leveraging DNA, the code
of life, has allowed us to unravel cellular and evolutionary processes in exquisite detail.
Today our need for new innovation is still great. The modern world is a challenging
environment: over-population, climate change and highly mobile populations create a
high risk of pandemic disease especially from viruses and many bacteria are now
resistant to our life saving antibiotic drugs due to overuse. In hospitals, the spread of
pathogens can be rapid and life threatening. Whole-genome sequencing has the power
to identify the source of infections and determine whether clusters of cases belong to an
outbreak. Portable, real-time nanopore sequencing enables sequencing to be performed
near the patient, even in resource-limited settings. Integrating with existing datasets
allows digital surveillance able to detect outbreaks earlier while they can still be
contained. Early demonstrations of the power of whole-genome sequencing for outbreak
surveillance have made it an area of intense interest and further development in
laboratory methods and infrastructure will make it an important tool that can be
deployed in response to future outbreaks.

4
Submitted work
I. Quick J, Cumley N, Wearn CM, Niebel M, Constantinidou C, Thomas CM, Pallen
MJ, Moiemen NS, Bamford A, Oppenheim B, Loman NJ. Seeking the source of
Pseudomonas aeruginosa infections in a recently opened hospital: an observational
study using whole-genome sequencing. BMJ Open. 2014 Nov 4;4(11):e006278.
II. Quick J, Ashton P, Calus S, Chatt C, Gossain S, Hawker J, Nair S, Neal K, Nye K,
Peters T, De Pinna E, Robinson E, Struthers K, Webber M, Catto A, Dallman TJ,
Hawkey P, Loman NJ. Rapid draft sequencing and real-time nanopore sequencing in a
hospital outbreak of Salmonella. Genome Biol. 2015 May 30;16:114.
III. Quick J, Loman NJ, Duraffour S, Simpson JT, Severi E, Cowley L, Bore JA,
Koundouno R, Dudas G, Mikhail A, Ouédraogo N, Afrough B, Bah A, Baum JH,
Becker-Ziaja B, Boettcher JP, Cabeza-Cabrerizo M, Camino-Sanchez A, Carter LL,
Doerrbecker J, Enkirch T, Dorival IGG, Hetzelt N, Hinzmann J, Holm T,
Kafetzopoulou LE, Koropogui M, Kosgey A, Kuisma E, Logue CH, Mazzarelli A,
Meisel S, Mertens M, Michel J, Ngabo D, Nitzsche K, Pallash E, Patrono LV, Portmann
J, Repits JG, Rickett NY, Sachse A, Singethan K, Vitoriano I, Yemanaberhan RL,
Zekeng EG, Trina R, Bello A, Sall AA, Faye O, Faye O, Magassouba N, Williams CV,
Amburgey V, Winona L, Davis E, Gerlach J, Washington F, Monteil V, Jourdain M,
Bererd M, Camara A, Somlare H, Camara A, Gerard M, Bado G, Baillet B, Delaune D,
Nebie KY, Diarra A, Savane Y, Pallawo RB, Gutierrez GJ, Milhano N, Roger I,

5
Williams CJ, Yattara F, Lewandowski K, Taylor J, Rachwal P, Turner D, Pollakis G,
Hiscox JA, Matthews DA, O'Shea MK, Johnston AM, Wilson D, Hutley E, Smit E, Di
Caro A, Woelfel R, Stoecker K, Fleischmann E, Gabriel M, Weller SA, Koivogui L,
Diallo B, Keita S, Rambaut A, Formenty P, Gunther S, Carroll MW. Real-time,
portable genome sequencing for Ebola surveillance. Nature. 2016 Feb
11;530(7589):228-232.
IV. Quick J, Grubaugh ND, Pullan ST, Claro IM, Smith AD, Gangavarapu K, Oliveira
G, Robles-Sikisaka R, Rogers TF, Beutler NA, Burton DR, Lewis-Ximenez LL, de
Jesus JG, Giovanetti M, Hill SC, Black A, Bedford T, Carroll MW, Nunes M,
Alcantara LC Jr, Sabino EC, Baylis SA, Faria NR, Loose M, Simpson JT, Pybus OG,
Andersen KG, Loman NJ. Multiplex PCR method for MinION and Illumina sequencing
of Zika and other virus genomes directly from clinical samples. Nat Protoc. 2017
Jun;12(6):1261-1276.
6
Table of contents
Acknowledgements 2
Synopsis 3
Submitted work 4
Table of contents 6
1. Introduction 10
1.1 The discovery of microbes 10
1.2 The ‘Golden age’ of bacteriology 10
1.2.1 Pasteurisation 10
1.2.3 Discovery of the anthrax bacillus 11
1.2.4 Koch’s plate technique 11
1.2.5 Koch’s postulates 12
1.3 Antimicrobial compounds 13
1.3.1 History of early antibiotics 13
1.4 Phenotypic identification 14
1.4.1 Microbial identification 14
1.4.2 Biochemical tests 15
1.4.3 Antibiograms 16
1.4.4 Phage typing 17
1.5 Genotypic identification 17
1.5.1 Deoxyribonucleic acid (DNA) 18
1.5.2 The polymerase chain reaction (PCR) 19
1.5.2.1 Real-time PCR 20
1.5.2.2 The reverse transcription polymerase chain reaction (RT-PCR) 21
1.5.2.3 Multiplex PCR 22
1.5.3 Pulsed-Field Gel Electrophoresis 23
1.6 DNA sequencing 23
1.6.1 Multilocus sequencing typing (MLST) 23
1.6.2 Genome sequencing projects 24
1.6.3 The second revolution: next-generation sequencing 25
1.6.3.1 Bench top instruments 26
1.6.4 The Third Revolution: Single-Molecule Sequencing 27
7
1.6.4.1 PacBio SMRT sequencing 27
1.6.4.2 History of Nanopore Sequencing 28
1.6.4.3 Principles of nanopore sequencing 29
1.6.4.4 Commercialisation of nanopore sequencing 30
1.6.5 Sequencing library preparation methods 31
1.6.5.1 PCR and PCR-free libraries 32
1.6.5.2 Mechanical fragmentation 32
1.6.5.3 Ligation libraries 33
1.6.4.4 Transposase libraries 34
1.6.5.5 Sample barcoding 35
1.7 Comparative genomics 36
1.7.1 Horizontal gene transfer 36
1.7.2 Recombination 37
1.7.3 Plasmids 37
1.7.4 Integrative conjugative elements 38
1.8 Epidemiology 38
1.8.1 History 38
1.8.2 Genomic epidemiology 39
1.9 Bioinfomatics methods 39
1.9.1 Primary analysis 40
1.9.2 Alignment 40
1.9.2.1 Short read aligners 40
1.9.2.2 Querying databases 41
1.9.2.3 Long-read aligners 42
1.9.3 Genome assembly 42
1.9.3.1 Assembly polishing 43
1.9.3.2 Error correction using Illumina data 43
1.9.4 Nanopolish 44
1.9.4.1 Variant calling from nanopore data 45
1.9.5 Variant calling in Illumina data 46
1.8.5.1 Functional annotation of variants 46
1.9.6 Bacterial annotation 47
1.9.7 Tree building 47
1.9.7.1 Tree building from variant calls 47
1.9.7.2 Bayesian phylogenetic inference 48
1.9.7.3 Phylogenetic placement 49

8
1.9.8 Taxonomic classification 50
1.9.8.1 BLAST based classification 50
1.9.8.2 Abundance estimation software 50
1.9.8.3 k-mer based classification 51
1.10 Research aims 52
2. Seeking the source of Pseudomonas aeruginosa infections in a recently opened hospital: an observational study using whole-genome sequencing 52
2.1 Author contributions 53
2.2 Author contributions (additional detail) 53
2.3 Abstract 53
2.4 Published manuscript 54
3 Rapid draft sequencing and real-time nanopore sequencing in a hospital outbreak of Salmonella 55
3.1 Author contributions 55
3.2 Author contributions (additional detail) 55
3.3 Abstract 55
3.4 Published manuscript 56
4 Real-time, portable genome sequencing for Ebola surveillance 57
4.1 Author contributions 57
4.2 Author contributions (additional detail) 57
4.3 Abstract 57
4.4 Published manuscript 58
5 Multiplex PCR method for MinION and Illumina sequencing of Zika and other virus genomes directly from clinical samples 59
5.1 Author contributions 59
5.2 Author contributions (additional detail) 59
5.3 Abstract 59
5.4 Published manuscript 60
6 Discussion 61
Technology development 61
Mobile laboratories 65

9
Sequencing methodology 67
Real-time analysis 70
Surveillance sequencing 71
Epidemiological inference 74
Summary 77
References 78

10
1. Introduction
1.1 The discovery of microbes
The first descriptions of microorganisms were made by Antony van Leeuwenhoek in
1676[1]. Using his homemade microscopes, developed for inspecting the quality of
cloth, he observed a menagerie of tiny ‘animalcules’ in samples of lake water and
plaques from his own teeth. He notified the Royal Society, who were initially sceptical,
but commissioned Robert Hooke to build a powerful microscope. Hooke successfully
reproduced a bizarre experiment Leeuwenhoek had conducted to see if black pepper
was covered in points which were responsible for its sharp taste. He mixed ground
pepper with water, and days later he discovered it teeming with microbes. The Royal
Society were convinced and made him a Fellow and the field of microbiology was born.
1.2 The ‘Golden age’ of bacteriology
1.2.1 Pasteurisation
Two hundred years later, Louis Pasteur and Robert Koch ushered in the ‘Golden Age of
Microbiology’. They unravelled many fundamental microbial processes and their
relationship to disease during this period. Pasteur wished to understand the
microbiology of food spoilage organisms. He discovered the process of alcoholic
fermentation by yeast and that contamination by another microorganism could turn wine
into vinegar. He devised his method of heat sterilisation which was later routinely
11
applied to beer and milk[2]. In a famous experiment, he used swan-necked flasks to
show if bacteria could not fall into sterile broth then it would not become contaminated.
This was strong evidence against the popular theory of spontaneous generation[3]
whereby living organisms could arise from inanimate matter.
1.2.3 Discovery of the anthrax bacillus
Robert Koch was a German physician and has been described as the ‘father of medical
microbiology’. Koch built on Pasteur’s work on germ theory in order to confidently
attribute diseases to infection by particular microbial species. While investigating
anthrax deaths in humans and livestock, Koch demonstrated that the disease could be
transferred to healthy animals by inoculating them with blood from diseased animals.
Further, the presence of rod-shaped bacteria in the blood was required for disease
transmission. He went on to demonstrate the role of spores in anthrax lifecycle and how
their presence in contaminated soil could make it infectious for years. He later
discovered the microbes responsible for tuberculosis and cholera.
1.2.4 Koch’s plate technique
Koch demonstrated the utility of culture in medical microbiology through the use of his
plate technique[4]. During his studies on anthrax he noticed that the rods were often
elongated and notched and suspected this related to how the cells reproduced. He
realised that culture needed to take place on solid media to ensure that cultures were
‘pure’ i.e. derived from one starting cell. This led him to develop agar media which
12
bacteria grow well on and stays solid at temperatures needed for incubation. He grew
his cultures in a shallow dish with an overhanging lid to prevent contamination invented
by his assistant Petri.
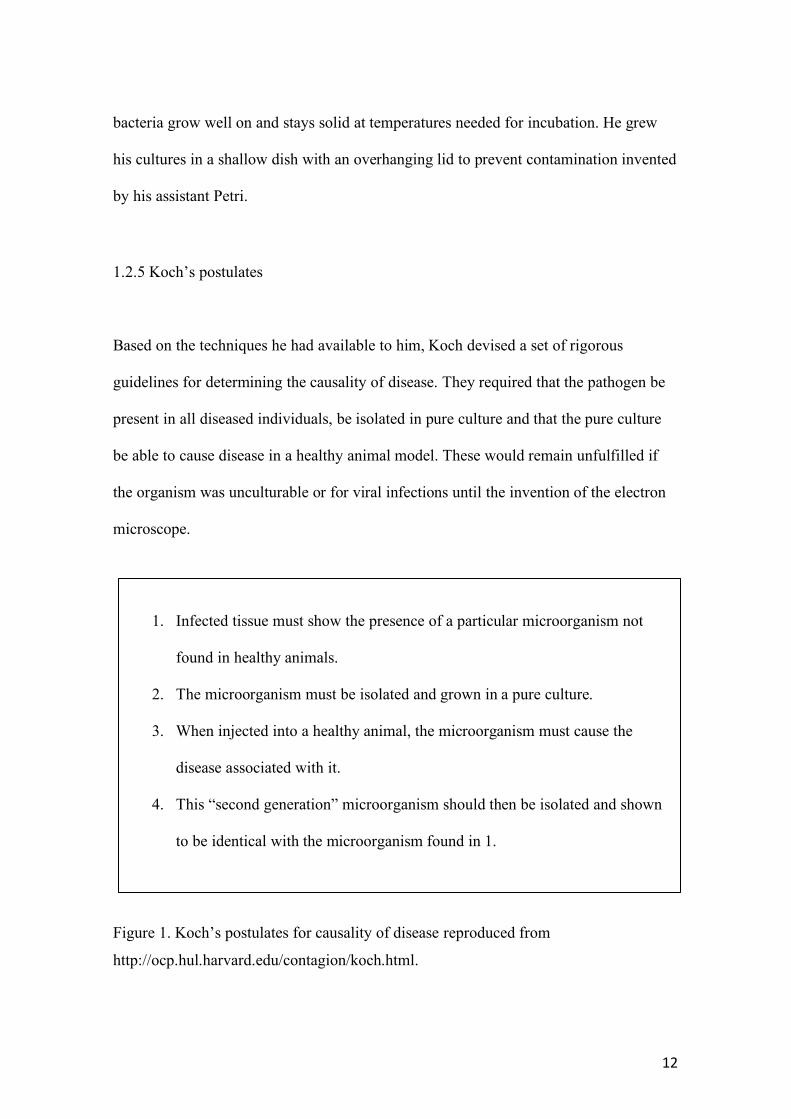
1.2.5 Koch’s postulates
Based on the techniques he had available to him, Koch devised a set of rigorous
guidelines for determining the causality of disease. They required that the pathogen be
present in all diseased individuals, be isolated in pure culture and that the pure culture
be able to cause disease in a healthy animal model. These would remain unfulfilled if
the organism was unculturable or for viral infections until the invention of the electron
microscope.
Figure 1. Koch’s postulates for causality of disease reproduced from
http://ocp.hul.harvard.edu/contagion/koch.html.
1. Infected tissue must show the presence of a particular microorganism not
found in healthy animals.
2. The microorganism must be isolated and grown in a pure culture.
3. When injected into a healthy animal, the microorganism must cause the
disease associated with it.
4. This “second generation” microorganism should then be isolated and shown
to be identical with the microorganism found in 1.
13
1.3 Antimicrobial compounds
1.3.1 History of early antibiotics
The first effective antimicrobial drug was Salvarsan, an arsenic compound synthesised
in Paul Ehrlich’s lab. Ehrlich screened many compounds in the hope of finding a ‘magic
bullet’ that was not fatally toxic to the patient. The search paid off in 1909 when his
assistant Sahachiro Hata showed he could cure a Guinea pig of a spirillum infection
using a compound known as ‘Compound 606’. Subsequent human trials showed it was
an effective treatment for syphilis and proved to have few side effects. Sulphonamides
such as Prontosil introduced in 1932, were the first effective antibiotics that could be
taken orally to treat systemic infections. The compound inhibits bacterial growth by
blocking folic acid synthesis which is required to make nucleic acids. This led to dozens
of related compounds being produced and as the only effective antibiotic available
before penicillin it was used to treat many conditions. A related compound,
Sulfamethoxazole is still in use today usually in the form of co-trimoxazole for treating
urinary tract infections.
Penicillin, one of the most celebrated antibiotics, is an antimicrobial compound
produced by the fungus Penicillium notatum. After returning from holiday
microbiologist Alexander Fleming noticed a mould had contaminated his plates and that
there were no staphylococci colonies growing close to it[5]. He realised that the fungus
was producing a bactericidal substance and showed it was able to kill a number of other
important pathogens. Research into the mass production of penicillin eventually led to

14
the production of 2.3 million doses of penicillin by the end of the World War II.
Penicillin quickly became indispensable and doctors prescribed it for infections of
gonorrhoea, streptococci and staphylococci. Fleming had warned about the dangers of
misuse of penicillin as he has observed bacteria acquire resistance to it in the
laboratory[6], however the use of the miracle drugs grew exponentially. The first
penicillin resistant Staphylococcus aureus were detected as early as 1947[7] and for all
new classes of antibiotics such as aminoglycosides, chloramphenicols and tetracyclines,
resistant strains were detected within a few years of each being used[8].
1.4 Phenotypic identification
1.4.1 Microbial identification
Microbes are classified using phenotypic properties including cellular morphology,
cellular aggregation and metabolic capability. Morphologies include cocci, bacilli,
filamentous and spirochete forms with cocci being subcategorised by arrangement such
as diplococci and chains. Staining can make bacteria more visible through a
microscope: the most famous being the Gram stain developed by Hans Christian Gram
in 1884[9]. The technique involved a primary stain of crystal violet and counterstain of
safranin which gave a binary classification of most bacteria, depending on the
peptidoglycan content of the cell wall. Many viruses are too small to be seen by a light
microscope they could not be seen until the invention of the transmission electron
microscope in 1935, however the presence of aggregates e.g. Negri bodies in Rabies
infection were used to detect viruses before this.
15
1.4.2 Biochemical tests
Bacteria can be identified via their metabolic functions using a panel of biochemical
tests. For example, the catalase test is used to distinguish Staphylococcus species from
other aerobic cocci. Catalase producers metabolise hydrogen peroxide into water and
oxygen gas which is observed as bubbles. The coagulase test can further identify
Staphylococcus aureus from other Staphylococcus species. The presence of coagulase
mean fibrinogen is converted to insoluble fibrin which turns the liquid solid. These tests
are very common in clinical microbiology labs as they are quick and relatively simple.
They are commonly automated on machines performing many tests simultaneously on
cards such as in the bioMérieux VITEK 2 which can perform automated identification
and susceptibility testing.

16
Figure 2. Reproduced from http://step1.medbullets.com/microbiology/104192/gram-
positive-bacteria showing how you would identify Gram-positive bacteria such as
Staphylococcus aureus using phenotypic methods.
1.4.3 Antibiograms
Bacterial antibiotic susceptibility testing is typically performed using the disc diffusion
method. A disc containing a known concentration of antibiotic is added to a Petri dish
of growing bacteria. The bacteria will grow until they become inhibited by the antibiotic
diffusing from the disc. The size of the inhibition zone indicates effectiveness of the
antibiotic at inhibiting bacterial growth. The assay allows multiple antibiotics or
concentrations to be tested on the same plate. Antibiotic sensitivity testing is primarily

17
used for prescribing an effective antibiotic to treat an infection but as patterns in
antibiotic sensitivity vary greatly even within a species, patterns of sensitivity or
resistance can be used as evidence in epidemiological investigations.
1.4.4 Phage typing
Phage typing uses panels of bacteriophages to discriminate between bacterial strains. A
grid is drawn on a plate and different bacteriophage are added to each region.
Bacteriophage are highly diverse yet have a narrow host range as they can only infect
bacteria with receptors to which they can bind. The pattern of lysis by different
bacteriophages provides the phage typing profile. If two isolates produce the same
phage pattern that is used as evidence that they are closely-related strains.
1.5 Genotypic identification
Combinations of phenotypic tests have defined the classical microbial taxonomy used in
clinical microbiology today. However, phenotypic tests suffer from numerous
limitations; they rely on culture so are difficult for slow growing or fastidious organisms
e.g. Mycobacterium tuberculosis, multiple tests are required to identify each organism
and the interpretation of test results can be very subjective[10]. Therefore genotypic
tests relying on molecular methods such as the polymerase chain reaction and
deoxyribonucleic acid sequencing are gradually replacing phenotypic methods.

18
1.5.1 Deoxyribonucleic acid (DNA)
DNA and ribonucleic acid (RNA) are polymers made up of nucleobases that store
genetic information and are essential to all known life. In 1928, Frederick Griffiths
performed an experiment demonstrating that an unidentified transforming principle
could induce a change from non-capsular to capsular in Streptococcus pneumoniae[11].
The first demonstration that the transforming principle was DNA came from Avery-
MacLeod-McCarty experiment in 1944[12]. At the time it was widely assumed that the
heritable material would be protein but Avery and colleagues managed to carefully
separate DNA from the rest of the cellular components and show that it alone possessed
transformative capability. Later, further confirmation that DNA is the transforming
substance came in 1952 from Hersey and Chase[13] in an elegant experiment where
they labelled T2 phage with radioactive isotopes of either phosphorus or sulphur. The
progeny of these phages contained radioactive phorphorus but not radioactive sulphur
proving that the genetic material was DNA not protein. The structure of DNA and
model for semi-conservative replication was proposed by Crick and Watson in 1953[14]
by formulating a model that fitted known chemical properties of nucleic acid and
interpretation of a X-ray diffraction photo taken by Rosalind Franklin. Crick later
published the ‘central dogma of molecular biology’[15] which stated that genetic
information flowed from DNA to RNA to protein in general transfers as well as other
information flows such as RNA to DNA in special circumstances. Critically, however,
once genetic information is encoded in proteins, it cannot transfer back again.

19
1.5.2 The polymerase chain reaction (PCR)
PCR is a system for the amplification of DNA targets using short oligonucleotide
primers. It was a developed by Kary Mullis while working at Cetus Corporation who
were developing a diagnostic assay for sickle cell anaemia[16]. Mullis realised that he
could modify existing polymerase extension methods by adding a reverse primer on the
opposite strand to achieve exponential amplification of a target region. The technique
has revolutionised the detection of genetic mutations, the diagnosis of infectious
disease, forensics and research. The components of the reaction are DNA template,
forward and reverse primers, thermostable polymerase and deoxynucleotide
triphosphates (dNTPs). Products of PCR are usually visualised using agarose gel
electrophoresis, a technique used to separate DNA molecules by size; visualising a band
on a gel of the expected size is indicative of a positive PCR.

20
Figure 3. Reproduced from http://www.discoverbiotech.com/wiki/-
/wiki/Main/Polymerase+Chain+Reaction showing the first 3 cycles of a PCR reaction.
Cycling the temperature between 95°C for denaturation, 50-65°C for annealing and
72°C generates two copies for each one in the previous cycle.
1.5.2.1 Real-time PCR
Real-time PCR combines a PCR with a fluorescent reporter to monitor the process of
amplification. Such an approach removes the need to analyse products on a gel and
provides more accurate quantification. There are two common methods of detection of
PCR products, the first method uses an intercalating dye such as ethidium bromide
which binds non-specifically to double stranded DNA meaning the fluorescence is
proportional to the mass of DNA in the reaction. The second method uses a probe with a

21
fluorescent reporter at the 5' end and a quencher at the 3' end. This binds within the
target and is cleaved by the exonuclease activity of the polymerase during extension.
Once it is no longer in close proximity to the quencher, the dye fluoresces. The
advantage of this system is that non-specific products such as primer dimer do not
contribute to the fluorescence. Multiple dyes with different emission wavelengths can
be multiplexed in the same reaction as long as the wavelength is supported by the qPCR
instrument.
1.5.2.2 The reverse transcription polymerase chain reaction (RT-PCR)
RT-PCR a variant of PCR which enables amplification from an RNA template by
incorporating a reverse transcription step at the start to generate cDNA. Standard PCR
is then used to amplify a target from the cDNA. Reverse transcription in the 3' to 5'
direction can be primed either using a specific primer such as oligo(dT) for poly(A)
tailed mRNA or a random hexamer primer. If using a specific primer, reverse
transcription and PCR can be performed in a single reaction known as one-step RT-
PCR, or RT-qPCR if quantitative. This method is common in diagnostic assays for viral
infections as it involves fewer pipetting steps which reduces the chance of
contamination. Using the fluorescence data collected during the run software will
determine the cycle threshold (Ct) value, which is the cycle that the fluorescence
increased above baseline. This value is inversely related to the copy number of the
target in the starting sample.

22
Figure 4. Reproduced from https://bitesizebio.com/24581/what-is-a-ct-value/ showing a
simulated amplification qPCR curve, Ct value is the cycle where the fluorescence curve
intersects the threshold based on the background fluorescence. Amplification curves are
sigmoidal as they are exponential in early cycles then plateau as the reagents are
depleted.
1.5.2.3 Multiplex PCR
Multiplex PCR is the process of amplifying multiple targets in a single reaction by the
inclusion of primers for more than one target. This could be in order to multiplex targets
in the same qPCR assay, each with its own detection channel or for generating a pool of
amplicons for sequencing with next-generation sequencing. Mixed pools of amplicons
must be sequenced because only products of different lengths can be differentiated on a
gel. This is also true of single genes amplified from mixed populations such as with
barcode sequencing like the bacterial small ribosomal subunit 16S or mitochondrial
CO1.

23
1.5.3 Pulsed-Field Gel Electrophoresis
Pulsed-Field Gel Electrophoresis (PFGE) is a typing method in which the restriction
digest patterns of different bacterial strains are compared. Genomic DNA is digested
using a restriction endonuclease and the products are run by gel electrophoresis. It is not
easy to separate molecules above 40 kb with a constant electrical field. In order to
resolve fragments larger than this a pulsed-field system is required. Fragments up to
several megabases in size can be resolved by pulsed-field by switching the direction of
the electrical field which means molecules can zigzag through the gel. This works
because it takes longer for large molecules to reorient in a fluctuating field which means
they travel slower for a given set of switching conditions[17].
1.6 DNA sequencing
DNA sequencing by the incorporation of chain-terminating di-deoxynucleotide
triphosphates (ddNTP’s) was invented by Fred Sanger in 1977[18]. He found that by
including a certain ratio of each ddNTP in four separate reactions, then performing a
template extension by DNA polymerase he could read the sequence by gel
electrophoresis of each reaction. This technology was used to sequence one the first
complete genomes, of bacteriophage λ, earning Sanger his second Nobel prize.
1.6.1 Multilocus sequencing typing (MLST)

24
The development of the polymerase-chain reaction (PCR) and Sanger sequencing led to
the adoption of sequence-based typing methods. One of the most popular techniques is
MLST in which sequence variation is determined in multiple (usually seven or eight)
‘house-keeping’ genes. 450-500 bp fragments are amplified by PCR and sequenced[19].
The sequences at these loci are compared against those already in one of two databases
(mlst.net/ and pubmlst.org/) to see if the allele has already been assigned a number. If
the allele is novel a new number will be assigned centrally after verification. The set of
alleles numbers is known as the allelic profile or the sequence type which are also
curated in the database. MLST involves sequencing PCR products which makes it more
reliable than PFGE which relies on laborious agarose plug extractions taking several
days. It has represented a ‘gold standard’ in sequence typing for many years and a well-
designed scheme can provide good clustering however for genetically monomorphic
species such as M. tuberculosis it can lack discriminatory power[20]. Today sequence
types are still widely used however due to the continued decline in the cost of next-
generation sequencing (see 1.6.3) alleles are usually extracted from data generated using
shotgun sequencing (1.6.2) often referred to as in silico sequence typing[21].
1.6.2 Genome sequencing projects
With the introduction of automated Sanger sequencing instruments in 1987, the
sequencing of larger genomes became conceivable. Consortia were set up to sequence
bacterial model species such as Escherichia coli and Bacillus subtilis. The Human
Genome Project (HGP) was set up in 1990 with the even bigger ambition of sequencing
the human genome. They planned to do this by the top-down method, firstly using

25
traditional linkage maps, followed by cloning of ordered large fragments of the genome
into bacterial artificial chromosomes (BACs). These BACs were then fragmented and
then assembled individually, before being combined into a larger whole-genome
assembly. In 1995 Craig Venter stunned the world with the announcement that his team
had sequenced the first bacterial genome, Haemophilus influenzae in just twelve
months[22] using a pure whole-genome shotgun technique that bypassed the need to
produce physical maps or BACs. A few months later they published the genome of
Mycoplasma genitalium[23] the smallest known genome of any free-living organism.
More complex genomes followed with Saccharomyces cerevisiae (12 Mb) in 1996 and
Caenorhabditis elegans (100 Mb) in 1998 from other groups using the direct shotgun
method. At the time it was not thought that the whole-genome shotgun method alone
would be sufficient for large complex genomes such as human. However, by combining
it with mate-pair and state of the art assembly software the private Celera corporation
assembled Drosophila melanogaster (175 Mb) in 2000 and human (3.12 Gb) in 2001.
Both the HGP and Celera simultaneously published manuscripts outlining drafts of the
human genome assembly in Nature and Science respectively[24, 25]. The scale and
complexity of these genome sequencing projects led to the rapid growth of very large
specialist industrial-scale genome sequencing centres such as the Sanger Institute.
1.6.3 The second revolution: next-generation sequencing
The introduction of next-generation sequencing (NGS) using massively parallel
sequencing dramatically reduced the cost of sequencing whole genomes. The launch of
the 454 GS20 in 2005[26] was swiftly followed by the Solexa Genome Anayzer in

26
2006[27], both using a sequencing-by-synthesis (SBS) approach i.e. detecting single
base incorporations by DNA polymerase into a growing population of clonal DNA
clusters. The chemistry system used by 454 uses emulsion PCR to amplify library
molecules on beads inside droplet reaction chambers. The sequence is determined by a
microfluidic version of the existing pyrosequencing method in which a cocktail of three
enzymes generate a detectable light signal: DNA polymerase which incorporates a
dNTP releasing pyrophosphate, ATP sulfurylase which converts pyrophosphate to ATP
and firefly luciferase which consumes ATP to produce light. In this system the intensity
of light is approximately proportional to the number of bases incorporated at a given
step. The Solexa chemistry by contrast uses a ‘reversible terminator’ chemistry with
each base having a different fluorescent label. Bases are incorporated one at a time, but
can be unblocked chemically to permit the next cycle of chemistry to proceed. A light
source and a camera is used to read the most recently incorporated nucleotide’s
fluorescent tag. Solexa was bought by Illumina in 2007 who have developed the SBS
chemistry to increase read lengths to up to 300 bp and run throughput to up to 6
terabases (6x10¹² bases). The scalability proved decisive and in 2016 the 454 platform
was withdrawn from sale due to uncompetitive running costs.
1.6.3.1 Bench top instruments
The Illumina MiSeq, released in the autumn of 2011, was one of a new breed of
‘benchtop’ sequencers and has become heavily used for viral and bacterial whole-
genome sequencing[28]. Users are able to generate sufficient data to sequence up to 96
bacterial genomes in 2-3 days for around $100 per sample. This meant universities and
27
public health laboratories, by running their own instrument instead of utilising academic
genome facilities, could dramatically reduce the time taken to generate results. This
facilitated the adoption of sequencing in cost restricted environments such as the UK’s
National Health Service for performing bacterial typing, antibiotic susceptibility
prediction and surveillance sequencing in a single assay[29].
1.6.4 The Third Revolution: Single-Molecule Sequencing
1.6.4.1 PacBio SMRT sequencing
The Sequel and RSII instruments sold by Pacific Biosystems (PacBio) use Single
Molecule Real-Time sequencing (SMRT) sequencing to detect incorporation of
fluorescently labelled bases by a polymerase in real-time. Sequencing reactions take
place in zero mode waveguides (ZMWs) each too narrow for light to propagate into.
The ZMWs each house an immobilised template-polymerase complex in the illuminated
region at the bottom. Phospholinked nucleotides are present in the reaction chamber but
only those being incorporated by the polymerase are in the excitation zone long enough
to be detected, observed as flashes of light. As the fluorophore on the phosphate chain is
cleaved off by the polymerase during incorporation and the fluorophore diffuses away.
A movie is recorded then later analysed to determine the sequence of each temple.
Although a sequencing-by-synthesis approach, modifications such as methylation can
be inferred from their effect on the enzyme kinetics, relying on the observation that
modified bases typically are slower to incorporate than unmodified bases[30].
28
1.6.4.2 History of Nanopore Sequencing
The concept for using nanopores to sequence DNA molecules directly was first devised
by David Deamer in 1989[31], yet it has taken 25 years to overcome the many technical
hurdles to develop the first commercial system. The first experimental evidence that the
system could be used to sequence nucleic acids was produced in 1996 when
Kasianowicz et al., who had been working closely with Deamer, detected translocations
of RNA homopolymers through an ⍺-hemolysin pore[32]. As the technical details were
fleshed out it became apparent that the translocation speed through he sensing region
was on the order of 1-10 µs per nucleotide, even at low bias voltages. A way of
ratcheting the DNA through the pore at slower speed was needed. After some mixed
results using different classes of DNA polymerase, Mark Akeson discovered that phi29
polymerase could be coupled to protein nanopores to ratchet DNA through the pore at
2.5-40 nucleotides per second at single nucleotide resolution[33]. Crucially the enzyme
could also be nanopore activated i.e. did not polymerise in the cis compartment when a
negative bias voltage was applied.

29
Figure 5. Reproduced from[34]. (a) ssDNA translocating through the nanopore with
phi29 DNA polymerase acting as a ratchet. Panels (b-d) show different types of pores
that have been used to detect DNA.
1.6.4.3 Principles of nanopore sequencing
The key feature of a nanopore sequencing system is the nanoscale pore which is
inserted into a membrane, traditionally a lipid bilayer. Either side of the membrane, the
cis and trans compartments, are filled with ionic solutions. When a bias voltage is
applied across the membrane, ions flowing through the pore produce an electrical
current which can be detected using a sensitive ammeter. Negatively charged DNA
molecules, when added to the cis compartment, are driven electrophoretically through

30
the pore. The disruption to the ionic current by the mass and electrical field of the bases
in the pore cause a shift in the measured current. High-frequency sampling of the
current as a DNA molecule is ratcheted through the pore generates an electrical current
trace measured in pico-amps. The DNA sequence can be deduced by comparing the
current trace to ones trained on known sequences. The ratchet enzyme slows down the
translocation orders of magnitude allowing each base to remain in the pore long enough
to detect it.
1.6.4.4 Commercialisation of nanopore sequencing
In June 2014, the MinION developed by Oxford Nanopore Technologies (ONT)
became the first nanopore sequencing device to market. MinION was brought to market
with a ‘Gillette’ cost model; low instrument price and profits generated on sales of
disposable flowcells. It represented a significant departure from all instruments before
it being only the size of a USB dongle and drawing power from a laptop computer. The
flowcell itself contains up to 2048 individual nanopores with a 4:1 multiplexer allowing
data collection from 512 simultaneously using the MinKNOW control software, also
developed by the company. The system was launched using an undisclosed protein
pore. In March 2016, ONT announced that future products would utilise mutants of
CsgG pore a lipoprotein from E. coli now known as ‘R9’
(https://nanoporetech.com/events/no-thanks-ive-already-got-one). The system employed
a DNA helicase to act as the ratcheting ‘motor’ protein. The helicase is bound to the
sequencing adapter but held in situ on a stretch of the adapter until activated by the
electrophoretic force as it enters the pore. Another important innovation was the
31
inclusion of a cholesterol group which tethers the library onto the membrane. This
produced a thousand times increase in sensitivity with respect to bulk phase sampling.
The current traces (known as ‘raw signal’) are written into HDF5 format ‘FAST5’ files
by the data collection software MinKNOW[35]. Basecalling is performed directly from
raw using software called Albacore. Albacore is a neural network type basecaller using
a model trained on E. coli, S. cerevisiae and human data. Homopolymers translocating
do not result in current shift, but a type of neural network known as a transducer
network is used which is capable of estimating the length of a homopolymer from the
dwell time improving the accuracy of these basecalls
(https://github.com/nanoporetech/scrappie).
1.6.5 Sequencing library preparation methods
Sequencing libraries for next-generation sequencing consist of a pool of fragments
which could contain anything from one to trillions of unique molecules. It is in this
regard where next-generation technologies fundamentally differ from Sanger
sequencing and where the term massively-parallel sequencing originates from. Instead
of generating copies of the template using cloning or PCR, amplification takes place on
beads or attached to a surface forming a ‘colony’. This enables sequencing reactions to
take place as a two-dimensional array of features facilitating detection. Generating
libraries usually consists of taking some fragments of DNA or RNA and adding
adapters onto the ends making them compatible with the sequencing chemistry.

32
1.6.5.1 PCR and PCR-free libraries
Most types of NGS library preparation involve ligation of adapters for PCR
amplification or sequencing. PCR amplified libraries suffer from GC bias, where GC
rich or poor fragments are underrepresented in the library as a result of inefficient
amplification. PCR-free libraries can be made with higher input however this does not
fully alleviate the issue as 454 and Illumina sequencing require amplification for colony
generation. By contrast, single molecule sequencing technologies do not require
amplification and therefore should be immune to GC bias. Paradoxically, despite
sensing single molecules they require extremely high amounts of input DNA. A typical
Illumina or Oxford Nanopore PCR-free library requires 1 µg input material. The use of
gel-based size-selection increases DNA input further due to sample losses. For PCR
libraries Illumina Nextera XT libraries can be generated from as little as 1 ng using 12
cycles of PCR. Generating PCR-free libraries is not practical for all sample types e.g.
low biomass samples so library preparation methods for a variety of inputs are required.
1.6.5.2 Mechanical fragmentation
Genomic DNA (gDNA) is fragmented when a specific fragment size distribution is
desired for a sequencing library. That may be a platform-specific decision such as
matching the insert to the read-length in Illumina sequencing (typically 500-1000 bp)
but can also occur when handling especially high-molecular-weight DNA and is usually
unwanted. For Illumina sequencing in which a desirable range might be 100-1500 bp,
fragmentation is often performed using Covaris focused-ultrasonication. For fragments

33
longer than 5000 bp hydrodynamic shearing using a Covaris g-TUBE or needle
shearing gives more consistent results. In this method DNA molecules experience
shearing forces as they pass through a narrow opening resulting in fragmentation.
1.6.5.3 Ligation libraries
In order to ligation adapters to random fragments they must first be end-repaired and
dA-tailed. This is performed using a combination two enzymes, T4 DNA polymerase
and Klenow fragment which remove 3' overhangs and fill in 5' overhangs. dA-tailing is
used to avoid the formation of adapter concatemers during ligation. This adds to the
time required to generate a ligation library. For systems that require colony
amplification different adapters are required on each end of the library construct e.g.
Illumina paired-end sequencing. Using two adapters (A and B) the possible ligation
products also include A-insert-A and B-insert-B which will not amplify which results in
low efficiency. The solution to this was the ‘Y’-adapter introduced by Solexa which
uses a complementary region with two non-complementary regions needed for cluster
amplification. During the first PCR cycle a single short primer generates two
asymmetric products which are then amplified by a tailed long primer and the short
primer. Oxford Nanopore libraries cannot be generated by PCR as the adapters contain
modifications and the motor protein. If PCR amplification is used then adapters will be
added by a separate adapter ligation step after.

34
Figure 6. Reproduced from https://community.nanoporetech.com. This figure illustrates
three common methods for library preparation for Oxford Nanopore sequencing by end-
preparation and adapter ligation (left) or by tagmentation and adapter ligation (right).
1.6.4.4 Transposase libraries
An alternative to mechanical fragmentation is enzymatic fragmentation. This could be
done using endonucleases either specific or non-specific or more desirably using a
transposase enzyme. Transposases are the enzymes that facilitate the movement of
transposons around the genome. They are now widely used in next-generation
sequencing library preparation because they can perform a dual function of fragmenting
and adapting genomic DNA. Transposases are complexed with double stranded adapters
by incubating in the absence of cofactor Mg2+ forming a transpososome, these adapters
will eventually be attached to the ends of the DNA at the cut sites in a process known as
tagmentation. The length of fragments generated by tagmentation will be dependent on

35
the starting fragment size, the mass of DNA and the molarity of transposomes. By
controlling the molarity of transpososomes you can control the molarity of tagmented
fragments and increasing the mass of input DNA will increase the fragment size. These
enzymes are used in both the popular Nextera XT kit (Illumina) utilising a Tn5 mutant
and the Rapid sequencing kit (Oxford Nanopore Technologies) utilising MuA
transposase. By combining fragmentation and adapter attachment these methods are
among the fastest library preparation methods in use and are also compatible with PCR
and barcoding. They are not suitable for amplicon sequencing as they cut in the middle
of fragments resulting in lower coverage of the ends of the amplicon with respect to the
middle.
1.6.5.5 Sample barcoding
Molecular barcoding is used to multiplex many samples into the same flowcell or lane,
this way the barcode can be sequenced in order to separate reads later in a process
known as demultiplexing. Barcodes are short sequences introduced during library
preparation which allow multiple samples to be pooled in a library. They are usually 6
or 8 bases long in Illumina sequencing or 24 bases for Oxford Nanopore due to the
lower basecalling accuracy. They can be introduced either during PCR, by a transposase
or by ligating double stranded oligonucleotides to fragments in PCR-free libraries. Dual
indexing strategies using different barcodes on each end of the molecule allow for large
number of barcode combinations i.e. 96 combinations are achieved using 8 × 12
barcode sequences. Multiplexed sequencing can be used to reduce the cost per sample
when the full output of a flowcell or lanes excessive for a single sample.

36
1.7 Comparative genomics
The success of Sanger shotgun sequencing and then next-generation sequencing
launched the field of comparative microbial genomics. Analysis of the genome of
Mycobacterium leprae, a species adapted to an isolated niche, found it had undergone
extensive genome reduction compared with Mycobacterium tuberculsosis. This was
characterised by accumulation of pseudogenes or the complete deletion of genes no
longer needed for survival[36]. By 1999 there were two genomes available for the same
species[37], Helicobacter pylori. The genomes were found to be quite similar in
structure and gene order. A small percentage of the genes were unique to one strain or
the other, with half of these genes clustered in a hypervariable region of lower %GC
suggesting they could have been acquired by horizontal gene transfer.
1.7.1 Horizontal gene transfer
Horizontal gene transfer is the transfer of genetic material from one organism to
another. In prokaryotes it can occur in three ways; transformation, transduction or
conjugation[38]. Transformation is a natural process by which competent cells bind,
take up and recombine exogenous DNA into its chromosome. Integrated DNA is
usually derived from a closely related organism so occurs by homologous
recombination. Transduction is the process by which DNA is transferred from one cell
to another via a viral vector. This occurs when small pieces of bacterial DNA, either
adjacent to the phage insertion site or from somewhere else in the bacterial genome are
packaged into the phage genome. In what is known as ‘generalised transduction’ a

37
stretch of bacterial DNA is packaged into the viral envelope by accident. If the phage
infects another bacterial cell the DNA can integrate into the hosts genome by
homologous recombination. In the alternative method ‘specialised transduction’
bacterial genes with close proximity to the prophage are included in the excised DNA.
This is then packaged into a new virus, which after infecting another cell may be
integrated into its genome. Conjugation or ‘bacterial sex’ is the exchange of a genetic
material, either a plasmid or transposon via direct cell-to- cell contact.
1.7.2 Recombination
Recombination in prokaryotes can be homologous or non-homologous. Homologous
recombination occurs between closely related organisms due to high sequence
similarity, with the frequency of homologous recombination events falls exponentially
with decreasing sequence identity. Non-homologous recombination can occur between
organisms with no sequence homology as it utilises a double strand break repair system.
As non-homologous recombination events may reduce the likelihood of homologous
recombination they may be serve as speciation ‘seeds’ which lead to diversification
between strains[39].
1.7.3 Plasmids
Plasmids are extrachromosomal replicons (replicative unit), that are inherited by
daughter cells during cell division and are also capable of horizontal transfer into other
species or genera. They typically vary in size from a few kilobases to hundreds of

38
kilobases and are found throughout the bacterial and archaeal kingdoms. Plasmids may
carry genes (‘cargo’) that may confer a selective advantage such as resistance to a
particular antibiotic. Some may not have any useful function yet are maintained by
‘addiction systems’ such as toxin-antitoxin system in which a plasmid encodes both a
toxin and an antitoxin, meaning the bacterium will be killed by the toxin if the plasmid
if lost.
1.7.4 Integrative conjugative elements
Integrative conjugative elements (ICE) are similar to conjugative plasmids however
they lack an origin of replication and the genes required to make the conjugation
machinery, they have to therefore integrate into a chromosome or plasmid in order to
persist. The advantage of this is they can integrate into a broader range of hosts, as they
do not reply on conjugation machinery being compatible with the host
1.8 Epidemiology
1.8.1 History
Epidemiology is the study of patterns of disease within a population. John Snow, known
as the father of modern epidemiology, famously investigated a cholera outbreak in the
Soho district of London in 1854[40]. By talking to local residents and creating a map of
cholera cases he was able to identify a water pump as the source of the outbreak.
Removing the water pump’s handle ended the outbreak. Both Pasteur and Koch also

39
performed important epidemiological research. Pasteur travelled to the south of France
to investigate a disease of silkworms called pébrine in research spanning five years.
Koch travelled to Egypt and India searching for the cholera microbe and made some
important observations about the importance of water in public health.
1.8.2 Genomic epidemiology
Genomic epidemiology is the application of genomic sequencing to the practice of
disease epidemiology. Whole-genome sequencing permits phylogenetic reconstruction
to be performed, providing an additional source of information about the relatedness of
cases. This information has been used to determine the source of the 7th global cholera
pandemic[41]. Originating from the Bay of Bengal analysis shows that it emerged in
three overlapping waves. The emergence of cholera, caused by Vibrio cholerae, in Haiti
after the 2010 earthquake resulted in 4900 deaths. Phylogenetic reconstruction showed
isolates from the Haiti outbreak were most closely related to South Asian strains
suggesting that Cholera had been imported to the island. After international pressure a
UN investigation found those who had drunk contaminated water from the Artibonite
river had become sickened. This added weight to suspicions that a UN peacekeeping
force from Nepal were the most likely source of the outbreak as they had a camp on one
of the river’s tributaries[42].
1.9 Bioinfomatics methods

40
1.9.1 Primary analysis
Tools for primary analysis of sequence data generally fall into two categories;
alignment (reference-based) and de novo assembly (reference-free). An underlying
feature of both of these techniques is decomposition of sequences into k-mers, all
possible substrings of length k contained in a string. Comparison of fixed length strings
is extremely fast. Using shorter k-mers increases the likelihood of finding exact matches
even in the presence of sequencing errors or biological variation. In alignment, k-mers
are used to find alignment seeds whereas in de Brujin graph assembly the graphs are
built from k-mers. Modern taxonomic classifiers use k-mers for fast database lookup so
they are fundamental to bioinformatics analysis.
1.9.2 Alignment
1.9.2.1 Short read aligners
Pairwise alignment is the comparison of two sequences, typically with DNA, RNA or
amino acid alphabets. The first alignment algorithm and foundation for subsequent
techniques was the Needleman-Wunsch algorithm[43]. This is able to find the best
scoring global alignment of two whole sequences. A development of this, the Smith-
Waterman algorithm was able to find the best local alignment i.e. a subsequence of the
whole sequence[44]. Aligners designed for short-reads such as bwa[45], use the
Burrows-Wheeler transform (BWT) of the reference with backward search to find

41
alignments. This technique is very efficient at aligning short reads against a large
reference, such as human and allows mismatches and gapped alignments.
Figure 7. Reproduced from[45]. A Burrows-Wheeler transform of the reference is
generated by taking the input string ‘google’ and generating all possible rotations,
before sorting them lexicographically and taking the last column as the output.
1.9.2.2 Querying databases
As of October 2017 there are over 200M sequences in GenBank
(https://www.ncbi.nlm.nih.gov/genbank/statistics/) and querying them quickly and
accurately is a big challenge. It would be too slow to find the optimal match using
Smith-Waterman so algorithms such as BLAST[46] use a hash table index to hold the
positions of each k-mer (default k=11) subsequence in the query. It then searches the
database for exact matches or ‘seeds’ and extends the highest scoring ones based on a
heuristic method which is less accurate than Smith-Waterman but much faster. An
important feature of BLAST results is the E-value, the statistical significance of the
alignment, the lower the E-value the less likely the match is to have occurred by chance.

42
1.9.2.3 Long-read aligners
Several aligners have been developed for either PacBio or nanopore long reads. They
have typically been slower than their short-read counterparts. The exception to this is
minimap2[47] which has designed for aligning noisy long-reads to large references. The
algorithm uses query minimizers (reduced k-mer representations) as seeds and finds
matches in reference minimizers. Smith-Waterman is used to extend co-linear seeds,
called chains to generate the alignment. This approach is extremely efficient for long-
reads and achieves higher performance in terms of aligned bases per second than short-
read aligners. This is because long-reads are more likely to align uniquely, one of the
main bottle necks in short-read alignment.
1.9.3 Genome assembly
Genome assembly is process of identifying overlaps in reads in order to build longer
sequences. An early assembly method was Overlap-Layout-Consensus devised by Gene
Myers, as utilised by the Celera Assembler. Long reads have many advantages over
short reads for genome assembly such as their ability to span many classes of repeats.
Assemblers for long-reads however need to be able to handle noisy reads, as both
single-molecule platforms PacBio and Oxford Nanopore raw reads with an error rate of
5-20%. Much of this error is random so can be averaged out using increased coverage
resulting in more accurate consensus sequences. This however requires an all-against-all
alignment step which is computationally expensive. In early versions of the PacBio
assembly pipeline HGAP[48], the overlapping step accounted for 95% of the run

43
time[49]. Adam Phillippy used a probabilistic approach called MinHASH which was
originally developed to determine the similarity of web pages to tackle the problem. The
algorithm known as MHAP and associated assembler Canu, which is based on the
Celera assembler achieved 10x performance improvement on smaller genomes and
100x on larger genomes compared to previous methods.
1.9.3.1 Assembly polishing
Long-read assemblers such as Canu[50] will produce contigs with a similar error rate to
the corrected reads used for the overlap-layout consensus. An additional step known as
polishing is needed to correct short insertion, deletion and substitution errors in the
assembly. This is done using a by aligning the original reads back to the contigs and
calculating a consensus sequence. For PacBio assembly, Quiver[48] or Arrow is used
which predicts the most likely consensus base using additional quality information from
the raw reads.
1.9.3.2 Error correction using Illumina data
Provided sufficient coverage, long read-only assemblies will be more contiguous than
either short-read only or hybrid assemblies. This is because hybrid assemblers typically
use long reads for scaffolding (joining) contigs rather than for building them. After
assembly, polishing long-read assemblies can be very accurate, with PacBio able to
generate Q50 bacterial genomes (99.999% accurate). Despite this it is often still
desirable to generate low coverage Illumina data for correcting the residual errors,

44
bringing the assembly up to reference quality. The E. coli K-12 genome is around 4.6
Mb in size meaning a Q50 genome could still contain 45 errors (PacBio) or 1300 errors
(Oxford Nanopore). In both platforms, the majority of the errors will be indels
associated with homopolymeric tracts. These can be corrected by incorporating
Illumina short-reads which have a mean raw read accuracy of Q20 but rarely contain
indel errors. Pilon[51] is a tool able to generate a corrected consensus given a BAM file
of Illumina short-reads aligned to a polished long-read assembly.
1.9.4 Nanopolish
Because Oxford Nanopore data differs significantly from other sequencing technologies
a separate tool, Nanopolish is needed to calculate consensus, variant calling and
methylation detection using the underlying signal. The first stage of the algorithm is to
detect events, a type of partitioning used to represent the electrical current level of a
single k-mer in the pore. The consensus algorithm iteratively proposes alternate
consensus sequences and selects the one that maximises the probability of observing the
events as calculated by a profile HMM. The Nanopolish HMM in consensus mode uses
proposed consensus sequence as the backbone of the HMM with additional states and
transitions to handle missed and split events. The method can produce a consensus
sequence for E. coli that is 99.97% accurate[52] with the residual error mainly
homopolymer associated SNPs or indels, a systematic error mode in nanopore
sequencing data.

45
Figure 8. Reproduced from http://simpsonlab.github.io/2015/04/08/eventalign/ this plot
shows raw samples (black) and events (red) for simulated data. These can vary
dramatically in length due to the imperfect ratcheting causing the event detector to make
errors.
1.9.4.1 Variant calling from nanopore data
In order to perform variant calling, Nanopolish first infers the event to reference
mapping for each base from the alignment of each read to the reference. Following this,
candidate SNPs are detected by finding positions in the alignment with an alternate base
frequency above a defined threshold (typically 20%). It then clusters these into
haplotype groups before testing all possible haplotype combinations before calculating
the likelihood of each using the Nanopolish HMM. Calling haplotypes rather than

46
individual SNPs improves the sensitivity of Nanopolish when calling large number of
variants or using a divergent reference.
1.9.5 Variant calling in Illumina data
Variant calling using Illumina short-reads is a relatively simple procedure due to the
high accuracy, although the shorter reads may predispose aligners to make false
mappings. Reads are first mapped either against a closely related reference genome or
an assembly using an aligner such as BWA[45]. Aligning to a closely related assembly
is preferred because mapping quality and numbers increase. A goal is to be able to
perform ‘forensic-quality’ SNP calling in order to distinguish strains which differ by as
little as a single mutation. When variant calling groups of distantly related strains or
strains without a closely related reference then the choice of reference genome is less
important, but variant calls are limited to the conserved set of ‘core’ genomic regions,
that is the ones shared by all strains. A BAM file for each sample is given to a variant
caller such as VarScan[53] which iterates over the alignment outputting calls to a VCF
file. Typically variant calls are filtered to improve reliability of calls using fixed criteria
based on coverage depth, variant frequency and base or mapping quality.
1.8.5.1 Functional annotation of variants
To predict the effect of variants e.g. SNPs and indels, functional annotation is
performed. The software SnpEff[54] is able to predict effects based on whether a
mutation is; synonymous i.e. results in a codon that produces the same amino acid; non-

47
synonymous i.e. results in a codon that produces a different amino acid; stop gained i.e.
variant causes a new stop codon or frame shift i.e. an indel causes a fame shift. These
can be assigned a severity as a synonymous change will have no phenotypic effect
whereas a frame shift or new stop codon is likely to result in a loss of function of that
protein. Using a VCF file input SnpEff will add predicted functional annotations to the
information column in the VCF file.
1.9.6 Bacterial annotation
Identifying the various features in a bacterial genome is a process known as annotation.
Features annotated may include coding sequences, ribosomal RNA genes and transfer
RNA genes. Prokka[55] is a convenient pipeline which takes an input FASTA file and
uses external tools to identify these features and combines the output into database
compliant standard format. Protein coding sequence detection is performed using
Prodigal[56] to identify coordinates of putative genes by identifying start and stop
codons. These candidate genes are then searched against databases at the protein level
to find an annotation to transfer. It does this in a hierarchical manner from most to least
trustworthy, using the databases UniProt (most), RefSeq and Pfam (least). If no
annotation is found gene will be labelled as hypothetical proteins.
1.9.7 Tree building
1.9.7.1 Tree building from variant calls

48
Tree building software requires an input file of aligned sequences to generate a tree.
This alignment could be a gene, core genome or just variant sites in a genome
depending on the experiment. For basic phylogenetic inference, an approximate
maximum likelihood tree such as that produced by FastTree is usually sufficient.
FastTree starts with a topology produced by neighbour joining[57], a fast algorithm that
uses a distance matrix to iteratively cluster sequences together. It then refines this
topology using heuristics to restrict the search and estimates the rate of evolution for
each site. Confidence in any branches are represented by bootstrap values, repeating the
reconstruction on a subset of the data provides a way to approximate the sampling
distribution which is unknown. Trees stored in Newick format can be visualised using
software such as FigTree.
1.9.7.2 Bayesian phylogenetic inference
Bayesian phylogenetic interference relies on Bayes’ theorem to calculate the posterior
probability given a tree and parameters. In general, the posterior probability of trees
cannot be calculated directly as it involves high-dimensionality space of all possible
parameter values over all possible trees. Software such as BEAST[58] uses Markov
Chain Monte Carlo (MCMC) sampling to perform a random walk over the space. The
number of times the algorithm visits a particular tree is proportional to the likelihood of
that tree given the data. The chain length can be a million iterations long including a
burn-in period which is discarded (10% by default). The algorithm is said to have
converged or run for sufficient iterations when the trace of the posterior probability
looks like a ‘hairy caterpillar’. An important feature of BEAST is that is can use the

49
coalescent model[59] (Figure 9) to estimate demographic function e.g. exponential
growth and evolutionary rate from the tip dates.
Figure 9. Figure reproduced from[60] illustrating the coalescent model. Figure shows
the relationship of individuals samples from a constant population (a) and an
exponentially growing population (b). As you travel back in time the probability of a
coalescence event is inversely proportional to the population at a given time meaning
the population size can be inferred from the pattern of coalescence and sampling events.
1.9.7.3 Phylogenetic placement
Phylogenetic placement is the process of placing a query sequence onto a reference
guide tree without having to build a new tree each time. This is useful in situations
where a) you need the result very quickly or b) have so many sequences that doing a full
reconstruction is impractical. Pplacer[61] can place queries using either maximum-
likelihood or Bayesian mode. In maximum-likelihood mode the software evaluates the
maximum-likelihood values across all placement locations. In Bayesian mode the

50
software evaluates the posterior probability of the new sequence being on an edge given
the reference tree topology and branch lengths. As the reference tree is fixed the
posterior probability can be calculated directly without the need for the MCMC
sampling used in BEAST. Query sequences are treated independently so placement can
be parallelised across processors.
1.9.8 Taxonomic classification
1.9.8.1 BLAST based classification
BLAST can be used to classify sequences from metagenomic datasets by finding the
best aligning in a database of sequences such as the NCBI non-redundant database (nr).
Despite being able to handle large reference databases it still takes a substantial amount
of time to process several million short reads generated by a single Illumina MiSeq run.
MEGAN[62] uses BLAST results but improves accuracy with short reads by
implementing a lowest common ancestor (LCA) assignment algorithm. This assigns the
lowest node that has all the hits as descendants based on NCBI taxonomy, meaning
species specific sequences are assigned near the leaves and conserved sequences are
assigned near the root of the tree. You can also use MEGAN to visualise the
composition of the community and generate trees and abundance statistics at different
taxonomic levels.
1.9.8.2 Abundance estimation software

51
Abundance estimation is general name given to classification software which achieves
higher performance by using a reduced database which has been selected to contain
marker sequences that identify microbial clades at species level or higher taxonomic
levels e.g. MetaPhlAn[63]. Due to the reduced size database they only classify a small
proportion of the dataset resulting in a relative abundance of organisms in a sample
rather than a classification of every read. They are so much faster than BLAST based
approaches they can scale to terabases of short read data e.g MetaPhlAn was used to
classify 17 million reads from the combined Human Microbiome Project (HMP)[64]
and Metagenomics of the Human Intestinal Tract (MetaHIT)[65] datasets,
demonstrating the first practical large-scale analysis of metagenomic datasets.
1.9.8.3 k-mer based classification
Kraken[66] uses an alternative approach for taxonomic assignment of reads from
metagenomics samples. It maintains the LCA algorithm of MEGAN but uses exact k-
mer matching instead of inexact alignment which allows it to be significantly faster
even than abundance based methods. It uses a database of k-mers and the LCA of all
organisms whose genomes contain that k-mer, which can be built for any user-specified
sequences but is also supplied with a default database MiniKraken DB built using k=31
from 2,256 complete genomes downloaded from RefSeq. More recently the idea has
been extended via the software Centrifuge[67] which incorporates an FM-index which
is able to efficiently do exact matching of k-mers of any length rather than a fixed value
of k. Starting at the end of the query Centrifuge finds exact matches of k=16 and
increases k until it reaches a mismatch. Centrifuge will also output multiple
52
classifications per read, 5 by default. If there are greater than 5 high scoring
assignments it takes the LCA of the largest group recursively, until the number of
assignments to 5 or less.
1.10 Research aims
This work aims to further the field of genomic surveillance by introducing faster,
cheaper and more portable methods for pathogen sequencing. Genomic surveillance
using whole-genome sequencing has unparalleled resolution as a typing and
epidemiological tool. Current short-read technologies require specialist facilities to
perform sample preparation, sequencing and analysis, which can take weeks to perform.
The introduction of nanopore sequencing in 2014 promised that it could be used to
perform real-time, portable sequencing but it would require the development of sample
preparation methods and analysis tools tailored to the low throughput and accuracy of
the MinION. In this work we sought to develop and integrate new methods for sample
preparation, sequencing and analysis to tackle viral outbreaks in the field where data
could be made available immediately enabling more effective interventions to be made.

53
2. Seeking the source of Pseudomonas aeruginosa infections in a
recently opened hospital: an observational study using whole-
genome sequencing
2.1 Author contributions
NC, CC and JQ did sequencing. JQ, NC, CMT and NJL analysed the data. NJL, NC,
JQ, MJP and BO wrote the paper. All authors commented on the manuscript draft.
2.2 Author contributions (additional detail)
JQ produced the global phylogeny, the phylogenetic analysis, the sequence typing and
the temporal/spatial analysis. JQ performed the metagenomics sequencing, taxonomic
classification and genotyping analysis. JQ drafted all figures and assisted in writing the
manuscript.
2.3 Abstract
Pseudomonas aeruginosa is an important opportunistic pathogen and a significant cause
of morbidity and mortality. Burns patients are particularly at risk of infection due to the
breakdown of the skin barrier. In this study patients admitted to hospital with severe
burns had their wounds and hospital environment including the water outlets screened
54
for Pseudomonas aeruginosa. Whole-genome sequencing of 141 isolates from the study
revealed frequent recovery of a single lineage we call ‘Clade E’ which is ST395 a
known water associated clone. Five patients became colonised during the study period
and in two cases the isolates recovered from the wound were indistinguishable from
isolates recovered from water outlets from the room they were treated in. Using a near-
complete reference genome generated for this clade we performed forensic level SNP
calling which revealed micro diversity between outlets demonstrated the power of
surveillance sequencing of environmental isolates as a way source tracking
Pseudomonas aeruginosa infections in a hospital environment. In one case a
thermostatic mixer value was removed for remedial work and we performed
metagenomic sequencing of the biofilm removed from the valve. Using a phylogenetic
placement method we found the genotypes recovered clustered with isolates from the
outlets in room 9 the location it had been removed from.
2.4 Published manuscript
Seeking the source of Pseudomonasaeruginosa infections in a recentlyopened hospital: an observational studyusing whole-genome sequencing
Joshua Quick,1,2 Nicola Cumley,2 Christopher M Wearn,2,3 Marc Niebel,2
Chrystala Constantinidou,4 Chris M Thomas,1 Mark J Pallen,4 Naiem S Moiemen,2,3
Amy Bamford,2,3 Beryl Oppenheim,2 Nicholas J Loman1
To cite: Quick J, Cumley N,Wearn CM, et al. Seeking thesource of Pseudomonasaeruginosa infections in arecently opened hospital: anobservational study usingwhole-genome sequencing.BMJ Open 2014;4:e006278.doi:10.1136/bmjopen-2014-006278
▸ Prepublication history andadditional material isavailable. To view please visitthe journal (http://dx.doi.org/10.1136/bmjopen-2014-006278).
JQ and NC contributedequally.
Received 1 August 2014Revised 16 September 2014Accepted 26 September 2014
For numbered affiliations seeend of article.
Correspondence toDr Nicholas James Loman;
or Dr Beryl Oppenheim;
ABSTRACTObjectives: Pseudomonas aeruginosa is a commonnosocomial pathogen responsible for significantmorbidity and mortality internationally. Patients maybecome colonised or infected with P. aeruginosa afterexposure to contaminated sources within the hospitalenvironment. The aim of this study was to determinewhether whole-genome sequencing (WGS) can beused to determine the source in a cohort of burnspatients at high risk of P. aeruginosa acquisition.Study design: An observational prospective cohortstudy.Setting: Burns care ward and critical care ward inthe UK.Participants: Patients with >7% total burns bysurface area were recruited into the study.Methods: All patients were screened for P. aeruginosaon admission and samples taken from their immediateenvironment, including water. Screening patients whosubsequently developed a positive P. aeruginosamicrobiology result were subject to enhancedenvironmental surveillance. All isolates of P. aeruginosawere genome sequenced. Sequence analysis looked atsimilarity and relatedness between isolates.Results: WGS for 141 P. aeruginosa isolates wereobtained from patients, hospital water and the wardenvironment. Phylogenetic analysis revealed eightdistinct clades, with a single clade representing themajority of environmental isolates in the burns unit.Isolates from three patients had identical genotypescompared with water isolates from the same room.There was clear clustering of water isolates by roomand outlet, allowing the source of acquisitions to beunambiguously identified. Whole-genome shotgunsequencing of biofilm DNA extracted from athermostatic mixer valve revealed this was the sourceof a P. aeruginosa subpopulation previously detectedin water. In the remaining two cases there was no clearlink to the hospital environment.Conclusions: This study reveals that WGS can beused for source tracking of P. aeruginosa in a hospitalsetting, and that acquisitions can be traced to aspecific source within a hospital ward.
INTRODUCTIONPseudomonas aeruginosa is a ubiquitousGram-negative bacterium and an importantopportunistic pathogen in the healthcaresetting. P. aeruginosa particularly affects thosewith impaired host or mucosal immunity andhas a broad range of presentations includingrespiratory infections in cystic fibrosis andmechanically ventilated patients, bloodstreaminfections in premature neonates and woundsin burns injuries. Nosocomial P. aeruginosaoutbreaks are frequently reported and asso-ciated with water sources such as taps,showers, mixer valves and flow straighteners,sink traps and drains.1–10 Other potentialroutes of transmission include cross-infection,for example, carriage on the hands of health-care workers, and through contaminatedmedical equipment such as endoscopicdevices.3 5
In the UK, the role of water in the trans-mission of P. aeruginosa in healthcare settingshas become a matter of urgent concern inresponse to a recent high-profile outbreak
Strengths and limitations of this study
▪ We have demonstrated that whole-genomesequencing can be used for source tracking ofPseudomonas aeruginosa in a hospital setting.
▪ We show convincing evidence that transmissionhas occurred directly from water to patients, butother routes are as likely.
▪ The main limitation of the study was the samplesize, which could be attributable to interventionsbeing carried out during the study.
▪ Our study focused on a burns unit and criticalcare unit in a newly built hospital. Modes ofP. aeruginosa transmission may be different inhospitals with different styles of plumbing andon other augmented care units.
Quick J, et al. BMJ Open 2014;4:e006278. doi:10.1136/bmjopen-2014-006278 1
Open Access Research
group.bmj.com on November 20, 2014 - Published by http://bmjopen.bmj.com/Downloaded from

affecting a neonatal critical care unit in Belfast in2012.11 This source was eventually determined to be sinktaps.11–13 National guidance is now in place detailingenhanced procedures for routine water sampling onaugmented care units, with directed interventions suchas disinfection and replacement of high-risk plumbingparts required.14
Historical phenotypic typing methods for P. aeruginosasuch as O-antigen serotyping have more recently beenreplaced by molecular typing methods such as pulsed-field gel electrophoresis (PFGE), variable numbertandem repeat analysis, random amplification of poly-morphic DNA and multilocus sequencing typing(MLST).15 These methods have been used to investigateoutbreaks of P. aeruginosa within hospitals.4 16–18
However, such techniques have important limitations forsource tracking of infections in hospitals as they samplelimited numbers of sites in the genome which mayresult in false clustering of unrelated strains.19 In thepast 5 years, whole-genome sequencing (WGS) hasstarted to be used to investigate outbreaks in hospitals.WGS is attractive because of its digital, sharable formatand ultra-high resolution, which is able to discriminatetwo isolates differing by just a single mutation. WGS hasbeen successfully used to determine likely transmissionchains during outbreaks of Staphylococcus aureus,Acinetobacter baumannii and Klebsiella pneumoniae.19–21
Benchtop sequencing instruments now offer a cost-effective approach for bringing bacterial WGS to theclinical environment.22
In this study, we explore the utility of WGS to deter-mine the likely sources of P. aeruginosa in an at-riskpopulation of burns patients. In the UK and US burnspatients receive shower cart hydrotherapy as a mainstayof burns treatment.23–26 A previous hospital audit sug-gested that up to one-third of such patients becamecolonised with P. aeruginosa. We hypothesised that thishigh rate of acquisition may relate to transmission fromhospital shower water during therapy. We thereforewished to understand the importance of transmissionfrom water compared with alternative routes such ascross-infection and endogenous carriage.
MATERIALS AND METHODSHospital settingAn observational, prospective study design was employedin a burns centre serving approximately 13.7 millionpeople across the Midlands region of England with 300admissions annually. Opened in June 2010, the burnscentre comprises a purpose built 15-bed ward with 11side-rooms and 2 dual-bedded rooms. Patients requiringmechanical ventilation and organ support are usuallytreated in two self-contained burns cubicles locatedwithin the trauma critical care unit. Despite the observa-tional nature of the study, sampling was carried outduring implementation of interim national guidance oncontrol of P. aeruginosa issued by the Department of
Health. These guidelines were issued in draft formMarch 2012, and subsequently revised in March 2013.This meant that parallel water sampling and engineeringinterventions were being undertaken during the periodof study. In addition, some enhanced infection preven-tion measures were also introduced in response to anoutbreak of a multidrug-resistant A. baumannii.
Study design and patient selectionPatients admitted to the burns unit were eligible for thescreening phase of the study if they had burns injuriescovering greater than 7% total body surface area(TBSA). Patients were screened as soon as possible afteradmission after they had given written informedconsent. When appropriate, legal consultee advice wassought for patients lacking capacity due to emergencytreatment. On admission, recruited patients werescreened for carriage of P. aeruginosa (wounds, urineand stool) using standard microbiology techniques.Samples were then taken as part of routine microbiologyservice during the patients stay. Environmental andwater samples were taken after the patient was admittedto the burns centre. If during the period of stay P. aerugi-nosa was isolated from a patient sample the patient wasrecruited into the second phase of the study. In thisphase, patients had wound swabs taken at each dressingchange as well as twice-weekly urine samples. Thepatient’s environment and water from outlets in theirbed space were sampled weekly for the duration of theirstay, and after discharge (post-cleaning). Termination ofthe study was planned after 30 screening patient admis-sions, or a year, whichever came soonest, after which 10patients were expected to acquire P. aeruginosa. This pre-diction was based on a previous local audit which sug-gested about one-thirds of burns patients becamecolonised with P. aeruginosa.
Microbiological and molecular methodsP. aeruginosa isolates were obtained from wound swab,urine, stool, environmental and water samples. P. aerugi-nosa was isolated from wound swabs, urine and stool byinoculation onto cysteine lactose electrolyte deficientagar (CLED) and cetrimide agar and incubation for 24 hat 37°C. Stool samples were cultured overnight in a cetri-mide enrichment broth before subculture onto CLED.Identification was confirmed by resistance to C-390 andthe VITEK 2 GN identification card. Antibiotic sensitivityassays were performed using the VITEK 2 AST N-210card (bioMérieux, Basingstoke, UK).The patient’s environment (shower head rosette,
drain, shower chair or trolley, bedside table, patientchair, instruments in contact with the patient) wassampled over a 10 cm2 area by a Polywipe sponge. Thesponge was placed in tryptic soy broth incubated for24 h at 37°C then subcultured onto CLED and cetrimideagar. During water sampling, water was taken from thepatient’s shower, or tap if a shower was not present.Shower heads were not removed for water sampling. At
2 Quick J, et al. BMJ Open 2014;4:e006278. doi:10.1136/bmjopen-2014-006278
Open Access
group.bmj.com on November 20, 2014 - Published by http://bmjopen.bmj.com/Downloaded from

least 200 mL of water was collected into a vessel contain-ing sodium thiosulfate as a neutraliser. In duplicate,100 mL of water was filtered through a 0.45 µ filter andthe filters placed onto CLED plates and cetrimide agar.Plates were incubated at 37°C for 48 h and the numberof organisms per 100 mL quantified.For storage and DNA extraction a single colony was
purified from the primary culture plate. When differentcolony morphologies were observed, a single colonyfrom each type was purified. Additionally, for a randomlyselected water sample, 24 colonies were individuallypicked from one water-filter primary microbiologicalplate for sequencing. Isolates were stored on Biobankbeads at −20°C prior to DNA extraction. Organismswere resuscitated on CLED agar plates and genomeDNA either extracted directly using the MOBIOUltraClean Microbial DNA Kit, or from overnight LBbroth culture using a Qiagen Genomic-Tip 100G.
DNA extraction and sequencingGenomic DNA was prepared from single colony picksusing the MOBIO Ultraclean microbial kit (MOBIO,Carlsbad, USA). 1 ng input DNA, as quantified by Qubit(Life Technologies, Carlsbad, USA) was used to preparegenomic libraries for sequencing using the IlluminaNextera XT DNA sample kit as per manufacturer’s proto-col (Illumina, San Diego, USA). Libraries weresequenced on the Illumina MiSeq using a paired-endprotocol resulting in read lengths between 150 and 300bases. A single additional sample, isolate 910, was chosenas a representative member of Clade 5 for long-readsequencing. DNA from this sample was fragmented usinga Hydroshear (Digilab, Marlborough, Massachusetts,USA) using the recommended protocol for 10 kb frag-ments and further size-selected on a BluePippin instru-ment (Sage Science, Massachusetts, USA) with a 7 kbminimum size cut-off. The library was sequenced on twoSMRT Cells using the Pacific Biosciences RS II instru-ment at the Norwegian Sequencing Centre, Oslo. C4-P2chemistry was chosen because it favours long, more accur-ate reads for de novo assembly.
Stool PCRFor simple presence/absence detection of P. aeruginosain stool samples using PCR, a stool sample was collectedinto a stool collection tube containing stool DNA stabil-iser. Total DNA was extracted using the PSP Spin StoolDNA Plus kit (Stratec Molecular). PCR amplification ofspecies specific regions of the 16S rDNA gene wascarried out using primers PA-SS-F: GGGGGATCTTCGGACCTCA and PA-SS-R: TCCTTAGAGTGCCCACCCG 12
in the following conditions: 0.5 µM of each primer,1.5 mM MgCl2, 0.2 mM dNTP’s using BIOTAQ DNAPolymerase and buffer set. After initial denaturation at96°C for 2 min, 30 cycles of 96°C for 30 s, 62°C for 30 sand 72°C for 30 s were completed with a final extensionof 72°C for 5 min. Products were visualised for size onan 1.5% agarose gel.
Bioinformatics methodsIllumina MiSeq reads from each isolate were adapterand quality trimmed before use with Trimmomatic.27
Phylogenetic reconstruction of isolates sequenced in thisstudy were combined with data from a global collectionof 55 P. aeruginosa strains collected world-wide whichhave been previously analysed by Stewart et al.28 For eachof the published strains, 600 000 paired-end reads oflength 250 bases were simulated using wgsim (https://github.com/lh3/wgsim) from the complete or draftgenome assembly deposited in Genbank. Read sets weremapped against the P. aeruginosa PAO1 referencegenome using BWA-MEM 0.7.5a-r405 using default set-tings.29 Single nucleotide polymorphisms were calledusing VarScan 2.3.6 and filtered for regions with anexcessive number of variants. These may representregions of recombination, misalignments or strongDarwinian selection.30 FastTree (V2.1.7) was used forphylogenetic reconstruction. This software estimates anapproximate maximum-likelihood tree under theJukes-Cantor model of nucleotide evolution with a singlerate for each site (CAT).31 Trees were drawn in FigTree(http://tree.bio.ed.ac.uk/software/figtree/).For in silico MLST prediction, trimmed reads were
assembled de novo using Velvet 32 with a k-mer size of 81and searched using nucleotide BLAST against the multi-locus sequence database downloaded from the pubMLSTwebsite on 5 August 2013 (http://pubmlst.org/paeruginosa/).33 For Clade E isolates, in order toexhaustively search for discriminatory mutations, a nearlycomplete reference genome was generated by de novoassembly using Pacific Biosciences sequencing data.Reads were assembled using the ‘RS_HGAP_Assembly.3’pipeline within SMRT Portal V2.2.0. Illumina reads fromthe same sample were mapped to this draft genomeassembly in order to correct remaining indel errors inthe assembly using Pilon (http://www.broadinstitute.org/software/pilon/). Isolates belonging to each cladewere mapped individually against either the PacBio refer-ence (Clade E) or P. aeruginosa PAO1 (NC_002516;Clades C, D and G).Variants (single nucleotide polymorphisms and short
insertion-deletions) were called using SAMtools mpileupand VarScan with an allele frequency threshold of 80%.30
Non-informative positions and regions of putative recom-bination were removed, the later with a variant densityfilter of more than 3 SNPs every 1000 nucleotides.Analysing samples in each clade individually maximisedthe number of variants detected by reducing the likeli-hood of the position being uncovered by a subset ofsamples. From these variants fine-grained phylogenetictrees were reconstructed for each clade using FastTree.The scripts used to perform this analysis are availableat http://www.github.com/joshquick/snp_calling_scripts.Approximate-maximum-likelihood phylogenetic treeswere generated using FastTree and visualised in FigTree.For whole-genome shotgun metagenomics analysis, readswere analysed using the Kraken taxonomic classifier
Quick J, et al. BMJ Open 2014;4:e006278. doi:10.1136/bmjopen-2014-006278 3
Open Access
group.bmj.com on November 20, 2014 - Published by http://bmjopen.bmj.com/Downloaded from
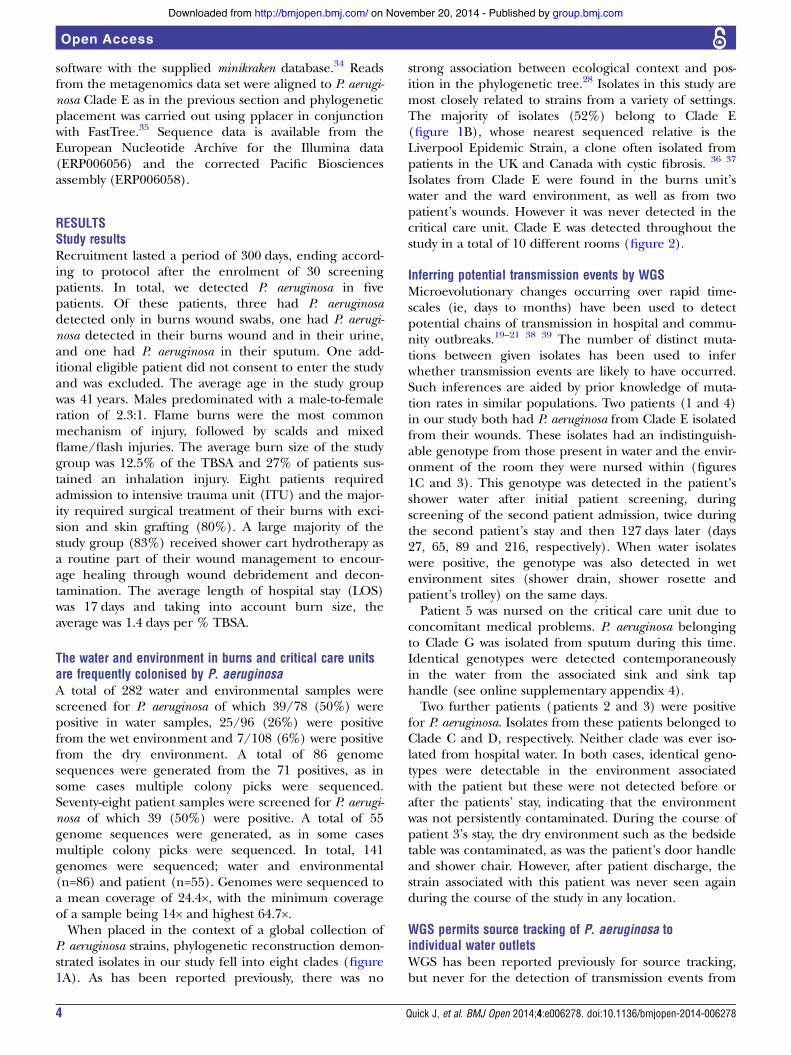
software with the supplied minikraken database.34 Readsfrom the metagenomics data set were aligned to P. aerugi-nosa Clade E as in the previous section and phylogeneticplacement was carried out using pplacer in conjunctionwith FastTree.35 Sequence data is available from theEuropean Nucleotide Archive for the Illumina data(ERP006056) and the corrected Pacific Biosciencesassembly (ERP006058).
RESULTSStudy resultsRecruitment lasted a period of 300 days, ending accord-ing to protocol after the enrolment of 30 screeningpatients. In total, we detected P. aeruginosa in fivepatients. Of these patients, three had P. aeruginosadetected only in burns wound swabs, one had P. aerugi-nosa detected in their burns wound and in their urine,and one had P. aeruginosa in their sputum. One add-itional eligible patient did not consent to enter the studyand was excluded. The average age in the study groupwas 41 years. Males predominated with a male-to-femaleration of 2.3:1. Flame burns were the most commonmechanism of injury, followed by scalds and mixedflame/flash injuries. The average burn size of the studygroup was 12.5% of the TBSA and 27% of patients sus-tained an inhalation injury. Eight patients requiredadmission to intensive trauma unit (ITU) and the major-ity required surgical treatment of their burns with exci-sion and skin grafting (80%). A large majority of thestudy group (83%) received shower cart hydrotherapy asa routine part of their wound management to encour-age healing through wound debridement and decon-tamination. The average length of hospital stay (LOS)was 17 days and taking into account burn size, theaverage was 1.4 days per % TBSA.
The water and environment in burns and critical care unitsare frequently colonised by P. aeruginosaA total of 282 water and environmental samples werescreened for P. aeruginosa of which 39/78 (50%) werepositive in water samples, 25/96 (26%) were positivefrom the wet environment and 7/108 (6%) were positivefrom the dry environment. A total of 86 genomesequences were generated from the 71 positives, as insome cases multiple colony picks were sequenced.Seventy-eight patient samples were screened for P. aerugi-nosa of which 39 (50%) were positive. A total of 55genome sequences were generated, as in some casesmultiple colony picks were sequenced. In total, 141genomes were sequenced; water and environmental(n=86) and patient (n=55). Genomes were sequenced toa mean coverage of 24.4×, with the minimum coverageof a sample being 14× and highest 64.7×.When placed in the context of a global collection of
P. aeruginosa strains, phylogenetic reconstruction demon-strated isolates in our study fell into eight clades (figure1A). As has been reported previously, there was no
strong association between ecological context and pos-ition in the phylogenetic tree.28 Isolates in this study aremost closely related to strains from a variety of settings.The majority of isolates (52%) belong to Clade E(figure 1B), whose nearest sequenced relative is theLiverpool Epidemic Strain, a clone often isolated frompatients in the UK and Canada with cystic fibrosis. 36 37
Isolates from Clade E were found in the burns unit’swater and the ward environment, as well as from twopatient’s wounds. However it was never detected in thecritical care unit. Clade E was detected throughout thestudy in a total of 10 different rooms (figure 2).
Inferring potential transmission events by WGSMicroevolutionary changes occurring over rapid time-scales (ie, days to months) have been used to detectpotential chains of transmission in hospital and commu-nity outbreaks.19–21 38 39 The number of distinct muta-tions between given isolates has been used to inferwhether transmission events are likely to have occurred.Such inferences are aided by prior knowledge of muta-tion rates in similar populations. Two patients (1 and 4)in our study both had P. aeruginosa from Clade E isolatedfrom their wounds. These isolates had an indistinguish-able genotype from those present in water and the envir-onment of the room they were nursed within (figures1C and 3). This genotype was detected in the patient’sshower water after initial patient screening, duringscreening of the second patient admission, twice duringthe second patient’s stay and then 127 days later (days27, 65, 89 and 216, respectively). When water isolateswere positive, the genotype was also detected in wetenvironment sites (shower drain, shower rosette andpatient’s trolley) on the same days.Patient 5 was nursed on the critical care unit due to
concomitant medical problems. P. aeruginosa belongingto Clade G was isolated from sputum during this time.Identical genotypes were detected contemporaneouslyin the water from the associated sink and sink taphandle (see online supplementary appendix 4).Two further patients (patients 2 and 3) were positive
for P. aeruginosa. Isolates from these patients belonged toClade C and D, respectively. Neither clade was ever iso-lated from hospital water. In both cases, identical geno-types were detectable in the environment associatedwith the patient but these were not detected before orafter the patients’ stay, indicating that the environmentwas not persistently contaminated. During the course ofpatient 3’s stay, the dry environment such as the bedsidetable was contaminated, as was the patient’s door handleand shower chair. However, after patient discharge, thestrain associated with this patient was never seen againduring the course of the study in any location.
WGS permits source tracking of P. aeruginosa toindividual water outletsWGS has been reported previously for source tracking,but never for the detection of transmission events from
4 Quick J, et al. BMJ Open 2014;4:e006278. doi:10.1136/bmjopen-2014-006278
Open Access
group.bmj.com on November 20, 2014 - Published by http://bmjopen.bmj.com/Downloaded from

hospital water.40 Phylogenetic reconstruction withinClade E, the most commonly detected water clonedemonstrated additional diversity within this clone, witha total of 46 mutations detected an average genetic dis-tance between isolates of 4.1 mutations (figure 3). Thereconstruction demonstrated clear evidence of cluster-ing of genotypes both by room and outlet (figure 3).When P. aeruginosa was detected in the wet environment(eg, shower rosettes and drains) these genotypes weremost often identical to those found in water, indicatingthat the water was likely the ultimate source of thatclone. Genotypic variation was seen between outletswithin the same room. For example, tap water sampledfrom room 11 had a distinct genotype from thatsampled from shower water in the same room and thiswas consistently found over multiple samplings. Notably,isolates from two patients fell within the cluster originat-ing from shower water, indicating that shower hydrother-apy was the most likely source of infection. Two plasmids(designated pBURNS1 and pBURNS2) were detected inthis study set, which both demonstrated geographicalclustering, with pBURNS1 only being detectable in iso-lates from room 8 and pBURNS2 only being detectablein isolates from the shower water in room 9.
Rapid evolution of antibiotic resistance associated withtreatmentP. aeruginosa is commonly associated with antibioticresistance due to a number of predisposing featuresincluding intrinsic resistance, a repertoire of effluxpumps and antibiotic-inactivating enzymes includingβ-lactamases.41 Three infected patients (2, 3 and 5)received antibiotic therapy, and in each case this wasassociated with the development of resistance to at leastone therapeutic agent. Associated mutations weredetected that were either partially or fully explanatory ofthe phenotype (online supplementary appendix 12).Patient 2 was treated with ciprofloxacin, nitrofurantoin
and vancomycin (see online supplementary appendix 11for full details). Eight of 21 (38%) tested isolates fromthis patient were ciprofloxacin resistant. Seven of eightisolates (88%) of the ciprofloxacin-resistant strains weredistinguishable from the other isolates by a single SNP inmexS (annotated as PA2491 in P. aeruginosa PAO1; seeonline supplementary appendix 1 and 7). This SNP waspredicted to result in a non-synonymous amino acid sub-stitution. Disruption of this gene has been shown tocause increased expression of the mexEF-oprN multidrugefflux pump, associated with resistance to quinolones.42
Figure 1 An overview of all samples collected during the study in global phylogenetic context with other sequenced strains ofPseudomonas aeruginosa from the set of Stewart et al.28 Samples collected in this study are widely dispersed in the tree, whichcontains isolates from different environments (A). Bar plots indicate the numbers of each type of sample collected (B).Microdiversity within each clade is shown, with the colour bar indicating the source of each sample (C).
Quick J, et al. BMJ Open 2014;4:e006278. doi:10.1136/bmjopen-2014-006278 5
Open Access
group.bmj.com on November 20, 2014 - Published by http://bmjopen.bmj.com/Downloaded from

Patient 3 was not treated with antibiotics, but isolatesassociated with this patient demonstrated differences inresistance to timentin and piperacillin-tazobactam. Thesechanges were associated with non-synonymous mutationsin gacA, the response regulator of the GacA/GacS two-component system and in lasR, a transcriptional activatorrequired for transcription of elastase and LasA protease(online supplementary appendices 2 and 8).Patient 4 was treated with meropenem, piperacillin/
tazobactam, flucloxacillin and colistin. Five isolates col-lected 10–18 days after initiation of meropenem showedresistance to imipenem and intermediate resistance tomeropenem (see online supplementary appendix 3 and9). The most likely mutation responsible for this pheno-type was detectable in two isolates, both of which had aframe-shift mutation in the gene coding for the mem-brane porin OprD.43
Patient 5 had a prolonged stay in ITU and had mul-tiple medical problems including A. baumannii infectionand was treated with nine antibiotic agents includingciprofloxacin, meropenem and piperacillin-tazobactam.Serial isolates from this patient demonstrated the
stepwise acquisition of two mutations (onlinesupplementary appendix 4). The first was in nalC, aprobable repressor of the TetR/AcrR family (onlinesupplementary appendix 10).44 On inspection of thesequence alignment in this region, a large deletion of196 nucleotide bases was seen compared to the refer-ence PAO1 strain. This mutation was seen in associationwith full resistance to piperacillin-tazobactam, ceftazi-dine, aztreonam, meropenem and intermediate resist-ance to ciprofloxacin. This deletion is likely to result inover-expression of efflux pumps involving themexAB-oprM operon.44 45 Ciprofloxacin resistance in alater isolate corresponded to the stepwise acquisition ofa second mutation. This mutation is predicted to affectthe well-studied DNA gyrase subunit A gene (gyrA)which is strongly associated with ciprofloxacinresistance.46
Confirmation of P. aeruginosa genotypes in biofilms bywhole-genome metagenomic shotgun sequencingP. aeruginosa is able to produce and survive in biofilms.Plumbing parts such as flow straighteners, shower rosettes,
Figure 2 A schematic view of the 300-day study of Pseudomonas aeruginosa in a burns centre and critical care unit. Time indays is shown along the x axis with bed numbers in the critical care unit and burns unit along the y axis. Each circular iconindicates a positive isolate of P. aeruginosa. The icon’s logotype indicates which environment it originated from (wound, urine/sputum, environment or water). The filled colour of the icon indicates the clade it belongs to. Patient icons represent theenrolment of a screening patient into the study and their location. Patient movements around the hospital are noted by dottedlines. The five patients infected with P. aeruginosa are denoted by rounded boxes. Boxes are coloured according to the patientnumber. In the event two or more isolates of the same source and clade were collected on the same day, these have beencollapsed into a single circular icon.
6 Quick J, et al. BMJ Open 2014;4:e006278. doi:10.1136/bmjopen-2014-006278
Open Access
group.bmj.com on November 20, 2014 - Published by http://bmjopen.bmj.com/Downloaded from

flexible hoses, solenoid valves and thermostatic mixervalves (TMV) are particularly at risk of biofilm formationdue to factors including surface areas, convoluted designsand inadequate pasteurisation.47 To confirm the presenceof P. aeruginosa in water fittings associated with rooms onthe burns unit, we obtained a TMV removed by the hos-pital estates team from the shower in room nine as part ofcompliance with UK guidelines for managing P. aeruginosa
in hospitals. On visual inspection, a biofilm was presentwhich was scraped from the surface with a sterile scalpel.DNA from this biofilm was extracted for whole-genomeshotgun sequencing. The majority of reads did not map toany known bacterial taxa. The most abundant taxon identi-fied was P. aeruginosa (3%). Subsequent alignment to the P.aeruginosa Clade E reference covered 94% of the 6.3million base reference genome at a median coverage of
Figure 3 The high-resolution phylogenetic reconstruction of Clade E isolates. This demonstrates the clustering of genotypes bybed space. Patient associated samples are contained within a room 11 clade. This clade contains water samples from theshower and environmental samples from the shower, drain and trolley. The water samples from the room 11 tap are in a distinctclade, indicating the biofilm within the tap has a distinct genotype to the shower. This suggests environmental contamination wasmore likely to arise from contaminated shower water than tap water. Details of sampling site, days since start of study andpresence of pBURNS plasmids are also shown. The likely phylogenetic position of Pseudomonas aeruginosa detected in abiofilm from a thermostatic mixer valve is shown in the clade associated with room 9 and indicated ‘TMV’.
Quick J, et al. BMJ Open 2014;4:e006278. doi:10.1136/bmjopen-2014-006278 7
Open Access
group.bmj.com on November 20, 2014 - Published by http://bmjopen.bmj.com/Downloaded from

5×, confirming that reads were correctly classified to thisspecies and not other environmental Pseudomonas species.Alignment to the P. aeruginosa Clade E reference genomefollowed by phylogenetic placement of reads demonstratedthat it fell into the same clade as previously recovered iso-lates from the shower or tap in room 9 (indicated onfigure 3, and in online supplementary appendix 6).
DISCUSSIONThe hospital environment has been intimately linkedwith P. aeruginosa infection for over 50 years yet hospitalacquisitions, clusters and outbreaks remain a commonoccurrence and understanding precise routes of trans-mission can be difficult.47 48 Our results demonstratethat, even in a new hospital, P. aeruginosa can becomerapidly endemic in hospital plumbing. Furthermore, bylinking P. aeruginosa genotypes recovered from patientsto specific individual water outlets, we offer compellingevidence of unidirectional transmission from water topatients. Further, by sequencing of a biofilm identifiedin a TMV from a hospital water system, we can identifythe likely common source of genotypes found in waterand in the hospital environment.Our results suggest that use of WGS can reduce ambi-
guity about potential transmission events in hospitalsand consequently inform infection prevention effortsabout the direction and sequence of transmission.Typing schemes such as MLST and PFGE are muchlower resolution methods and would not be able toprovide sufficient information to permit such inferencesto be made. It is notable that the burns unit was colo-nised by a single clone, meaning that it was very unlikelythat water outlets at each bed space were colonised as aresult of transmissions from the patient or environment.For this to happen would require multiple transmissionevents from separate patients with the same clone, forwhich there is no evidence. Instead we speculate thatthis clone was introduced to the hospital associated withits commissioning. One hypothesis is that particularplumbing fittings, that is, the TMV may have been colo-nised simultaneously by a clone circulating in water.Clade E (ST395) has been frequently reported asso-ciated with water, so this remains a possibility. 49 50
However, it is possible that plumbing fittings areinstalled ‘pre-seeded’ with P. aeruginosa as has alreadybeen proposed by Kelsey.3 5 47 Investigation of an out-break in Wales implicated new plumbing parts as apotential source of P. aeruginosa. New plumbing compo-nents are often tested by companies prior to theirsupply and it is possible they were contaminated prior todistribution. The limited amount of diversity (average 4SNPs) seen within this clade is consistent with a singlefounding genotype coinciding with the opening of theburns unit, based on estimates from a previous studyusing WGS which reported that mutations accumulate ata rate of approximately one every 3–4 months in ahospital-associated clone.51 However, our results suggest
that our isolates accumulate mutations even more slowly.This may be due to reduced growth rates innutritionally-poor biofilms.52
It is notable that antibiotic resistance to multiple first-line agents developed rapidly in response to therapy.These results underline the importance of selecting appro-priate antibiotic therapy in P. aeruginosa infections. It isreassuring however that antibiotic resistance genotypesselected in vivo did not show evidence of persistence in theward environment or transmission to other patients.Our study has certain limitations. Based on a previous
audit, we expected around one-third of patientsscreened for P. aeruginosa would develop colonisation orclinical infection. In fact, only 5 out of 30 of patientswere colonised. This may have been related to guidanceand engineering interventions being put in place duringthe study as detailed in national guidance issued whilethis study was on-going. In addition, infection controlpolicies were revised to address control of an outbreakof a multidrug resistant A. baumannii in this same burnsunit. Following these interventions, only 1 of the last 20patients recruited was infected with P. aeruginosa whichmay demonstrate the importance of national guidancein reducing transmissions.By focusing on burns patients who receive hydrother-
apy, our study population were at extremely high risk ofwaterborne infection. In other patient groups it may bethat alternative routes of transmission including cross-infection or endogenous carriage play a more importantrole. Our results suggest that our burns unit is endemic-ally colonised with a distinct clone of P. aeruginosa thatmay have been imported coinciding with the opening ofthe hospital. Other intensive care units, particularlythose which have been open for longer may harbour agreater diversity of P. aeruginosa as a result of increasedopportunities for clones to be imported.One potential application for WGS in infection
control would be to determine whether cases are as aresult of water transmission, or represent sporadicclones originating from the wider environment. Despiteimproved guidance concerning improved engineeringinfection control practices and the introduction of thewater safety group in the UK, it may not be realistic toeliminate P. aeruginosa from hospitals entirely. In aug-mented care units such as ITUs, burns units and neo-natal wards where P. aeruginosa poses a significant risk tovulnerable patients, the increased resolution offered byWGS will justify its use, particularly as the costs continueto fall.In conclusion, we have identified through WGS clear
evidence for transmission of P. aeruginosa from specificwater outlets to burns patients and offer a forensic-levelframework for dealing with outbreaks linked to hospitalwater. We expect WGS will continue to make inroadsinto clinical microbiology and become a vital tool fortracking P. aeruginosa in the hospital environment,helping inform targeted control measures to helpprotect patients at risk of infection.
8 Quick J, et al. BMJ Open 2014;4:e006278. doi:10.1136/bmjopen-2014-006278
Open Access
group.bmj.com on November 20, 2014 - Published by http://bmjopen.bmj.com/Downloaded from

Author affiliations1Institute of Microbiology and Infection, University of Birmingham,Birmingham, UK2NIHR Surgical Reconstruction and Microbiology Research Centre, QueenElizabeth Hospital, Birmingham, UK3Healing Foundation Centre for Burns Research, University HospitalBirmingham Foundation Trust, Birmingham, UK4Division of Microbiology and Immunology, University of Warwick, Warwick,UK
Acknowledgements The authors are grateful to Mark Webber for discussionson antibiotic resistance and to Paul Keim for discussion on phylogeneticplacement of metagenomics samples. The authors thank Lex Nederbragt, AveTooming-Klunderud and the staff of the Norwegian Sequencing Centre, Oslofor Pacific Biosciences sequencing. The authors thank Matthew Smith-Banksfor laboratory assistance with processing samples. The authors also thankJimmy Walker for critical reading of the manuscript. The authors also thankDrs David Baltrus, Thomas Connor, Jennifer Gardy and Alan McNally for theirhelpful comments and suggestions to help improve the manuscript madeduring the open peer review process.
Contributors MJP, NSM and BO conceived the study. CMW and AB enrolledpatients into study and collected samples. NC collected environmental andwater samples. NC, CC and MN processed samples and performedmicrobiology. NC, CC and JQ did sequencing. JQ, NC, CMT and NJL analysedthe data. NJL, NC, JQ, MJP and BO wrote the paper. All authors commentedon the manuscript draft.
Funding This paper presents independent research funded by the NationalInstitute for Health research (NIHR). The views expressed are those of theauthor(s) and not necessarily those of the NHS, the NIHR or the Departmentof Health. NJL is funded by a Medical Research Council Special TrainingFellowship in Biomedical Informatics.
Competing interests None.
Ethics approval The study protocol received approval from National ResearchEthics Service committee in the West Midlands (reference number 12/WM/0181).
Provenance and peer review Not commissioned; externally peer reviewed.
Data sharing statement Pacific Biosciences raw data files are available fromthe corresponding author (Nicholas J Loman, ).
Open Access This is an Open Access article distributed in accordance withthe Creative Commons Attribution Non Commercial (CC BY-NC 4.0) license,which permits others to distribute, remix, adapt, build upon this work non-commercially, and license their derivative works on different terms, providedthe original work is properly cited and the use is non-commercial. See: http://creativecommons.org/licenses/by-nc/4.0/
REFERENCES1. Reuter S, Sigge A, Wiedeck H, et al. Analysis of transmission
pathways of Pseudomonas aeruginosa between patients and tapwater outlets. Crit Care Med 2002;30:2222–8.
2. Struelens MJ, Rost F, Deplano A, et al. Pseudomonas aeruginosaand Enterobacteriaceae bacteremia after biliary endoscopy: anoutbreak investigation using DNA macrorestriction analysis. Am JMed 1993;95:489–98.
3. DiazGranados CA, Jones MY, Kongphet-Tran T, et al. Outbreak ofPseudomonas aeruginosa infection associated with contamination ofa flexible bronchoscope. Infect Control Hosp Epidemiol2009;30:550–5.
4. Crivaro V, Di Popolo A, Caprio A, et al. Pseudomonas aeruginosa ina neonatal intensive care unit: molecular epidemiology and infectioncontrol measures. BMC Infect Dis 2009;9:70.
5. Moolenaar RL, Crutcher JM, San Joaquin VH, et al. A prolongedoutbreak of Pseudomonas aeruginosa in a neonatal intensive careunit: did staff fingernails play a role in disease transmission? InfectControl Hosp Epidemiol 2000;21:80–5.
6. Trautmann M, Lepper PM, Haller M. Ecology of Pseudomonasaeruginosa in the intensive care unit and the evolving role of wateroutlets as a reservoir of the organism. Am J Infect Control 2005;33:S41–9.
7. Foca M, Jakob K, Whittier S, et al. Endemic Pseudomonasaeruginosa infection in a neonatal intensive care unit. N Engl J Med2000;343:695–700.
8. Kolmos HJ, Thuesen B, Nielsen SV, et al. Outbreak of infection in aburns unit due to Pseudomonas aeruginosa originating fromcontaminated tubing used for irrigation of patients. J Hosp Infect1993;24:11–21.
9. Widmer AF, Wenzel RP, Trilla A, et al. Outbreak of Pseudomonasaeruginosa infections in a surgical intensive care unit: probabletransmission via hands of a health care worker. Clin Infect Dis1993;16:372–6.
10. Srinivasan A, Wolfenden LL, Song X, et al. An outbreak ofPseudomonas aeruginosa infections associated with flexiblebronchoscopes. N Engl J Med 2003;348:221–7.
11. Wise J. Three babies die in pseudomonas outbreak at Belfastneonatal unit. BMJ 2012;344:e592.
12. Breathnach AS, Cubbon MD, Karunaharan RN, et al.Multidrug-resistant Pseudomonas aeruginosa outbreaks in twohospitals: association with contaminated hospital waste-watersystems. J Hosp Infect 2012;82:19–24.
13. Walker JT, Jhutty A, Parks S, et al. Investigation of healthcare-acquired infections associated with Pseudomonas aeruginosabiofilms in taps in neonatal units in Northern Ireland. J Hosp Infect2014;86:16–23.
14. Health Technical Memorandum 04-01: Addendum. Department ofHealth https://www.gov.uk/government/uploads/system/uploads/attachment_data/file/140105/Health_Technical_Memorandum_04-01_Addendum.pdf (accessed 11 Dec 2013).
15. Maiden MC, Bygraves JA, Feil E, et al. Multilocus sequence typing:a portable approach to the identification of clones within populationsof pathogenic microorganisms. Proc Natl Acad Sci USA1998;95:3140–5.
16. Jefferies JMC, Cooper T, Yam T, et al. Pseudomonas aeruginosaoutbreaks in the neonatal intensive care unit—a systematic review ofrisk factors and environmental sources. J Med Microbiol2012;61:1052–61.
17. Cholley P, Thouverez M, Hocquet D, et al. Most multidrug-resistantPseudomonas aeruginosa isolates from hospitals in easternFrance belong to a few clonal types. J Clin Microbiol2011;49:2578–83.
18. Curran B, Jonas D, Grundmann H, et al. Development of amultilocus sequence typing scheme for the opportunistic pathogenPseudomonas aeruginosa. J Clin Microbiol 2004;42:5644–9.
19. Harris SR, Cartwright EJP, Török ME, et al. Whole-genomesequencing for analysis of an outbreak of meticillin-resistantStaphylococcus aureus: a descriptive study. Lancet Infect Dis2013;13:130–6.
20. Lewis T, Loman NJ, Bingle L, et al. High-throughput whole-genomesequencing to dissect the epidemiology of Acinetobacter baumanniiisolates from a hospital outbreak. J Hosp Infect 2010;75:37–41.
21. Snitkin ES, Zelazny AM, Thomas PJ, et al. Tracking a hospitaloutbreak of carbapenem-resistant Klebsiella pneumoniae withwhole-genome sequencing. Sci Transl Med 2012;4:148ra116.
22. Loman NJ, Misra RV, Dallman TJ, et al. Performance comparison ofbenchtop high-throughput sequencing platforms. Nat Biotechnol2012;30:434–9.
23. Tredget EE, Shankowsky HA, Joffe AM, et al. Epidemiology ofinfections with Pseudomonas aeruginosa in burn patients: the role ofhydrotherapy. Clin Infect Dis 1992;15:941–9.
24. Langschmidt J, Caine PL, Wearn CM, et al. Hydrotherapy in burncare: a survey of hydrotherapy practices in the UK and Ireland andliterature review. Burns 2014;40:860–4.
25. Tredget EE, Shankowsky HA, Rennie R, et al. Pseudomonasinfections in the thermally injured patient. Burns 2004;30:3–26.
26. Davison PG, Loiselle FB, Nickerson D. Survey on currenthydrotherapy use among North American burn centers. J Burn CareRes 2010;31:393–9.
27. Bolger AM, Lohse M, Usadel B. Trimmomatic: a flexible trimmer forIllumina sequence data. Bioinformatics 2014;30:2114–20.
28. Stewart L, Ford A, Sangal V, et al. Draft genomes of 12host-adapted and environmental isolates of Pseudomonasaeruginosa and their positions in the core genome phylogeny.Pathog Dis 2014;71:20–5.
29. Li H, Durbin R. Fast and accurate long-read alignment withBurrows-Wheeler transform. Bioinformatics 2010;26:589–95.
30. Koboldt DC, Zhang Q, Larson DE, et al. VarScan 2: somaticmutation and copy number alteration discovery in cancer by exomesequencing. Genome Res 2012;22:568–76.
31. Price MN, Dehal PS, Arkin AP. FastTree 2—approximatelymaximum-likelihood trees for large alignments. PLoS ONE 2010;5:e9490.
Quick J, et al. BMJ Open 2014;4:e006278. doi:10.1136/bmjopen-2014-006278 9
Open Access
group.bmj.com on November 20, 2014 - Published by http://bmjopen.bmj.com/Downloaded from

32. Zerbino DR, Birney E. Velvet: algorithms for de novo short readassembly using de Bruijn graphs. Genome Res 2008;18:821–9.
33. Jolley KA, Maiden MC. BIGSdb: scalable analysis of bacterialgenome variation at the population level. BMC Bioinformatics2010;11:595–5.
34. Wood DE, Salzberg SL. Kraken: ultrafast metagenomicsequence classification using exact alignments. Genome Biol2014;15:R46.
35. Matsen FA, Kodner RB, Armbrust EV. pplacer: linear timemaximum-likelihood and Bayesian phylogenetic placement ofsequences onto a fixed reference tree. BMC Bioinformatics2010;11:538.
36. Scott FW, Pitt TL. Identification and characterization of transmissiblePseudomonas aeruginosa strains in cystic fibrosis patients inEngland and Wales. J Med Microbiol 2004;53:609–15.
37. Panagea S, Winstanley C, Parsons YN, et al. PCR-based detectionof a cystic fibrosis epidemic strain of Pseudomonas Aeruginosa.Mol Diagn 2003;7:195–200.
38. Gardy JL, Johnston JC, Ho Sui SJ, et al. Whole-genomesequencing and social-network analysis of a tuberculosis outbreak.N Engl J Med 2011;364:730–9.
39. Bryant JM, Grogono DM, Greaves D, et al. Whole-genomesequencing to identify transmission of Mycobacterium abscessusbetween patients with cystic fibrosis: a retrospective cohort study.Lancet 2013;381:1551–60.
40. Lienau EK, Strain E, Wang C, et al. Identification of a salmonellosisoutbreak by means of molecular sequencing. N Engl J Med2011;364:981–2.
41. Lambert PA. Mechanisms of antibiotic resistance in Pseudomonasaeruginosa. J R Soc Med 2002;95(Suppl 41):22–6.
42. Sobel ML, Neshat S, Poole K. Mutations in PA2491 (mexS) promoteMexT-dependent mexEF-oprN expression and multidrug resistance
in a clinical strain of Pseudomonas aeruginosa. J Bacteriol2005;187:1246–53.
43. Quinn JP, Dudek EJ, DiVincenzo CA, et al. Emergence of resistanceto imipenem during therapy for Pseudomonas aeruginosa infections.J Infect Dis 1986;154:289–94.
44. Cao L, Srikumar R, Poole K. MexAB-OprM hyperexpression inNalC-type multidrug-resistant Pseudomonas aeruginosa:identification and characterization of the nalC gene encoding arepressor of PA3720-PA3719. Mol Microbiol 2004;53:1423–36.
45. Llanes C, Hocquet D, Vogne C, et al. Clinical strains of Pseudomonasaeruginosa overproducing MexAB-OprM and MexXY efflux pumpssimultaneously. Antimicrob Agents Chemother 2004;48:1797–802.
46. Cambau E, Perani E, Dib C, et al. Role of mutations in DNA gyrasegenes in ciprofloxacin resistance of Pseudomonas aeruginosasusceptible or resistant to imipenem. Antimicrob Agents Chemother1995;39:2248–52.
47. Kelsey M. Pseudomonas in augmented care: should we worry?J Antimicrob Chemother 2013;68:2697–700.
48. Rogers DE. The changing pattern of life-threatening microbialdisease. N Engl J Med 1959;261:677–83.
49. Martin K, Baddal B, Mustafa N, et al. Clusters of genetically similarisolates of Pseudomonas aeruginosa from multiple hospitals in theUK. J Med Microbiol 2013;62:988–1000.
50. Slekovec C, Plantin J, Cholley P, et al. Tracking down antibiotic-resistant Pseudomonas aeruginosa isolates in a wastewaternetwork. PLoS ONE 2012;7:e49300.
51. Snyder LA, Loman N, Faraj LA, et al. Epidemiological investigationof Pseudomonas aeruginosa isolates from a six-year-long hospitaloutbreak using high-throughput whole genome sequencing. EuroSurveill 2013;17, 18:pii: 20611.
52. Donlan RM. Biofilm formation: a clinically relevant microbiologicalprocess. Clin Infect Dis 2001;33:1387–92.
10 Quick J, et al. BMJ Open 2014;4:e006278. doi:10.1136/bmjopen-2014-006278
Open Access
group.bmj.com on November 20, 2014 - Published by http://bmjopen.bmj.com/Downloaded from

55
3 Rapid draft sequencing and real-time nanopore sequencing in a
hospital outbreak of Salmonella
3.1 Author contributions
SC and JQ performed sequencing. JQ, PA, TD, ER, PH and NJL analysed data. NJL,
TD, PH and MW contributed reagents. NJL, PH and JQ wrote the manuscript. All
authors read and approved the final manuscript.
3.2 Author contributions (additional detail)
JQ generated the sequencing libraries and wrote the MiSeq draft sequencing scripts. JQ
performed the phylogenetic analysis, the quality comparison for draft sequencing and
wrote the scripts to perform the streamed genotyping and the pplacer analysis. JQ
drafted figures, tables and contributed to the writing of the manuscript.
3.3 Abstract
In this study we investigated the use of both the MiSeq and the MinION to provide
clinically relevant information during an ongoing local hospital outbreak of Salmonella
enterica Serovar Enteritidis. During the outbreak we sequenced 16 isolates using a 6
hour MiSeq ‘draft sequencing’ protocol we developed to quickly rule isolates in or out
of the outbreak. Later we sequenced two isolates on the MinION, one known to be from

56
the outbreak and one not. In order to simulate real-time data, the reads were analysed as
they would have become available in real time i.e. at ten minute intervals after the start
of the run. We demonstrated two new analysis approaches; the first able to
unambiguously identify the species as Salmonella enterica within 30 minutes and the
second able to assign one sample to the main hospital cluster within 100 minutes and
the other to a different cluster containing a mixture of phage types none of which were
the same as the hospital cluster (14b) within 120 minutes. Surveillance sequencing of
foodborne pathogens is an exciting development pioneered by the Food and Drug
Administration (FDA)[68] and Public Health England (PHE). Integrating our data with
these resources allowed us to place the outbreak in a national and international context.
3.4 Published manuscript

RESEARCH Open Access
Rapid draft sequencing and real-time nanoporesequencing in a hospital outbreak of SalmonellaJoshua Quick1,2†, Philip Ashton3†, Szymon Calus1,2, Carole Chatt4, Savita Gossain5, Jeremy Hawker4, Satheesh Nair3,Keith Neal4, Kathy Nye5, Tansy Peters3, Elizabeth De Pinna3, Esther Robinson6, Keith Struthers5, Mark Webber2,Andrew Catto7, Timothy J. Dallman3, Peter Hawkey1,5* and Nicholas J. Loman1*
Abstract
Background:Foodborne outbreaks of Salmonella remain a pressing public health concern. We recently detected alarge outbreak of Salmonella enterica serovar Enteritidis phage type 14b affecting more than 30 patients in ourhospital. This outbreak was linked to community, national and European-wide cases. Hospital patients withSalmonella are at high risk, and require a rapid response. We initially investigated this outbreak by whole-genomesequencing using a novel rapid protocol on the Illumina MiSeq; we then integrated these data with whole-genomedata from surveillance sequencing, thereby placing the outbreak in a national context. Additionally, we investigatedthe potential of a newly released sequencing technology, the MinION from Oxford Nanopore Technologies, in themanagement of a hospital outbreak of Salmonella.
Results:We demonstrate that rapid MiSeq sequencing can reduce the time to answer compared to the standardsequencing protocol with no impact on the results. We show, for the first time, that the MinION can acquireclinically relevant information in real time and within minutes of a DNA library being loaded. MinION sequencingpermits confident assignment to species level within 20 min. Using a novel streaming phylogenetic placementmethod samples can be assigned to a serotype in 40 min and determined to be part of the outbreak in less than2 h.
Conclusions:Both approaches yielded reliable and actionable clinical information on the Salmonella outbreak inless than half a day. The rapid availability of such information may facilitate more informed epidemiologicalinvestigations and influence infection control practices.
BackgroundOutbreaks of Salmonella from contaminated food arefrequently reported in the community, with 1.2 millioncases estimated to occur in the US each year [1]. In apopulation-based study in the UK in 2008–2009, therewere >38,600 estimated cases of salmonellosis and11,300 patients presenting to a primary care physician[2]. Hospital outbreaks of Salmonella may result frompatient-to-patient spread and can be lethal in vulnerablepatients [3–5]. An example is the hospital outbreak atStanley Royd Hospital in the UK which led to the deathsof 19 patients and a public inquiry [2, 6]. We recently
detected a cluster of more than 30 cases of Salmonellaenterica serovar Enteritidis (S. Enteritidis) over a 3-weekperiod at one of three hospital sites in our hospital or-ganisation and from the community. This was against atypical background incidence of five to eight cases permonth of all S. enterica isolates in the area served byour hospital. Initially a small number of seemingly unre-lated, presumed community-acquired cases were de-tected on different wards but subsequently a largernumber of long-term inpatients on two adjoining wardswere affected suggesting the possibility of spread withinthe hospital. Simultaneously, an increase in communityisolates was also detected. At first, it was unclearwhether hospital cases were reflecting multiple importsfrom a community outbreak or spread within the hos-pital or both. Due to the explosive nature of the out-break, coupled with uncertainty about the source, a
* Correspondence:†Equal contributors1Institute of Microbiology and Infection, University of Birmingham,Birmingham B15 2TT, UKFull list of author information is available at the end of the article
© 2015 Quick. This is an Open Access article distributed under the terms of the Creative Commons Attribution License (http://creativecommons.org/licenses/by/4.0), which permits unrestricted use, distribution, and reproduction in any medium, providedthe original work is properly credited. The Creative Commons Public Domain Dedication waiver (http://creativecommons.org/publicdomain/zero/1.0/) applies to the data made available in this article, unless otherwise stated.
Quick et al. Genome Biology (2015) 16:114 DOI 10.1186/s13059-015-0677-2

rapid response was required to ensure that infectioncontrol measures were appropriately targeted. Outbreakinvestigations are aided by rapid availability of whole-genome sequencing (WGS) data, as this provides thegreatest level of discrimination between isolates whencompared to traditional typing methods such as phagetyping, multilocus variable number tandem repeat ana-lysis (MLVA) and pulsed-field gel electrophoresis (PFGE)[3–5, 7]. The Illumina MiSeq sequencing platform hasemerged as the gold standard for WGS investigations ofoutbreaks, but results may not be available for as long as3 working days, depending on the protocol used [8–10].A number of studies have evaluated the utility of WGSfor typing S. enterica isolates; however, to the authors’knowledge, this is the first use of prospective typing ofthis organism during an outbreak. Rapid availability ofaccurate typing results is critical to effective outbreakcontrol. We therefore devised a novel rapid draft se-quencing protocol on the MiSeq generating results inunder 6 h following library preparation. At the time ofthe outbreak we were testing a portable, handheld, ‘USBstick’, whole-genome sequencer, the MinION (OxfordNanopore Technologies, UK), as part of their earlyaccess programme. We wished to see what role thistechnology might play in the management of futureoutbreaks.Our initial goals when performing sequencing pro-
spectively were: (1) to determine if cases in the hospitalwere from the same strain as those circulating in thecommunity, and to discriminate outbreak cases fromnormal background S. enterica strains; (2) to determinewhether there was evidence of a super-shedder patientor specific breakdown in infection control practices; (3)to help link cases to a primary source (for example, per-son or food) and to compare to previous outbreakstrains; and (4) to integrate these results with nationalsurveillance data.
Results and discussionEpidemiological investigationIn total, 43 isolates of S. Enteritidis were identified in thestudy period (1 to 24 June) from inpatients, communitysamples from general practitioners and from environmen-tal isolates. Hospitalised cases were only identified at onehospital site in the group of three hospitals. The same hos-pital food is distributed to all three hospital sites from asingle, central kitchen processing unit where hot food istwice-cooked to standards that would kill salmonellae. Allmicrobiological testing of hospital food was negative forSalmonella. The environmental swabs from affected wardswere all negative apart from one isolate of S. Enteritidis re-covered from the outside door seal of a food regenerationtrolley. This proved to be of the outbreak type. Four separ-ate colony picks were sequenced from this culture. Isolates
from staff were sent to the reference laboratory by anotherlaboratory in a different city 14 miles away. These weredetected in faecal samples submitted by general practi-tioners and were found to belong to staff at our hospitalworking on the affected wards. The first 16 samples, ofwhich six cases had onset dates compatible with commu-nity acquisition, were available for sequencing on 10 Juneand 13 samples sequenced successfully. These were subse-quently shown to be distinct from other isolates recentlysequenced by national surveillance and were identical toeach other, apart from three cases that each had one SNPdifference (Fig. 1, Panel a).Sequencing of isolates from two early patient cases on
3 and 4 June showed them to be identical. As both pa-tients had been hospitalised for longer than the Salmon-ella incubation period this was strongly suggestive ofhospital acquisition. There were nine other cases on orprior to 4 June, which together with the typing datahelped to inform further infection control actions. Allsymptomatic patients were isolated and the two wardswere closed. Deep cleaning was undertaken withvaporised hydrogen peroxide sterilisation. Four isolatesfrom the later part of the outbreak were identified bySNP typing to be unrelated to the outbreak type. Two ofthe four isolates were from young children who had re-cently returned from separate holidays in Egypt. Theseisolates were different to each other but one was identi-cal to another isolate from a child of similar age whohad not travelled abroad, which prompted further epi-demiological investigation. It emerged that the two chil-dren attended the same nursery in a town just outsidethe city in which the hospital outbreak had been de-tected, strongly suggesting transmission had occurredwithin the nursery (Fig. 1).The earliest date of onset was 25 May and the last 8
July. A total of 37 cases with the outbreak strain wereidentified of which six had no connection with the hos-pital, eight were staff members and three were asymp-tomatic carriers identified by screening patients onoutbreak wards. Comparison of the outbreak genome se-quence with the Public Health England database ofstrains from the whole of England and Wales suggesteda very close relationship to six isolates from London,Bedford and Northampton. Further epidemiological in-vestigation of these cases found no link to Birminghamor a foodstuff. The outbreak strain was PT 14b andmulti-locus variable number tandem repeat (MLVA) type2-11-9-7-4-3-2-8-9, an uncommon type for PT 14bstrains.
Rapid draft sequencing on the Illumina MiSeqAs an initial response to the outbreak, isolates from 16patients were sequenced overnight on the IlluminaMiSeq on 12 June 2014 in order to generate results for
Quick et al. Genome Biology (2015) 16:114 Page 2 of 14
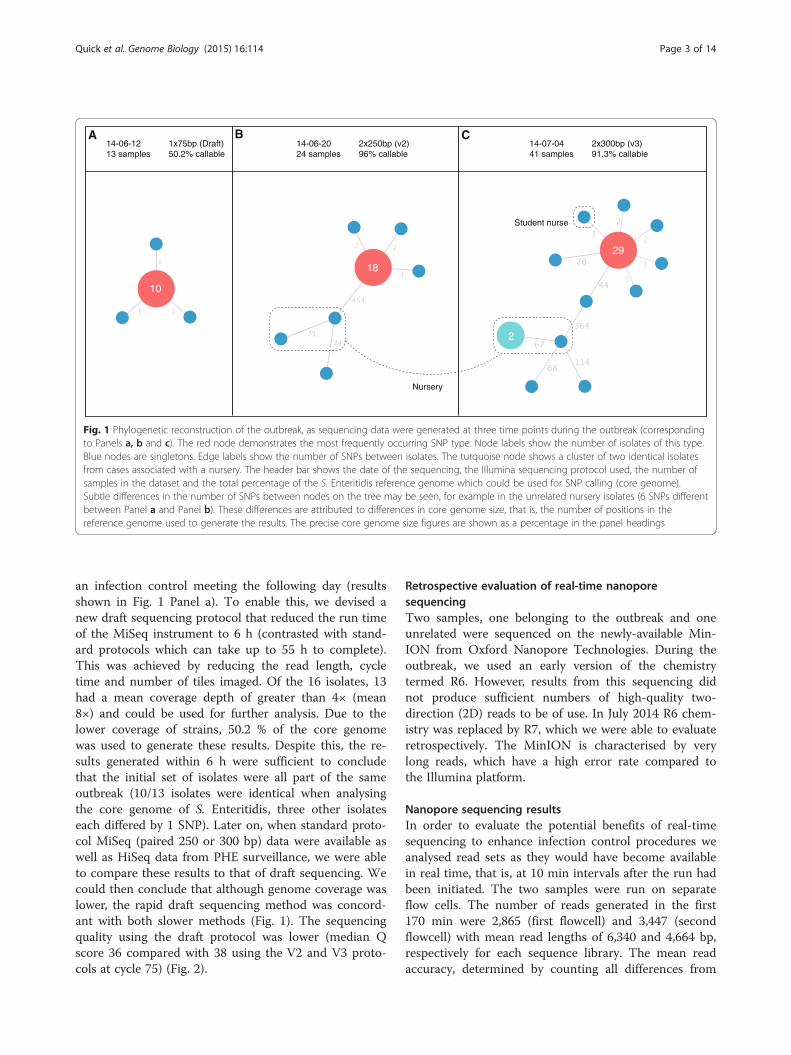
an infection control meeting the following day (resultsshown in Fig. 1 Panel a). To enable this, we devised anew draft sequencing protocol that reduced the run timeof the MiSeq instrument to 6 h (contrasted with stand-ard protocols which can take up to 55 h to complete).This was achieved by reducing the read length, cycletime and number of tiles imaged. Of the 16 isolates, 13had a mean coverage depth of greater than 4× (mean8×) and could be used for further analysis. Due to thelower coverage of strains, 50.2 % of the core genomewas used to generate these results. Despite this, the re-sults generated within 6 h were sufficient to concludethat the initial set of isolates were all part of the sameoutbreak (10/13 isolates were identical when analysingthe core genome of S. Enteritidis, three other isolateseach differed by 1 SNP). Later on, when standard proto-col MiSeq (paired 250 or 300 bp) data were available aswell as HiSeq data from PHE surveillance, we were ableto compare these results to that of draft sequencing. Wecould then conclude that although genome coverage waslower, the rapid draft sequencing method was concord-ant with both slower methods (Fig. 1). The sequencingquality using the draft protocol was lower (median Qscore 36 compared with 38 using the V2 and V3 proto-cols at cycle 75) (Fig. 2).
Retrospective evaluation of real-time nanoporesequencingTwo samples, one belonging to the outbreak and oneunrelated were sequenced on the newly-available Min-ION from Oxford Nanopore Technologies. During theoutbreak, we used an early version of the chemistrytermed R6. However, results from this sequencing didnot produce sufficient numbers of high-quality two-direction (2D) reads to be of use. In July 2014 R6 chem-istry was replaced by R7, which we were able to evaluateretrospectively. The MinION is characterised by verylong reads, which have a high error rate compared tothe Illumina platform.
Nanopore sequencing resultsIn order to evaluate the potential benefits of real-timesequencing to enhance infection control procedures weanalysed read sets as they would have become availablein real time, that is, at 10 min intervals after the run hadbeen initiated. The two samples were run on separateflow cells. The number of reads generated in the first170 min were 2,865 (first flowcell) and 3,447 (secondflowcell) with mean read lengths of 6,340 and 4,664 bp,respectively for each sequence library. The mean readaccuracy, determined by counting all differences from
18
10
Nursery
Student nurse
14-06-12 1x75bp (Draft)13 samples 50.2% callable
14-06-20 2x250bp (v2)24 samples 96% callable
14-07-04 2x300bp (v3)41 samples 91.3% callable
2
29
A B C
Fig. 1 Phylogenetic reconstruction of the outbreak, as sequencing data were generated at three time points during the outbreak (correspondingto Panels a, b and c). The red node demonstrates the most frequently occurring SNP type. Node labels show the number of isolates of this type.Blue nodes are singletons. Edge labels show the number of SNPs between isolates. The turquoise node shows a cluster of two identical isolatesfrom cases associated with a nursery. The header bar shows the date of the sequencing, the Illumina sequencing protocol used, the number ofsamples in the dataset and the total percentage of the S. Enteritidis reference genome which could be used for SNP calling (core genome).Subtle differences in the number of SNPs between nodes on the tree may be seen, for example in the unrelated nursery isolates (6 SNPs differentbetween Panel a and Panel b). These differences are attributed to differences in core genome size, that is, the number of positions in thereference genome used to generate the results. The precise core genome size figures are shown as a percentage in the panel headings
Quick et al. Genome Biology (2015) 16:114 Page 3 of 14

the reference genome, was 72 % (first flowcell) and 73 %(second flowcell).
Real-time strain identification from nanopore readsWe found that in the two samples tested we could un-ambiguously identify the bacterial species S. enterica inless than 30 min (Fig. 3). Additionally, chromosomallyencoded phage sequences were detectable and distin-guishable between outbreak and non-outbreak strainswithin 50 min.
Genotyping from low coverage, error-prone data usingphylogenetic placementGenotyping accuracy improves as more sequencing dataare available and a consensus sequence is formed(Table 1). Our genotyping protocol gets increasinglymore precise as more reads are added, however recallstays relatively constant. Despite this, a phylogeneticplacement method confidently assigned both the out-break and non-outbreak strains to a clade of S. entericacontaining the Gallinarum, Pullorum and Enteritidiisserovars very early on in the sequencing process. By40 min it was possible to determine that the likely sero-var was Enteritidis (Fig. 4). Once assigned to a serovar,further analysis could be restricted to a reference tree ofS. Enteritidis strains. It was possible then to show thatthe outbreak strain unambiguously belonged to the mainhospital outbreak cluster within 100 min of starting se-quencing (Fig. 5). The non-outbreak strain was assign-able to a clade containing several closely related strains
(with a mixture of phage types, none of them PT 14b)within 120 min.The availability of definitive typing data so early on in
this outbreak enabled us to identify transmission be-tween hospital wards and take rapid action to controlspread. The appearance of cases in unrelated wards waspuzzling initially, but WGS confirmed that the hospitalSNP type was the same as that circulating in the com-munity. This reassured the infection control team thatthere was not hospital-wide spread via some unknownvector. Preliminary food sample testing results were onlyavailable one day later. The finding of the outbreakstrain on the door seal of the food trolley with the subse-quent confirmation of cases in staff members supportedthe hypothesis that some local spread had occurred viathe environment. Person-to-person spread may also haveoccurred. Towards the end of the outbreak the ability torapidly identify cases not involved prevented much wast-age of effort and resources. Remarkably we identifiedtransmission of another strain of S. Enteriditis probablyacquired in Egypt in a childcare group at a distant sitebecause of the resolution of the typing informationdirecting epidemiological investigations. Recent out-breaks of PT 14b strains in the UK have previously beenassociated with Spanish eggs, although the antibiotic re-sistance profile of the outbreak described here is differ-ent [11, 12]. Contemporaneously, outbreaks of S.Enteritidis PT 14b associated with consumption of eggswere reported in France, Austria and Germany, trigger-ing an urgent outbreak investigation by the ECDC andEFSA [12]. Strains associated with this outbreak were of
Fig. 2 Phred-scaled quality scores (−10 log10 P) for Illumina sequencing demonstrating the impact of read length on read quality scoreswith the three Illumina MiSeq sequencing modalities used in this study. Red scores indicate results from the draft 1 × 75 base sequencingprotocol, which shows minimally worse quality drop-off than running V2 (green, 2 × 250 base) or V3 chemistry (blue, 2 × 300) understandard conditions
Quick et al. Genome Biology (2015) 16:114 Page 4 of 14

MLVA type 2-12-7-3-2 (using the 5-locus scheme), vary-ing by a single locus from the isolates identified in thisstudy. In these cases S. Enteritidis was isolated from eggsoriginating from a producer in Germany [12]. There isno definitive link between the outbreak reported in thisstudy and the consumption of German eggs. However,the MLVA type in the European outbreak was also de-tected in the UK and eggs from the German producerare distributed for sale in the UK. Further whole-genome sequencing of European isolates is now beingundertaken and may help determine whether the twooutbreaks are linked to a common source.This study illustrates a substantial future benefit from
extremely rapid definitive WGS typing. The epidemi-ology of non-typhoidal Salmonella has changed signifi-cantly in the UK over the last decade and to a lesserextent in the rest of Europe [2, 13]. While non-typhoidalSalmonella rates have fallen overall, particularly in theUK following chicken flock vaccination, the proportionof disease caused by S. Enteritidis associated with travelhas risen greatly. The ability to both identify serovars viadeduced multi-locus sequence typing (MLST) and spe-cific strains within a day of bacterial colonies being avail-able will enable outbreaks to be investigated at a stagewhere accurate travel/food histories and possibleperson-to-person transmission can be elucidated and
control measures introduced. We show that our methodof rapid draft sequencing on the MiSeq is able to gener-ate reliable results, despite generating reduced genomecoverage. We anticipate this method will be of value toresearch groups needing to generate results in the time-scale of a single working day, a considerable reductioncompared to the standard protocols on this instrument.The availability of national and international databases
of sequencing data of food-borne pathogens marks anexciting step forward for epidemiological investigations.Surveillance by WGS has been pioneered by the USFood and Drug Administration, with results publishedonline on the National Center for Biotechnology Infor-mation’s GenomeTrakr service, an advantage of the port-able, digital nature of genome data [8, 14]. In the UK,since 1 April 2014, Public Health England has been rou-tinely sequencing all Salmonella enterica strains re-ported by hospitals and general practitioners to theSalmonella Reference Service, Colindale. Through inte-gration with this dataset, we determined that the out-break strains formed a distinct cluster, although thiscluster varied by only a single core SNP from cases ob-served elsewhere in the UK.We evaluated two sequencing methodologies in this
study, both capable of providing rapid whole-genome se-quencing information. The MinION senses individual
Non−outbreak Outbreak
0
10
20
30
40
0
10
20
30
10 20 30 40 50 10 20 30 40 50Time (minutes)
Cou
nt o
f spe
cies
−spe
cific
rea
ds
Taxon
g__Salmonella
s__Citrobacter_freundii
s__Phage_Gifsy_2
s__Salmonella_enterica
s__Salmonella_phage_RE_2010
s__Salmonella_phage_ST64B
Fig. 3 Streaming taxonomic assignments from the Oxford Nanopore MinION are shown for an isolate belonging to the outbreak and an isolatenot belonging to the outbreak. Assignments to Salmonella and Salmonella enterica are found within 10 min of starting sequencing for theoutbreak strain and within 20 min for the non-outbreak strain. Phage-specific sequences are detected and are distinct between the non-outbreakand outbreak strain. The non-outbreak strain harbours Salmonella phage ST64B and Gifsy-2, whereas the outbreak strain harbours Salmonellaphage RE2010
Quick et al. Genome Biology (2015) 16:114 Page 5 of 14

Table 1 Streaming alignment statistics from nanopore dataFlowcell Time
(m)Reads Bases Positions Missing
basesCovered(%)
Truepositive
Truenegative
Falsepositive
Falsenegative
Recall Precision Accuracy
Outbreak 60 920 5635627 7091 6463 8.86 10 617 0 2 0.83 1.00 0.09
Outbreak 120 2037 12853716 7091 4815 32.10 26 2237 7 7 0.79 0.79 0.32
Outbreak 180 3040 19297035 7091 3580 49.51 48 3436 13 15 0.76 0.79 0.49
Outbreak 240 3933 24900526 7091 2703 61.88 62 4291 17 19 0.77 0.78 0.61
Outbreak 300 4525 28614437 7091 2236 68.47 70 4736 25 25 0.74 0.74 0.68
Outbreak 360 5654 35848389 7091 1499 78.86 82 5454 26 31 0.73 0.76 0.78
Outbreak 420 6680 42498530 7091 1029 85.49 87 5914 25 37 0.70 0.78 0.85
Outbreak 480 7516 47950926 7091 749 89.44 94 6185 30 34 0.73 0.76 0.89
Outbreak 540 7913 50372188 7091 630 91.12 96 6300 29 37 0.72 0.77 0.90
Outbreak 600 8807 56254898 7091 463 93.47 103 6470 20 36 0.74 0.84 0.93
Outbreak 660 9666 61989423 7091 337 95.25 107 6588 22 38 0.74 0.83 0.94
Outbreak 720 10472 67171497 7091 267 96.23 111 6659 16 39 0.74 0.87 0.95
Outbreak 780 10833 69363106 7091 243 96.57 112 6686 16 35 0.76 0.88 0.96
Outbreak 840 11708 74625788 7091 191 97.31 117 6737 13 34 0.77 0.90 0.97
Outbreak 900 12479 79551399 7091 141 98.01 121 6780 16 34 0.78 0.88 0.97
Outbreak 960 13198 84228957 7091 120 98.31 124 6797 16 35 0.78 0.89 0.98
Outbreak 1020 13579 86600020 7091 107 98.49 125 6808 16 36 0.78 0.89 0.98
Outbreak 1080 14359 91437571 7091 90 98.73 126 6823 17 36 0.78 0.88 0.98
Outbreak 1140 15168 96646434 7091 74 98.96 124 6842 15 37 0.77 0.89 0.98
Outbreak 1200 15835 100970757 7091 70 99.01 123 6851 12 36 0.77 0.91 0.98
Outbreak 1260 16205 103367082 7091 63 99.11 124 6857 11 37 0.77 0.92 0.98
Outbreak 1320 16632 106040214 7091 60 99.15 125 6859 12 36 0.78 0.91 0.98
Outbreak 1380 17184 109618605 7091 56 99.21 125 6863 11 37 0.77 0.92 0.99
Outbreak 1440 17332 110500445 7091 55 99.22 124 6865 11 37 0.77 0.92 0.99
Non-outbreak
60 1268 5382184 7091 6372 10.14 1 717 2 0 1.00 0.33 0.10
Non-outbreak
120 2554 11567191 7091 4791 32.44 2 2284 15 0 1.00 0.12 0.32
Non-outbreak
180 3626 17058822 7091 3451 51.33 4 3607 29 1 0.80 0.12 0.51
Non-outbreak
240 4612 22004574 7091 2500 64.74 11 4545 32 4 0.73 0.26 0.64
Non-outbreak
300 5483 26582592 7091 1760 75.18 13 5281 35 3 0.81 0.27 0.75
Non-outbreak
360 6198 30340527 7091 1330 81.24 15 5705 40 2 0.88 0.27 0.81
Non-outbreak
420 6877 34040490 7091 985 86.11 16 6054 35 2 0.89 0.31 0.86
Non-outbreak
480 7522 37471113 7091 727 89.75 18 6306 37 4 0.82 0.33 0.89
Non-outbreak
540 8306 41387560 7091 552 92.22 18 6483 34 5 0.78 0.35 0.92
Non-outbreak
600 9032 45052523 7091 395 94.43 20 6643 28 6 0.77 0.42 0.94
Non-outbreak
660 9682 48325820 7091 304 95.71 20 6735 27 6 0.77 0.43 0.95
Non-outbreak
720 10262 51312827 7091 262 96.31 20 6783 21 6 0.77 0.49 0.96
Quick et al. Genome Biology (2015) 16:114 Page 6 of 14

DNA strands as they move through a protein nanopore.A unique property of this technology is that sequencedata are available in real time, and analysis can be per-formed on a continuous stream of long reads. Wewished to evaluate the potential impact of a real-timeapproach for analysis of clinical bacterial isolates. Weexploited this feature to perform rapid identification andtyping of genomic DNA prepared from a pure colonyisolate. Given the high error rate reads generated in thisstudy we employed a database of taxon-defining genesfrom microbial species to make bacterial and bacterio-phage identifications [15]. This approach is tolerant oflow-coverage, high-error reads making it useful for real-time analysis of nanopore sequences. However, due tothe higher error rate of this platform, a de novo SNPcalling approach as utilised with MiSeq data would notproduce informative results within the short time scalesof interest here. Other studies have investigated theerror rate and mode of this instrument in greater detail[15, 16, 17]. We show that despite the high error rate, ef-fective genotyping is possible using phylogenetic place-ment techniques. Phylogenetic placement has been usedto good effect in metagenomics studies where only low-coverage data are available, for example in the diagnosis
of infectious diseases from ancient DNA samples, dir-ectly from sputum and from the hospital environment[18–20]. Using this approach, and a simple heuristic al-gorithm to call the most likely genotype it was possibleto reliably place streaming nanopore data onto a refer-ence phylogeny despite the high read error rate. Otherstudies have shown that genotyping accuracy can reach99 % when very high coverage (>120×) is available. Thiswould permit a de novo genotyping approach which didnot rely on phylogenetic placement, as is more typical instudies employing traditional high-throughput sequen-cing [14].Both the draft sequencing protocol presented for the
MiSeq and the real-time evaluation of nanopore sequen-cing demonstrate that these approaches have utility forgenerating data of use in outbreak investigations in lessthan one day (Fig. 6). It is not our intention here to per-form direct comparisons between the instruments in thisstudy, particularly as they are quite different in theirmode of operation.The MiSeq is typically run in a factory-style ‘batch’
mode, where many bacterial samples (up to 100 on aMiSeq, or potentially many hundreds on the larger HiSeqinstrument) are run simultaneously, and processed in
Table 1 Streaming alignment statistics from nanopore data (Continued)
Non-outbreak
780 10845 54417219 7091 202 97.15 21 6845 18 6 0.78 0.54 0.97
Non-outbreak
840 11346 57135819 7091 178 97.49 22 6870 16 6 0.79 0.58 0.97
Non-outbreak
900 11793 59514439 7091 145 97.96 23 6898 18 8 0.74 0.56 0.98
Non-outbreak
960 12192 61590631 7091 111 98.43 22 6932 19 8 0.73 0.54 0.98
Non-outbreak
1020 12571 63597395 7091 99 98.60 22 6944 19 8 0.73 0.54 0.98
Non-outbreak
1080 12926 65415215 7091 87 98.77 21 6959 18 7 0.75 0.54 0.98
Non-outbreak
1140 13263 67138579 7091 71 99.00 22 6976 15 8 0.73 0.59 0.99
Non-outbreak
1200 13594 68911549 7091 62 99.13 22 6985 15 8 0.73 0.59 0.99
Non-outbreak
1260 13881 70408443 7091 59 99.17 22 6992 11 8 0.73 0.67 0.99
Non-outbreak
1320 14186 72080944 7091 53 99.25 23 7001 8 7 0.77 0.74 0.99
Non-outbreak
1380 14471 73573256 7091 44 99.38 23 7008 10 7 0.77 0.70 0.99
Non-outbreak
1440 14683 74801565 7091 40 99.44 23 7012 10 7 0.77 0.70 0.99
The columns show (from left to right): (1) the sample analysed; (2) the cumulative results at this time period (min); (3) the total number of two-direction reads;(4) the total number of nucleotide bases; (5) the total size of the alignment; (6) the number of bases in the alignment missing from the dataset; (7) the percentageof bases in the alignment that can be called; (8) the count of true positives; (9) the count of true negatives; (10) the count of false positives; (11) the countof false negatives; (12) the recall, that is, sensitivity, calculated as TP/(TP + FN); (13) the precision, calculated as TP/(TP + FP); (14) the accuracy, calculated as(TP + TN)/(P + N)
Quick et al. Genome Biology (2015) 16:114 Page 7 of 14

10 20 30 40 50
Time
Flowcell
Outbreak
Non-outbreak
Serovar StrainGallinarum 287/91Gallinarum 9Pullorum S06004Gallinarum/ CDC1983-67Pullorum ATCC 9120Enteritidis 58-6482Enteritidis 436Enteritidis 6.0562-1Enteritidis 13-JanEnteritidis 629164-37Enteritidis 22704Enteritidis 50-5646Enteritidis 653049Enteritidis 607308-16Enteritidis 648904
Montevideo
Typhimurium
Newport
Typhi
Pullorum
Fig. 4 (See legend on next page.)
Quick et al. Genome Biology (2015) 16:114 Page 8 of 14

serial at the end of the instrument operation. This ap-proach reduces the cost of sequencing by taking advantageof the very high output offered from these instruments(>1 terabase for the HiSeq in High Output Mode). Theprecipitous drop in the cost of sequencing bases hasmeant that for bacterial applications the cost of librarypreparation is rapidly becoming the most expensive com-ponent. However, batch methods, particularly with thevery highest output modes result in a flexibility trade-off;such an approach means that data cannot be analyseduntil at least the barcode identifiers have been read (usu-ally not until after halfway through the run).This is in contrast to the real-time sequencing ap-
proach of the MinION whereby individual samples areloaded, and results are generated and analysed in realtime until the results are sufficient to address the clinicalquestion. Such an approach has appealing properties forapplications such as infectious disease diagnostics. Asecond attribute of the MinION that is notable is its ex-treme portability, comparable in size to a USB flashdrive and requiring only a basic laptop to draw powerfrom and connect to. This suggests that it may, inprinciple, be possible in the future to move sequencingcloser to the sample, and particularly when coupled witha culture-independent approach.However, at present the instrument depends on access
to a basic molecular biology laboratory infrastructure,including access to freezer, and basic laboratory equip-ment such as heater blocks and pipettes. The existing li-brary preparation method, although relatively quick, isquite labour-intensive for each sample. Presently there isno method for multiplexing large numbers of bacterialgenomes (as with the MiSeq instrument), nor would thethroughput be amenable to this. Therefore, it seemslikely for large-scale surveillance efforts this platform isnot the obvious choice, for reasons of labour and cost.Instead, we envisage that development of rapid librarypreparation assays will be necessary in order to see thisplatform become usable in a clinical microbiology la-boratory or patient setting in the manner described here.Furthermore, the need for culture enrichment remains
a significant bottleneck for rapid identification of bac-teria and this also applies to other studies employingwhole-genome sequencing. Culturing of Salmonellatakes between 24 h (presumptive diagnosis) and 48 h(pure culture for sequencing). Our approach, which re-lies on sequencing single colonies from each sample, is a
limitation of this and similar studies. However, sequen-cing of four individual colonies from the food trolleydemonstrated very limited heterogeneity with three iso-lates being identical to the majority of other cases in theoutbreak, and one showing two SNP differences. Aculture-free approach for bacterial diagnostics has beenrecently proposed and this would permit detection ofmixed infections as well as cutting down the time to resultsignificantly, for example in the case of direct sequencingof Shiga-toxin producing E. coli from stool samples andM. tuberculosis directly from sputum [21, 22]. However,sequencing mixed communities reduces the genomiccoverage of the pathogenic target of interest, and so forsuch an approach to be successful it is likely to rely ongenerating greater throughput than currently achievableon the MinION. Enrichment for the target organism, mosteasily attained through traditional microbiology culture, istherefore still a required stage.
ConclusionThe combination of rapid prospective sequencing duringan outbreak and detailed characterisation of cases occur-ring on a national scale has potential implications forthe future of outbreak investigation [23]. We describe anovel protocol for draft sequencing on the MiSeq that issufficiently quick to determine whether an outbreak is oc-curring. For this vision to become a reality, further workis needed to enable sharing of data between hospitalsand community practitioners with public health labora-tories. Larger scale integration with national genomedatabases represents the first implementation of a newparadigm for the investigation of outbreaks. The use ofrapid, draft sequencing can delineate the context of anoutbreak very quickly even at lower than usual genomecoverage.
Materials and methodsSample and bacterial culture collectionFaeces samples from patients with diarrhoea were sub-mitted for culture and plated on XLD medium. Pre-sumptive S. enterica isolates were confirmed usingbiochemical tests and O- and H-antigen agglutinationsera and all those identified as S. Enteritidis wereretained for molecular typing. Environmental swabs weretaken from the affected wards within 24 h of the wardclusters being identified and were processed as above.
(See figure on previous page.)Fig. 4 Results of streaming phylogenetic placement from the Oxford Nanopore MinION on a reference tree of representative publishedSalmonella enterica sequences. Common serovars of Salmonella are highlighted. Both outbreak and non-outbreak strains are unambiguouslyidentified as Salmonella enterica serovar Enteritidis by their position on the phylogenetic tree within 50 min. The line demonstrates the potentialrange of placements reported by pplacer. The red placements indicate the positions of the outbreak isolate and the blue placements indicate thepositions of the non-outbreak isolate
Quick et al. Genome Biology (2015) 16:114 Page 9 of 14
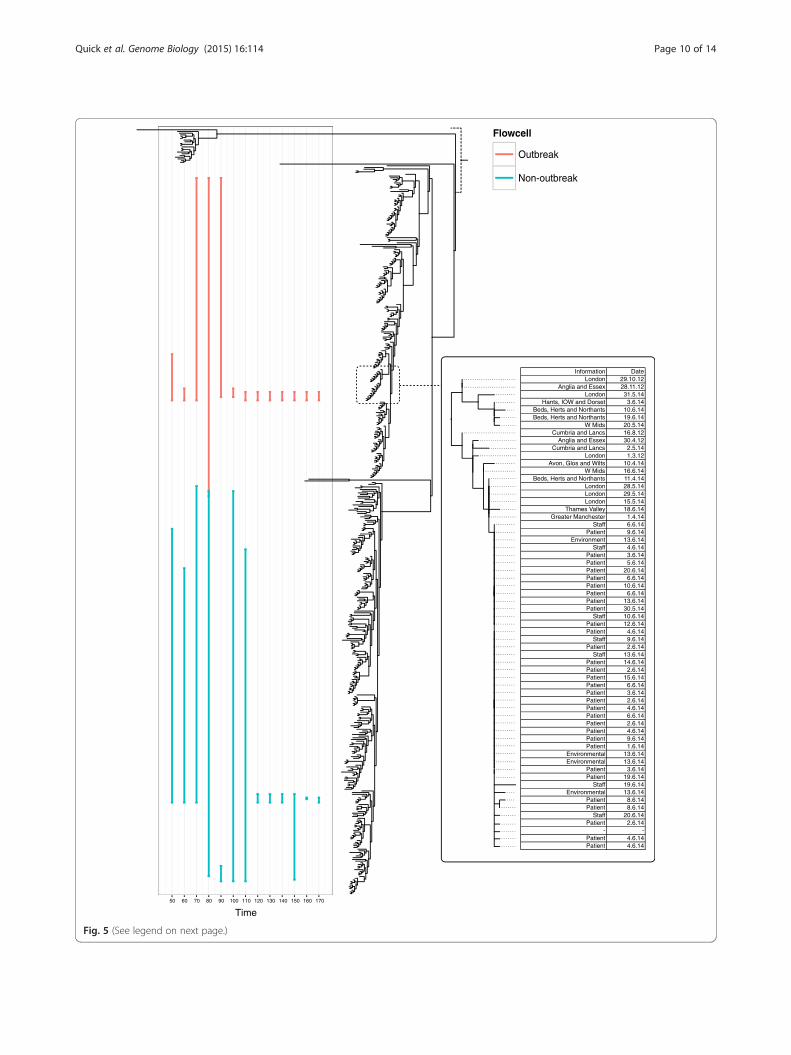
Time
Flowcell
Outbreak
Non-outbreak
Information DateLondon 29.10.12
Anglia and Essex 28.11.12London 31.5.14
Hants, IOW and Dorset 3.6.14Beds, Herts and Northants 10.6.14Beds, Herts and Northants 19.6.14
W Mids 20.5.14Cumbria and Lancs 16.8.12
Anglia and Essex 30.4.12Cumbria and Lancs 2.5.14
London 1.3.12Avon, Glos and Wilts 10.4.14
W Mids 16.6.14Beds, Herts and Northants 11.4.14
London 28.5.14London 29.5.14London 15.5.14
Thames Valley 18.6.14Greater Manchester 1.4.14
Staff 6.6.14Patient 9.6.14
Environment 13.6.14Staff 4.6.14
Patient 3.6.14Patient 5.6.14Patient 20.6.14Patient 6.6.14Patient 10.6.14Patient 6.6.14Patient 13.6.14Patient 30.5.14
Staff 10.6.14Patient 12.6.14Patient 4.6.14
Staff 9.6.14Patient 2.6.14
Staff 13.6.14Patient 14.6.14Patient 2.6.14Patient 15.6.14Patient 6.6.14Patient 3.6.14Patient 2.6.14Patient 4.6.14Patient 6.6.14Patient 2.6.14Patient 4.6.14Patient 9.6.14Patient 1.6.14
Environmental 13.6.14Environmental 13.6.14
Patient 3.6.14Patient 19.6.14
Staff 19.6.14Environmental 13.6.14
Patient 8.6.14Patient 8.6.14
Staff 20.6.14Patient 2.6.14
- -Patient 4.6.14Patient 4.6.14
Fig. 5 (See legend on next page.)
Quick et al. Genome Biology (2015) 16:114 Page 10 of 14

(See figure on previous page.)Fig. 5 Results of streaming phylogenetic placement from the Oxford Nanopore MinION on a reference tree of Salmonella enterica serovarEnteritidis isolates collected by Public Health England during routine surveillance. The left-most panel demonstrates the confident placing of theoutbreak isolate in the outbreak clade within 100 min, and the confident placing of the non-outbreak isolate into a clade containing multipleserotypes of Salmonella within 120 min. The red placements indicate the positions of the outbreak isolate and the blue placements indicate thepositions of the non-outbreak isolate. The right-most panel shows a phylogenetic reconstruction of isolates from the outbreak and their source,set in context of a national outbreak of phage type 14b. Uncertainty in the phylogenetic placement technique is demonstrated early on insequence data collection due to the low accuracy of the variant calls collected. As more data are collected, the number of possible phylogeneticplacements reduces and the confidence values increase (not shown)
Fig. 6 A schematic showing time-to-result for the sequencing analysis strategies used in this study, starting from DNA input
Quick et al. Genome Biology (2015) 16:114 Page 11 of 14

Genomic DNA extractionGenomic DNA was prepared from nutrient agar slopesincubated for 4–18 h at 37 °C. Cells were harvestedusing 100 μL of sterile PBS added to the surface and asterile loop used to emulsify bacteria into a suspensionthat was then pipetted into a sterile Eppendorf tube.This suspension was used to harvest DNA with the‘Invisorb spin cell mini kit’ (Invitek, Germany) accordingto the manufacturer’s instructions. The quantity of DNAin each sample was determined using a Qubit 2.0fluorometer and dsDNA HS assay (Life Technologies,Paisley, UK).
Library preparation for Illumina MiSeq sequencingSequence-ready libraries were generated from 1 ng DNAper sample using the Nextera XT library preparation kit(Illumina, Great Chesterford, UK) according to the man-ufacturer’s instructions.
Rapid draft sequencing on the Illumina MiSeqIn order to provide results for an emergency infectioncontrol meeting the next morning, we adapted thestandard sequencing protocol on the Illumina MiSeq torapidly generate sufficient data to analyse 16 strains. Weutilised a standard V3 600-cycle reagent kit. By modify-ing the recipe files on the instrument we reduced thechemistry time by 40 s per cycle and the number of tilesimaged by 50 %. This resulted in a cycle time of approxi-mately 3 min per cycle and allowed 75 base single-readsequencing with dual barcoding to complete within 6 h.We chose 75 base reads as a trade-off between expectedgenome coverage and available time in order to haveresults available sufficiently quickly for analysis. Thesequencing protocol can be downloaded from [24].
Standard sequencing on Illumina MiSeq and HiSeqLater in the outbreak isolates were sequenced usingthe Illumina MiSeq with standard V3 protocol at theUniversity of Birmingham, UK, also prepared withNextera XT reagents. In addition, some outbreak isolateswere sequenced on the Illumina HiSeq 2500 with TruSeqV3 reagents as part of the Public Health England (PHE)WGS sequencing pipeline at Colindale, UK (Additionalfile 1: Table S1).
Phylogenetic reconstruction from draft sequencingBefore being mapped against the reference genomeS. Enteritidis P125109 (PRJNA59247) with BWA-MEM(version 0.7.5), 75 base single-read data generated bydraft sequencing on the Illumina MiSeq was adapterand quality trimmed with Trimmomatic [25, 26]. Singlenucleotide polymorphisms (SNPs) were called usingsamtools mpileup (version 0.1.18) and VarScan (version2.3.6), specifying a minimum read depth of 2 [27, 28].
Filtered SNPs (those positions with an allele frequencyof >80 % to call a variant or <20 % to call the referencebase in all samples) were extracted to make a concatenatedFASTA alignment. FastTree (version 2.1.7) was used togenerate an approximate maximum likelihood phylo-genetic tree [29]. Phyloviz was used to produce mini-mum spanning tree reconstructions [30]. Functionalannotation of these variants was performed using snpEff(version 3.1) [31].
Phylogenetic reconstruction from PHE surveillancesequencingBefore being mapped against the reference genome S.Enteritidis AM933172 (PRJEA30687) with BWA-MEM,100 base pair paired-end data generated on the IlluminaHiSeq 2500 was adapter and quality trimmed [26]. SNPswere called using GATK [32]. High quality SNPs (>10-foldcoverage, >30 mapping quality, 90 % consensus) wereselected and uploaded into SNPdatabase (SNPdb). Thisis an in-house PostgreSQL database containing genomeposition and variant base for each SNP and low quality/missing positions for all S. Enteritidis eBURST group 4(EBG 4) isolates sequenced by PHE. SNPs in the coregenome of the strain set being analysed were extractedfrom an in-house SNPdb and FastTree was used toderive approximate maximum likelihood phylogenetictrees. Annotation data came from the in-house PHEGastroDataWarehouse (GDW).Due to the clinical interest in these cases, strains with
below standard sequencing depth (30×) were analysedand this had no impact on the analysis outcome, withidentical tree topologies detected in all cases.
Real-time sequencing on the MinIONAn outbreak and a non-outbreak isolate, as determinedby earlier MiSeq sequencing, were chosen for sequen-cing on the MinION (Oxford Nanopore Technologies,Oxford, UK) to assess its suitability for future outbreakinvestigations. High-molecular weight input DNA (1 μg)was fragmented using a Covaris G-Tube (Covaris, Wo-burn, USA) at 5,000 rpm in a centrifuge. FragmentedDNA was end-repaired using the NEB repair module(New England Biolabs, Ipswich, USA), then cleaned-upusing SPRI beads with a ratio of 1:1 beads to reactionmixture. End-repaired DNA was then A-tailed using theNEB A-tailing module. Following this a sequence-readylibrary was generated using the gDNA sequencing kitand protocol provided as part of the MinION accessprogram (MAP). The diluted library (150 μL) was loadedinto the MinION flowcell via the sample loading port. A72-h sequencing protocol was initiated using theMinION control software, MinKNOW (version 0.45.2.6).Read event data were base-called by the software Metri-chor (version 0.16.37960) using workflow 1.0.2_R7. The
Quick et al. Genome Biology (2015) 16:114 Page 12 of 14

FASTA sequences and strand translocation times wereextracted for further analysis using the poretools FASTAextraction function [33]. All sequence data are depositedinto the Short Read Archive (SRA) with study referenceERP006904 (MinION data) and ERP007194 (Illuminadata).
Species identification from nanopore readsIdentification of bacterial and viral species present ineach sample was carried out using an alignment methodto the MetaPhlAn 2 database of taxon-defining markergenes [33]. First, the database was extracted into FASTAformat using the fastacmd utility supplied with NCBIBLAST. Alignment of nanopore reads was performedusing the LAST package (version 475), invoking lastalwith custom settings as per Quick et al. [15], using agap creation penalty and extension of 1 and a mismatchpenalty of 2 (match score 1), corresponding to commandline arguments -a1 -b1 -q2.
Subspecies level classification from nanopore readsSerovars of S. enterica can often be assigned by phylo-genetic methods. A phylogenetic reference tree was cre-ated from the available draft or complete Salmonellaenterica genomes in RefSeq. From each of the sequences600,000 simulated paired-end reads were generatedusing wgsim (version 0.3.1) [34]. These were mappedagainst the reference genome S. Typhimurium LT2(PRJNA57799) with BWA-MEM (version 0.7.5) [26].samtools mpileup (version 0.1.18) and VarScan (version2.3.6) were used to call variants [27, 28]. Variant filteringwas done using filter_non_discriminatory_variants.py[35] in order to remove non-discriminatory positions, aswell as heterozygous positions and regions of putativerecombination. Variant alleles for each sample wereconcatenated into a fasta file using vcf2phyloviz.py [36].This file was de-duplicated using the mogrify command inseqmagick (version 0.6.0) to remove identical sequenceswhich can affect placements. A phylogenetic reconstructionwas created using FastTree (version 2.1.7) following a gen-eralised time reversible model, after which taxtastic (version0.5.1) was used to build the reference package [37].To determine the subspecies level classification from
the nanopore sequencing data, the reads were mappedagainst the reference genome with lastal with settings-a1 -b1 -q2. For each read, the highest scoring alignmentwas taken before being converted into BAM formatusing samtools. Using samtools mpileup and the scriptget_alleles_from_pileup.py the alignment was interro-gated at all coordinates used for the reference tree.Aligned bases at these coordinates were counted and thedominant allele was used if at least two concordant baseswere in the alignment. Alleles were concatenated intoan alignment. Gap characters were used to represent
uncertain positions not meeting the above criteria. Thephylogenetic placement utility, pplacer, was used toplace the sequence onto the reference tree producing afile containing the most likely position and logML prob-ability for this placement. Placements with a likelihoodvalue of greater than −500 were excluded [37]. This place-ment process was repeated for the read dataset availableat each timepoint (10 min apart). New reads generatedduring each 10 min time interval were mapped to the ref-erence, converted to a BAM file and merged with theBAM file generated at the previous time period.
S. enterica outbreak reconstructionAs with the subspecies level classification, phylogeneticplacement can be used as a method for classifying sam-ples in or out of an ongoing outbreak and in a nationaland international context. In order to do this, we lever-aged the routine surveillance sequencing of S. entericaby PHE using 575 S. Enteritidis genomes of phage type14b. Using the method described above a phylogeneticreference tree was created for these genomes (448remained after de-duplication) before the nanopore se-quences were placed onto the tree to predict whether ornot they belonged to the outbreak cluster.
Additional file
Additional file 1: Table S1. Isolate identifiers sequenced in this studyusing rapid draft MiSeq sequencing, standard MiSeq sequencing andHiSeq sequencing during routine PHE surveillance.
Competing interestsNJL is a member of the MinION Access Programme (MAP) and has receivedfree-of-charge reagents for nanopore sequencing presented in this study.JQ has received travel and accommodation expenses to speak at an OxfordNanopore-organised symposium. NJL and JQ have ongoing researchcollaborations with Oxford Nanopore but do not receive financialcompensation for this.
Authors’ contributionsNJL, ER and PH conceived the study. CC, SG, JH, SN, K. Neal, K. Nye, TP, EdP,ER, KS, AC, TD and PH performed the microbiological and epidemiologicalinvestigation. MW performed DNA extractions. SC and JQ performedsequencing. JQ, PA, TD, ER, PH and NJL analysed data. NJL, TD, PH and MWcontributed reagents. NJL, PH and JQ wrote the manuscript. All authors readand approved the final manuscript.
AcknowledgementsThank you to the staff of Heartlands Hospital for assistance in thisinvestigation. We are grateful to Paul Keim of Northern Arizona University forintroducing us to phylogenetic placement techniques. We thank TorstenSeemann of Monash University, Australia for critical reading of themanuscript. We are grateful to the staff of Oxford Nanopore Technologies foradmission to the MinION Early Access Programme and instrument andsoftware technical support. NJL is funded by a Medical Research CouncilSpecial Training Fellowship in Biomedical Informatics. JQ is funded by theNIHR Surgical Reconstruction and Microbiology Research Centre. The CloudInfrastructure for Microbial Bioinformatics (CLIMB) cyberinfrastructure wasused for the data analysis presented in this manuscript. The authors wouldlike to thank the anonymous reviewers of this paper for their constructivefeedback during the peer-review process.
Quick et al. Genome Biology (2015) 16:114 Page 13 of 14

Author details1Institute of Microbiology and Infection, University of Birmingham,Birmingham B15 2TT, UK. 2NIHR Surgical Reconstruction and MicrobiologyResearch Centre, University of Birmingham, Birmingham B15 2TT, UK. 3PublicHealth England, Colindale, London, UK. 4Public Health England, FieldEpidemiology Service (Birmingham Office), Birmingham, UK. 5Public HealthEngland Birmingham Public Health Laboratory, Heart of England NHS Trust,Birmingham, UK. 6Department of Microbiology, University of Warwick,Warwick, UK. 7Medical Directorate, Heart of England NHS Trust, Birmingham,UK.
Received: 25 February 2015 Accepted: 14 May 2015
References1. Scallan E, Hoekstra RM, Angulo FJ, Tauxe RV, Widdowson M-A, Roy SL, et al.
Foodborne illness acquired in the United States–major pathogens. EmergInfect Dis. 2011;17:7–15.
2. O’Brien SJ. The “decline and fall” of nontyphoidal salmonella in the UnitedKingdom. Clin Infect Dis. 2013;56:705–10.
3. Telzak EE, Budnick LD, Greenberg MS, Blum S, Shayegani M, Benson CE,et al. A nosocomial outbreak of Salmonella enteritidis infection due to theconsumption of raw eggs. N Engl J Med. 1990;323:394–7.
4. Palmer SR, Rowe B. Investigation of outbreaks of salmonella in hospitals.Br Med J (Clin Res Ed). 1983;287:891–3.
5. Mason BW, Williams N, Salmon RL, Lewis A, Price J, Johnston KM, et al.Outbreak of Salmonella indiana associated with egg mayonnaisesandwiches at an acute NHS hospital. Commun Dis Public Health.2001;4:300–4.
6. Department of Health and Social Security. Report of the committee ofinquiry into an outbreak of food poisoning at Stanley Royd Hospital.London: HMSO; 1986.
7. Lienau EK, Strain E, Wang C, Zheng J, Ottesen AR, Keys CE, et al.Identification of a salmonellosis outbreak by means of molecularsequencing. N Engl J Med. 2011;364:981–2.
8. Loman NJ, Misra RV, Dallman TJ, Constantinidou C, Gharbia SE, Wain J, et al.Performance comparison of benchtop high-throughput sequencingplatforms. Nat Biotechnol. 2012;30:434–9.
9. Reuter S, Ellington MJ, Cartwright EJP, Köser CU, Török ME, Gouliouris T,et al. Rapid bacterial whole-genome sequencing to enhance diagnostic andpublic health microbiology. JAMA Intern Med. 2013;173:1397–404.
10. Eyre DW, Golubchik T, Gordon NC, Bowden R, Piazza P, Batty EM, et al.A pilot study of rapid benchtop sequencing of Staphylococcus aureus andClostridium difficile for outbreak detection and surveillance. BMJ Open.2012;2:e001124.
11. Janmohamed K, Zenner D, Little C, Lane C, Wain J, Charlett A, et al. Nationaloutbreak of Salmonella Enteritidis phage type 14b in England, September toDecember 2009: case–control study. Euro Surveill. 2011;16:19840.
12. European Centre for Disease Prevention and Control, European Food SafetyAuthority. Multi-country outbreak of Salmonella Enteritidis infectionsassociated with consumption of eggs from Germany – 25 August 2014.Stockholm and Parma: ECDC/EFSA; 2014. http://www.efsa.europa.eu/en/supporting/pub/646e.htm.
13. Schmid H, Baumgartner A. Epidemiology of infections with entericsalmonellae in Switzerland with particular consideration of travellingactivities. Swiss Med Wkly. 2013;143:w13842.
14. den Bakker HC, Allard MW, Bopp D, Brown EW, Fontana J, Iqbal Z, et al.Rapid whole-genome sequencing for surveillance of Salmonella entericaserovar enteritidis. Emerg Infect Dis. 2014;20:1306–14.
15. Segata N, Waldron L, Ballarini A, Narasimhan V, Jousson O, Huttenhower C.Metagenomic microbial community profiling using unique clade-specificmarker genes. Nat Methods. 2012;9:811–4.
16. Ashton PM, Nair S, Dallman T, Rubino S, Rabsch W, Mwaigwisya S, et al.MinION nanopore sequencing identifies the position and structure of abacterial antibiotic resistance island. Nat Biotechnol. 2015;33:296–300.
17. Jain M, Fiddes IT, Miga KH, Olsen HE, Paten B, Akeson M. Improved dataanalysis for the MinION nanopore sequencer. Nat Methods. 2015;12:351–6.
18. Kay GL, Sergeant MJ, Giuffra V, Bandiera P, Milanese M, Bramanti B, et al.Recovery of a medieval Brucella melitensis genome using shotgunmetagenomics. MBio. 2014;5:e01337–14.
19. Doughty EL, Sergeant MJ, Adetifa I, Antonio M, Pallen MJ. Culture-independent detection and characterisation of Mycobacterium tuberculosisand M. africanum in sputum samples using shotgun metagenomics on abenchtop sequencer. Peer J. 2014;2:e585.
20. Quick J, Cumley N, Wearn CM, Niebel M, Constantinidou C, Thomas CM.Seeking the source of Pseudomonas aeruginosa infections in a recentlyopened hospital: an observational study using whole-genome sequencing.BMJ Open. 2014;4:e006278.
21. Loman NJ, Constantinidou C, Christner M, Rohde H, Chan JZ-M, Quick J,et al. A culture-independent sequence-based metagenomics approach tothe investigation of an outbreak of Shiga-toxigenic Escherichia coli O104:H4.JAMA. 2013;309:1502–10.
22. Chan JZ-M, Sergeant MJ, Lee OY-C, Minnikin DE, Besra GS, Pap I, et al.Metagenomic analysis of tuberculosis in a mummy. N Engl J Med.2013;369:289–90.
23. Snitkin ES, Zelazny AM, Thomas PJ, Stock F, NISC Comparative SequencingProgram Group, Henderson DK, et al. Tracking a hospital outbreak ofcarbapenem-resistant Klebsiella pneumoniae with whole-genome sequencing.Sci Transl Med. 2012;4:148ra116.
24. Quick J. MiSeq. Draft Sequencing Protocol. https://github.com/joshquick/miseq-draft-sequencing
25. Bolger AM, Lohse M, Usadel B. Trimmomatic: a flexible trimmer for Illuminasequence data. Bioinformatics. 2014;30:2114–20.
26. Li H, Durbin R. Fast and accurate long-read alignment with Burrows-Wheeler transform. Bioinformatics. 2010;26:589–95.
27. Li H, Handsaker B, Wysoker A, Fennell T, Ruan J, Homer N, et al. Thesequence alignment/Map format and SAMtools. Bioinformatics.2009;25:2078–9.
28. Koboldt DC, Zhang Q, Larson DE, Shen D, McLellan MD, Lin L, et al. VarScan2: somatic mutation and copy number alteration discovery in cancer byexome sequencing. Genome Res. 2012;22:568–76.
29. Price MN, Dehal PS, Arkin AP. FastTree 2–approximately maximum-likelihoodtrees for large alignments. PLoS One. 2010;5:e9490.
30. Francisco AP, Vaz C, Monteiro PT, Melo-Cristino J, Ramirez M, Carriço JA.PHYLOViZ: phylogenetic inference and data visualization for sequencebased typing methods. BMC Bioinformatics. 2012;13:87.
31. Cingolani P, Platts A, Wang LL, Coon M, Nguyen T, Wang L, et al. A programfor annotating and predicting the effects of single nucleotidepolymorphisms, SnpEff: SNPs in the genome of Drosophila melanogasterstrain w1118; iso-2; iso-3. Fly (Austin). 2012;6:80–92.
32. DePristo MA, Banks E, Poplin R, Garimella KV, Maguire JR, Hartl C, et al.A framework for variation discovery and genotyping using next-generationDNA sequencing data. Nat Genet. 2011;43:491–8.
33. Loman NJ, Quinlan AR. Poretools: a toolkit for analyzing nanopore sequencedata. Bioinformatics. 2014;30:3399–401.
34. Li H. wgsim Github repository. https://github.com/lh3/wgsim.35. Quick J. Github repository. https://github.com/joshquick.36. Loman NJ. Github repository. https://github.com/nickloman/misc-genomics-tools.37. Matsen FA, Kodner RB, Armbrust EV. pplacer: linear time maximum-likelihood
and Bayesian phylogenetic placement of sequences onto a fixed reference tree.BMC Bioinformatics. 2010;11:538.
Submit your next manuscript to BioMed Centraland take full advantage of:
• Convenient online submission
• Thorough peer review
• No space constraints or color figure charges
• Immediate publication on acceptance
• Inclusion in PubMed, CAS, Scopus and Google Scholar
• Research which is freely available for redistribution
Submit your manuscript at www.biomedcentral.com/submit
Quick et al. Genome Biology (2015) 16:114 Page 14 of 14

57
4 Real-time, portable genome sequencing for Ebola surveillance
4.1 Author contributions
N.J.L., J.Q., M.K.O’S., D.W., S.G., M.W.C. conceived the study. N.J.L., J.Q.,
M.K.O’S., S.A.W., J.T., P.R., D.T. designed the lab in a suitcase and laboratory
protocol and initial validation. J.Q., S.D., L.C., J.A.B., R.K., L.E.K., and A.Ma.
performed MinION sequencing. N.J.L., J.Q. and J.T.S. performed bioinformatics
analysis and wrote software. N.J.L., J.Q., S.D., E.S., P.F., L.C., A.Mi., N.M. and I.R.
analysed the data. G.D., A.R., N.J.L., J.Q. and G.P. performed phylogenetic analysis.
N.J.L., J.Q., S.D., M.W.C., S.G., M.K.O’S., A.R., E.S., P.F., I.R., A.Mi., and L.C.
wrote the manuscript.
4.2 Author contributions (additional detail)
J.Q. developed the amplicon sequencing strategy, the lab in a suitcase, generated the
early field sequencing data in Guinea and the validation data at PHE. J.Q. supported the
bioinformatics analysis. J.Q. drafted all figures and contributed to the writing of the
manuscript.
4.3 Abstract

58
The Ebola virus outbreak was the largest on record and responsible for the deaths of
more than 11,000 people. Genome sequencing has become an important tool in
response to viral outbreaks as it can provide a high-resolution view of pathogen
evolution. We developed a portable ‘lab-in-a-suitcase’ capable of generating Ebola
virus genomes sequences in the field using the portable MinION sequencer. By
performing the sequencing close to the samples we were able to reduce processing time
to as little as 24 hours. In this way we could provide an up-to-date view of the outbreak
to the Ebola national coordination team in Guinea over an 8-month period until the
outbreak was declared over. This information could identify new cases as being part of
known chains of transmissions which generally clustered geographically but
occasionally were transmitted over large distances. Genome sequences were integrated
in real-time with another group performing sequencing in neighbouring Sierra Leone
allowing us to identify multiple cross-border transmission events. In total 142 genome
sequences were generated and shared online at regular intervals through Github. The
Ebola outbreak is the most highly sampled outbreak in history with over 5% of known
cases sequenced and despite the magnitude of the tragedy we hope this can become a
blueprint for future outbreak responses.
4.4 Published manuscript

2 2 8 | N A T U R E | V O L 5 3 0 | 1 1 F E B R U A R Y 2 0 1 6
LETTERdoi:10.1038/nature16996
Real-time, portable genome sequencing for Ebola surveillanceJoshua Quick1*, Nicholas J. Loman1*, Sophie Duraffour2,3*, Jared T. Simpson4,5*, Ettore Severi6*, Lauren Cowley7*, Joseph Akoi Bore2, Raymond Koundouno2, Gytis Dudas8, Amy Mikhail7, Nobila Ouédraogo9, Babak Afrough2,10, Amadou Bah2,11, Jonathan H. J. Baum2,3, Beate Becker-Ziaja2,3, Jan Peter Boettcher2,12, Mar Cabeza-Cabrerizo2,3, Álvaro Camino-Sánchez2, Lisa L. Carter2,13, Juliane Doerrbecker2,3, Theresa Enkirch2,14, Isabel García-Dorival2,15, Nicole Hetzelt2,12, Julia Hinzmann2,12, Tobias Holm2,3, Liana Eleni Kafetzopoulou2,16, Michel Koropogui2,17, Abigael Kosgey2,18, Eeva Kuisma2,10, Christopher H. Logue2,10, Antonio Mazzarelli2,19, Sarah Meisel2,3, Marc Mertens2,20, Janine Michel2,12, Didier Ngabo2,10, Katja Nitzsche2,3, Elisa Pallasch2,3, Livia Victoria Patrono2,3, Jasmine Portmann2,21, Johanna Gabriella Repits2,22, Natasha Y. Rickett2,15,23, Andreas Sachse2,12, Katrin Singethan2,24, Inês Vitoriano2,10, Rahel L. Yemanaberhan2,3, Elsa G. Zekeng2,15,23, Trina Racine25, Alexander Bello25, Amadou Alpha Sall26, Ousmane Faye26, Oumar Faye26, N’Faly Magassouba27, Cecelia V. Williams28,29, Victoria Amburgey28,29, Linda Winona28,29, Emily Davis29,30, Jon Gerlach29,30, Frank Washington29,30, Vanessa Monteil31, Marine Jourdain31, Marion Bererd31, Alimou Camara31, Hermann Somlare31, Abdoulaye Camara31, Marianne Gerard31, Guillaume Bado31, Bernard Baillet31, Déborah Delaune32,33, Koumpingnin Yacouba Nebie34, Abdoulaye Diarra34, Yacouba Savane34, Raymond Bernard Pallawo34, Giovanna Jaramillo Gutierrez35, Natacha Milhano6,36, Isabelle Roger34, Christopher J. Williams6,37, Facinet Yattara17, Kuiama Lewandowski10, James Taylor38, Phillip Rachwal38, Daniel J. Turner39, Georgios Pollakis15,23, Julian A. Hiscox15,23, David A. Matthews40, Matthew K. O’Shea41, Andrew McD. Johnston41, Duncan Wilson41, Emma Hutley42, Erasmus Smit43, Antonino Di Caro2,19, Roman Wölfel2,44, Kilian Stoecker2,44, Erna Fleischmann2,44, Martin Gabriel2,3, Simon A. Weller38, Lamine Koivogui45, Boubacar Diallo34, Sakoba Keïta17, Andrew Rambaut8,46,47, Pierre Formenty34, Stephan Günther2,3 & Miles W. Carroll2,10,48,49
The Ebola virus disease epidemic in West Africa is the largest on record, responsible for over 28,599 cases and more than 11,299 deaths1. Genome sequencing in viral outbreaks is desirable to characterize the infectious agent and determine its evolutionary rate. Genome sequencing also allows the identification of signatures of host adaptation, identification and monitoring of diagnostic targets, and characterization of responses to vaccines and treatments. The Ebola virus (EBOV) genome substitution rate in the Makona strain has been estimated at between 0.87 × 10⁻³ and 1.42 × 10⁻³ mutations per site per year. This is equivalent to 16–27 mutations in each genome, meaning that sequences diverge rapidly enough to identify distinct sub-lineages during a prolonged epidemic2–7. Genome sequencing provides a high-resolution view of pathogen evolution and is increasingly sought after for outbreak surveillance. Sequence data may be used to guide control measures, but only if the results are generated quickly enough to inform interventions8. Genomic surveillance during the epidemic has been sporadic
owing to a lack of local sequencing capacity coupled with practical difficulties transporting samples to remote sequencing facilities9. To address this problem, here we devise a genomic surveillance system that utilizes a novel nanopore DNA sequencing instrument. In April 2015 this system was transported in standard airline luggage to Guinea and used for real-time genomic surveillance of the ongoing epidemic. We present sequence data and analysis of 142 EBOV samples collected during the period March to October 2015. We were able to generate results less than 24 h after receiving an Ebola-positive sample, with the sequencing process taking as little as 15–60 min. We show that real-time genomic surveillance is possible in resource-limited settings and can be established rapidly to monitor outbreaks.
© 2016 Macmillan Publishers Limited. All rights reserved

1 1 F E B R U A R Y 2 0 1 6 | V O L 5 3 0 | N A T U R E | 2 2 9© 2016 Macmillan Publishers Limited. All rights reserved

2 3 0 | N A T U R E | V O L 5 3 0 | 1 1 F E B R U A R Y 2 0 1 6© 2016 Macmillan Publishers Limited. All rights reserved

1 1 F E B R U A R Y 2 0 1 6 | V O L 5 3 0 | N A T U R E | 2 3 1© 2016 Macmillan Publishers Limited. All rights reserved

2 3 2 | N A T U R E | V O L 5 3 0 | 1 1 F E B R U A R Y 2 0 1 6© 2016 Macmillan Publishers Limited. All rights reserved

© 2016 Macmillan Publishers Limited. All rights reserved

© 2016 Macmillan Publishers Limited. All rights reserved

© 2016 Macmillan Publishers Limited. All rights reserved

© 2016 Macmillan Publishers Limited. All rights reserved

© 2016 Macmillan Publishers Limited. All rights reserved

© 2016 Macmillan Publishers Limited. All rights reserved

© 2016 Macmillan Publishers Limited. All rights reserved

© 2016 Macmillan Publishers Limited. All rights reserved

© 2016 Macmillan Publishers Limited. All rights reserved

© 2016 Macmillan Publishers Limited. All rights reserved

© 2016 Macmillan Publishers Limited. All rights reserved

© 2016 Macmillan Publishers Limited. All rights reserved

W W W. N A T U R E . C O M / N A T U R E | 1

2 | W W W. N A T U R E . C O M / N A T U R E

W W W. N A T U R E . C O M / N A T U R E | 3

4 | W W W. N A T U R E . C O M / N A T U R E

W W W. N A T U R E . C O M / N A T U R E | 5

6 | W W W. N A T U R E . C O M / N A T U R E

59
5 Multiplex PCR method for MinION and Illumina sequencing of
Zika and other virus genomes directly from clinical samples
5.1 Author contributions
J.Q. and N.J.L. conceived the project. J.Q., N.D.G., K.G.A. and N.J.L. designed the
experiments and wrote the manuscript. J.Q., A.D.S. and O.G.P. built the online primer
design tool. All authors have read and approved the contents of the manuscript.
5.2 Author contributions (additional detail)
J.Q. developed the primer design tool, developed the laboratory protocol and performed
the MinION validation experiments. J.Q. drafted the manuscript and all figures.
5.3 Abstract
Generating viral genomes from clinical samples can be challenging when the viral
nucleic acid is present in very small amounts compared to a high background of host
material. Zika virus infection produces a mild viremia and people often present to a
physician after the peak viral load. The viral titre of typical Zika virus positive clinical
samples is too low for metagenomic sequencing which when tested yielded small
numbers of reads and incomplete genome coverage for a set of five clinical isolates. We
instead developed a method for generation of many short overlapping amplicons in a

60
multiplex reaction. In order to simplify this process we built an online primer tool
(primal.zibraproject.org) which automates the design procedure. We developed reaction
conditions which could successfully generate amplicons covering most of the genome
from real clinical samples up to Ct 36 representing very high sensitivity. We sequenced
these amplicons using barcoding on the Oxford Nanopore MinION which reduced the
cost to around $50 per sample when 12 samples were multiplexed on a single MinION
flowcell. We produced a Docker container which enabling the generation of consensus
sequences in a single pipeline which can be run on a laptop computer making it ideal for
field situations. The general method is applicable to other viruses and we demonstrate
the results of sequencing of Chikungunya virus reference material. Amplicon
sequencing is a very sensitive method which makes it suitable for Zika virus sequencing
however it has drawbacks including a reduction in efficiency when mismatches occur in
primer binding sites, especially those close to the 3' end. This multiplex amplicon
sequencing a useful tool in outbreak situations when strains are expected to be highly
isogenic. It represents a robust and cost-effective method that can be performed in a day
by someone who possesses basic molecular biology skills and we hope it will be useful
method in future outbreaks.
5.4 Published manuscript

©20
17 M
acm
illan
Pub
lishe
rs L
imite
d, p
art o
f Spr
inge
r N
atur
e. A
ll ri
ghts
res
erve
d.
© 2017 Macmillan Publishers Limited, part of Springer Nature. All rights reserved.
PROTOCOL
NATURE PROTOCOLS | VOL.12 NO.6 | 2017 | 1261
Multiplex PCR method for MinION and Illumina sequencing of Zika and other virus genomes directly from clinical samplesJoshua Quick1, Nathan D Grubaugh2 , Steven T Pullan3 , Ingra M Claro4 , Andrew D Smith1, Karthik Gangavarapu2 , Glenn Oliveira5 , Refugio Robles-Sikisaka2 , Thomas F Rogers2 ,6 , Nathan A Beutler2 , Dennis R Burton2 , Lia Laura Lewis-Ximenez7 , Jaqueline Goes de Jesus8 , Marta Giovanetti8 ,9 , Sarah C Hill10 , Allison Black11,12 , Trevor Bedford11, Miles W Carroll3 ,13 , Marcio Nunes14 , Luiz Carlos Alcantara Jr.8 , Ester C Sabino4 , Sally A Baylis15 , Nuno R Faria10 , Matthew Loose16 , Jared T Simpson17 , Oliver G Pybus10 , Kristian G Andersen2 ,5 & Nicholas J Loman1
1Institute of Microbiology and Infection, School of Biosciences, University of Birmingham, Birmingham, UK. 2The Scripps Research Institute, La Jolla, California, USA. 3Public Health England, National Infection Service, Porton Down, Salisbury, UK. 4Department of Infectious Disease and Institute of Tropical Medicine, University of Saõ Paulo, Saõ Paulo, Brazil. 5Scripps Translational Science Institute, La Jolla, California, USA. 6Massachusetts General Hospital, Boston, Massachusetts, USA. 7Instituto Oswaldo Cruz, Fundação Oswaldo Cruz, Rio de Janeiro, Brazil. 8Fundação Oswaldo Cruz (FIOCRUZ), Salvador, Brazil. 9University of Rome, Tor Vergata, Italy. 10Department of Zoology, University of Oxford, Oxford, UK. 11Vaccine and Infectious Disease Division, Fred Hutchinson Cancer Research Center, Seattle, Washington, USA. 12Department of Epidemiology, University of Washington, Seattle, Washington, USA. 13University of Southampton, South General Hospital, Southampton, UK. 14Instituto Evandro Chagas, Belem, Brazil. 15Paul-Ehrlich-Institut, Langen, Germany. 16DeepSeq, School of Life Sciences, University of Nottingham, Nottingham, UK. 17OICR, Toronto, Canada. Correspondence should be addressed to N.J.L. .
Published online 24 May 2017; doi:10.1038/nprot.2017.066
Genome sequencing has become a powerful tool for studying emerging infectious diseases; however, genome sequencing directly from clinical samples (i.e., without isolation and culture) remains challenging for viruses such as Zika, for which metagenomic sequencing methods may generate insufficient numbers of viral reads. Here we present a protocol for generating coding-sequence-complete genomes, comprising an online primer design tool, a novel multiplex PCR enrichment protocol, optimized library preparation methods for the portable MinION sequencer (Oxford Nanopore Technologies) and the Illumina range of instruments, and a bioinformatics pipeline for generating consensus sequences. The MinION protocol does not require an Internet connection for analysis, making it suitable for field applications with limited connectivity. Our method relies on multiplex PCR for targeted enrichment of viral genomes from samples containing as few as 50 genome copies per reaction. Viral consensus sequences can be achieved in 1–2 d by starting with clinical samples and following a simple laboratory workflow. This method has been successfully used by several groups studying Zika virus evolution and is facilitating an understanding of the spread of the virus in the Americas. The protocol can be used to sequence other viral genomes using the online Primal Scheme primer designer software. It is suitable for sequencing either RNA or DNA viruses in the field during outbreaks or as an inexpensive, convenient method for use in the lab.

©20
17 M
acm
illan
Pub
lishe
rs L
imite
d, p
art o
f Spr
inge
r N
atur
e. A
ll ri
ghts
res
erve
d.
© 2017 Macmillan Publishers Limited, part of Springer Nature. All rights reserved.
1262 | VOL.12 NO.6 | 2017 | NATURE PROTOCOLS
© 2017 Macmillan Publishers Limited, part of Springer Nature. All rights reserved.

© 2017 Macmillan Publishers Limited, part of Springer Nature. All rights reserved. © 2017 Macmillan Publishers Limited, part of Springer Nature. All rights reserved.
NATURE PROTOCOLS | VOL.12 NO.6 | 2017 | 1263

© 2017 Macmillan Publishers Limited, part of Springer Nature. All rights reserved.
1264 | VOL.12 NO.6 | 2017 | NATURE PROTOCOLS
© 2017 Macmillan Publishers Limited, part of Springer Nature. All rights reserved.

© 2017 Macmillan Publishers Limited, part of Springer Nature. All rights reserved. © 2017 Macmillan Publishers Limited, part of Springer Nature. All rights reserved.
NATURE PROTOCOLS | VOL.12 NO.6 | 2017 | 1265

©20
17 M
acm
illan
Pub
lishe
rs L
imite
d, p
art o
f Spr
inge
r N
atur
e. A
ll ri
ghts
res
erve
d.
© 2017 Macmillan Publishers Limited, part of Springer Nature. All rights reserved.
1266 | VOL.12 NO.6 | 2017 | NATURE PROTOCOLS
© 2017 Macmillan Publishers Limited, part of Springer Nature. All rights reserved.

© 2017 Macmillan Publishers Limited, part of Springer Nature. All rights reserved. © 2017 Macmillan Publishers Limited, part of Springer Nature. All rights reserved.
NATURE PROTOCOLS | VOL.12 NO.6 | 2017 | 1267

© 2017 Macmillan Publishers Limited, part of Springer Nature. All rights reserved.
1268 | VOL.12 NO.6 | 2017 | NATURE PROTOCOLS
© 2017 Macmillan Publishers Limited, part of Springer Nature. All rights reserved.

©20
17 M
acm
illan
Pub
lishe
rs L
imite
d, p
art o
f Spr
inge
r N
atur
e. A
ll ri
ghts
res
erve
d.
© 2017 Macmillan Publishers Limited, part of Springer Nature. All rights reserved. © 2017 Macmillan Publishers Limited, part of Springer Nature. All rights reserved.
NATURE PROTOCOLS | VOL.12 NO.6 | 2017 | 1269

©20
17 M
acm
illan
Pub
lishe
rs L
imite
d, p
art o
f Spr
inge
r N
atur
e. A
ll ri
ghts
res
erve
d.
© 2017 Macmillan Publishers Limited, part of Springer Nature. All rights reserved.
1270 | VOL.12 NO.6 | 2017 | NATURE PROTOCOLS
© 2017 Macmillan Publishers Limited, part of Springer Nature. All rights reserved.

©20
17 M
acm
illan
Pub
lishe
rs L
imite
d, p
art o
f Spr
inge
r N
atur
e. A
ll ri
ghts
res
erve
d.
© 2017 Macmillan Publishers Limited, part of Springer Nature. All rights reserved. © 2017 Macmillan Publishers Limited, part of Springer Nature. All rights reserved.
NATURE PROTOCOLS | VOL.12 NO.6 | 2017 | 1271

©20
17 M
acm
illan
Pub
lishe
rs L
imite
d, p
art o
f Spr
inge
r N
atur
e. A
ll ri
ghts
res
erve
d.
© 2017 Macmillan Publishers Limited, part of Springer Nature. All rights reserved.
1272 | VOL.12 NO.6 | 2017 | NATURE PROTOCOLS
© 2017 Macmillan Publishers Limited, part of Springer Nature. All rights reserved.

©20
17 M
acm
illan
Pub
lishe
rs L
imite
d, p
art o
f Spr
inge
r N
atur
e. A
ll ri
ghts
res
erve
d.
© 2017 Macmillan Publishers Limited, part of Springer Nature. All rights reserved. © 2017 Macmillan Publishers Limited, part of Springer Nature. All rights reserved.
NATURE PROTOCOLS | VOL.12 NO.6 | 2017 | 1273

©20
17 M
acm
illan
Pub
lishe
rs L
imite
d, p
art o
f Spr
inge
r N
atur
e. A
ll ri
ghts
res
erve
d.
© 2017 Macmillan Publishers Limited, part of Springer Nature. All rights reserved.
1274 | VOL.12 NO.6 | 2017 | NATURE PROTOCOLS
© 2017 Macmillan Publishers Limited, part of Springer Nature. All rights reserved.

©20
17 M
acm
illan
Pub
lishe
rs L
imite
d, p
art o
f Spr
inge
r N
atur
e. A
ll ri
ghts
res
erve
d.
© 2017 Macmillan Publishers Limited, part of Springer Nature. All rights reserved. © 2017 Macmillan Publishers Limited, part of Springer Nature. All rights reserved.
NATURE PROTOCOLS | VOL.12 NO.6 | 2017 | 1275

©20
17 M
acm
illan
Pub
lishe
rs L
imite
d, p
art o
f Spr
inge
r N
atur
e. A
ll ri
ghts
res
erve
d.
© 2017 Macmillan Publishers Limited, part of Springer Nature. All rights reserved.
1276 | VOL.12 NO.6 | 2017 | NATURE PROTOCOLS

61
6 Discussion
Technology development
Benchtop sequencing instruments were introduced in 2011 and provided researchers
with a cost-effective option with sufficient power to tackle small to medium sized
genomes. In the study of Pseudomonas aeruginosa in burns, 141 isolates were
sequenced on an Illumina MiSeq instrument in batches of 24 over multiple runs. A
significant advantage of benchtop instruments compared with larger instruments such as
the HiSeq are the shortened run time and lower running costs. This in turn makes them
more amenable to being drafted into use for outbreak sequencing quickly and on
demand. Despite this, total turnaround times when including the time taken to perform
library preparation and bioinformatics analysis may still be as long as a week, which
may be too slow for urgent investigations.
During the Salmonella outbreak the MiSeq sequencing was performed using a novel
‘draft sequencing’ protocol. Common run modes for the MiSeq are 150 and 250 base
paired-end sequencing that take up to 2.5 days to complete. These run modes are
required for achieving the maximum run yield and improve the results for de novo
assembly applications. We proposed that for rapid SNP calling the reads only need to be
long enough for most to align unambiguously so set the read length to 75 bp. Reducing
the read length meant we were able to reduce the chemistry time as higher rates of
phasing could be tolerated. Illumina nucleotides have a bulky side chain with a
fluorescent dye which is largely responsible for phasing, a measure of the completeness

62
of the incorporation reaction based on the amount of fluorescence still present for the
previous base. If a cluster contains around 1000 molecules a phasing value of 0.1%
means 10 strands are falling behind per cycle, resulting in reducing signal to noise ratio
along the read. The final modification was to image only one surface, halving the time
spent imaging.
This outbreak in August 2014 coincided with early testing of the MinION sequencer.
We wished to determine whether the MinION could provide clinically useful
information during an ongoing bacterial outbreak. In addition to the 16 samples
sequenced on the MiSeq in draft mode we also sequenced two isolates on the MinION,
one from the outbreak and one unrelated strain. We first attempted this during the
outbreak with the alpha version of the MinION chemistry R6 but we experienced poor
results with very high error reads. We subsequently repeated the experiments using the
updated R7 chemistry which yielded much higher numbers of 2D reads. The MinION
analysis was therefore performed retrospectively. In order to simulate real-time data,
reads were analysed as they would have become available in ten minute intervals after
the start of the run. As well as having a shorter library preparation time than the MiSeq,
we demonstrated two analysis methods that could rule isolates in or out of the outbreak
within two hours of starting the run. This demonstrated that the MinION has an
advantage in terms of speed over the MiSeq. This analysis relied on methods such as
phylogenetic placement that compensated for the noisy data. Both methods were
performed on DNA extracted from a pure culture which remains the rate limiting step
regardless of the technology used. The sample to answer time could be in theory be
significantly reduced if stool samples were tested directly using a metagenomics

63
approach such as during the German outbreak of Shiga-toxigenic Escherichia coli
O104:H4[69]. It is not known however whether sequencing would generate sufficient
genome coverage directly from clinical samples in order to accurately perform
phylogenetic inference and this is complicated by the large number of related taxa in the
normal human gut microbiome.
Prior to the Salmonella study, we had used single molecule PacBio sequencing to
generate a high-quality reference genome for the most common cluster ‘Clade E’
(ST395) in the Pseudomonas aeruginosa burns study. Library preparation and
sequencing was performed by the Norwegian Sequencing Centre in Oslo on a PacBio
RSII using the P5-C3 chemistry. The sequencing cost $1000 on an instrument that
retails for $750,000. $1000 is still 10x the cost of sequencing a single isolate on an
Illumina platform but it generated a near-complete reference genome which we could
use for very high sensitivity ‘forensic-grade’ variant calling. This approach permitted us
to generate very high-resolution phylogenetic trees of a group of very closely related
isolates to reveal microdiversity. In contrast, the simplicity of the MinION instrument
means it can be provided effectively free of charge as a part of a $1000 MinION starter
pack. As there are no infrastructure or instrument amortisation costs to worry about the
real cost of sequencing is the same at the reagents and flowcells. In the Ebola study we
sequenced one genome per flowcell without using any barcoding. This meant that the
cost per sample was >$500, which is expensive but it allowed the fastest possible
turnaround of as little as 24 hours. In later projects including Zika sequencing we
reduced the cost by sequencing 12 samples per flowcell through the use of the native

64
barcoding kit. Provided the throughput is high enough samples could be further
multiplexed to 96 samples per flowcell using the PCR barcoding kit.
At the 2017 London Calling conference Oxford Nanopore technologies announced that
a 128 channel low-cost flowcell was in development. In this new design, the
application-specific integrated circuit (ASIC) which performs low level analogue-to-
digital conversion would remain on the MinION reducing the cost of the flowcell. A
low-cost flowcell such as this would be ideal for viral surveillance applications where
typical flowcell yields of a few gigabases are overkill for sequencing small viral
genomes. Generating sufficient coverage of a single Ebola virus genome took as little as
15 minutes on a standard flowcell so would be run for 2 hours on a low-cost flowcell,
while 12 Zika virus genomes which would usually take 4 hours would be run overnight.
If the laborious barcoding protocol could be simplified then barcoded samples could be
continuously loaded onto the flowcell when ready. The cholesterol tethers on the
sequencing adapters adsorb DNA fragments to the membranes allowing new samples to
be added to an ongoing run on top of the previous sample. Exploiting this with a ‘run
until’ system guiding loading could be used in future to improve efficiency and reduce
per sample costs.
Nanopore sequencing technology offers three clear advantages over existing
technology; portability, low cost and long read lengths. Other technologies rely on
complex optical based detection methods with lenses which need calibration after
installation. In addition, all technologies require large volumes of reagents and a fluidics
system to deliver them which has severely hampered miniaturisation efforts. The

65
MinION uses electrophysical detection so has neither of these limitations. In addition,
the device draws less than one ampere so can be powered from the USB port of a laptop
computer. The laptop can also provide the compute required for data collection and
basecalling. This means that the samples can be sequenced close to where they were
collected for the fastest time from sample to answer rather than shipping them to the
sequencing facility and the difficulties associated with exporting samples.
Mobile laboratories
Genome sequencing during outbreaks can inform the public health response to
infection, but only if results can be generated quickly enough. Previously, samples from
an outbreak zone needed to be collected, shipped to a well-equipped laboratory,
sequenced and analysed before they can be used to guide public health measures.
Jeremy Farrar, director of the Wellcome Trust said surveillance “is largely stamp
collecting” unless response times can be “counted in days, at most weeks, not months
and years”. The MinION offers the first practical real-time genome surveillance system.
For the Ebola study we assembled a mobile ‘lab-in-a-suitcase’ which was transported as
standard airline luggage. It consists of a thermocycler, pipettes, consumables and
temperature controlled reagents in polystyrene boxes. On arrival, the reagents were
transferred to a fridge freezer already in the lab at Donka Hospital, Conakry. Power for
the fridge freezer and thermocycler was provided by the grid with generator backup.
The laboratory was able to be moved twice as the outbreak progressed to where it was
most needed, both locations had mains power with generator backup. This worked

66
effectively during the Ebola virus outbreak because the sequencing functionality was a
bolt-on to the diagnostic lab which was performed RNA extraction and RT-qPCR to
provide a rapid diagnostic service. These labs were situated at Ebola treatment centres
run by NGOs who built and maintained the infrastructure required. These centres take
time to establish and would not be available in the initial days or weeks of a new
outbreak. A truly portable surveillance system should be portable enough to access
remote areas and should be able to safely process infectious material by the use of a
portable isolator. Using a suitable lithium ion battery to power the equipment with a
solar panel for full ‘off-grid’ sequencing would allow sequencing in remote areas where
no power is available. We have successfully used the miniPCR, Qubit fluorimeter and
minifuge on battery power in the field. Ideally all reagents should be lyophilised to
allow long term storage at ambient temperature. Primers and RT-PCR reagents are
readily available in lyophilised formats. These reagents will typically use trehalose as an
additive which is an excellent protein stabiliser. If an amplicon sequencing method is
being used then primers and reagents could be prepared and lyophilised in advance
allowing for a one-tube ‘resuspend in sample’ type library preparation minimising the
risk of contamination.
In 2015 during the Ebola outbreak the only basecaller available was the cloud service
Metrichor which meant FAST5 read files needed to be uploaded for basecalling. The
FAST5 files themselves were needed downstream for the event data so performing
basecalling in country would not have been productive. We transferred unbasecalled
files by making a TAR.GZ of 10,000 FAST5 files for each sample. The resulting ~500
Mb file was uploaded to Google Drive as this supported resuming interrupted uploads.
67
This file was downloaded to servers in Birmingham for basecalling using Metrichor and
downstream analysis. This required the development of a new ‘variants’ module in
Nanopolish developed by Jared Simpson and a new 6-mer pore model in order to
produce accurate SNP calls. We validated the results by resequencing five samples
using Illumina technology and demonstrated that the calls were 100% concordant.
Sequencing methodology
When travelling to Guinea for the Ebola study we transported reagents to perform both
the amplicon method and a metagenomics approach which we didn’t use beyond two
trial runs as it generated poor results. Difficulties in uploading only 10,000 amplicon
reads over a 3G connection meant that the metagenomics based approach was
impractical in the situation. Although effective the Ebola RT-PCR scheme was still
laborious, it required 12 PCR reactions to be set up, cleaned up and quantified per
sample (11 regions plus a negative control). The PCR machine I transported was only a
small 25 well instrument which limited the number of samples to two per day.
For Zika virus sequencing an amplicon method was chosen as we had experience with
them from sequencing Ebola and we knew offered the highest sensitivity. There were
reports that other groups were having difficulties sequencing Zika virus due to low viral
titre in clinical samples. The modal Ct value for Zika positive patients turned out to be
36 in the large study into the establishment of Zika virus in Brazil[70] equivalent to
only 10 genome copies per µl of RNA. Fragment lengths in nucleic acid extractions are
usually normally distributed so having a high titre increases the likelihood of there

68
being long template molecules. When sequencing Ebola we used fewer longer
amplicons, which was possible due to the high titre. In order to overcome the low titre
problem with Zika virus we focused on short 400 bp amplicons which meant no longer
exploiting the long-read capabilities of the MinION yet it was now compatible with
Illumina read lengths. To generate the tiling amplicons for sequencing we would need
35 individual PCR reactions yet if we could generate the amplicons in a multiplex PCR
we could combine it with barcoding to achieve 420 amplicons per flowcell or 12 Zika
virus genomes. Pooling even and odd regions together allowed us to generate the
amplicon products in two reactions per sample or 24 reactions per flowcell each with
non-overlapping products. Making this work required designing primers with high
annealing temperatures to reduce the favourability of non-specific primer interactions.
We used a low primer concentration and a two-step thermocycler program with a long,
combined annealing and extension step of 5 minutes. These conditions gave successful
amplification up to Ct 36 which meant we had for the first time a method available
which could sequence a typical clinical sample.
The benefits of amplicon sequencing are that it is robust, inexpensive and can be done
in a day (and potentially much faster with optimisation). The multiplex method
published describes an online tool (primal.zibraproject.org) for automated primers
design and the PCR conditions for two-step RT-PCR for sequencing Zika virus and
Chikungunya although the method could be applied to a broader range of viruses. Two-
step RT-PCR means the reverse transcription is done in a separate reaction to the PCR.
This was used for two reasons; it allows the use of random primers for the RT step but
specific primers for the PCR and it is more sensitive as each step can use the optimal

69
buffer. We also provided an optimised library production for both MinION and Illumina
sequencing. This was required particularly for MinION sequencing as the 400 bp
products are considerably shorter than the typical fragment length requiring the input to
be reduced to achieve the expected molarity for ligation. The barcoding process itself is
still too laborious, requiring end-preparation and barcode ligation before pooling and
sequencing adapter ligation. With further work It will be possible to eliminate need for a
standalone barcode ligation by adding it with a second round PCR. This could be one
possible path to a fully portable, lyophilised sample preparation for use in the field.
Amplicon sequencing unfortunately has many limitations chiefly that is requires a
priori knowledge of the outbreak strain in order to design working primers. A downside
of the high specificity of PCR is that it is sensitive to mismatches in the primer binding
sites such would be expected in other lineages or strains. This makes it more suitable to
outbreak work than to population scale surveillance efforts. In this situation bait capture
may be more suitable as the baits are typically longer and therefore more tolerant to
mismatches, potentially up to 30% sequence divergence. In in the case of an unknown
pathogen you would have to switch to a meta-transcriptomics approach. This is usually
done by filtering a sample through a 0.22 µm filter to remove cells and treating with
DNAse to degrade any extracellular DNA before doing the extraction. The sensitivity of
this method is dependent on the relative abundance of the virus of interest with respect
to the background. Both bait capture and metagenomics methods are significantly more
laborious than amplicon sequencing and may not be practical for a mobile laboratory
setting. One problem highlighted by working on low titre samples was the need for
meticulous contamination prevention measures which is more difficult in long multi

70
stage protocols than for PCR which can be set up in a hood. Dedicated PCR hoods must
be used for preparing master mix and adding template to prevent amplicons
contaminating subsequent reactions.
Real-time analysis
Nanopore sequencing presents a new paradigm for real-time analysis because it is the
first technology that generates full length reads during the run. Most of technologies do
not ‘reload’ so the reads are only available after the run finishes. In the Salmonella
study we sought to explore how long it would take to get to the answer rather than the
answer itself. To do this we generated read sets using the time stamps in the reads of
reads that were available in ten minute windows. We investigated methods we expected
to be robust to either noisy long-reads or low coverage. The first analysis approach was
aligning reads to the MetaPhaAn database of taxon defining genes. Detecting presence
or absence of genes is tolerant to a high error rate in the reads as the probability of a
long read aligning by chance is very low. Using this method we could unambiguously
identify the species as Salmonella enterica within 30 minutes. Differences between the
outbreak and the non-outbreak strain were also observed after 50 minutes as three
different chromosomally encoded phages were detected as we generated more coverage;
Gifsy 2 in the outbreak strain and ST64B/RE_2010 in the non-outbreak strain. Two
reads were identified as originating from Citrobacter freundii however as this is another
member of the family Enterobacteriaceae it was most likely a missassigned at a lower
rank than it should have been.

71
The second approach used phylogenetic placement to place new samples on tree build
using Salmonella enterica and Salmonella enterica serovar Enteritidis genomes. With
this method it was possible to determine after 40 minutes that both samples were likely
from the serovar Enteritidis. The same process repeated using a reference tree
containing only Enteritidis isolates, was able to assign one sample to the main hospital
cluster after 100 minutes. The other sample could be assigned to a different cluster
containing a mixture of phage types none of which were the same as the hospital cluster
(14b), after 120 minutes. Surveillance sequencing of foodborne pathogens by WGS is
an exciting development pioneered by the Food and Drug Administration (FDA) in the
US[68]. Since the 1st April 2014, Public Health England (PHE) has also routinely
sequenced all Salmonella isolates referred by hospitals and general practitioners to the
Salmonella Reference Laboratory, Colindale. Having this data available enabled us to
perform the phylogenetic placement analysis using the MinION data for the Enteritidis
clade and have sufficient resolution to be able to distinguish the outbreak sample from
the non-outbreak sample. For organisms other than Salmonella that do not get routinely
sequenced by PHE, identification via the presence marker genes could be performed
however this would lack the resolution to be able to distinguish between closely related
strains. In this case only species level assignment was possible.
Surveillance sequencing
The cost and ease of sequencing bacterial genomes and the high-resolution, digital
output mean whole-genome sequencing will eventually become the routine method for
epidemiological surveillance. Currently most studies are snapshots and managed by

72
different groups of experts, usually on a pathogen by pathogen basis. Online tools such
as nextstrain.org can integrate whole-genome data and metadata in real-time and
provide up to date data for integration by public health investigators rather than trying
to find the information in a published study. In the UK, routine surveillance sequencing
is limited to food borne pathogens and Mycobacterium tuberculosis referred via the
reference laboratory. An outbreak of Salmonella enterica such as the one we had, was
one of the few that could have been integrated with the national surveillance data. The
genomes generated by the Illumina MiSeq were compared to existing sequences in the
Public Health England GastroDataWarehouse and the US GenomeTrakr service to look
for national and international links. The outbreak samples were found to form a distinct
cluster but this was closely related (1 SNP) to other cases form the UK. There were not
any closely linked samples in GenomeTrakr which was expected as most of the food
consumed in the UK is produced within the European Union. This data was a powerful
tool enabling us to quickly place the outbreak in a national context. The source was
eventually tracked down to a German egg producer known to authorities for frequent
breaches of food safety standards. It seems likely that people will become accustomed
to the power of surveillance sequencing for the species it is available for and this will
lead to a shift from conventional reference laboratory identification and typing in favour
of whole-genome sequencing for all pathogens.
During the Ebola outbreak data was disseminated as soon as it was available to
epidemiologists working in field either via a Microreact[71] URL or later by a scripted
PDF report. These contained phylogenetic trees for each cluster and incorporated
metadata provided by the field lab. After an embargo period implemented on request of

73
the central coordination they were pushed to a publically available github repository and
nextstrain.org. There were two main lineages circulating; GN1 and SL3, and multiple
epidemiological transmission chains. GN1 related to early cases in Guinea and another
linked to SL3 first detected in Sierra Leone in 2014. The real-time genomic surveillance
data helped field epidemiologists confirm or reject the proposed transmission chains.
This was particularly useful in cases where communities were difficult to access e.g. an
itinerant fishing community in Boké prefecture. There were some popular rumours at
the time that organs were being harvested under the guise of Ebola research
(http://www.thesierraleonetelegraph.com/sierra-leone-human-tissues-and-organs-
harvested-for-trafficking/) making some distrusting or even hostile to outsiders.
Integration of our data with another group who had been generating genome sequencing
in Sierra Leone using Ion Torrent sequencing revealed frequent cross border
transmissions which was fed back to the epidemiologist on the ground. One issue that
we experienced was that metadata provided from the field often required cleansing. This
was partly down to the fact that information was entered into an Excel workbook which
led to many different date formats and unwanted conversions to occur. The second issue
was multiple spellings being provided for the same village due to variations in oral
tradition. This could be overcome using a prebuilt database with fixed format fields for
data entry and drop downs for any metadata which may be available from existing
mapping.
Metagenomics as a way to identify potential pathogens in the hospital environment
could be a powerful technique. In the burns study a thermostatic mixer value was
removed from a persistently positive outlet and we were able to sample the biofilm

74
found inside for metagenomic sequencing. The reads obtained were aligned to the non-
redundant nucleotide database using BLAST and the most abundant taxon was found to
be P. aeruginosa. Alignment against the Clade E reference showed that 5x coverage of
the genome was obtained and using a phylogenetic placement method the sample
clustered with other isolates from the shower in room nine, the outlet from which the
component had been removed. Without the requirement for culture positive outlets
could be identified more rapidly reducing the change of a patient being exposed.
Sequencing could also be used to determine if a water sample contains safe levels of P.
aeruginosa using a spike in of known input to calibrate. Metagenomic sequencing also
has the advantage of being open-ended and is not restricted as a laboratory test might be
to a specific set of validated organisms. For example the individual colony forming unit
assays performed individually for P. aeruginosa, Legionella pneumophila and coliform
bacteria could be combined into a single test while also being able to detect rarer
pathogens such as Mycobacterium chelonae that would not be routinely tested.
Epidemiological inference
The complexity of epidemiological interpretation is outbreak and pathogen dependent.
The Ebola outbreak was likely a single spillover event from an infected bat to a child.
As this represents a point source introduction followed by continued human to human
transmission we can say with some certainty that all cases are descended from that
index case. This provides the simplest interpretation as for each new sample the closest
neighbour in the tree should represent the most recent sampled ancestor.

75
Zika virus originated in Uganda where it cycled between non-human primates and
Aedes mosquitos in the sylvanic cycle, with occasional spillover into humans causing
small outbreaks. The current pandemic was a result of it changing to cycling between
humans and mosquitos in the urban cycle before being introduced to Southeast Asia,
Oceania and the Americas. Multiple introductions and the possibility that the virus
could return to the sylvanic cycle make epidemiological inference more complex. In
addition the outbreak was very poorly sampled; in 2016 there were only 23 Zika virus
genome sequences from Brazil limiting the resolution of phylogenetic reconstructions.
We generated and additional 54 partial genomes using the amplicon sequencing method
we developed and other groups generated 149 others after we published the method
online[72, 73]. Combining all the datasets allowed a detailed phylogenetic
reconstruction to be performed which suggested northeast Brazil being the source of
Zika virus in the Americas with onward spread from there. The virus circulated
undetected in Brazil was masked by the endemic dengue and Chikungunya circulating
in the country. This was an important finding to meaning the baseline for microcephaly
before Zika virus needed to be taken earlier. This project again demonstrated the
importance of the MinION as a tool for digital surveillance. At relatively low cost, we
outfitted three labs in Brazil with all the equipment required to perform Zika virus
sequencing on MinION. The amplicon sequencing method is able to generate genomes
from mosquitos without altering the protocol and doing so allows you to link the cases
back to mosquitos trapped in a particular area. It is assumed that Aedes aegypti is the
sole mosquito vector but this may not be the case and detection in other species could
dramatically alter the areas of the country at risk. Understanding the phylogeography of
Zika virus can inform public health interventions such as mosquito eradication drives

76
e.g. if a large city was at risk. The genome sequence can alert you to any possible
mutations in the genome in diagnostic regions which could sensitivity of important
diagnostic tests.
Epidemiological investigations to investigate food or water borne outbreaks can
produce ambiguous results as it is more likely that diversity may be transmitted. In the
Salmonella enterica outbreak the contaminated eggs were tracked down to a European
egg producer. Although this represents a continuous point source outbreak diversity had
built up in the infected flock meaning isolates recovered from patients in the outbreak
may not be identical to those from the flock by whole genome sequencing if sampling is
insufficient. If an isolate however falls within a ‘cloud of diversity’ it is still strong
evidence for that being the source. Similarly, in the burns study we discovered diversity
between the water outlets on the ward but not within a single outlet. This suggests the
introduction of diversity via the water supply, followed by the establishment of a
biofilm community in the outlets. The evolutionary rate within a biofilm should be slow
as it is a nutrient limited environment and the lack of diversity within an individual
outlet supports this. The total diversity we observe in the burns ward is low compared to
what you might expect to find in the environment however which is suggestive of an
evolutionary bottle neck as some point in the past, whether this occurred within the
hospital plumbing network is not known. The diversity between outlets however
provided us with a method of identifying the likely outlet from which a patient became
infected i.e. a ‘map of genotypes’. Phylogenetic reconstruction within the clade showed
clear evidence of clustering by room and outlet. It was high enough resolution in some
instances that it was possible to distinguish between the tap and shower in room 11 and

77
this was consistent over multiple samples. This approach of generating a geographical
map of genotypes means that any subsequent epidemiological investigation could be
performed very quickly. One of the things holding back routine use whole-genome
sequencing in epidemiological investigations is knowledge of the populations structure
of certain organisms.
Summary
We are on the cusp of an exciting revolution in genomic epidemiology systems. We
have portable nanopore sequencing technology which has proven robust enough to be
transported in an airline or even a space rocket hold. Fieldable methods for amplicon
sequencing can be used to generate genomes from low titre samples and sequence them
within in a day. Offline analysis pipelines installed on a laptop can generate consensus
sequences and place new samples in the context of the outbreak allowing information to
feedback into the outbreak response. There are many so advantages to whole-genome
for pathogen surveillance it is inevitable that it will eventually replace conventional
typing methods and continued development in the technology will enable cost effective
surveillance sequencing to detect and track outbreaks in hospitals and in the field alike.
78
References 1. Porter, J.R., Antony van Leeuwenhoek: tercentenary of his discovery of bacteria,
in Bacteriol Rev. 1976. p. 260-9. 2. Steele, J.H., History, trends, and extent of pasteurization. J Am Vet Med Assoc,
2000. 217(2): p. 175-8. 3. Porter, J.R., Louis Pasteur sesquicentennial (1822-1972). Science, 1972.
178(4067): p. 1249-54. 4. Blevins, S.M. and M.S. Bronze, Robert Koch and the 'golden age' of
bacteriology. Int J Infect Dis, 2010. 14(9): p. e744-51. 5. Fleming, A., On the Antibacterial Action of Cultures of a Penicillium, with Special
Reference to Their Use in the Isolation of B. Influenzae. British Journal of Experimental Pathology, 1929. 10(3): p. 226-236.
6. Fleming, A. Penicillin. 1945; Available from: https://www.nobelprize.org/nobel_prizes/medicine/laureates/1945/fleming-lecture.pdf.
7. Chambers, H.F., The changing epidemiology of Staphylococcus aureus? Emerg Infect Dis, 2001. 7(2): p. 178-82.
8. Lewis, K., Platforms for antibiotic discovery. Nat Rev Drug Discov, 2013. 12(5): p. 371-87.
9. Bartholomew, J.W. and T. Mittwer, The Gram stain. Bacteriol Rev, 1952. 16(1): p. 1-29.
10. Stager, C.E. and J.R. Davis, Automated Systems for Identification of Microorganisms. Clinical Microbiology Reviews, 1992. 5(3): p. 302-327.
11. Griffith, F., The Significance of Pneumococcal Types. Journal of Hygiene, 1928. 27(2): p. 113-159.
12. Avery, O.T., C.M. MacLeod, and M. McCarty, Studies on the Chemical Nature of the Substance Inducing Transformation of Pneumococcal Types Induction of Transformation by a Desoxyribonucleic Acid Fraction Isolated from Pneumococcus Type Iii. Journal of Experimental Medicine, 1944. 79(2): p. 137-158.
13. Hershey, A.D. and M. Chase, Independent Functions of Viral Protein and Nucleic Acid in Growth of Bacteriophage. Journal of General Physiology, 1952. 36(1): p. 39-56.
14. Watson, J.D. and F.H.C. Crick, Molecular Structure of Nucleic Acids - a Structure for Deoxyribose Nucleic Acid. Nature, 1953. 171(4356): p. 737-738.
15. Crick, F., Central Dogma of Molecular Biology. Nature, 1970. 227(5258): p. 561-&.
16. Saiki, R.K., et al., Enzymatic amplification of beta-globin genomic sequences and restriction site analysis for diagnosis of sickle cell anemia. Science, 1985. 230(4732): p. 1350-4.
17. Sambrook, J.a.R., D, Molecular Cloning: A Laboratory Manual 2001. 18. Sanger, F., S. Nicklen, and A.R. Coulson, DNA sequencing with chain-terminating
inhibitors. Proc Natl Acad Sci U S A, 1977. 74(12): p. 5463-7.

79
19. Maiden, M.C., et al., Multilocus sequence typing: a portable approach to the identification of clones within populations of pathogenic microorganisms. Proc Natl Acad Sci U S A, 1998. 95(6): p. 3140-5.
20. Achtman, M., Evolution, Population Structure, and Phylogeography of Genetically Monomorphic Bacterial Pathogens. Annual Review of Microbiology, 2008. 62: p. 53-70.
21. Larsen, M.V., et al., Multilocus sequence typing of total-genome-sequenced bacteria. J Clin Microbiol, 2012. 50(4): p. 1355-61.
22. Fleischmann, R.D., et al., Whole-genome random sequencing and assembly of Haemophilus influenzae Rd. Science, 1995. 269(5223): p. 496-512.
23. Fraser, C.M., et al., The minimal gene complement of Mycoplasma genitalium. Science, 1995. 270(5235): p. 397-403.
24. Lander, E.S., et al., Initial sequencing and analysis of the human genome. Nature, 2001. 409(6822): p. 860-921.
25. Venter, J.C., et al., The sequence of the human genome. Science, 2001. 291(5507): p. 1304-51.
26. Margulies, M., et al., Genome sequencing in microfabricated high-density picolitre reactors. Nature, 2005. 437(7057): p. 376-80.
27. Bentley, D.R., et al., Accurate whole human genome sequencing using reversible terminator chemistry. Nature, 2008. 456(7218): p. 53-9.
28. Loman, N.J., et al., Performance comparison of benchtop high-throughput sequencing platforms. Nature Biotechnology, 2012. 30(5): p. 434-+.
29. Reuter, S., et al., A pilot study of rapid whole-genome sequencing for the investigation of a Legionella outbreak. Bmj Open, 2013. 3(1).
30. Flusberg, B.A., et al., Direct detection of DNA methylation during single-molecule, real-time sequencing. Nat Methods, 2010. 7(6): p. 461-5.
31. Deamer, D., M. Akeson, and D. Branton, Three decades of nanopore sequencing. Nature Biotechnology, 2016. 34(5): p. 518-524.
32. Kasianowicz, J.J., et al., Characterization of individual polynucleotide molecules using a membrane channel. Proceedings of the National Academy of Sciences of the United States of America, 1996. 93(24): p. 13770-13773.
33. Lieberman, K.R., et al., Processive Replication of Single DNA Molecules in a Nanopore Catalyzed by phi29 DNA Polymerase. Journal of the American Chemical Society, 2010. 132(50): p. 17961-17972.
34. Schneider, G.F. and C. Dekker, DNA sequencing with nanopores. Nat Biotechnol, 2012. 30(4): p. 326-8.
35. Quick, J., A.R. Quinlan, and N.J. Loman, A reference bacterial genome dataset generated on the MinION portable single-molecule nanopore sequencer. Gigascience, 2014. 3: p. 22.
36. Eiglmeier, K., et al., The decaying genome of Mycobacterium leprae. Lepr Rev, 2001. 72(4): p. 387-98.
37. Alm, R.A., et al., Genomic-sequence comparison of two unrelated isolates of the human gastric pathogen Helicobacter pylori. Nature, 1999. 397(6715): p. 176-80.

80
38. Frost, L.S., et al., Mobile genetic elements: the agents of open source evolution. Nat Rev Microbiol, 2005. 3(9): p. 722-32.
39. Thomas, C.M. and K.M. Nielsen, Mechanisms of, and barriers to, horizontal gene transfer between bacteria. Nature Reviews Microbiology, 2005. 3(9): p. 711-721.
40. Markel, H., A piece of my mind. Happy birthday, Dr Snow. JAMA, 2013. 309(10): p. 995-6.
41. Mutreja, A., et al., Evidence for several waves of global transmission in the seventh cholera pandemic. Nature, 2011. 477(7365): p. 462-U111.
42. Final Report of the Independent Panel of Experts on the Cholera Outbreak in Haiti. Available from: https://www.un.org/News/dh/infocus/haiti/UN-cholera-report-final.pdf.
43. Needleman, S.B. and C.D. Wunsch, A general method applicable to the search for similarities in the amino acid sequence of two proteins. J Mol Biol, 1970. 48(3): p. 443-53.
44. Smith, T.F. and M.S. Waterman, Identification of common molecular subsequences. J Mol Biol, 1981. 147(1): p. 195-7.
45. Li, H. and R. Durbin, Fast and accurate short read alignment with Burrows-Wheeler transform. Bioinformatics, 2009. 25(14): p. 1754-60.
46. Altschul, S.F., et al., Basic local alignment search tool. J Mol Biol, 1990. 215(3): p. 403-10.
47. Li, H., Minimap2: fast pairwise alignment for long nucleotide sequences. arxiv, 2017.
48. Chin, C.S., et al., Nonhybrid, finished microbial genome assemblies from long-read SMRT sequencing data. Nat Methods, 2013. 10(6): p. 563-9.
49. Berlin, K., et al., Assembling large genomes with single-molecule sequencing and locality-sensitive hashing. Nat Biotechnol, 2015. 33(6): p. 623-30.
50. Koren, S., et al., Canu: scalable and accurate long-read assembly via adaptive k-mer weighting and repeat separation. Genome Research, 2017. 27(5): p. 722-736.
51. Walker, B.J., et al., Pilon: An Integrated Tool for Comprehensive Microbial Variant Detection and Genome Assembly Improvement. Plos One, 2014. 9(11).
52. Loman, N.J., J. Quick, and J.T. Simpson, A complete bacterial genome assembled de novo using only nanopore sequencing data. Nature Methods, 2015. 12(8): p. 733-U51.
53. Koboldt, D.C., et al., VarScan: variant detection in massively parallel sequencing of individual and pooled samples. Bioinformatics, 2009. 25(17): p. 2283-5.
54. Cingolani, P., et al., A program for annotating and predicting the effects of single nucleotide polymorphisms, SnpEff: SNPs in the genome of Drosophila melanogaster strain w1118; iso-2; iso-3. Fly (Austin), 2012. 6(2): p. 80-92.
55. Seemann, T., Prokka: rapid prokaryotic genome annotation. Bioinformatics, 2014. 30(14): p. 2068-9.
56. Hyatt, D., et al., Prodigal: prokaryotic gene recognition and translation initiation site identification. BMC Bioinformatics, 2010. 11: p. 119.

81
57. Saitou, N. and M. Nei, The neighbor-joining method: a new method for reconstructing phylogenetic trees. Mol Biol Evol, 1987. 4(4): p. 406-25.
58. Drummond, A.J. and A. Rambaut, BEAST: Bayesian evolutionary analysis by sampling trees. BMC Evol Biol, 2007. 7: p. 214.
59. Kingman, J.F.C., The coalescent. Stochastic Processes and their Applications, 1980.
60. Drummond, A.J., et al., Measurably evolving populations. Trends in Ecology & Evolution, 2003. 18(9): p. 481-488.
61. Matsen, F.A., R.B. Kodner, and E.V. Armbrust, pplacer: linear time maximum-likelihood and Bayesian phylogenetic placement of sequences onto a fixed reference tree. BMC Bioinformatics, 2010. 11: p. 538.
62. Huson, D.H., et al., MEGAN analysis of metagenomic data. Genome Res, 2007. 17(3): p. 377-86.
63. Segata, N., et al., Metagenomic microbial community profiling using unique clade-specific marker genes. Nature Methods, 2012. 9(8): p. 811-+.
64. Human Microbiome Project, C., Structure, function and diversity of the healthy human microbiome. Nature, 2012. 486(7402): p. 207-14.
65. Qin, J., et al., A human gut microbial gene catalogue established by metagenomic sequencing. Nature, 2010. 464(7285): p. 59-65.
66. Wood, D.E. and S.L. Salzberg, Kraken: ultrafast metagenomic sequence classification using exact alignments. Genome Biol, 2014. 15(3): p. R46.
67. Kim, D., et al., Centrifuge: rapid and sensitive classification of metagenomic sequences. Genome Research, 2016. 26(12): p. 1721-1729.
68. den Bakker, H.C., et al., Rapid whole-genome sequencing for surveillance of Salmonella enterica serovar enteritidis. Emerg Infect Dis, 2014. 20(8): p. 1306-14.
69. Loman, N.J., et al., A culture-independent sequence-based metagenomics approach to the investigation of an outbreak of Shiga-toxigenic Escherichia coli O104:H4. JAMA, 2013. 309(14): p. 1502-10.
70. Faria, N.R., et al., Establishment and cryptic transmission of Zika virus in Brazil and the Americas. Nature, 2017. 546(7658): p. 406-+.
71. Argimon, S., et al., Microreact: visualizing and sharing data for genomic epidemiology and phylogeography. Microb Genom, 2016. 2(11): p. e000093.
72. Grubaugh, N.D., et al., Genomic epidemiology reveals multiple introductions of Zika virus into the United States. Nature, 2017. 546(7658): p. 401-+.
73. Metsky, H.C., et al., Zika virus evolution and spread in the Americas. Nature, 2017. 546(7658): p. 411-+.