real time presentation for rafale in-flight...
TRANSCRIPT

REAL TIME PRESENTATION FOR RAFALE IN-FLIGHT TESTS
Item Type text; Proceedings
Authors PATUREAU, Philippe; ULLAH, Douglas
Publisher International Foundation for Telemetering
Journal International Telemetering Conference Proceedings
Rights Copyright © International Foundation for Telemetering
Download date 26/04/2018 17:43:02
Link to Item http://hdl.handle.net/10150/612913

REAL TIME PRESENTATIONFOR RAFALE
IN-FLIGHT TESTS
Philippe PATUREAU Douglas ULLAHDASSAULT AVIATION LORAL INSTRUMENTATION
ABSTRACT
The current control rooms at Dassault Aviation, Istres were built in 1978 for theflight tests of the MIRAGE 2000 GENERATION. After 13 years of gradualimprovements, the time has come to renew our instrumentation. New conceptsand future technologies have been taken into consideration and the newequipment that is implemented must allow flight tests to be performedthroughout the current decade.
These changes have occurred to enable testing of a new breed of combataircraft, i.e. the RAFALE, for the coming years.
However, this improvement is in keeping with what has already been achievedover the last 22 years at DASSAULT AVIATION.
A brief background reminder will allow assessment of the company’s real timephilosophy.
A ground control room provides two types of displays, namely:
# a decommutator controlled display for minimum refresh rates. It isconcerned with flight monitoring and hence safety.
# a second display is connected to the host computer dedicated to datahandling during flight time.
A more accurate description will show how a locally available item of equipmentwas customized to match specific requirements and to enhance its basicfunctionalities so as to make up the display chain needed for flight safety.
INTRODUCTION
The real time processing and display technique is one of our preferred testmethodology tools. With more than twenty years of experience in this field, wehave proved that it provides:
# increased safety during flight,# a reduced number of flights,# shorter development times,# a reduced number of aircraft being tested.
1. A TOOL AT THE SERVICE OF A TEAM
Methods implemented during test flights are designed to satisfy needsexpressed by test teams. In order to complete these tests in complete safety,the DASSAULT AVIATION Company has always taken care to respect thefollowing basic principles:
# Composition of homogeneous teams under the control of a testengineer. This engineer must be thoroughly familiar with the aircraft inorder to assist the pilot in carrying out the tests.
# The best possible knowledge about allowable limits and the risksinvolved.
# Thorough and strict preparation of test flights between the pilot and thetest engineer. After being informed, the pilot takes responsibility for theflight. The test engineer on the ground provides him with assistance bymonitoring safety parameters.
At the present time, a typical test team for carrying RAFALE D C01 in flight testscomprises:
# the pilot# the test engineer, assisted by:
P a flight monitoring assistant engineer,P an engine specialist engineer,P one or two avionics systems engineers,P an electrical flight control system engineer,P an operations engineer,P a forces engineer,P a flutter engineer.
For technical support, there is also the aircraft preparation technician, flight lineteam leaders and representatives of cooperating companies. The latter attendthe flight in the control room but do not have any display equipment. They attendsimply as advisers to the test team.
2. CURRENT DISPLAY PRINCIPLES
Real time display facilities must be a tool capable of:
# Flight monitoring:
P by making it possible to check that the flight is taking place asplanned and that the aircraft remains within the plannedexploration range.
P by providing intermediate results for deciding whether or not topursue the test sequence.
# To inform when a failure occurs - generated by the aircraft system.
# To inform about an anomaly - not detected by the aircraft system.The airborne measuring system transmits information for its detection.
# To provide decision elements - complementary to the above twocases.
3. CONFERENCE PLAN
After this introduction, we will present a brief history describing the developmentof our real time display resources since their origin. The second part will thendescribe the principles on which these resources are selected and designed.
We will finish with an outline of improvements to appear in the near future, and aconclusion.
PART 1 - HISTORY
Since its appearance in 1968, the real time technique has continuously andregularly evolved. Always driven by the arrival of new prototypes, improvementsare made in master plans marked by three major landmark dates:

1968: Display by FM channel and decommutator. Some real timemonitoring by computer.
At this time, preferred methods were galvanometers and indicators, strip chartrecorders and megascopes. Galvanometers were driven by:
# continuous FM channels for basic aircraft parameters (altitude,incidence, speed, etc).
# PAM and PCM decommutators for engine information.# the computer for calculated parameters (for example Mach).
Information transmitted by the five PAM messages were displayed on themegascope. Strip chart recorders logged parameters obtained from FMchannels and decommutated outputs.
The PAM decommutator processed sixteen parameters and the PCMdecommutator processed twenty two.
Programming was elementary, based on a matrix of diodes and a patch panel.The computer monitored a small number of parameters and controlledindicators and a TEKTRONIX 611 storage CRT on which twelve alphanumericparameters were displayed. This computer was an IBM 1800.
There was an interaction by means of a function key.
Flutter phenomena was monitored by a TIME DATA 100 two-channel analyzer,from which the copied spectra went to the control room.
The MIRAGE G8 variable geometry aircraft, the MERCURE short haul aircraft,the ALPHA-JET tactical support-training aircraft, FALCON 100, FALCON 50aircraft were developed with this equipment.
1978: Arrival of a single PCM message for surveillance.
For the MIRAGE 2000 tests, and after ten years of experience between 1968and 1978, we made a significant development in our processing methods. Theappearance of electrical flight controls systems, new on board systems and newstructures based on composite materials all contributed to a new telemetry:
# a PCM DANIEL message, already described in previous ITCs andETTCs,

# a 15-channel FM multiplex for flutter analysis,# a video message associated with transmission of the pilot's voice.
Ground processing resources are also far more powerful:
An INTERTECHNIQUE 78-420 decommutator based on a minicomputercapable of processing about fifty parameters (16 analogue outputs, 32alphanumerics on screen, 4 digital output ports). Sixteen galvanometers werestill used for the basic safety related display resources, together with a screendisplaying 32 parameters converted into engineering units by means of simpleAX+ B and A/X algorithms. The disappearance of PAM cycles andcorresponding advantages is compensated for by an innovative function of theunit: four screens are capable of displaying 32 consecutive parameters in theminor frame in the form of bar graphs.
A new generation computer was used. The SEL 32/55 outputs displays on a1024 x 1024 graphic screen, an alphanumeric console and indicators.
Interaction is provided by a function key and an alphanumeric keyboardassociated with the console.
This provides a larger scale surveillance and the result is displayed on thegraphic screen and is synthesized on alarm indicators.
The flutter analysis is carried out by a two-channel analyzer, but the operationswork is carried out by a second SEL 32/55 computer equipped with an AP 120 BArray processor. The result is sent to a specialist engineer on a graphic screen.These facilities were used for the development of the MIRAGE 2000, theFALCON 900 and 200, the ATL 2 maritime patrol aircraft.
SEL 32 computers evolved in a 32/77 80 configuration. They were replaced by aGOULD 32/97 for the RAFALE experimental aircraft.
1991: For the coming decade, and in particular for carrying out testflights on the RAFALE D family, we will be using a new generation ofdisplays.
Control rooms are now equipped with:
# 3 workstations for analogue and synoptic type displays.# 4 high resolution color graphic terminals for real time plotting and modal
analysis.

# 5 alphanumeric consoles, video monitors, indicators and screensshowing strip chart recorders.
We will review the requirements which resulted in this organization.
PART 2 - CURRENT METHODS
1 – PRINCIPLES
1.1 Flight monitoring
The test engineer, responsible for the flight procedure together with thepilot, must be able to:
# be aware of flight conditions and the aircraft condition within afraction of a second.
# carry out a detailed analysis of the operation of a specific system.
1.1.1 Fast awareness
Clear symbology must provide results defining the aircraft condition at aglance. The following are the vital surveillance parameters:
# basic parameters: altitude, speed, attitude, etc.# parameters quantifying the operation of the engine(s).# alarm and blip display defining the aircraft configuration (air
brakes out, engines in PC, etc.). Fast (at least 10 views persecond) and simple displays are required.
1.1.2 Detailed analysis
These are obtained by alphanumeric display (time plots and crossplots) and synoptics. This concerns:
# vibrational phenomena,# structural forces,# electrical flight controls,# avionics systems.
Parameter analysis and interpretation is carried out by specialistengineers assisting the test engineer.

1.2 Alarm on appearance of a fault
When failure bits transmitted by the measurement system are received, itmust be possible to:
Generate synthetic information, the results of logical boolean operationson tens of possible failure bits, by lighting up color blocks on the screen.
Display a plain text message describing the nature and severity of thefailure.
1.3 Alert on anomaly
This is surveillance of parameter limits.
1.4 Decision elements
This involves operations work during the flight. Access to these elementsrequires reference to failure files and the display of information recorded afew instants earlier.
2 – ORGANIZATION OF CURRENT DISPLAYS
We developed the following restitution chain architecture in order to satisfythese requirements:
2.1 Restitution chain architecture
Information is processed as follows (figure 1).
After demodulation and demultiplexing, the following information is usefulto flight monitoring in the control room:
# Distributed unprocessed, as for the video signal, voice andvibrations.
# Decommutated by the PCM decommutator for fast and safe display.# Processed by the computer for real time operation and related tape
storage for archiving and disk storage for replay.
2.2 Displays using raw data
2.2.1 Video signal
We receive a PAL color 625 line CCIR analogue video signal which istransmitted through a wide band telemetry link from several sources onboard the aircraft: camera in the sights, symbol generation box, etc.
Restitution takes place on color monitors. This is a simple flightmonitoring method.
2.2.2 Pilot (or crew) voice
An IRIG 19 C or J subcarrier transmits the audio signal either inanalogue or digital in the case of encryption. This is one of the flightmonitoring components.
2.2.3 Vibration signals
Analogue information is still the fastest, safest and most economicdisplay method. It provides the experienced engineer with a reliablesurveillance tool. The 15 vibration signals transmitted by telemetry aredisplayed for this purpose.
2.3 Displays from a decommutator
Historically, due to its simplicity, this instrument was known to be thesafest part of the display. This was unlike the computer, more complex butless reliable at the time and used with software which was not alwayscompletely debugged.
Although this caricature is now anachronic, the commutator is still acomputer standby, and still produces the fast displays required for flightmonitoring.
2.3.1 For flight and alarm monitoring
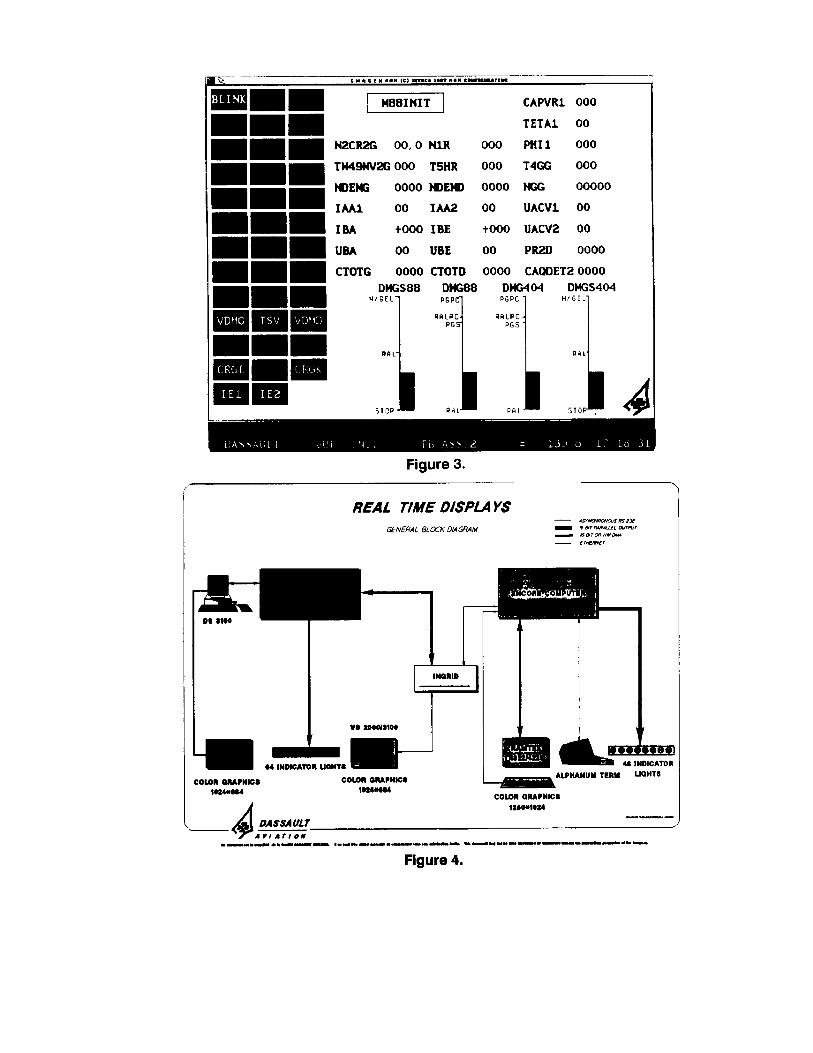
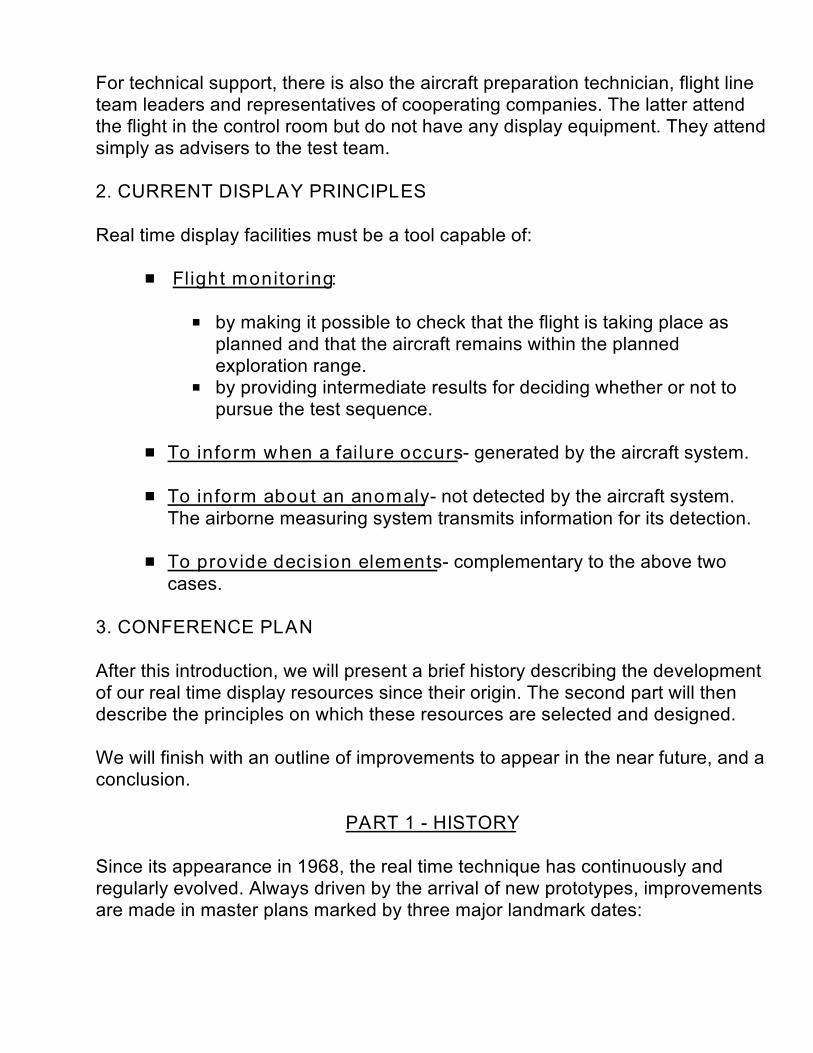
2.3.1.1 Outputs under the supervisor animation software
IMAGIN (registered trademark of the SFERCA company) is agraphic display program which is used with a high performance

animation system to create analogue shapes - bar graphs or dialsare associated with alarm windows (figures 2 and 3).
On a DEC VS 3100 workstation, the refreshment speed is of theorder of 14 pictures/sec for the fastest displays. Two screens arethus animated. One screen is assigned to basic aircraft parameters,its configuration and its alarms. The second screen is provided forengine parameters and engine alarms.
Using a switching keyboard, a large number of different views canbe called on each screen. The keyboard has proved to be a fasteraccess tool for the test engineer than the mouse or the track ball.
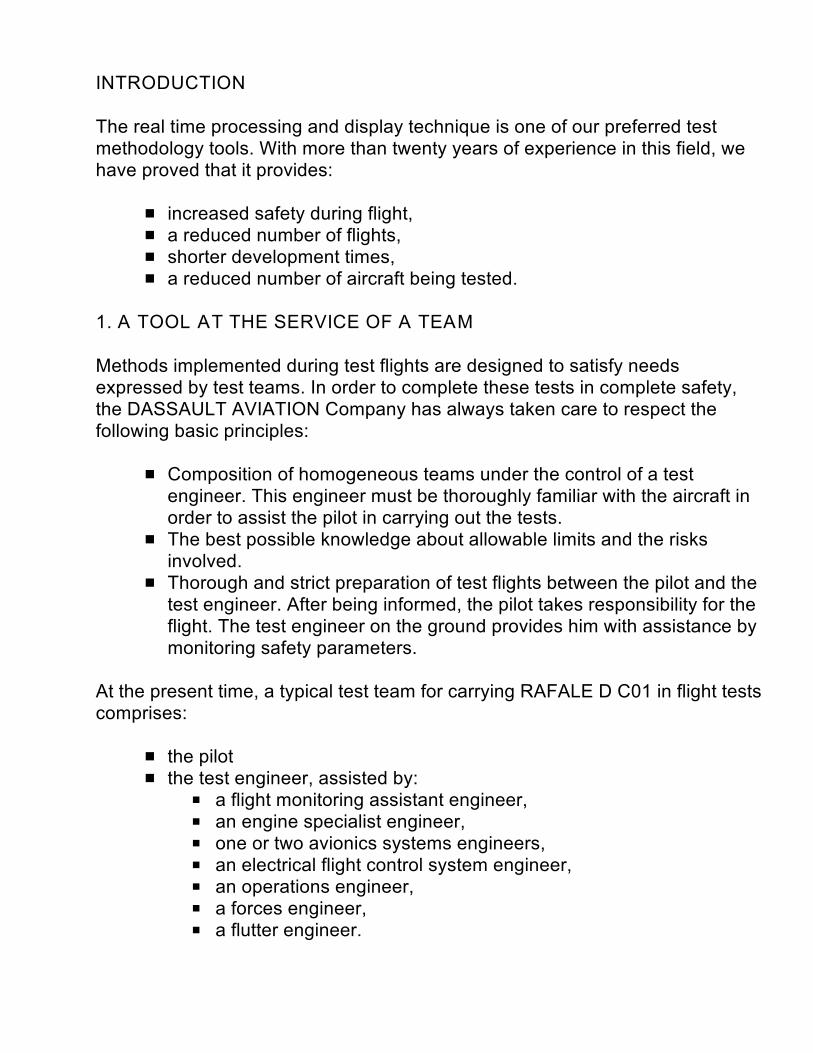
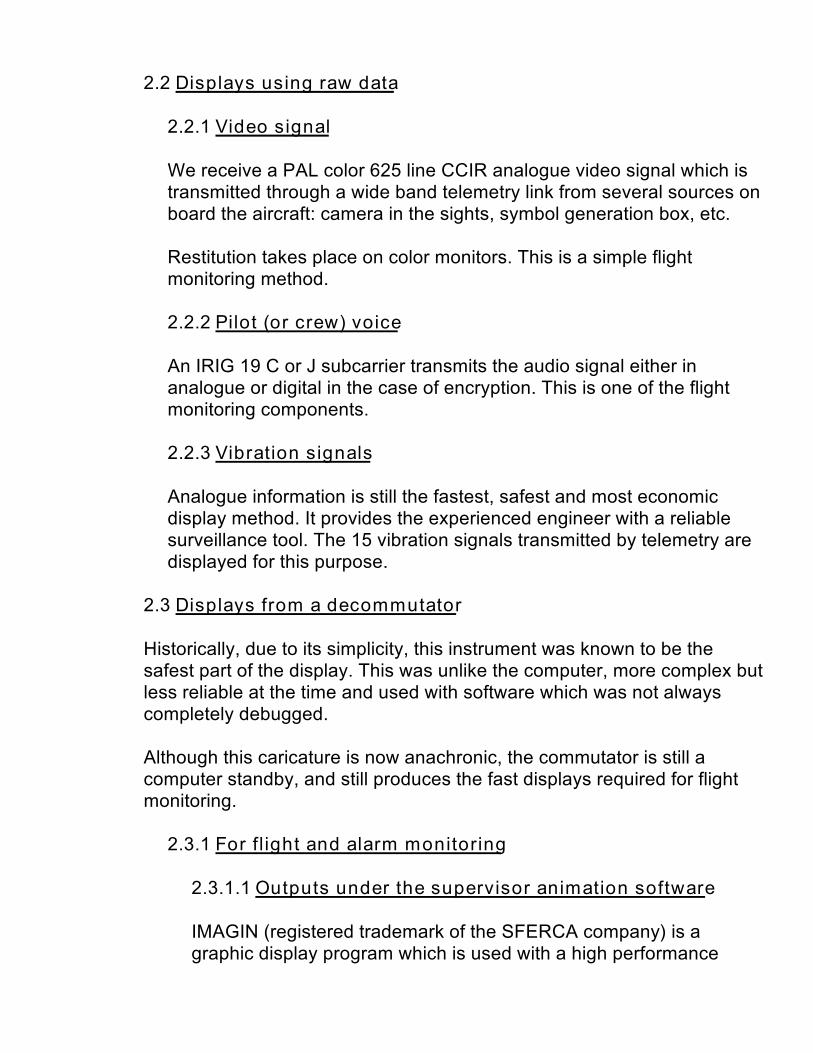
2.3.1.2 Link between the decommutator and IMAGIN stations
Parameters necessary for flight monitoring used to be produced bythe decommutator analogue outputs. The animation software nowreads a standard file. This file is prepared by the INGRID interface(Fig 4).
Designed by Dassault, this interface is driven by a TAG/DATAmodule in the Loral Instrumentation System 500 decommutator. Thisproduces data-label pairs.
The interface, programmed to receive selected data, listens to theTAG/DATA module which outputs information as soon as it isavailable. On recognition of the label, the interface stores the data inthe file. This file is transmitted as the contents of a current-valuetable at the rate set by IMAGIN workstations.
2.3.1.3 Decommutator outputs
2.3.1.3.1 Parallel outputs for the workstation
These outputs are produced by the TAG/DATA module.Parameters selected for flight monitoring and alarm restitution arecreated on the decommutator with a distribution code for directingthem towards this module immediately that they appear orimmediately after their processing by the FPP or the compressor.

2.3.1.3.2 Digital outputs
The four 16-bit ADP 170 digital outputs module animatesindicators in order to restitute alarms or statuses.
2.3.2 For detection of anomalies and decision elements
This role is carried out by the normal decommutator display. DATAPAGES are used mostly. The “warning” and “critical” functions on thedisplay mode inform engineers about anomalies. DATA PAGESpropose listings useful to engineers to analyze the flight in more detail.
2.3.3 Special processing
One new feature compared with previous decommutator generations isthe use of a powerful and easy to use processor. This FPP processor,together with a standard compressor, processes input data obtainedfrom the telemetry. We have developed the following algorithms inaddition to the basic algorithms provided by the manufacturer:
MACHNORM
Calculation of the MACH number from the ambient pressure andDELTAP. The output is on a 16-bit integer (the output is actuallyMACH* 103).
MACH LARG
Ditto above, but output in IEEE 32-bit floating format.
RAPP ASURX
Calculation of the ratio of a coefficient A and the source X.
XSY NORM
Division of the source X by the source Y. The output is integer (set tozero if Y = zero).

YSY LARG
Ditto, but with output in IEEE 32-bit floating format.
TEMPS
Calculation of 3 integers (hours, minutes, seconds) from a DANIELpacket time sources.
PUISSANCE A
The source parameter is raised to a power A input as a coefficient. Theoutput is in IEEE floating format. The power A is floating.
SURVEILLE 1
Check that a parameter remains between a high and a low limit. If it isoutside the limits, 1 is output on the MUXBUS.
SURVEILLANCE 4
Check that four parameters remain within their respective limits.
If any parameter goes outside the limit, the corresponding bit is set to 1,otherwise the value 0 is output on the MUXBUS.
Examples:
SOURCE 1 outside limit 0001SOURCE 4 outside limit 1000SOURCE 2 and 3 outside limits 0110
SURVEILLE 8
Ditto, same as SURVEILLE 4 but for 8 sources.
COMPA S2 S1
Check that a parameter remains between a lower limit value and thevalue of a second parameter. LOWER < S2 < S1.
COMP S1 S2 A
Ditto but S1 < S2 < UPPER.
COMP SI S2 S3
Ditto, but SI < S2 < S3.
CALCULZP
Calculation of the altitude based on the ambient pressure.
BIBUS
Surveillance of a parameter on the two aircraft buses. These algorithmsare not especially optimized and are fairly efficient (the execution timeis 20 to 40 fs). They enrich displays on the IMAGIN workstation. Theservice quality is comparable to that provided by a computer.
Obviously, DATE PAGES also make use of these algorithms.
2.3.4 Synthetic displays, synoptics
A third workstation animated by IMAGIN and driven by INGRIDincludes circuits complementary to the displays designed forspecialists. In this case INGRID can take this information output fromthe decommutator or the computer.
The decommutator is used when data acquired by telemetry issufficient to animate synoptics.
When animation is the result of an existing calculation elsewhere in thehost computer, the engineer selects the host computer as the sourcefor INGRID (figure 5).
2.4 Computer generated displays
An ENCORE CONCEPT 32/97 80 computer participates in each flight bysystematically exhaustively acquiring the PCM surveillance messagegenerated by the telemetry.

The acquisition rate of 10 500 data per second is maintained knowing thatthe processing procedure consists of:
# acquisition of raw data from a frame synchronizer,# conversion to engineering units by the application of polynomial and
segmented calibrations,# parameter dating,# the calculation of derived parameters such as the corrected Mach,
the mass, the centre of gravity, the Cz, the real incidence, etc.,# monitoring limits.
This first class of software is used together with display software andoperation software which may run during the flight time
2.4.1 Displays
There are three types of displays in the control room:
# 4 high resolution graphic screens, one of which is intended forflutter specialists and is connected to a second ENCORECONCEPT 32/97 80 computer equipped with an Array processor.It is used to carry out modal analysis during real time.
# 5 alphanumeric consoles,# 48 indicators,# 1 workstation screen shared with the decommutator.
2.4.1.1 Graphic screens
These screens are 1280 x 1024 resolution graphic terminals. Theyfeature time plots with scrolling or non-scrolling curves, X-Y plots,spectra, frequency damping tables and other items.
There is also an alphanumeric parameter display window. Screensare connected to a color hard copy unit.
2.4.1.2 Alphanumeric consoles
These are used with the graphic screens. They are used to accesssurveillance files, failure listings and out-of-limit display by means ofsimple commands.

2.4.1.3 Indicators
To provide more clarity, limit overrun information is synthesized anddisplayed on ergonomically laid out indicators.
2.4.1.4 Synoptics screen
This function, described above, was added to reduce the number ofindicators and to enrich synthetic surveillance displays.
2.4.2 Other computer functions
2.4.2.1 Listing printout
2.4.2.2 Interaction
Using alphanumeric keyboards, engineers can control the computerrequesting the execution of programs relevant to the current test,change plot scales, and select parameters to be displayed.
2.4.2.3 Magnetic archives
These are provided firstly to create a complete history of the flight,and secondly to allow playback of flight passages after storage onthe disk, to provide decision elements during the current test.
2.5 SYSTEM 500 - LORAL INSTRUMENTATION
The SYSTEM 500 currently being used at Dassault Aviation, Istresconsists of two major components these being the ACQ 510 chassis andthe colour graphics workstation, namely a DECstation model 3100 runningunder the ULTRIX operating system. The ACQ 510 chassis houses thetelemetry decommutation, processing and output modules to provide realtime functions in the telemetry front end. In addition the ACQ 510 has amodule to control an external Bit Synchroniser. All control, setup andadministration is accomplished via the colour graphics workstation over anindustry standard TCP/IP Ethernet LAN. The workstation and applicationsoftware provide a very user friendly interface.
Real-Time flight test data is derived from either a telemetry receiver or pre-recorded flight test. The external bit synchroniser provides data and clocksignals to the ACQ 510 chassis. Housed within the ACQ 510 chassis are

the following modules to perform the necessary decommutation,processing and output of standard IRIG or Daniel PCM data streams:
- External Bit Sync Controller- System Controller- Ethernet Processor- Single Board Decommutator- FPP Daniel Decommutator- FPP- Data Processor/Compressor- Analogue Output Ports- Rear Panel Interface- Tag/Data Output
Each module has access to the ACQ-510 administration bus and the highspeed parallel ‘MUXBUS’. The MUXBUS is a fully arbitrated broadcast bus- data is passed on the MUXBUS as a 32 bit token made up of 16 bits ofTAG and 16 bits of data. MUXBUS speed is 4Mega Words/sec.
2.5.1 External Bit Sync Controller
The EBSC controller module allows the remote programming of aIntertechnique 7700 bit sync from a set-up window on the workstationdisplay.
2.5.2 System Controller
The System Controller module is the data acquisition subsystem’scontrol processor - on power up it initialises itself and performs amemory check. Each module in the ACQ-510 is interrogated andlogged in before executing a system generation. The System Controllermodule is based on an 8086 processor operating at 4 MHZ.
2.5.3 Ethernet Processor
The Ethernet Processor module functions as an I/O device between theACQ-510 and the workstation. Set-up and control information is passedover the standard TCP/IP Ethernet network. In addition the EP moduletransmits display information from the ACQ-510 to the graphicsworkstation over Ethernet.

2.5.4 Single Board Decommutator
The Single Board Decom is a standard IRIG telemetry decommutationmodule performing frame and sub-frame synchronization up to2Mb/sec. The serial PCM data is converted to parallel then taggedbefore outputting to theMUXBUS. This module is also used tosynchronise a Daniel data frame and provide parallel words to theMUXBUS. These words are passed to the MUXBUS and include theProgram ID word used by the Daniel FPP module.
2.5.5 FPP Daniel Decommutator[1]
The Daniel FPP module is based on a dedicated FPP module toprovide a word based decommutator under software control.Decommutation of Daniel zones, MS & LS time plus data isaccomplished by creating the necessary Daniel prime parameterswithin the parameter environment of the SYSTEM 500. These Danielparameters are then tagged and output to the MUXBUS for furtherdisplay, processing and output.
2.5.6 FPP (Field Programmable Processor)
A major advantage of the SYSTEM 500 is its ability to providesubstantial processing power on a single module, the FPP. A singlemodule can process over 2000 parameters at aggregate rates up to750K words/sec. As a practical example each FPP performs 220K fifth-order EU conversions per second. The peak processing rate for 64-bitfloating point processes is 20 MFLOPS or 10 MIPS.
A standard library of processing algorithms is provided for, but moreimportant is the ability to create custom algorithms which can simply beadded to the standard library. A high level language environment allowsunique algorithm development using “C”. Utilities such as linkers,loaders, debugging tools and simulators are provided with the algorithmdevelopment environment.
2.5.7 Data Processor/Compressor
In addition to the FPP the Data Processor/Compressor moduleprovides further front end processing algorithms such as bitmanipulation, logical functions, in and out of limit checks anddecommutation of embedded asynchronous data streams within an

IRIG PCM frame. This processing module is based on the AMD29116bit slice processor which allows preprogrammed algorithms to run attypical throughput rates of 280K parameters/sec.
2.5.8 Analogue Output Ports
This module provides eight analogue output ports for presentation on aoscillograph or similar strip chart recorder. The resolution of eachanalogue output is 12 bits.
2.5.9 Analogue/Digital Output Ports
This module provides 4xl6 bit output ports for discrete data output. Inaddition each parameter output also is available in analogue form.
2.5.10 Tag/Data Output
The Tag/Data output module allows selected prime and processed datato be output in parallel for interfacing to external devices and hostcomputers using the DR11W interface standard. In this particularapplication it passes data to the Dassault INGRID device for providingsynthetic displays and synoptics.
2.5.11 Rear Panel Interface
The rear panel interface simply provides connections to all externaldevices from the modules within the ACQ-510 chassis.
2.6 System 500 Software and Workstation
The SYSTEM 500 a high level user interface taking advantage of highresolution colour graphics displays. Pull-down menus and pop up windowscontrolled by a mouse or keyboard provide an easy to use operation. TheApplications software provides for various security levels to restrict accessto unauthorised users. Focusing on industry standards, the X windowssystem client/server architecture allows the multiple display terminals toaccess applications on clients physically located on computers orworkstations on the Ethernet.

2.6.1 System Administration
A series of windows allow tasks such as system management, frontend set-up and algorithm development. In addition alarms and userhistory review and module configuration and status viewing is featured.A standard, commercial, high performance database managementsystem with integral SQL is used to manipulate alarms, system errorsand operator history files.
2.6.2 System 500 Parameter Database
The system server manages the parameter database information thatthe user stores on hard disk and which is downloaded to the ACQ-510at system set-up. Files in the parameter database consist of two typesof information:
1. ACQ 510 Sub-system setup2. Workstation display setup information
Once parameter databases are created for each platform to be tested,they are stored and recalled from the workstation hard disc.
2.6.3 Standard Data Displays
Any parameter which has been created and stored in the data base canbe displayed on the workstation display in bar chart, strip chart orsimple data tables. The size and colour of such displays can of coursebe changed to suit user preferences. At the very top of the display is astatus panel and an annunciator panel for quick look display of flightcritical data.
2.6.4 Display Builder Software
For customising the display of data for presentation to engineersattending a flight test, Ll’s Display Builder software provides such anenvironment. The standard catalogue of widgets includes strip charts,meters, bars, scrolling data pages, bit mapped images and processdiagrams of on-board systems.
To automate the display changes, macros can be assigned to functionkeys. Such macros could be triggered by parameter value, time oralarm conditions.

Several tools are provided to enhance the interpretation of analoguedata displays. It is also possible to engage rulers and cursors todetermine exact values of analogue data anywhere on the tracing.
PLANNED IMPROVEMENTS IN THE SHORT TERM AND CONCLUSION
Telemetry is benefitting from new techniques in order to provide higher andhigher performance services. Computer software is being continuouslyimproved to satisfy new demands made by our computer engineers.
When coupled to workstations, the next generation of computers that we will beinstalling will make the use of powerful calculation and display programs toprovide even more complete and synthetic decision elements.
Better use must be made of important results obtained in real time by asignificant improvement in the telemetry transmission quality. An effort must bemade to reduce the error rate, which means that more frequencies must beallocated.
Relegated to the role of standby to the host computer for many years, thedecommutator is coming back into the limelight. With previous generationdecommutators, about fifty parameters were processed for a flight.
About 500, or ten times more, are now processed for the RAFALE C D01. Tasksare carried out with a complexity similar to those carried out by a computer.
General surveillance of the airborne measurement installation is provided by theaddition of an X terminal equipped with a track ball to access the parameterlistpick menu. We are relying on a decisive enrichment of decommutatordisplays with the arrival of Loral Instrumentation display builder software version3.0.
The rather simplistic DATA pages will be replaced by custom designed and veryclear pictures. Together with the track ball, this will be a flexible and powerfultool available to specialist engineers.
This interesting function should be associated with the imminent programmingof the system 500 by the host computer. PCM format description files,calibration characteristics and processing of most parameters will be transmittedthrough the ETHERNET network to the DS 3100 master station. All parameterswill then be input and may be used on the system 500 through parameterselection menus.
Finally, a connection with the host computer is currently being prepared using aTAG/DATA module. This could also replace the currently used framesynchronizer. This would then be the prelude to the system 500 being used aspreprocessor. The slow but continuously increasing transmission rates will forceus to select information sent to the computer for real time processing.
The SYSTEM 500 is ideally suited to the task. We can see that thisdecommutator can relieve the host computer from this task and can provideeven better performance. This is the purpose of the developments we aremaking with our supplier Loral Instrumentation.
We hope to make some of our telemetry stations capable of simplified operationby adding a printer to the decommutator, operating with a data spooler beingdeveloped by Loral Instrumentation.
Similarly, the evaluation of a disk connected to the MUXBUS bus presagesreplay possibilities. We anticipate improved performances from this concept.Developments at Loral Instrumentation include the PRO 550 sub-system,offering even greater throughput with the next generation MUXBUS II. Thisoffers a natural upgrade and growth path from the current system.
We have invested in training and the development of algorithms and amethodology for this equipment, which will be the basic principle of the solutionto be adapted for DASSAULT Flight Tests over the next ten years (figures 7and 8).
References
1. Taylor, Larry M., “An Advanced Decommutation System for the DanielFormat,” Proceedings of the European Telemetry Conference, 1987
© 1990 by Loral Instrumentation