real-time temperature monitoring system using …umpir.ump.edu.my/7611/1/cd6731.pdf · gui...
TRANSCRIPT

REAL-TIME TEMPERATURE MONITORING SYSTEM USING MATLAB
NUR LIYANA BT YUSOFF
This thesis is submitted as partial fulfilment of the requirements for the award of the
Bachelor of Electrical Engineering (Hons.) (Electronics)
Faculty of Electrical & Electronics Engineering
Universiti Malaysia Pahang
JUNE, 2012

v
ABSTRACT
This project involves the implement of temperature sensor for industrial
related applications in real-time. The purpose of this project is to monitor and
measure the temperature level of liquid or water. This project not only involves the
development of the Matlab software for monitoring purpose but also includes the
development of the sensor system. The sensor that will be use is the temperature
sensor which can measure the temperature of liquid or water and with suitable
temperature range. The sensor system should have DAQ capabilities using DAQ
cards which available in the laboratory. Matlab Programming language will be use to
develop interface for the sensor system. GUI (Graphical User Interface) is consists of
buttons that user easily can view the temperature will be creating using Matlab
software which is to monitor the temperature. The value of the temperature will be
detecting automatically base on the system and transfer the value using serial USB
port to the computer. Matlab will collect and record the data in graph format. In this
system, the developed sensor should capable to measure temperature in real-time.
The system also should capable to store and retrieve data for further analysis. The
sensor system will be tested in the laboratory environment and/or in real industrial
applications.

vi
TABLE OF CONTENTS
TITLE PAGE
TITLE PAGE I
STUDENT’S DECLARATION II
SUPERVISOR’S DECLARATION III
ACKNOWLEDGEMENT IV
ABSTRACT V
TABLE OF CONTENTS VI
LIST OF TABLES VIII
LIST OF FIGURES IX
LIST OF ABBREVIATIONS XI
LIST OF APPENDICES XII
CHAPTER 1 INTRODUCTION
1.1 Background 1
1.2 Problem Statement 2
1.3 Objective 3
1.4 Scopes of Project 3
1.5 Outlined Thesis 4
CHAPTER 2 LITERATURE REVIEW
2.1 Introduction 5
2.2 Seeback Effect 5
2.3 Temperature Sensor 8

vii
2.3.1 Thermocouple 8
2.3.1.1 Exposed Junction Thermocouple 11
2.3.1.2 Grounded Junction Probe Thermocouple 13
2.3.2 Resistance Temperature Detector (RTD) 14
2.3.3 Thermistor 15
2.3.4 Semiconductor Sensor 15
2.4 DAQ 17
2.5 MATLAB GUI 19
CHAPTER 3 METHODOLOGY
3.1 Introduction 20
3.2 Instruments 20
3.2.1 NI USB-TC01 21
3.2.2 Thermocouple Type J 22
3.2.3 MATLAB Software 22
3.3 Hardware 25
3.4 Software 27
3.5 Flow Chart 34
CHAPTER 4 RESULTS AND DISCUSSION
4.1 Introduction 35
4.2 Results 35
4.3 Discussion 81
CHAPTER 5 CONCLUSION AND RECOMMENDATIONS
5.1 Conclusion 83
5.2 Problem of Project and Proposed Solution 84
5.3 Future Recommendation 85
REFERENCES 86
Appendices 88
viii
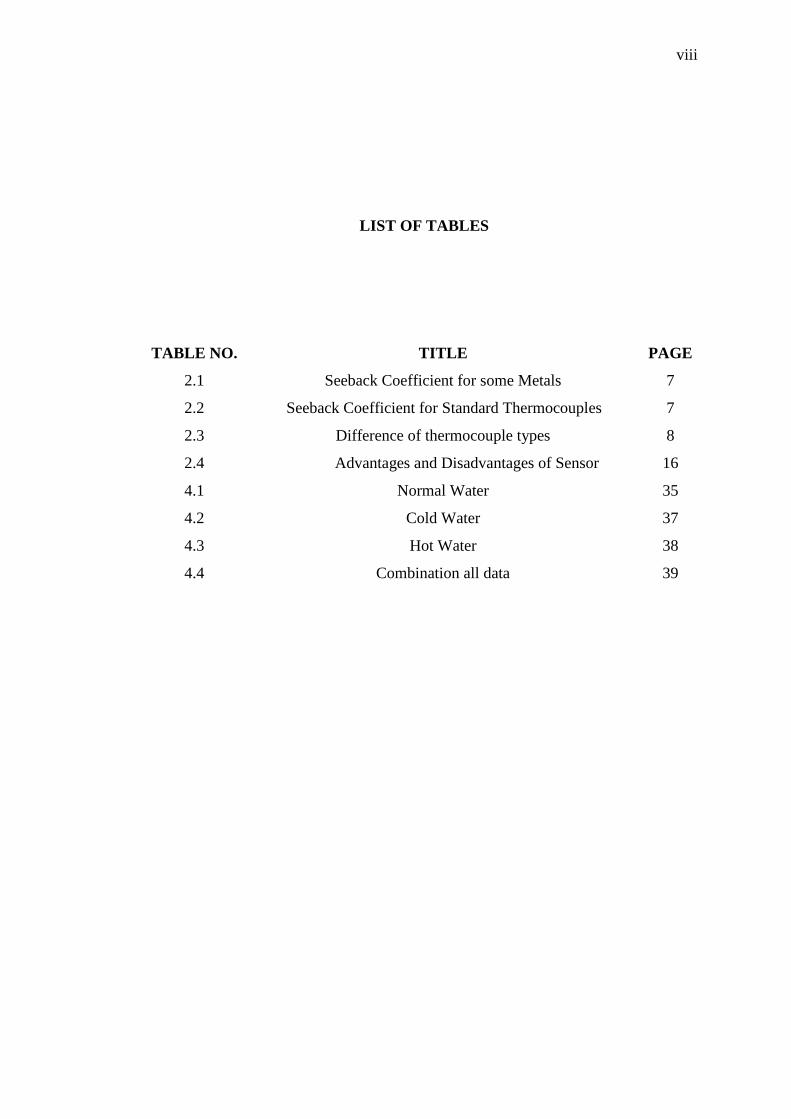
LIST OF TABLES
TABLE NO. TITLE PAGE
2.1 Seeback Coefficient for some Metals 7
2.2 Seeback Coefficient for Standard Thermocouples 7
2.3 Difference of thermocouple types 8
2.4 Advantages and Disadvantages of Sensor 16
4.1 Normal Water 35
4.2 Cold Water 37
4.3 Hot Water 38
4.4 Combination all data 39
ix
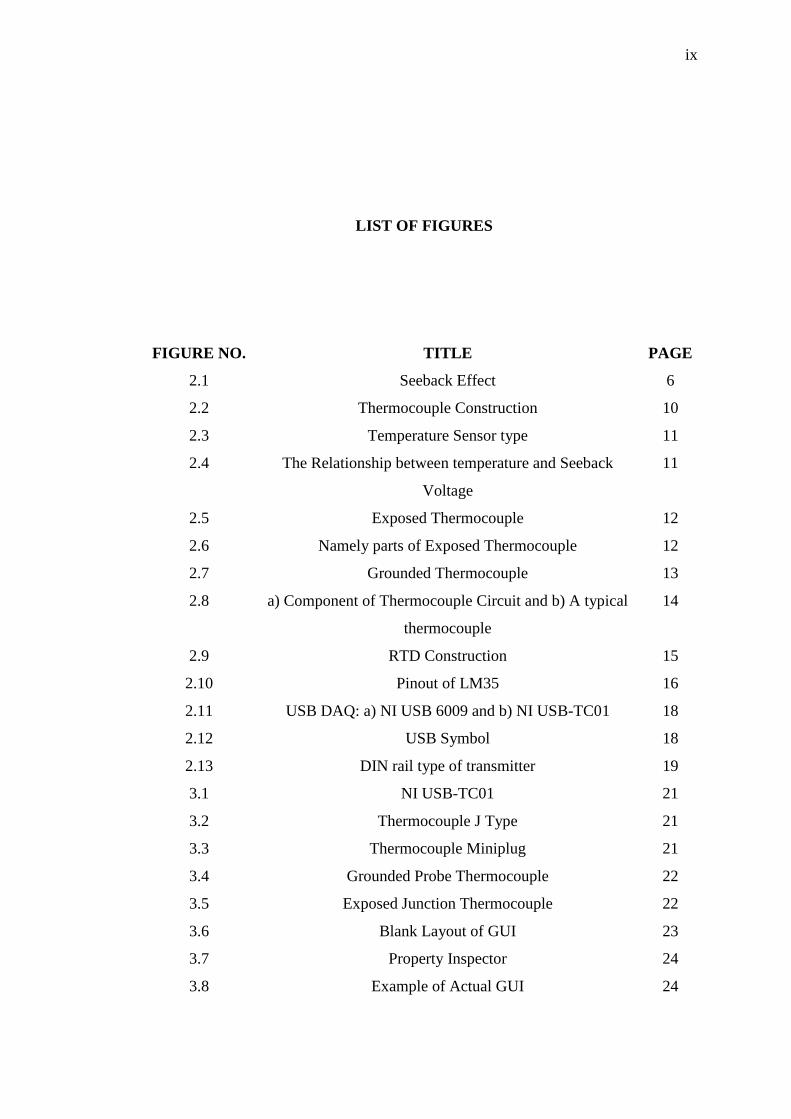
LIST OF FIGURES
FIGURE NO. TITLE PAGE
2.1 Seeback Effect 6
2.2 Thermocouple Construction 10
2.3 Temperature Sensor type 11
2.4 The Relationship between temperature and Seeback
Voltage
11
2.5 Exposed Thermocouple 12
2.6 Namely parts of Exposed Thermocouple 12
2.7 Grounded Thermocouple 13
2.8 a) Component of Thermocouple Circuit and b) A typical
thermocouple
14
2.9 RTD Construction 15
2.10 Pinout of LM35 16
2.11 USB DAQ: a) NI USB 6009 and b) NI USB-TC01 18
2.12 USB Symbol 18
2.13 DIN rail type of transmitter 19
3.1 NI USB-TC01 21
3.2 Thermocouple J Type 21
3.3 Thermocouple Miniplug 21
3.4 Grounded Probe Thermocouple 22
3.5 Exposed Junction Thermocouple 22
3.6 Blank Layout of GUI 23
3.7 Property Inspector 24
3.8 Example of Actual GUI 24

x
3.9 Example of Design GUI Layout 25
3.10 Example of M-file 25
3.11 Simplified Block Diagram 26
3.12 Real diagram of Hardware 26
3.13 Construction of Hardware 26
3.14 Device Name 27
3.15 Front Page of Measurement & Automation Explorer 27
3.16 Displayed NI USB-TC01 ID 28
3.17 Analog Signal Setting 28
3.18 Displayed Channel 29
3.19 Create Tasks Name 29
3.20 Displayed tasks 29
3.21 Source Code 30
3.22 Flow Chart 34
4.1 Normal Water 36
4.2 Colf Water 37
4.3 Hot Water 38
4.4 Comparison 40
4.5 GUI Result 40
4.6 Command Code 40
4.7 DAQTest Result 41

xi
LIST OF ABBREVIATIONS
A/D Analog to Digital
D/A Digital to Analog
DAQ Data Acquisition System
GUI Graphical User Interface
RTD Resistance Temperature Detector
PC Personal Computer
PTC Positive Temperature Coefficient
USB Universal Serial Bus
VB Visual Basic

1
CHAPTER 1
INTRODUCTION
1.1 BACKGROUND
The meaning of temperature is the changes of temperature or physical state
such as solid to liquid, liquid to gas and one crystalline form to another. Temperature
also the changes level of heat or cold of a material or device [12]
. Temperature
monitoring system is the process of monitor the temperature changes in order to
prevent from failure of operation or damage of a system. This system already applies
in industry such as automotive industries, air conditioning, power plant and other
industries such as HVAC system, heaters and boilers.
Sensor is the sensing device that can detect or measure a physical quantity
such as temperature, pressure, force and displacement. Sensor is the best device in
this project system which is to measure the temperature. Sensor has two types which
contact sensor and non-contact sensor. The non-contact sensor is for measuring the
surface that cannot be touched during the measurement process such as plastic,
silicon and glass. Contact temperature sensors measure it own temperature [4]
.
Examples of contact sensor are thermocouple, RTD and thermistor.

2
This project system is run and collect the data in real-time which using a
software that can analyze the data in real-time. Before the software can analyze the
data, must have some device that can grab the data from sensor and convert the data
into a data that PC (personal computer) can understand or read which, the device is
data acquisition system (DAQ). Function of DAQ is to convert the analog signal to
digital signal (which can understand by PC).
The aim of this project is to develop sensor system that capable measuring
and monitor the temperature changes in real-time. To perform real-time monitoring,
Matlab software is use in this project and other software can be use such as Labview
and Visual Basic (VB). Matlab, Labview and VB have the same function which can
use it to display the output or key-in the input value or parameter. This software still
have differences between each other which in Labview, the block diagram is link
with GUI model and it compatible with National Instruments (NI) device. While in
Matlab, simulink block diagram and GUI model is two different types of way in
using this software and not link each other.
1.2 PROBLEM STATEMENT
The problem statement in this project is the measurement and monitoring of
temperature in industrial liquid and material very important because it can affect the
result in the final product. The Graphical User Interface (GUI) is developing using
Matlab. With this GUI, user can monitor the change of temperature through user own
personal computer (PC).
3
1.3 OBJECTIVE
The objective of the project is:
i. To design GUI using Matlab for monitoring the change of
temperature
ii. To design and build a system with suitable range and precision of the
temperature sensor
iii. To develop sensor system which capable to monitoring temperature in
real-time
1.4 SCOPES OF PROJECT
Several scope of project is:
i. The hardware part of temperature system will be designed and
development
ii. The software for GUI and data analysis will be develop using Matlab
iii. The working sensor system will be tested in related industrial
application
iv. The sensor should capable to monitor temperature in real-time

4
1.5 OUTLINED THESIS
This thesis consists of five chapters which is the first chapter is the
Introduction that discuss about the background of this project, objectives, scope of
this project which are for the overall summary of works. The second chapter will
discuss about several theory and literature reviews that had been done in this project.
In this chapter, the basic theory of sensor, type of sensor and the function of DAQ
had been discussed. The process flow of the project will be discussed in Chapter 3
which is the methodology part. The second last chapter is the results and discussions
part which consists of data from GUI. Finally, the last chapter which is Chapter 5
will concluded overall of the project and future recommendation that can improve
this project.
5
CHAPTER 2
LITERATURE REVIEW
2.1 INTRODUCTION
In this chapter which is Chapter 2 will explain about the literature review that
related to temperature monitoring system which the fact or researcher idea were
taken from journals or articles related to this project. In this part consists of the types
of sensor, seeback effect, DAQ and the software.
2.2 SEEBACK EFFECT
The first discovered the phenomenon of Seeback Effect is Thomas Johann
Seeback in year 1800s. The voltage difference occurs between two substances when
there is temperature difference between two not similar electrical conductors or
semiconductors. This phenomenon is called the Seeback Effect. Seeback Effect
produced small voltages which is only a few microvolts per Kelvin of temperature
difference at the junction. If a large temperature difference is maintained, small-scale
electrical power can be provided by the large arrays of Seeback Effect devices [10]
.
6
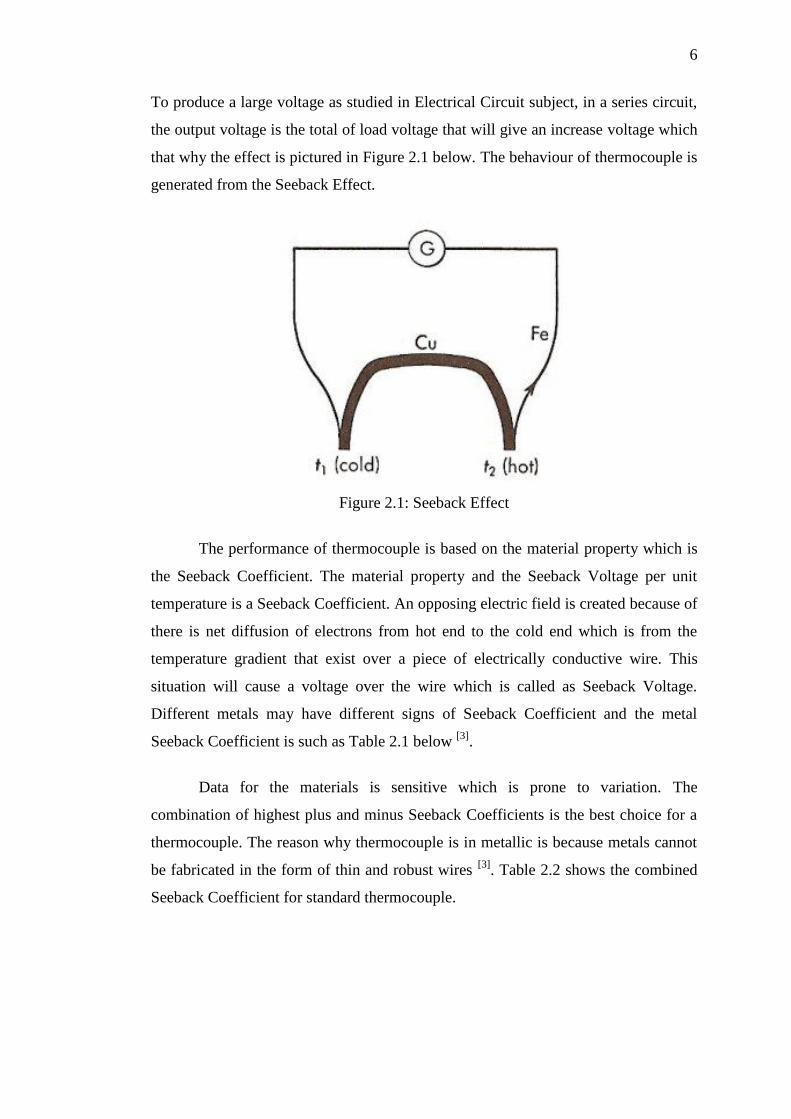
To produce a large voltage as studied in Electrical Circuit subject, in a series circuit,
the output voltage is the total of load voltage that will give an increase voltage which
that why the effect is pictured in Figure 2.1 below. The behaviour of thermocouple is
generated from the Seeback Effect.
Figure 2.1: Seeback Effect
The performance of thermocouple is based on the material property which is
the Seeback Coefficient. The material property and the Seeback Voltage per unit
temperature is a Seeback Coefficient. An opposing electric field is created because of
there is net diffusion of electrons from hot end to the cold end which is from the
temperature gradient that exist over a piece of electrically conductive wire. This
situation will cause a voltage over the wire which is called as Seeback Voltage.
Different metals may have different signs of Seeback Coefficient and the metal
Seeback Coefficient is such as Table 2.1 below [3]
.
Data for the materials is sensitive which is prone to variation. The
combination of highest plus and minus Seeback Coefficients is the best choice for a
thermocouple. The reason why thermocouple is in metallic is because metals cannot
be fabricated in the form of thin and robust wires [3]
. Table 2.2 shows the combined
Seeback Coefficient for standard thermocouple.

7
Table 2.1: Seeback Coefficient for some metals
Table 2.2: Seeback Coefficients for Standard Thermocouples

8
2.3 TEMPERATURE SENSOR
Sensor is the sensing device or a detector that can detect or measure a
physical quantity such as temperature, pressure, force and displacement. Sensor also
known as an element that changes to an electrical signal from some physical
parameter. Output signal from sensor can be measured and recorded but must be
converted the physical condition into an information that control system can
understand [11]
. This project is to measure temperature which sensor is the best device
for this situation.
There are two types of sensor which is contact sensor and non-contact sensor.
The non-contact sensor is for measuring the surface that cannot be touched during
the measurement process such as plastic, silicon and glass. Contact temperature
sensors measure it own temperature [4]
. Examples of contact sensor are
thermocouple, RTD, thermistor and semiconductor device.
2.3.1 THERMOCOUPLE
Temperature monitoring system is widely use in industry which is very
important nowadays that will involve such a losses if not monitor it. To develop a
system that will monitor and measure a temperature is by using the temperature
sensor. Thermocouple is one of the temperature sensors which are inexpensive and
versatile devices. Thermocouple has eight types of it, which is B type, E type, J type,
K type, N type, R type, S type and T type. Each of these has their own characteristic.
Table 2.3 show the difference between eight types of thermocouples.
Table 2.3: Difference of thermocouple types
Thermocouple
Type
Overall
Range
Typical
Accuracy*
Comments
Type B
Platinum(+)
Rhodium (-)
100 to 1800 5 °C (at
1000°C)
-For high temperature measurements.
-Give same output at 0 °C and 42 °C.
-Useless below 50 °C because give same output.
Type E
Chromel (+)
-200 to 900 1.7 °C -has high output (68 µV/°C) makes it well suited to low
temperature (cryogenic) use.

9
Thermocouple
Type
Overall
Range
Typical
Accuracy*
Comments
Constantan (-) -Another property is non-magnetic.
Type J
Iron (+)/
Constantan (-)
-40 to 760 2.2 °C -Limited range
-less popular than type K.
-should not be used above 760°C as an abrupt magnetic
transformation will cause permanent decalibration.
Type K
Chromel (+)
Alumel (-)
-200 to 1300 2.2 °C -‘general purpose’ thermocouple.
-low cost and popular. Sensitivity is approx 41 µV/°C.
Use type K unless you have a good reason not to.
Type N
Nicrosil (+)
Nisil (-)
-200 to 1300 2.2 °C -High stability and resistance to high temperature
oxidation
-high temperature measurements without the cost of
platinum (B,R,S) types.
- 'improved' type K and becoming popular.
Type R
(Platinum 13%
Rhodium (+) /
Platinum (-))
-50 to 1760 1.5 °C -high temperature measurements up to 1600 °C.
- Low sensitivity (10 µV/°C) and high cost
- Unsuitable for general purpose use.
Type S
Platinum 10%
Rhodium (+)
Platinum (-)
-50 to 1760 1.5 °C -high temperature measurements up to 1600 °C.
- Low sensitivity (10 µV/°C) and high cost
-unsuitable for general purpose use.
-used as the standard of calibration for the melting
point of gold (1064.43 °C) due to high stability
Type T
Copper (+)
Constantan (-)
-200 to 400 1 °C -Best accuracy of common thermocouples
-used for food monitoring and environmental
applications.
Among all type of thermocouple, K type is the most popular and mostly use.
The range for J type is between -40 to 760°C which mean that this type of
thermocouple is the lower ranges of temperature and can use it for small industries
and small temperature usage application. For example, a K type is the most popular
thermocouple at 300 °C will produce 12.2 mV. This voltage produced show that
thermocouples are self-powered and require no excitation current unlike RTDs and
thermistors [15]
. Thermocouple will produce it own voltage or in other word is self-
powered but it cannot be measure using voltmeter. Thermocouple has the
temperature range between -200 to 20000C and it relatively a low cost and also
versatile.
The thermocouple sensor has a small output voltage in the milivolt range. A
monolithic thermocouple amplifier with cold junction compensation (AD595) is used
to amplify the output voltage [5]
. The basic operation of thermocouple is based on the
physical principles if two dissimilar metal wires are joined together at one end and a

10
small voltage difference is generated across two unheated end which is called as
thermoelectric emf or also called as Seeback voltage. This phenomenon is known as
Seeback effect. This is proved that thermocouple is self-powered. Cold-junction
compensation is a signal conditioning technique that employed when using
thermocouple for measurement.
Based on Figure 2.2 below, sensing junction and reference junction must be
connect each to a different temperature, then the voltage difference can be detected.
This voltage different will be zero if the junctions are at the same temperature and
will increase as the temperature of one junction relative to the other is changed until
a peak is reached [12]
. Each wire have different thermoelectric sensitivities or known
as Seeback coefficient which mean for every 1°C difference in temperature, the
Seeback voltage which it value is same as Seeback coefficient is induced. The
relationship between Seeback voltage and temperature is proportional which produce
a linear graph only for small changes in temperature which shows in Figure 2.4 [6]
.
Figure 2.2: Thermocouple construction
11
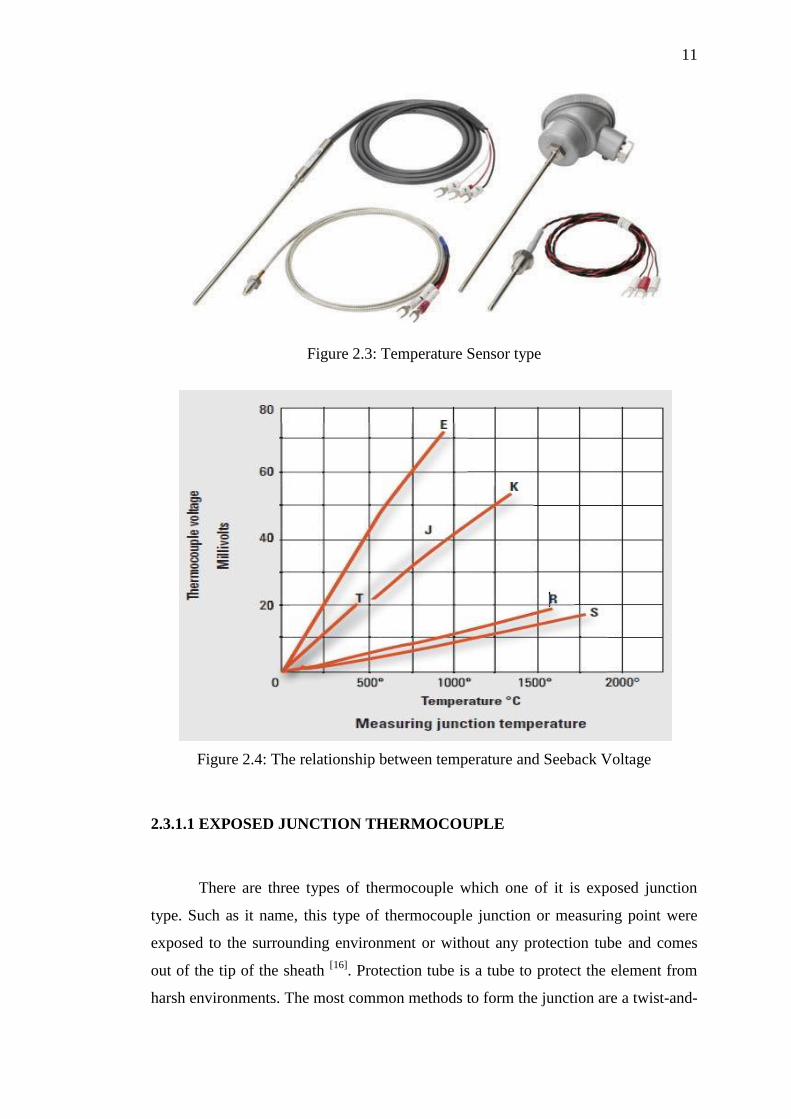
Figure 2.3: Temperature Sensor type
Figure 2.4: The relationship between temperature and Seeback Voltage
2.3.1.1 EXPOSED JUNCTION THERMOCOUPLE
There are three types of thermocouple which one of it is exposed junction
type. Such as it name, this type of thermocouple junction or measuring point were
exposed to the surrounding environment or without any protection tube and comes
out of the tip of the sheath [16]
. Protection tube is a tube to protect the element from
harsh environments. The most common methods to form the junction are a twist-and-
12
weld procedure or butt-welded [1]
. The maximum temperature may be lower if the
probe sheath diameter is smaller will causes the response faster.
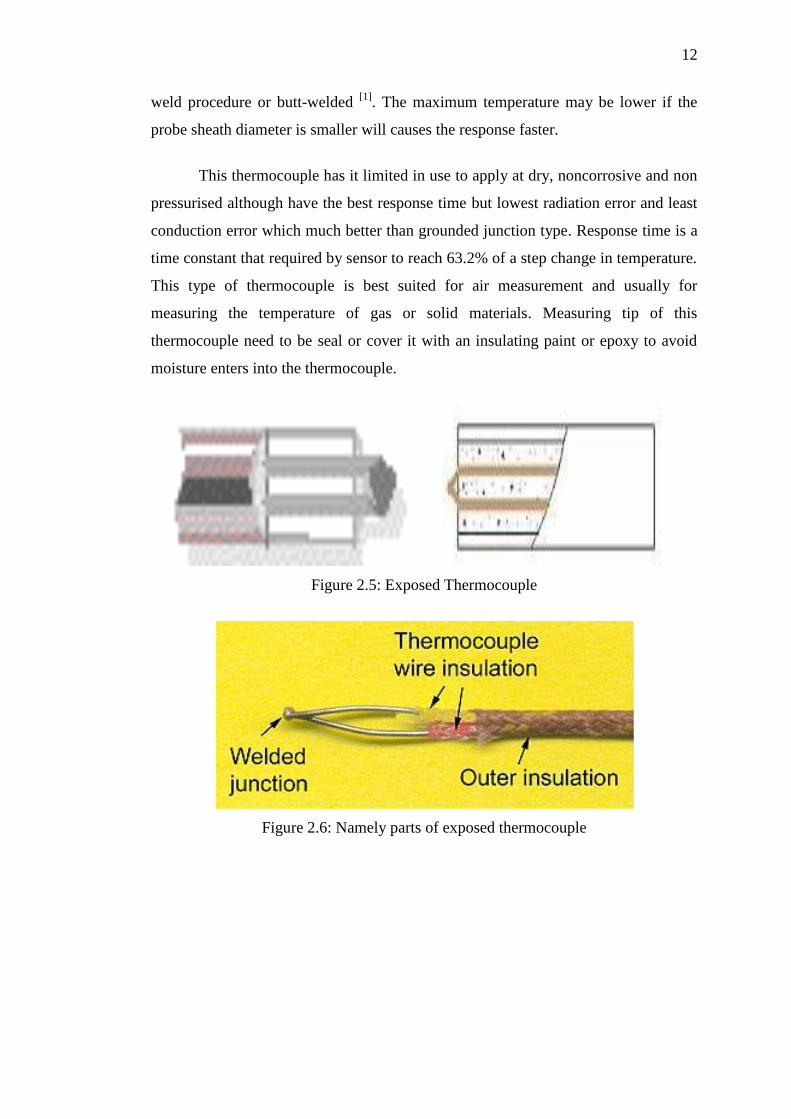
This thermocouple has it limited in use to apply at dry, noncorrosive and non
pressurised although have the best response time but lowest radiation error and least
conduction error which much better than grounded junction type. Response time is a
time constant that required by sensor to reach 63.2% of a step change in temperature.
This type of thermocouple is best suited for air measurement and usually for
measuring the temperature of gas or solid materials. Measuring tip of this
thermocouple need to be seal or cover it with an insulating paint or epoxy to avoid
moisture enters into the thermocouple.
Figure 2.5: Exposed Thermocouple
Figure 2.6: Namely parts of exposed thermocouple

13
2.3.1.2 GROUNDED JUNCTION PROBE THERMOCOUPLE
Another type of thermocouple is the grounded junction probe thermocouple
which is different from exposed junction where the wire at the tip is physically
welded or melt together to the inside of the probe wall which is referred as the sheath
of the probe and allow them to solidify and forming a completely sealed integral
junction [1]
. Through the probe wall, good heat is transfer from the outside to the
thermocouple junction. The common material of the sheath includes stainless steel
and Inconel. Cause of broad chemical compatibility, stainless steel is preferred but
support lower temperature range than Inconel.
The advantages of the grounded junction are fast response time, more
accurate reading at short distance but most vulnerable to electrical ground loops,
noise pickup and the possibility that the thermo elements may alloy with the sheath
are the disadvantages of this thermocouple [1]
. Rather than bending and welding the
wires to the tip, it is better to bending and welding to the inside wall of the sheath to
achieve fast response time. This thermocouple is more rugged and capable tolerating
physical and mechanical abuse [16]
. This junction type is for measuring static or
flowing corrosive gas and liquid temperatures and also used in high-pressure
conditions.
Noise is one of the disadvantages of this type of thermocouple. Noise is the
signals that are the same on both wires which can be minimised. To ensure both
wires pick up the same noise signal, the cable are twisted together. If there still a
remaining noise, used analog to digital converter (ADC) to average out the remaining
noise [8]
.
Figure 2.7: Grounded Thermocouple
14
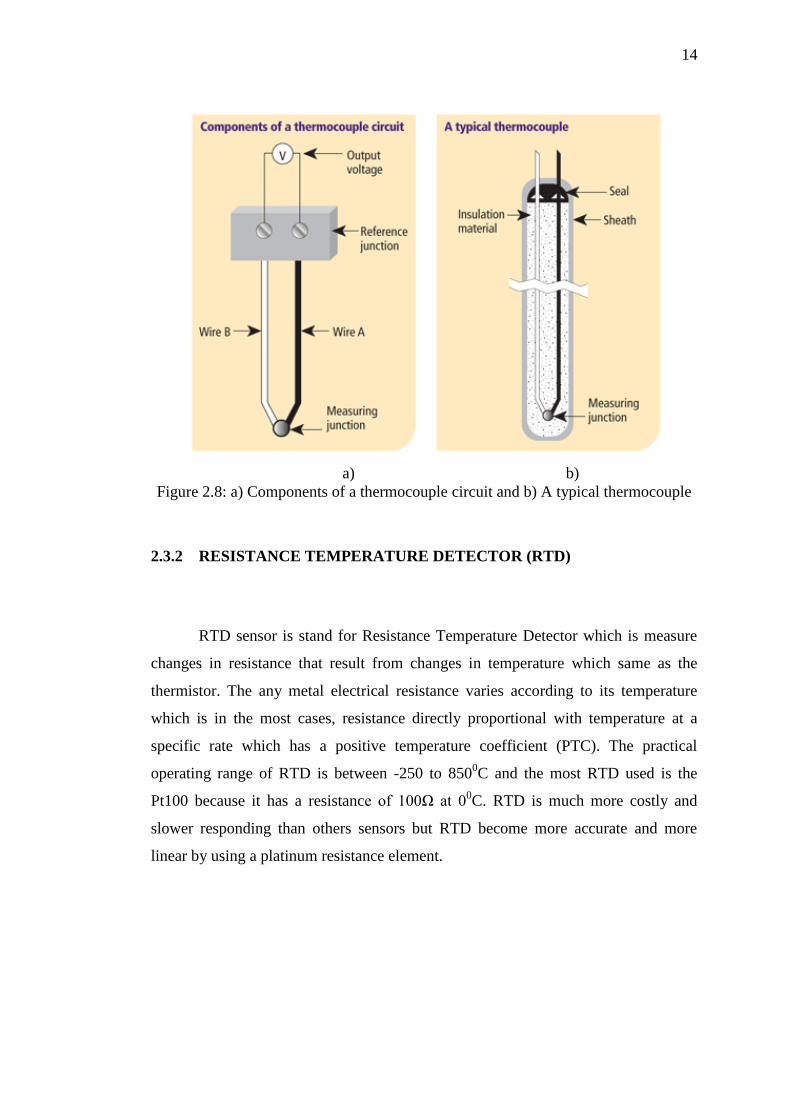
a) b)
Figure 2.8: a) Components of a thermocouple circuit and b) A typical thermocouple
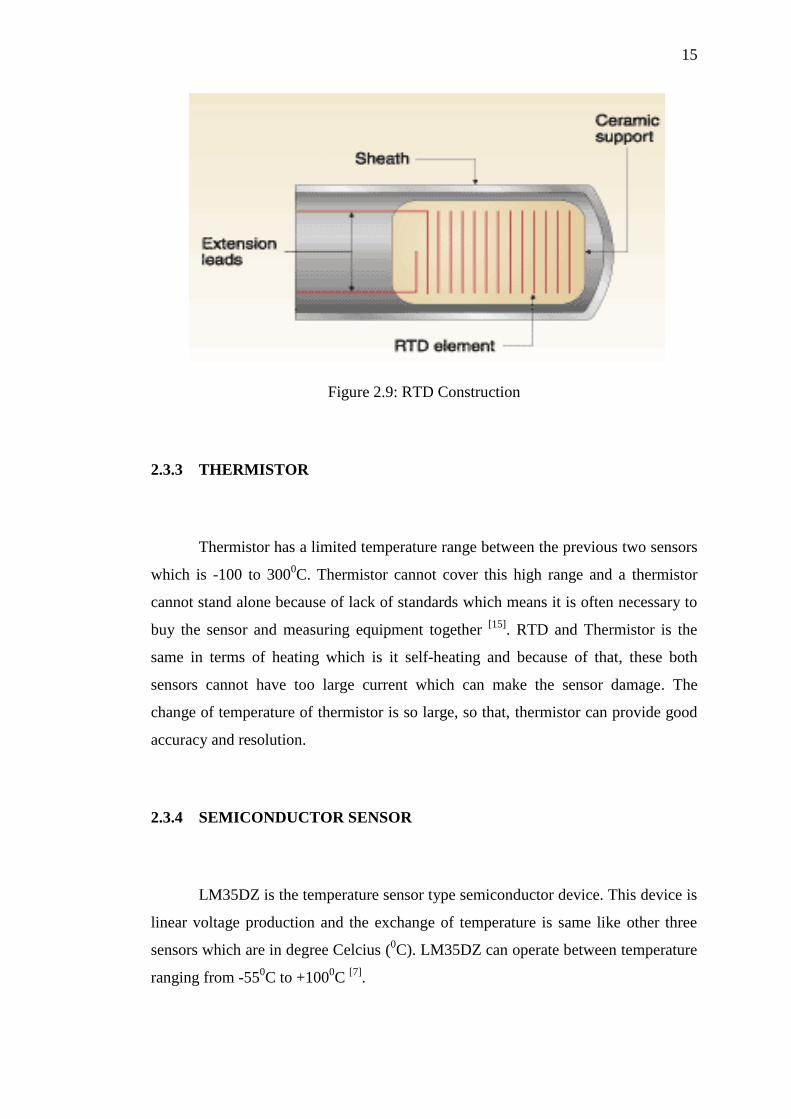
2.3.2 RESISTANCE TEMPERATURE DETECTOR (RTD)
RTD sensor is stand for Resistance Temperature Detector which is measure
changes in resistance that result from changes in temperature which same as the
thermistor. The any metal electrical resistance varies according to its temperature
which is in the most cases, resistance directly proportional with temperature at a
specific rate which has a positive temperature coefficient (PTC). The practical
operating range of RTD is between -250 to 8500C and the most RTD used is the
Pt100 because it has a resistance of 100Ω at 00C. RTD is much more costly and
slower responding than others sensors but RTD become more accurate and more
linear by using a platinum resistance element.
15
Figure 2.9: RTD Construction
2.3.3 THERMISTOR
Thermistor has a limited temperature range between the previous two sensors
which is -100 to 3000C. Thermistor cannot cover this high range and a thermistor
cannot stand alone because of lack of standards which means it is often necessary to
buy the sensor and measuring equipment together [15]
. RTD and Thermistor is the
same in terms of heating which is it self-heating and because of that, these both
sensors cannot have too large current which can make the sensor damage. The
change of temperature of thermistor is so large, so that, thermistor can provide good
accuracy and resolution.
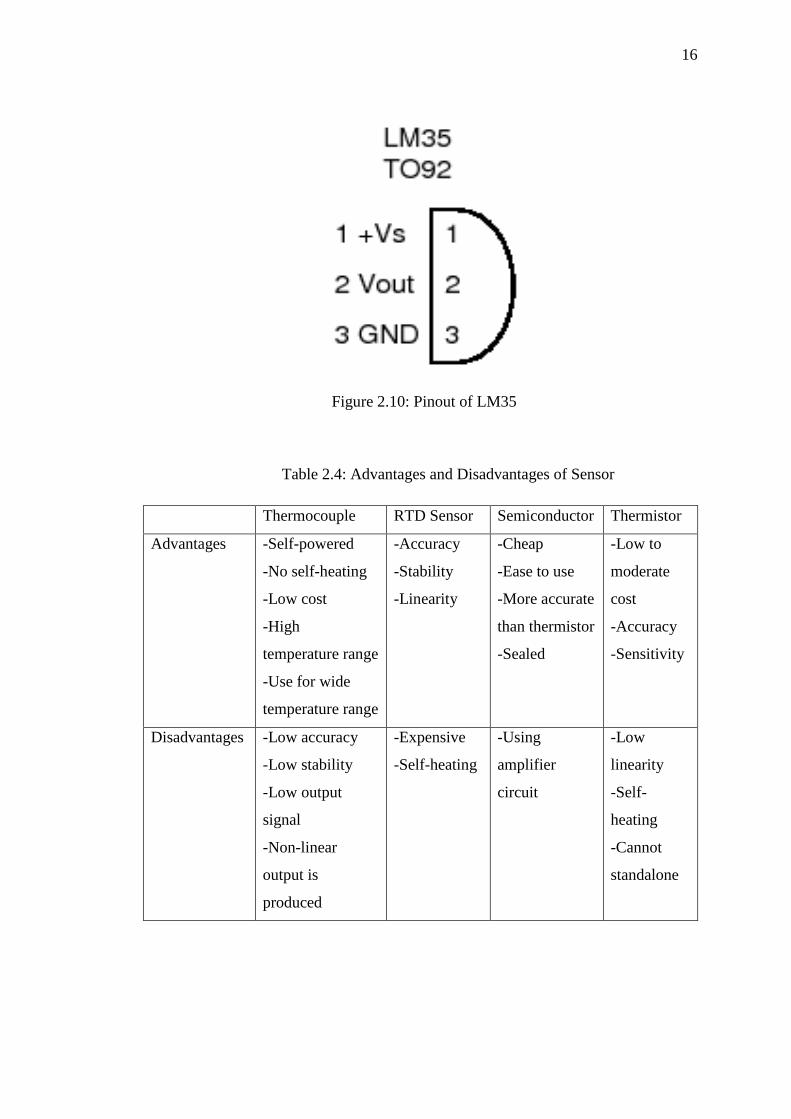
2.3.4 SEMICONDUCTOR SENSOR
LM35DZ is the temperature sensor type semiconductor device. This device is
linear voltage production and the exchange of temperature is same like other three
sensors which are in degree Celcius (0C). LM35DZ can operate between temperature
ranging from -550C to +100
0C
[7].
16
Figure 2.10: Pinout of LM35
Table 2.4: Advantages and Disadvantages of Sensor
Thermocouple RTD Sensor Semiconductor Thermistor
Advantages -Self-powered
-No self-heating
-Low cost
-High
temperature range
-Use for wide
temperature range
-Accuracy
-Stability
-Linearity
-Cheap
-Ease to use
-More accurate
than thermistor
-Sealed
-Low to
moderate
cost
-Accuracy
-Sensitivity
Disadvantages -Low accuracy
-Low stability
-Low output
signal
-Non-linear
output is
produced
-Expensive
-Self-heating
-Using
amplifier
circuit
-Low
linearity
-Self-
heating
-Cannot
standalone