real timequantitativepcroverview
TRANSCRIPT

8/8/2019 Real TimequantitativePCROverview
http://slidepdf.com/reader/full/real-timequantitativepcroverview 1/8
1
The polymerase chain reaction (PCR) has revolutionized the detection of DNA and RNA. As little as a single copyof a particular sequence can be specifically amplified and detected. Theoretically, there is a quantitative relationship
between amount of starting target sequence and amount of PCR product at any given cycle. In practice, though, it is
a common experience for replicate reactions to yield different amounts of PCR product. The development of real-time
quantitative PCR has eliminated the variability traditionally associated with quantitative PCR, thus allowing the
routine and reliable quantitation of PCR products.
History of Real-Time PCR Techniques
Higuchi et al.1,2 pioneered the analysis of PCR kinetics by constructing a system that detects PCR products as
they accumulate. This “real-time” system includes the intercalator ethidium bromide in each amplification reaction,
an adapted thermal cycler to irradiate the samples with ultraviolet light, and detection of the resulting fluorescence
with a computer-controlled cooled CCD camera. Amplification produces increasing amounts of double-stranded
DNA, which b inds ethidium bromide, r esulting in an increase in fluorescence. By plotting the increase in fluores-
cence versus cycle number, the system produces amplification plots that provide a more complete picture of the
PCR process than assaying product accumulation after a fixed number of cycles.
Chemistry Developments For Real-Time PCR
Fluorogenic Probes
Real-time systems for PCR were improved by probe-based, rather than intercalator-based, PCR product detec-
tion. The principal drawback to intercalator-based detection of PCR product accumulation is that both specific
and nonspecific products generate signal. An a lternative method, the 5 ' nuclease assay,3,4 provides a real-time
method for detecting only specific amplification pr oducts. Holland et al. 3 were the first to demonstrate that cleavage
of a target probe during PCR by the 5' nuclease activity of Taq DNA polymerase could be used to detect amplifica-
tion of the tar get-specific product. In addition to th e components of a typical amplification, reactions included a
probe labeled with
32
P on its 5' end and blocked at its 3' end so it could not act as a primer. During amplification,annealing of the probe to its target sequence generates a substrate that is cleaved by the 5' nuclease activity of Taq
DNA polymerase when the enzyme extends from an upstream primer into the region of the probe. This dependence
on polymerization ensures that cleavage of the pr obe occurs only if the target sequence is being amplified. After
PCR, Holland et al. measured cleavage of the probe by using thin layer chromatography to separate cleavage
fragments from intact probe.
The development of fluorogenic probes by Lee et al.5 made it possible to eliminate post-PCR processing for the
analysis of probe degradation. The probe is an oligonucleotide with both a reporter fluorescent dye and a quencher
dye attached. While the probe is intact, the proximity of the quencher greatly reduces the fluorescence emitted by
the reporter dye by Förster resonance energy transfer (FRET) through space. Probe design and synthesis has been
simplified by the finding that adequate quenching is observed for probes with the reporter at the 5' end and the
quencher at the 3' end.6
Figure 1 diagrams what happens to a fluorogenic probe during the extension phase of PCR. If the target sequence
is present, the probe anneals downstream from one of the primer sites and is cleaved by the 5' nuclease activity of
T aq DNA polymerase as this primer is extended. This cleavage of the probe separates the reporter dye from
quencher dye, increasing the r eporter dye signal. Cleavage removes the pr obe from the ta rget strand, a llowing
primer extension to continue to the end of the template strand. Thus, inclusion of the probe does not inhibit the
overall PCR process. Additional reporter dye molecules are cleaved from their r espective probes with each cycle,
effecting an increase in fluorescence intensity proportional to the amount of amplicon produced.
The advantage of fluorogenic probes over DNA binding dyes is that specific hybridization between probe and
target is required to generate fluorescent signal. Thus, with fluorogenic probes, non-specific amplification due
to mis-priming or primer-dimer artifact does not generate signal. Another advantage of fluorogenic probes is that
1
DNA/RNA Real-Time Quantitative PCR

8/8/2019 Real TimequantitativePCROverview
http://slidepdf.com/reader/full/real-timequantitativepcroverview 2/8
2
they can be labeled with different, distinguishable reporter dyes. By using probes labeled with different reporters,
amplification of two distinct sequences can be detected in a single PCR reaction. The disadvantage of fluorogenic
probes is that different probes must be synthesized to detect different sequences.
Double-Stranded DNA Binding DyesSmall molecules that bind to double-stranded DNA can be divided into two classes: intercalators and minor groove
binders. 8 Higuchi et al. used the intercalator ethidium bromide for their real-time detection of PCR. Hoeschst 33258
is an example of a minor groove binding dye whose fluorescence increases when bound to double-stranded DNA.9
Regardless of binding mechanism, there are two requirements for a DNA binding dye for real-time detection of PCR:
1) increased fluorescence when bound to double-stranded DNA; 2) no inhibition of PCR. PE Biosystems has developed
conditions that permit the use of the SYBR® Green I dye10 in PCR without inhibition and with increased sensitivity
compared to ethidium bromide. The mechanism of SYBR® Green I dye’s interaction with DNA (intercalator vs. groove
binding) is not known.
Both the advantage and disadvantage of using a DNA binding dye for real-time detection of PCR are that the
dye allows detection of any doub le-stranded DNA generated du ring PCR. On t he plus side, this means versatility
because the same dye can be used to detect any amplified product. Thus, any PCR amplification can be monitored
simply by including the generic DNA binding dye with the other PCR reagents. On the negative side, both specificand non-specific products generate signal. Thus, any mis-priming events that lead t o spurious bands observed on
electrophoretic gels will generate false positive signal when a generic DNA binding dye is used for real-time detection.
Another a spect of using DNA binding dyes is that multiple dyes bind t o a single amp lified molecule. This
increases the sensitivity for detecting amp lification p roducts. A consequence of multiple dye binding is that the
amount of signal is dependent on the mass of double-stranded DNA produced in the reaction. Thus, if the ampli-
fication efficiencies are the same, amplification of a longer product will generate more signal than a shorter one.
This is in contrast to the use of a fluorogenic probe, in which a single fluorophore is released from quenching for
each amplified m olecule synthesized, regardless of its length.
Instrumentation
PE Biosystems has two instruments designed to detect fluorescence during the thermal cycling of PCR. Thesimpler system is the GeneAmp® 5700 Sequence Detection System. This complete system consists of an Optical
Detector and a GeneAmp® PCR System 9600, coordinately controlled by software running on a Windows®-based
computer. The system has been designed for efficient detection of PCR product accumulation using either SYBR®
Green I double stranded DNA binding dye or TaqMan ® fluorogenic probes. The 96 reaction tubes are irradiated
with a white light source and the resulting fluorescence is detected using a CCD array to capture an image of all
96 wells. The software collects the images throughout the thermal cycling of PCR and analyzes the data to generate
an amplification plot for each reaction. Fluorogenic probes labeled with fluoroscein can be detected on the 5700
system, but the instrument does not have the capability of distinguishing two or more fluorophores. Despite this
single-color detection limitation, however, the 5700 system is still able to use an internal reference dye (ROX) to
Figure 1. Stepwise representation of the forklike-structure–dependent, polymerization-associated, 5' to 3' nuclease activity of Ta q DNA polymerase acting on a fluorogenic probe during one ext ension phase of PCR.7
Two fluorescent dyes, a reporter (R)and a quencher (Q), are attached tothe 5' and 3' ends of a TaqMan ® probe.
When both dyes are attached tothe probe, reporter dye emissionis quenched.
During each extension cycle, theTaq DNA polymerase cleaves thereporter dye from the probe.
Once separated from the quencher,the reporter dye emits its characteristicfluorescence.
RR = REPORTER
QQ = QUENCHER
Polymer i za t i on
PROBE3’
3’
5’
5’
5’
5’
3’
REVERSE
PRIMER
FORWARD
PRIMER R Q
St rand D isp lacement
3’
3’
5’
5’
5’
5’
3’
QR
Cleavage
3’
3’
5’
5’
5’
5’
3’
QR
Polymer i za t i on Comple ted
3’
3’
5’
5’
5’
5’
3’
Flourogenic 5' Nuclease Chemistry
8/8/2019 Real TimequantitativePCROverview
http://slidepdf.com/reader/full/real-timequantitativepcroverview 3/8
3
norma lize for non-PCR-related, well-to-well fluctuat ions in fluorescence. This ab ility to normalize is achieved by
using fluorescence readings tak en at 95 ºC in the baseline region and is essential for reprodu cible results.
The ABI PRISM® 7700 Sequence Detection System is a more flexible system designed to take full advantage of the
benefits of fluorogenic probe detection. The 7700 system has a built-in thermal cycler and a laser directed via fiber
optic cables to each of the 96 sam ple wells. The fluorescence emission t ravels back t hrough the cab les to a CCD
camera detector. Because each well is irradiated sequentially, the dimensions of the CCD array can be used for
spectral resolution of the fluorescent light. This contrasts with the 5700 system, in which the CCD is used for spat ialresolution of the 96 wells. Because the 7700 instrument detects an entire fluorescence spectrum, the system is
capab le of distinguishing and quan titating mu ltiple fluorophores in each sample well. Th e software an alyzes the
data by first calculating the contribution of each component dye to the experimental spectrum. Each reporter signal
is then d ivided by the fluorescence of an internal r eference dye (ROX) in order to norm alize for non- PCR related
fluorescence fluctua tions occurring well-to-well or over time. The use of this interna l reference dye, enabled by t he
ability to distinguish fluorophores, increases the precision of the data obtained with the 7700 system. The fluores-
cence emissions of SYBR® Green I dye and ROX dye are well resolved, so the benefit of using an internal reference
dye is obtained for SYBR® Green I dye detection of PCR on the 77 00 system. Th e other ad vantage of distinguish-
ing fluorophores is that probes labeled with different reporter dyes can be used so that more than one PCR target can be
detected in a single tube.
Real-Time PCR QuantitationThe ab ility to mon itor t he r eal-time pr ogress of the PCR completely revolutionizes the way one appr oaches
PCR-based quantit ation of DNA and RNA. Reactions are characterized by the point in t ime du ring cycling when
amplification of a PCR product is first detected rather than the amount of PCR product accumulated after a fixed
number of cycles. The higher the starting copy number of the nucleic acid target, the sooner a significant increase
in fluorescence is observed.
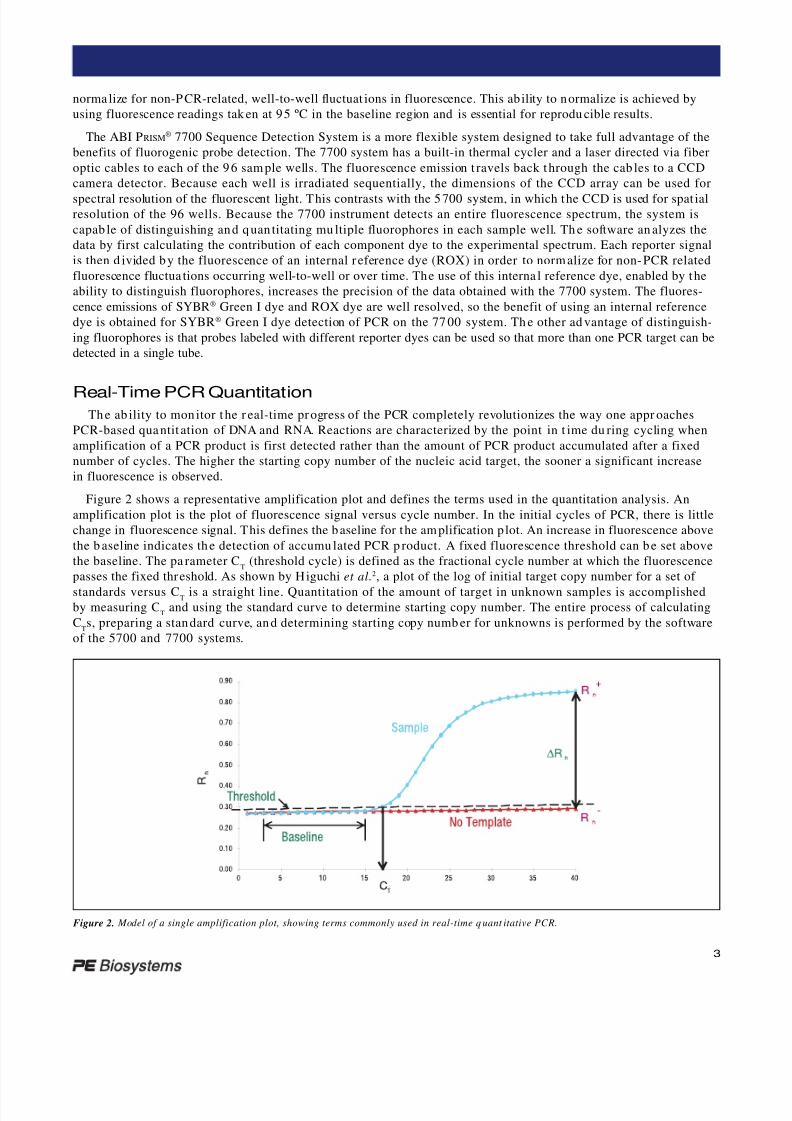
Figure 2 shows a representative amplification plot and defines the terms used in the quantitation analysis. An
amplification plot is the plot of fluorescence signal versus cycle number. In the initial cycles of PCR, there is little
change in fluorescence signal. This defines the baseline for the am plification p lot. An increase in fluorescence above
the b aseline indicates the detection of accumu lated PCR p roduct. A fixed fluorescence threshold can be set above
the baseline. The pa rameter CT
(threshold cycle) is defined as the fractional cycle number at which the fluorescence
passes the fixed threshold. As shown by Higuchi et al.2, a plot of the log of initial target copy number for a set of
standards versus CT is a straight line. Quantitation of the amount of target in unknown samples is accomplishedby measuring C
Tand using the standard curve to determine starting copy number. The entire process of calculating
CTs, preparing a standard curve, and determining starting copy numb er for unknowns is performed by the software
of the 5700 and 7700 systems.
Figure 2. Model of a single amplification plot, showing terms commonly used in real-time q uant itative PCR.

8/8/2019 Real TimequantitativePCROverview
http://slidepdf.com/reader/full/real-timequantitativepcroverview 4/8
4
Figure 3a shows amplification, using the 5700 system, of the human β-actin gene in five-fold dilutions of genomic
DNA. In this figure, the change in fluorescence of SYBR® Green I dye is plotted versus cycle number. Six replicates
were run for each DNA amount. Figure 3b shows the same data, but with the log of the change in fluorescence
plotted versus cycle number. Th e 5700 system software calculated th e CT
(threshold cycle) for each reaction.
The CT
values are plotted versus the log of the initial amount of genomic DNA to give the standard curve shown
in Figure 3c.
4a)
4b)
96 replicates
96 replicates
20 21 22 23 24 25 26 27 28
Figure 4. Amplification of a segment of th e β-actin gene from human genomic DNA. Samples contained 10 ng human genomic DNA (corresponds to3300 copies of a single copy gene) and were amplified using the compo-
nents of T aqMan PCR Reagent Kit (PE Biosystems). (a) Amplification plots of 96 replicates. (b) Detail of cycles 20–28. The abscissa is placed at a ∆ R
nvalue of 0.05 to show t he threshold used for calculation of C
T .
The average final ∆ Rn
value at cycle 40 is 1.03 ± 0.22 (c.v. = 21.4%).
The average C T
value is 24.64 ± 0.11. A standa rd deviation of 0.11 for C
T corresponds to a c.v. of 7.9% for calculated starting copy number.
Experiment performed by Traci Allen, PE Biosystems.
3a)
Figure 3. Amplification of the human β-action gene in five-fold dilutions of genomic DNA using the GeneAmp® 5700 Sequence
Detection Sy stem. (a) Amplification plot showing the cha nge in fluorescence of SYBR® Green I dy e plotted versus cycle numb er.(b) Same data showing the log of the change in fluorescence
plotted versus cycle number. (c) Standard curve showing C T
values plotted versus the log of the initial amount of genomic DNA.
Rn vs Cycles
1 2 3 4 5 6 7 8 9 10 11 12 13 14 15 16 17 18 19 20 21 22 23 24 25 26 2728 29 3031 32 33 34 35 36 37 38 39 40
Cycle Number
Rn
16
14
12
10
8
4
2
0
-2
-4
6
3b)
3c)Cycle Number
Rn vs Cycles
0.1
1
10
100
Rn
1 2 3 4 5 6 7 8 9 10 11 12 13 14 15 16 17 18 19 20 21 22 23 2425 26 2728 29 30 31 32 33 34 35 36 37 38 39 40
-0.4 0 0.4 0.8 1.2 1.6 2 2.4 2.8
28
26
24
22
20
18
16
Standard Curve
Log CO
Cycle Number
0 5 10 15 20 25 30 35 40
1.4
1.2
1.0
0.8
0.6
0.4
0.2
0.0
F l u o r e s c e n c e ( ∆
n R )
F l u o r e s c e n c e ( ∆
n R )
Cycle Number
0.10
0.08
0.06
0.04
0.02
0.00
-0.02
20 21 22 23 24 25 26 27 28
Variable PCR Plateau
Variable PCR Plateau

8/8/2019 Real TimequantitativePCROverview
http://slidepdf.com/reader/full/real-timequantitativepcroverview 5/8
5
These three plots illustrate the basic principles of real-time PCR quantitation. The higher the initial amount of
genomic DNA, the sooner accumulated product is detected in the PCR process, and the lower the CT
value. CT
values
are very reproducible in replicates because the threshold is picked to be in the exponential phase of the PCR. This is
shown in Figure 3b where the thr eshold intersects the amplification plots in the region where there is a linear relation
between log of the change in fluorescence and cycle number. In the exponential phase, reaction components are not
limiting and replicate reactions exhibit uniform and reproducible results.
Effect of Limiting Reagents
The early cycles of PCR are characterized by an exponential increase in target amplification. As reaction compo-
nents become limiting, the rate of ta rget amplification decreases until a p lateau is reached a nd there is little or no
net increase in PCR product. The sensitive fluorescence detection of the 5700 and 7700 systems allows the threshold
cycle to be observed when PCR amplification is still in t he exponential phase. This is the m ain r eason why CT
is a
more reliable measure of starting copy number than an endpoint measurement of the amount of accumulated PCR
product. During the exponential phase, none of the reaction components is limiting; as a result, CT
values are very
reproducible for reactions with the same sta rting copy num ber. This leads to great ly improved p recision in the
quantitation of DNA and RNA. On the other hand, the amount of PCR product observed at the end of the reaction
is very sensitive to slight variations in reaction components. This is because endpoint measurements are generally
made when the reaction is beyond the exponential phase and a slight difference in a limiting component can have
a d rastic effect on the final am ount of pr oduct. For example, side reactions, like forma tion of primer dimers, canconsume reagents to different extents from tube to tube. Thus, it is possible for a sample with a higher starting copy
number to end up with less accumulated product than a sample with a lower starting copy number. The differences
between endpoint and real-time detection are graphically illustrated in Figure 4, which shows amplification of 96
identical samples. The overall change in reporter signal, as measured a t cycle 40, varies widely among the replicates.
However, the amplification plots are remarkably similar between cycles 22 and 25, during which the CT
values
are determined.
Quantitative Competitive PCR
In order to compensate for problems with endpoint measurements, researchers have developed a variety of quan-
titative competitive PCR techniques.11–14 Typically, a competitor amplicon is constructed that contains the same
primer binding sites and has the same amplification efficiency as the target, but is somehow distinguishable from
the target. A common distinguishing characteristic is to make the target and competitor amplicons different sizesso that gel electrophoresis can be used to discriminate the two products. A known amount of competitor is spiked
into the sample, then the target and competitor are amplified in the same reaction. If the amplification efficiency of
target and competitor are, in fact, identical, then the ratio of target to competitor will remain constant throughout
the PCR process. Thus, by determining the ratio of target to competitor at the end of the reaction and knowing the
starting amount of competitor spiked in, the starting amount of target can be calculated. Competitive PCR has been
used successfully to quantitat e DNA and RNA, bu t its dynamic range is limited to a target-t o-competitor ratio of
about 1:10 to 10:1. In fact, the best accuracy is obtained by finding the equivalence point at which the ratio of
target to competitor is 1:1. To accomplish this, several dilutions must be tested in order to achieve a suitable ratio
of target to competitor. Another drawback is the need to construct and characterize a different competitor for every
target to be quantitated. In addition, careful validation studies must be performed in order to verify that the ampli-
fication efficiencies of target and competitor are t he same before quant itation of experimental samples can commence.
Even a slight difference in efficiency severely compromises the accuracy of qua ntita tion by competitive PCR. At the
end of the reaction, competitive PCR requires accurate quantitation of target and competitor amplicons, whichusually enta ils laborious post-PCR processing steps.
Advantages of Real-Time
The development of competitive PCR was driven by a reliance on endpoint measurements. Determining CT
values
by following the real-time kinetics of PCR eliminates the need for a competitor to be co-amplified with the target.
Quantitation can be performed by t he more basic method of preparing a standard curve and determining unknown
amount by comparison to the standard curve. Compared to endpoint measurements, the use of CT
values also
expands the dynamic range of quantitation because data is collected for every cycle of PCR. A linear relationship

8/8/2019 Real TimequantitativePCROverview
http://slidepdf.com/reader/full/real-timequantitativepcroverview 6/8
6
between CT
and initial DNA amount has been demonstrated for over five orders of magnitude, compared to the one
or two orders of magnitude typically observed with an endpoint assay. Real-time quantitation eliminates post-PCR
processing of PCR products, which not only increases throughput and reduces the chances for carryover contamina-
tion, but also removes post-PCR processing as a potential source of error. Although not immune, CT
values are less
sensitive than endpoint values to the effects of PCR inhibitors, again, because measurements are from the exponen-
tial phase where reaction components are not limiting.
Quantitation of Cytokine Gene Expression
One app lication of the real-time quan titative capab ility of either t he GeneAmp® 5700 Sequence Detection
System or the ABI P RISM® 7700 Sequence Detection System is to monitor h ow patt erns of gene expression cha nge
in response to var ious stimuli. Figure 5 shows the relative quantita tion results for th ree cytokine mRNAs in PBMCs
that have been stimulated with CD3/CD28 antibodies. Total RNA was prepared from untreated PBMCs and from
cells that had been exposed to CD3/CD28 antibodies for 2 hours, 6 hours, or overnight. The relative quantity of
IL-2, IL-4, and TNF-α mRNA in each sample was determined u sing either generic SYBR® Green I dye detection or
gene-specific fluorogenic probes. Thermal cycling and detection of the real-t ime amplification plots were performed
using the 5700 and the 7700 Sequence Detection Systems. In order to perform these analyses, cDNAs prepared from
the four total RNA samples were mixed with either TaqMan® Universal PCR Master Mix or a master mix formulated
from th e components of the SYBR® Green PCR Core Reagents Kit. These master mixes conta in all necessary r eaction
components except primers and probes. Each cDNA mix was added to separate wells, each well containing the primerpair for amplification of one of the cytokine tar gets. Samples containing the primer pair for amp lification of 18S
ribosomal RNA were also prepared. For gene-specific detection, t he wells also contained t he appropr iate fluorogenic
probe for the cytokine or ribosomal RNA target.
Analysis of multiple targets on the same plate requires that all primer sets work using the same thermal cycling
parameters. The primer pairs for the cytokine targets were selected using the PE Biosystems Guidelines for
‘Amplifying Custom Tar get Sequences for Quantitat ion’.15 Following these guidelines allows the amplification of
all targets to be performed using the same reaction conditions and thermal cycling parameters. Adhering to these
guidelines also means that the efficiency of each PCR amplification is close to 1. Because the efficiencies of the
different amplifications are approximately equal and close to 1, it is possible to obtain relative quantitative results
without having to run standard curves for any of the cytokine targets. Detailed procedures for relative quantitation
ar e described in ABI PRISM® 7700 Sequence Detection System User Bulletin No. 2.16 Figure 5 shows the relative
quantitation results comparing the four samples for the three cytokine targets. In this analysis, the untreated
sample was designated the calibrator and it is assigned the value of 1× for each of the targets. The quantity of eachcytokine mRNA in each of the treated samples is given relative to the calibrator sample.
Figure 5. Relative quantitation results for three cytokine mRNAs in PBMCs that have been stimulated with CD3/CD28 antibodies. (Data
generated in collaboration with DNAX Research Institu te.)
I L - 2
u n t r e a t e d
2 h r
6 h r
o v e r n i g h t
I L - 4
u n t r e a t e d
2 h r
6 h r
o v e r n i g h t
T N F - α
u n t r e a t e d
2 h r
6 h r
o v e r n i g h t
7700/SYBR ®
Green I Assay
5700/SYBR ®
Green I Assay0.1
1
10
100
1000
10000
R e l a t i v e Q u a n t i t y
5700/TaqMan ®
Assay
7700/TaqMan ®
Assay

8/8/2019 Real TimequantitativePCROverview
http://slidepdf.com/reader/full/real-timequantitativepcroverview 7/8
7
The results shown in Figure 5 were normalized using the CT
values obtained for the r ibosomal RNA amplifica-
tions run in the same plate. The 18S ribosomal RNA is an endogenous control that is used to normalize the samples
for differences in the amoun t of tota l RNA added to each cDNA reaction. The use of this endogenous reference also
norma lizes for var iation in r everse transcriptase (RT) efficiency among the d ifferent cDNA reactions. Variation in
RT efficiency other tha n sample-to-sample variation is controlled for because a single cDNA reaction is performed
for each total RNA sample. This single cDNA reaction is then split to perform the target and control amplifications.
At h igh levels of RNA, Figure 5 shows that app roximately the same relative quan titation r esults are obtainedwhether SYBR® Green I dye detection or fluorogenic probe detection is used on either the 5700 or 7700 system.
Thus, at the 2 hr time point, the increase in cytokine mRNA level is approximately 2000-fold for IL-2, 100- fold for
IL-4, and 40-fold for TNF-α, r egardless of analysis method used. At low levels of RNA, th ough, the detection of
non-specific amplification by SYBR® Green I dye complicates the results. For the IL-2 analysis in the overnight
sample, fluorogenic probe detection on either the 5700 or 7700 system shows the level of IL-2 mRNA is about
0.75× the amount in the untr eated sample. Using SYBR® Green I dye detection, the amount of IL-2 mRNA in the
overnight sample appears to be 3.5×. This inflated value observed with SYBR® Green I dye detection is due to the
detection of non-specific amplification products. The TNF-α levels observed in the overnight sample reveal a
different consequence of non-specific amplification. Both analyses using fluorogenic probe detection indicate the
TNF-α level is about 0.6× compared to the untreated sample. The two SYBR® Green I dye results give wildly
different values of 1× and 0.03×. Non-specific amplification is not necessarily consistent well-to-well, so replicates
can give much d ifferent results. Thus, non-specific amplification can lead to erroneous and/ or highly variable results
at low target levels when SYBR® Green I dye or another generic DNA-binding dye is used for detection. For th ese
particular cases, lower primer concentrations were tried to increase the specificity of the amplifications. Changing
primer concentrations from 900 nM to 50 nM reduced the spurious results observed with SYBR® Green I dye detection.
The u se of fluorogenic probes avoids the complications caused by detection of non-specific amplification. Because
non-specific amplification is more of a problem at low target levels, fluorogenic probe assays tend to be more
sensitive for detection of low amounts of target and have a greater dynamic range compared to assays using DNA
binding dyes. Another advantage of fluorogenic probes is that, on the ABI P RISM® 7700 system, the target and endog-
enous control (e.g., rRNA) am plification can be performed in the same t ube. T his is possible because target and
control probes can be labeled with distinguishable reporter dyes. This reduces the number of reactions that need to
be run and ensures that exactly the same amount of template is available for t arget and control amplification. Also, the
inclusion of an in-tube internal positive control increases confidence in the results obtained for target quantitation.
Detection on the ABI PRISM® 7700 system tends to give lower coefficients of variation than detection on the
GeneAmp® 5700 system. Improved precision means tha t smaller differences in initial copy number can be distinguished.
Conclusions
Compared to endpoint quantitation methods, real-time PCR offers streamlined assay development, reproducible
results, and a large dynamic range. Real-time PCR eliminates the need for competitive in-tube standards with
identical primer sets as targets. Thus, the process of creating quantitative assays is streamlined because the con-
struction and characterization of such standard s are no longer requ ired. Real-time PCR now makes quantitat ion
of DNA and RNA much more precise and reproducible because it relies on CT
values determined during the expo-
nential phase of PCR rather than endpoint. In addition, the use of CT
values allows a larger dynamic range. This
increases throughput because it is no longer necessary to analyze dilutions of each sample in order to obtain accu-
rate results.
The researcher now has a number of options for implementing real-time quantitation in his or her lab. Homoge-neous detection of PCR products can be done u sing double-stranded DNA binding dyes or fluorogenic probes.
Detection of fluorescence dur ing the therma l cycling process can be performed using either the GeneAmp® 5700
or ABI PRISM® 7700 Sequence Detection Systems. Choosing among these options requires balancing the demands
of sensitivity, convenience, precision, and cost.

8/8/2019 Real TimequantitativePCROverview
http://slidepdf.com/reader/full/real-timequantitativepcroverview 8/8
8
References1. Higuchi, R., Dollinger, G., Walsh, P. S., and Griffith, R. 1992. Simultan eous amplification and detection of specific DNA sequences.
Biotechnology 10:413–417.
2. Higuchi, R., Fockler, C., Dollinger, G., and Watson, R. 1993. Kinetic PCR: Real time monitoring of DNA amplification reactions.
Biotechnology 11:1026–1030.
3. Holland, P. M., Abram son, R. D., Watson, R., and Gelfand, D. H. 1991. Detection of specific polymerase chain reaction product byutilizing the 5 ' to 3' exonuclease activity of Thermus a quat icus DNA polymerase. Proceedings of the Nat ional Academy of Sciences USA
88:7276–7280.4. Gelfand, D. H., Holland, P. M., Saiki, R. K., and Watson, R. M. 1993. U. S. Patent 5,210,015.
5. Lee, L. G., Connell, C. R., and Bloch, W. 1993. Allelic discrimination by nick-tra nslation PCR with fluorogenic probes. Nucleic Acids Research 21:3761–3766.
6. Livak, K. J., Flood, S. J. A., Marmaro, J., Giusti, W., and Deetz, K. 1995. Oligonucleotides with fluorescent dyes at opposite ends provide aquenched p robe system useful for detecting PCR product and nucleic acid hybridization. PCR Methods and Applications 4:357–362.
7. Lyamichev, V., Brow, M. A. D., and Dahlberg, J. E. 1993. Structur e-specific endonucleolytic cleavage of nucleic acids by eubacterial DNApolymerases. Science 260:778–783.
8. Nielsen, P.E. 1991. “Sequence-selective DNA recognition b y synthetic ligands,” Bioconjugate Chemistry 2:1–12.
9. Searle, M.S., and Embrey, K. E. 1990. “Sequence-specific interaction of Hoescht 33258 with the m inor groove of an adenine-tract DNAduplex studied in solution by 1H NMR spectroscopy,” Nucleic Acids Research 18:3753–3762.
10. Molecular Probes.
11. Wang, A. M., Doyle, M. V., and Mark, D. F. 198 9. “Quan titation of mRNA by the polymerase chain reaction,” Proceedings of the Nat ional
Academy of Sciences 86:9717–9721.
12. Becker-André, M., and Hahlbrock, K. 198 9. “Absolute mRNA quan tification using the polymerase chain reaction. A novel appr oach by a
PCR aided transcript titration assay PATTY.,” Nucleic Acids Research 17:9437–9446.13. Gilliand, G., Perrin, S., Blanchar d, K., and Bunn, F. 19 90. “Analysis of cytokine mRNA and DNA: Detection and quan titation by competi-
tive polymerase chain reaction,” Proceedings of the Nat ional Academy of S ciences 87:2725–2729.
14. Piatak , M., Luk, K. C., Williams, B., and L ifson, J. D. 1993. “Quantita tive competitive polymerase chain reaction for accurate qua ntitationof HIV DNA and RNA species,” BioTechniques 14:70–80.
15. ‘TaqMan® Universal PCR Master Mix’ Protocol, P/ N 43044 49, p p. 13 –21.
16. User Bulletin No. 2, “Relative quan titation of gene expression,” P/ N 4303859 .