realist evaluation, effectiveness research and … evaluation, effectiveness research and...
TRANSCRIPT

Realist Evaluation, Effectiveness Research And Epidemiology Traditions: What Works, For Whom
And In What Contexts Plenary Presented at 8th. International Conference on Evaluation for Practice, Pori, Finland, June 18-20, 2012 Mansoor A. F. Kazi, PhD, University at Buffalo (The SUNY)
Tapestry of Chautauqua County, New York

Tapestry of Chautauqua
County, New York
Mansoor A. F. Kazi, PhD, Director,
Program Evaluation Center, School of Social Work, University at Buffalo
Based on Kazi, M. A. F. (2003) ‘Realist Evaluation in Practice’, London: Sage
Realist Evaluation Partnerships
Youth Offending Teams, Local Authorities. UK
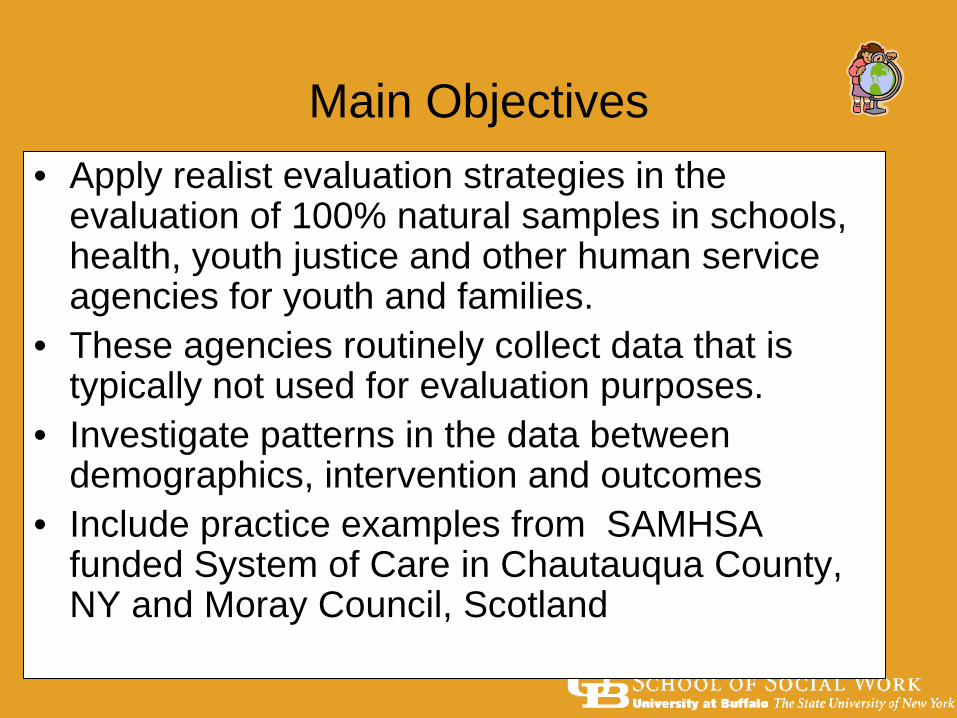
Main Objectives • Apply realist evaluation strategies in the
evaluation of 100% natural samples in schools, health, youth justice and other human service agencies for youth and families.
• These agencies routinely collect data that is typically not used for evaluation purposes.
• Investigate patterns in the data between demographics, intervention and outcomes
• Include practice examples from SAMHSA funded System of Care in Chautauqua County, NY and Moray Council, Scotland

Effectiveness Research and Epidemiology Traditions (Videka,
2003) • Efficacy approach: testing hypotheses
about intervention effects • Epidemiology approach: explanation of the
problem • Combining or blended approach:
explanation-oriented, individual and environmental characteristics and study of service outcomes

Realist Evaluation
• Realist evaluation seeks to evaluate practice within the realities of society, based on Emergent and Symbiotic elements of natural law.
• All systems are emergent and constantly in a state of evolution, along with the reality that we are all symbiotically connected to nature and to each other.
• Practice takes place in an open system that consists of a constellation of inter-connected structures, mechanisms and contexts.
• Realism aims to address all the significant variables… through a realist effectiveness cycle which links the models of intervention with the circumstances in which practice takes place (Rom Harre’s models, analogous with reality)
• Explanation at any one time requires further investigation and further explanation (continuous testing & development of Rom Harre’s models)

Realist Evaluation: What Interventions work & in what circumstances
A combination of efficacy research & epidemiology traditions Management Information System (MIS) Data routinely collected but
typically not used for evaluation in agencies (quantitative and/or qualitative)
Investigate interrelationships between outcomes, client
demographics, client circumstances (mechanisms and contexts), & services provided (interventions: generative mechanisms)
Methods such as binary logistic regression can predict the likelihood
of effectiveness of an intervention in given circumstances (Lawson’s ‘demi-regularities’)
Use findings at regular intervals to better target and develop services
(keep investigating: emergent and changing contexts and mechanisms)
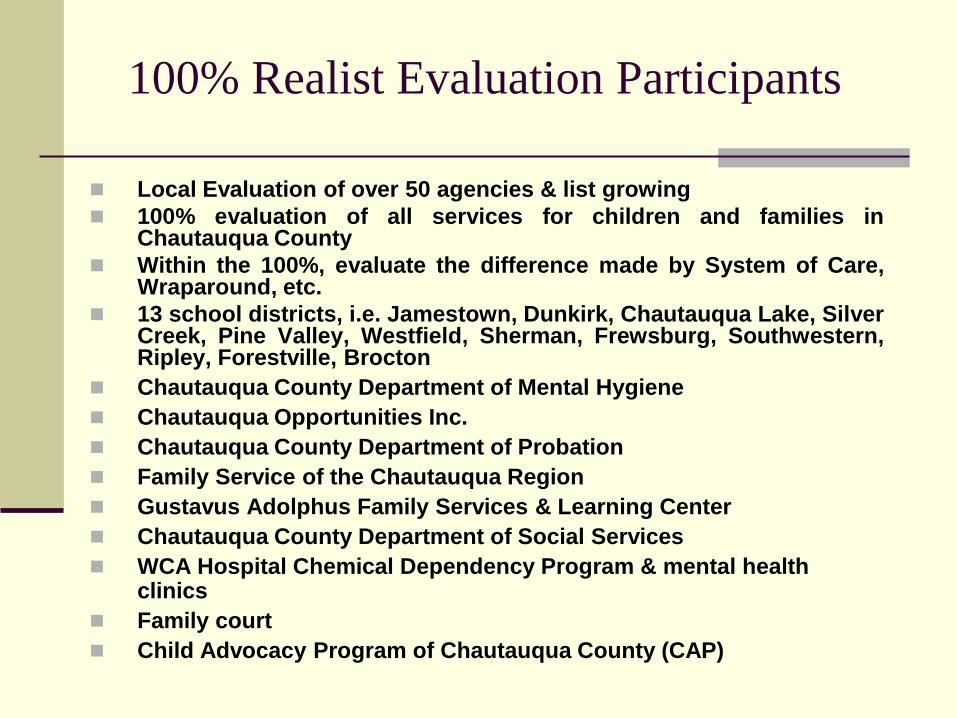
100% Realist Evaluation Participants
Local Evaluation of over 50 agencies & list growing 100% evaluation of all services for children and families in
Chautauqua County Within the 100%, evaluate the difference made by System of Care,
Wraparound, etc. 13 school districts, i.e. Jamestown, Dunkirk, Chautauqua Lake, Silver
Creek, Pine Valley, Westfield, Sherman, Frewsburg, Southwestern, Ripley, Forestville, Brocton
Chautauqua County Department of Mental Hygiene Chautauqua Opportunities Inc. Chautauqua County Department of Probation Family Service of the Chautauqua Region Gustavus Adolphus Family Services & Learning Center Chautauqua County Department of Social Services WCA Hospital Chemical Dependency Program & mental health
clinics Family court Child Advocacy Program of Chautauqua County (CAP)

Local (Continued), State and International Participants
The Resource Center Striders Infinity Visual and Performing Arts CASAC Compeer Head Start at COI (early years) Jamestown Community Learning Council (early years) Center Against Domestic Violence (NY City) and School 261,
Brooklyn Rensselaer County, NY: County mental health, Probation Service,
Averill Park School District Rhondda Cynon Taf, South Wales: Building The Future Together (EU
funded 17m Euros, 50,725 students) Local Authorities in Scotland (looked after children) Moray Council, Aberlour Trust in Scotland Moray Youth Justice Team Local Authorities in England (looked after Children) Manchester Youth Offending Team Finland: Helsinki Social Services Department Viewpoint international: UK & Australia (surveys of children)
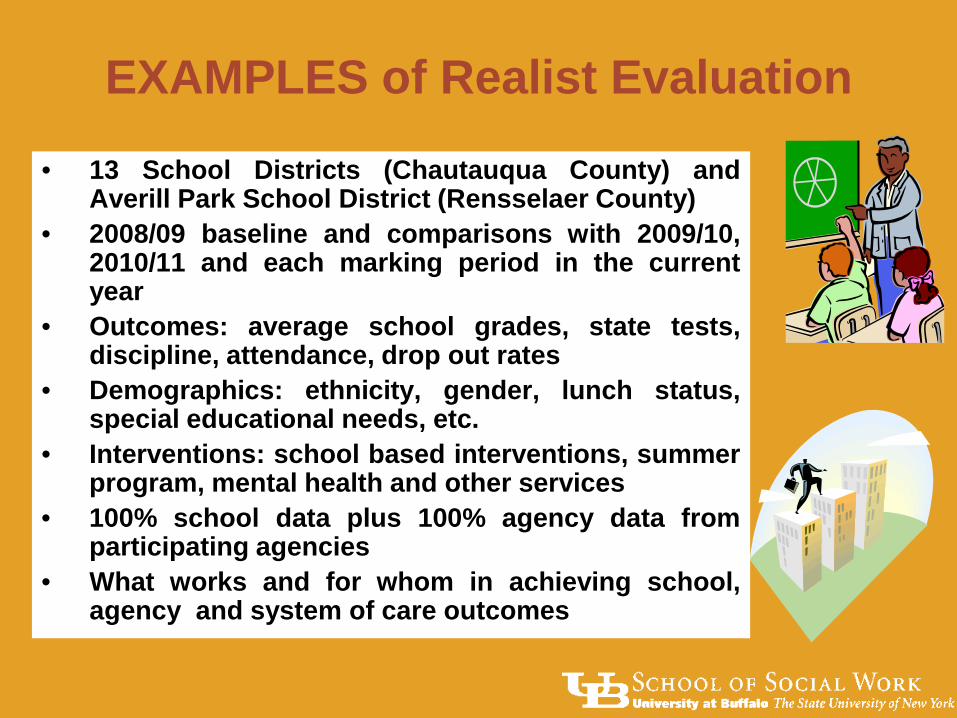
EXAMPLES of Realist Evaluation
• 13 School Districts (Chautauqua County) and Averill Park School District (Rensselaer County)
• 2008/09 baseline and comparisons with 2009/10, 2010/11 and each marking period in the current year
• Outcomes: average school grades, state tests, discipline, attendance, drop out rates
• Demographics: ethnicity, gender, lunch status, special educational needs, etc.
• Interventions: school based interventions, summer program, mental health and other services
• 100% school data plus 100% agency data from participating agencies
• What works and for whom in achieving school, agency and system of care outcomes

Data analysis and utilitization
• Single system design with each youth and one group pretest posttest design repeated at every marking period
• Comparison of outcomes between baseline and subsequent periods
• Comparisons between those receiving and not receiving interventions
• Investigation of patterns between outcomes, demographics and interventions
• Binary logistic regression to identify predictors at every marking period
• Data analysis carried out in partnership with schools and agencies
• Utilization of evaluation findings to develop and improve services for children and families at regular intervals

Examples of data and findings • Next phase is to demonstrate
findings from individual databases from UK & USA
• Demonstration of how to use existing data and to undertake data analysis
• How to build partnerships in data collection, analysis, and dissemination

Realist Evaluation of Family Service of Chautauqua Region: What Works and in What circumstances
Presented at Tapestry’s Evaluation Symposium, May 17 2012 Mansoor A. F. Kazi, PhD, University at Buffalo (The SUNY) Kathy Benson Family Service of Chautauqua Region Jim McElrath Family Service of Chautauqua Region
Tapestry of Chautauqua County, New York

Services for Youth with Emotional Disorders
• Drop Out Prevention Program, Office Based Counseling, and Partners For Children Programs
• Work with children and adolescents ages 21 and under to improve mental health
• These programs are designed specifically to work with students, their families, school and community resources to enhance the ability of students with emotional health challenges be successful in the school setting and in life.
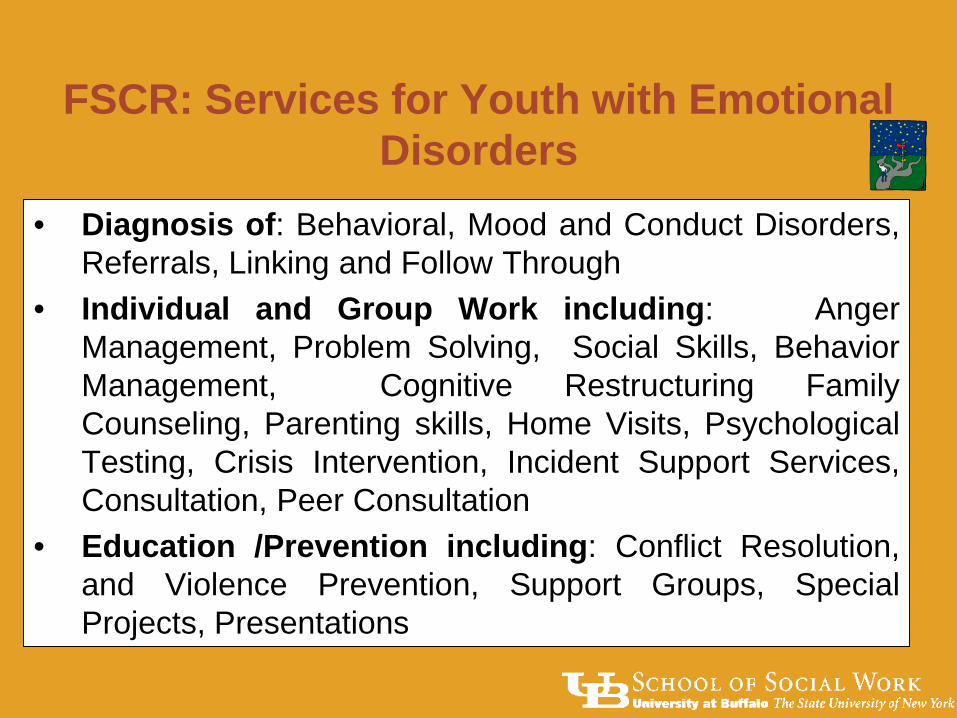
FSCR: Services for Youth with Emotional Disorders
• Diagnosis of: Behavioral, Mood and Conduct Disorders, Referrals, Linking and Follow Through
• Individual and Group Work including: Anger Management, Problem Solving, Social Skills, Behavior Management, Cognitive Restructuring Family Counseling, Parenting skills, Home Visits, Psychological Testing, Crisis Intervention, Incident Support Services, Consultation, Peer Consultation
• Education /Prevention including: Conflict Resolution, and Violence Prevention, Support Groups, Special Projects, Presentations

Services for Youth with Emotional Disorders
• Direct Counseling Services • Consultancy for other professionals • Consultancy for schools for schools • School outcomes (e.g. 34 in Jamestown School, 55%
improved grades from 09 to 10, and mean improvement higher then rest of school)
• Measure: Child and Adolescent Needs and Strengths (CANS-MH); reported reliability 0.73 to 0.85 (Lyons et al. 1999)
• Partner with SAMHSA funded Chautauqua Tapestry System of Care

Services for Youth with Emotional Disorders
• August 2005 to March 2012, n = 753 • Mean age 13.18 years, ranging from 3 to 22 years • 53.5% female schools • 84.5% Caucasian, 7% Hispanic, 3.3% African American

Service for Youth

Change between first and last CANS-MH :
Frequency Percent
got worse 95 12.6
no change 51 6.8
improved 329 43.7
Total 475 63.1

CANS-MH First and Last Scores
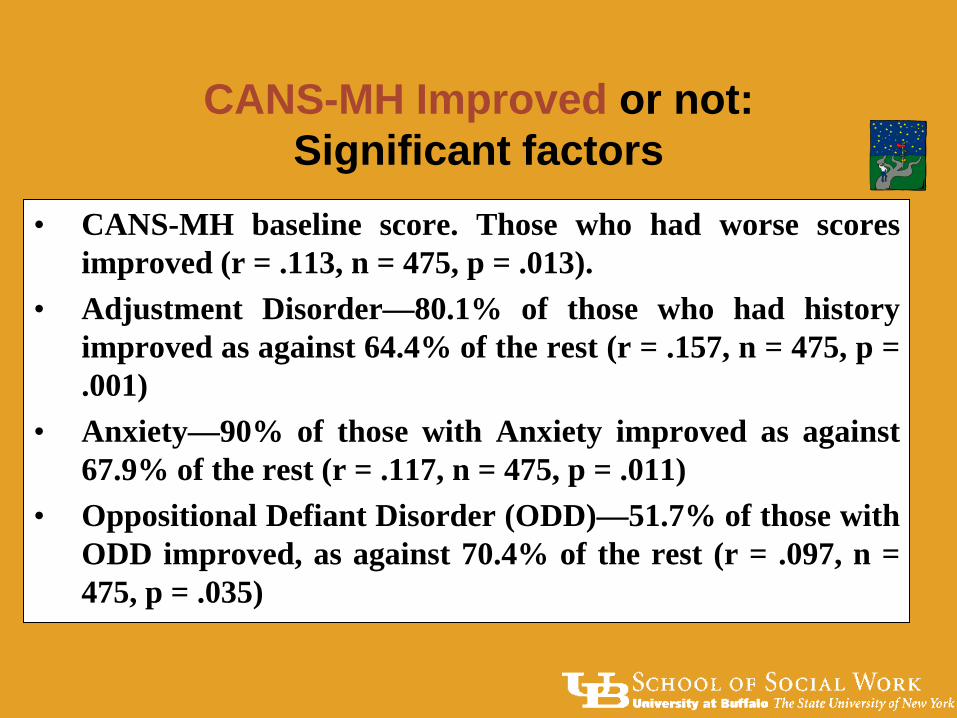
CANS-MH Improved or not: Significant factors
• CANS-MH baseline score. Those who had worse scores improved (r = .113, n = 475, p = .013).
• Adjustment Disorder—80.1% of those who had history improved as against 64.4% of the rest (r = .157, n = 475, p = .001)= .53)
• Anxiety—90% of those with Anxiety improved as against 67.9% of the rest (r = .117, n = 475, p = .011)
• Oppositional Defiant Disorder (ODD)—51.7% of those with ODD improved, as against 70.4% of the rest (r = .097, n = 475, p = .035)

CANS improved or not and mean baseline scores
• Dividing database into those who improved or not on CANS needs total scores
• Mean baseline scores for those that did not improve and for those that improved

Binary Logistic Regression Model • Dividing database into those who improved or not in CANS and
using significant factors • Those with worse baselines were 1.03 times more likely to improve then
those with better scores for every single point on the score; those with adjustment disorder were twice as like to improve, and those with anxiety were 4 times more likely to improve, than the others; those with oppositional defiant disorder were 3 times more likely not to improve.

FSCR in Jamestown Senior High School
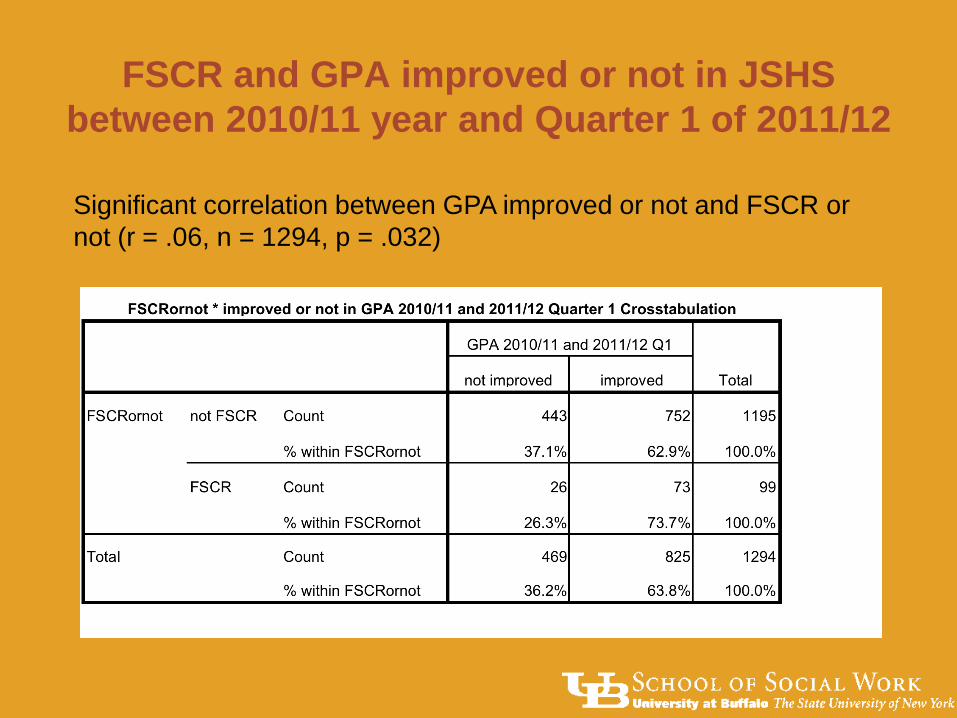
FSCR and GPA improved or not in JSHS between 2010/11 year and Quarter 1 of 2011/12
Significant correlation between GPA improved or not and FSCR or not (r = .06, n = 1294, p = .032)

Conclusions • Family Service of Chautauqua Region has had a
largely positive impact on the group of 475 • 69.3% improved in 6 months or more • Those with worse baseline scores were more likely
to improve • Other Predictors for improving were anxiety and
adjustment disorder • Those with oppositional defiant disorder were 3
times more likely not to improve than the rest • Within Jamestown Senior High School, significant
difference in improvement between those receiving FSCR and those not, in GPA between 2010/11 and first quarter of 2011/12
Realist Evaluation in Moray Youth Justice Team
Paper presented at Tapestry’s Evaluation Symposium, May 18, 2012
Mansoor A. F. Kazi, Ph.D. University at Buffalo (The State University of New York) Alan Johnstone, Moray Youth Justice Team, Scotland

Example : Moray Youth Justice
Team, Scotland
• Holistic, needs-led responses to youth who persistently offend
• Action plan with identifiable targets • Restorative Justice program to take
responsibility for the harm caused to victims • Helping to support domains: living
arrangements; education, training & employment; lifestyle; substance use; emotional and mental health; physical health; family & personal; and neighborhood
• Crisis work--few days’ intensive residential work • Assessment, monitoring, and evaluation
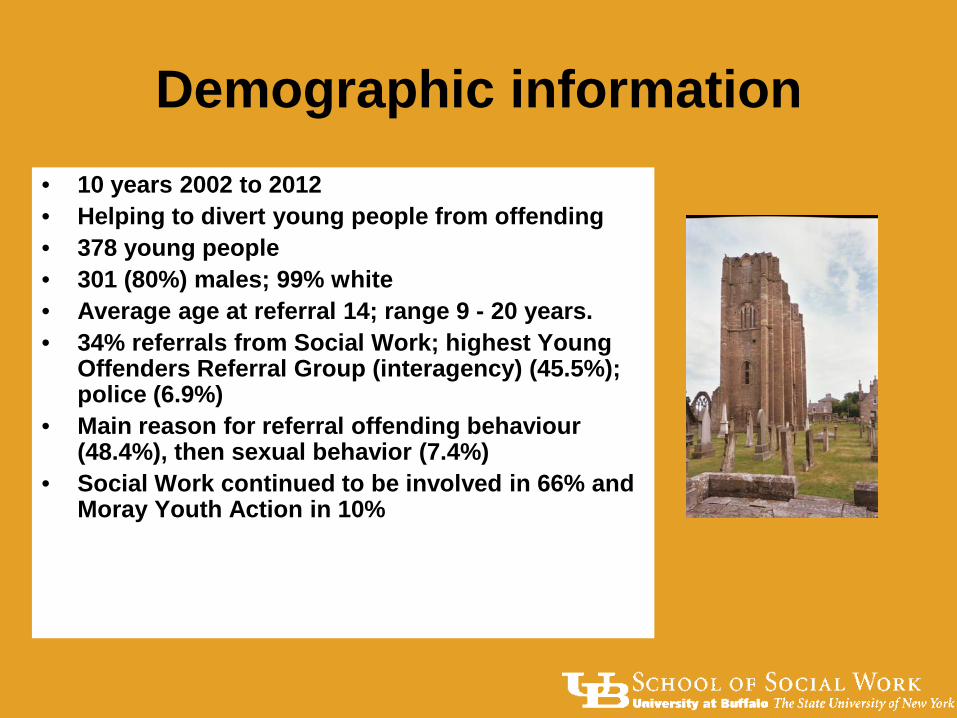
Demographic information • 10 years 2002 to 2012 • Helping to divert young people from offending • 378 young people • 301 (80%) males; 99% white • Average age at referral 14; range 9 - 20 years. • 34% referrals from Social Work; highest Young
Offenders Referral Group (interagency) (45.5%); police (6.9%)
• Main reason for referral offending behaviour (48.4%), then sexual behavior (7.4%)
• Social Work continued to be involved in 66% and Moray Youth Action in 10%

Primary Index Offences
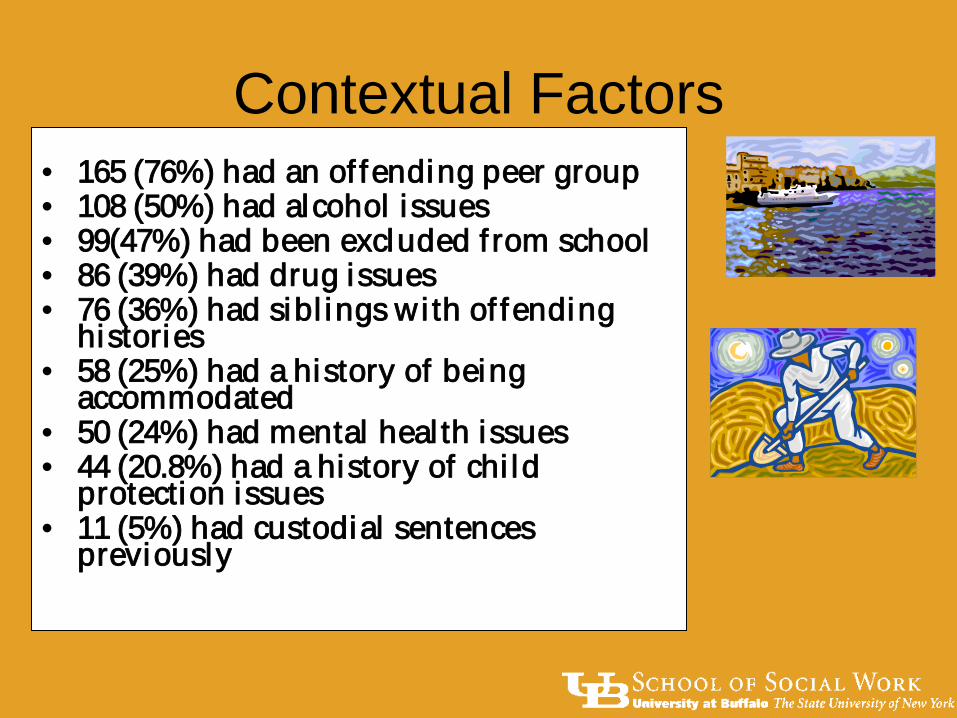
Contextual Factors
• 165 (76%) had an of fending peer group • 108 (50%) had alcohol issues • 99(47%) had been excluded f rom school • 86 (39%) had drug issues • 76 (36%) had sibl ings wi th of fending
histories • 58 (25%) had a history of being
accommodated • 50 (24%) had mental heal th issues • 44 (20.8%) had a history of chi ld
protection issues • 11 (5%) had custodial sentences
previously
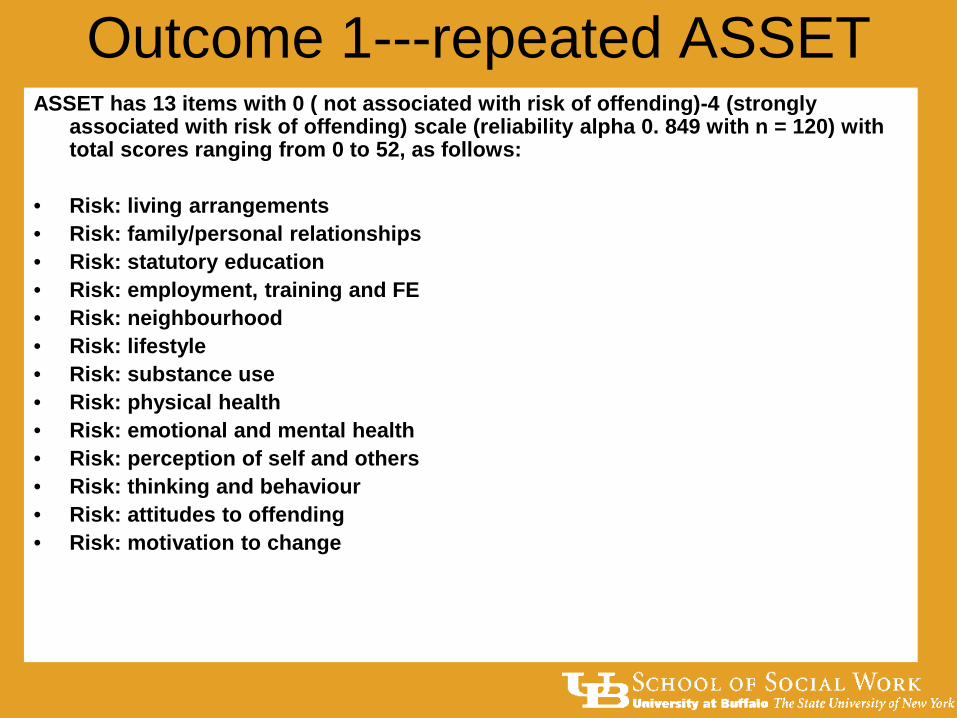
Outcome 1---repeated ASSET ASSET has 13 items with 0 ( not associated with risk of offending)-4 (strongly
associated with risk of offending) scale (reliability alpha 0. 849 with n = 120) with total scores ranging from 0 to 52, as follows:
• Risk: living arrangements • Risk: family/personal relationships • Risk: statutory education • Risk: employment, training and FE • Risk: neighbourhood • Risk: lifestyle • Risk: substance use • Risk: physical health • Risk: emotional and mental health • Risk: perception of self and others • Risk: thinking and behaviour • Risk: attitudes to offending • Risk: motivation to change

Outcome 1---repeated ASSET ASSET has 13 items with 0 ( not associated with risk of offending)-4 (strongly
associated with risk of offending) scale , with total scores ranging from 0 to 52, as follows:
• Risk: living arrangements • Risk: family/personal relationships • Risk: statutory education • Risk: employment, training and FE • Risk: neighbourhood • Risk: lifestyle • Risk: substance use • Risk: physical health • Risk: emotional and mental health • Risk: perception of self and others • Risk: thinking and behaviour • Risk: attitudes to offending • Risk: motivation to change
Frequency Percent
Got worse 32 18.0
No change
17 9.6
Improved 129 72.5
Total 178 100.0

ASSET scores: Magnitude of Change

Outcome 2: Offences Offences 12 months before intervention
• Mean 10.52 per young person (n =248) Offences during intervention: • Mean 4.07 (n =248) • 108 (42.9%) did not offend

Offending during intervention or not: Significant factors
• Number of offences during the baseline. Those who offended had an average of 12.5 offences in the baseline period, as compared to a baseline average of 8 for those who did not offend (r = .361, n = 248, p = .000).
• Drug issues (family). It was found that 88% of those who were identified as having drug issues in the family offended (r = .203, n = 169, p = .008).
• Drug issues (young person). It was found that 84% of those who had drug issues in the family offended(r = .242, n = 176, p = .001).

Offending during intervention or not: Significant factors
• Alcohol issues (young person). It was found that 86.7% of youth with alcohol issues offended during the intervention (r = .336, n = 174, p = .001).
• Age at first offence. Those who offended at least once during the intervention had an average age of 11.37, as against 12.46 years for those who did not offend (r = .195, n = 160, p = .013).
• Offending peer group. It was found that 77% of those with an offending peer group offended during the intervention (r = .330, n = 174, p = .000).
• First ASSET score (r = .351, n = 172, p = .000). It was found that those who offended had a mean baseline ASSET score of 20, as against 13 for those who did not offend during the intervention.

Binary Logistic Regression Model • Dividing database into those who offended or not during
intervention and using significant factors • Youth with alcohol issues were 8 times more likely to offend • Youth with drug issues in the family were 3 times more likely to offend • Youth more likely to offend with every year younger at first offence

Conclusions • Moray Youth Justice team effective in reducing
offences • Average offences of 10.5 during baseline reduced to
4 during intervention • 42.9% stopped offending during the intervention • 72.5% improved the scores in subsequent ASSETs • Decisive predictors were alcohol issues with
youth(8 times); and drug issues with family (3 times); alcohol issues (youth) (3 times); and age at first offence (more likely with every year younger at first offence)
• Utility of realist evaluation--regular analysis of findings to investigate what interventions work and in what circumstances

Conclusion
• Realist evaluation strategies help to utilise the available data and to conduct deeper analysis
• Explanations for differences between those that improve on an outcome and those that do not
• Identifies patterns in the data where multiple factors are influencing the outcome, and selects the main factor or factors responsible for the outcome, with a prediction of the odds of achieving a given outcome in particular circumstances
• Repeatedly investigate changes in outcomes,
intervention & the contexts