realizing high-performance buildings - … high-performance buildings nrel is a national laboratory...
TRANSCRIPT

REALIZING HIGH-PERFORMANCE BUILDINGS
NREL is a national laboratory of the U.S. Department of Energy, Office of Energy Efficiency and Renewable Energy, operated by the Alliance for Sustainable Energy, LLC.
How To Maintain Energy-Efficient Design Intent During Building
Operation
A guide written for owners and operators of high-performance buildings, based on the experience
of field successes in the United States

High-performance buildings (HPBs) are exceptional examples of both design and practice. Their energy footprints are small; that is, they use fewer resources and generally disturb their immediate and extended environments much less than do comparable buildings. But more importantly, these are buildings that people want to work in, because of their intelligent structure, operations, and coincident comfort.
This description might conjure a building whose front entrance is adorned with an endorsement label, such as Leadership in Energy and Environmental Design (LEED®)-Gold or -Platinum. Most HPBs do have these labels; however, the converse is not necessarily true. In fact, at least two studies (Diamond 2006; NBI 2008) show that LEED buildings sometimes demonstrate average or higher energy intensities (even when normalized for key variables). These studies do not constitute an indictment of LEED or any comparable ”asset rating” label (i.e., ones that address only the building and not its operations); rather, they ultimately reveal that these labeling programs reflect superior design but do not necessarily indicate actual energy performance. The latter is as much a function of construction and operations as of design. For example, if insulation is poorly applied, ductwork is unsecured or unsealed, or the building is not operated according to design, it may not operate as an HPB. For the purposes of this guide, we define HPBs as buildings that consume 50% or less of the energy of a comparable code-compliant building, while not sacrificing occupant comfort.
The operation of most buildings, even ones that are properly constructed and commissioned at the start, can deviate significantly from the original design intent over time, particularly due to control system overrides, underperformed maintenance (stuck dampers, low refrigerant charge, variable frequency drive-controlled motors not modulating, etc.), and additional—and often superfluous—plug loads.
If a benchmarking tool such as Portfolio Manager is used to track building energy use, it will probably show this performance degradation. But without some level of submetering and an energy information system (EIS) to assess the specific source of the load creep (or spike), operators may not be able to identify and remedy the problems.
PURPOSE OF THIS GUIDE
This guide is a primer for owners and owners’ representatives who are pursuing HPBs. It describes processes that have been successful in the planning, procurement, and operation of HPBs with exceptional energy efficiency.
Much of the guidance offered results from a series of semi-structured conference calls with a technical advisory group of about 15 owners and operators of prominent HPBs in the United States. Typical design and construction practices are geared to deliver buildings that just meet code, but the individuals on the technical advisory group have been instrumental in generating buildings whose designed and actual energy performance is exceptional. The group demonstrated a high degree of similarity in their approaches to most of the key building performance topics discussed on the calls. These practices, combined with previous experience and research, provide a great deal of insight into constructing, commissioning, and operating buildings of this caliber—insight we feel can be readily transferred to others.
INTRODUCTION
The what
This guide is…… a survey of the critical aspects of HPB operations with emphasis on specific building systems such as plug and process loads (PPLs) and data centers because they present particular challenges for owners and operators who aspire to HPBs.
This guide is not…… a reiteration of available guidance on related topics. Numerous U.S. Department of Energy resources address building systems such as lighting and heating, ventilation, and air conditioning (HVAC), and provide advice about aligning system performance with design intent. For example, Pacific Northwest National Laboratory initiated a retuning project that trains technicians to identify problems with HVAC systems and to correct those problems at low cost (see http://buildingretuning.pnnl.gov/index.stm for more information).
Photo by Dennis Schroeder, NREL 23186
3INTRODUCTION

The guide provides a prescription for planning, achieving, and maintaining an HPB, assuming that its design and construction are of sufficient quality to make a very low-energy building possible. In other words, it addresses what needs to be done to fully realize that potential. Although the guide focuses on the operations stage of buildings, many of the operations practices are specified during the planning stage.
KEY TOPICS
Several key categories of guidance are discussed:
1. An ambitious energy use goal—or goals, if multiple systems (e.g., lighting and HVAC) are considered separately—must be established early in the planning process. Experience shows that this is an indispensable feature of HPBs in the field.
2. An energy information system (EIS) should be used to track energy consumption. The near ubiquity of basic EISs in the best-performing HPBs attests to the energy managers’ mantra that “if you can’t measure it, you can’t manage it.” Though building automation systems (also called energy management control systems) provide important snapshots of performance at any given point, the trending over time and fault detection permitted by EISs are invaluable in keeping HPBs on track toward their energy goals.
3. The ever-increasing array of plug and process loads (PPLs), ranging from office equipment to occupant-imported coffee makers and space heaters, must be controlled. In HPBs, where loads from traditional end uses such as lighting and HVAC have usually been substantially reduced, PPLs can account for as much as half of total building energy consumption. Each individual load is small, but they add up and, consequently, can’t be ignored.
4. Data centers are similar to PPLs in their increasing proportion of the facility energy pie. Given this heightened prominence in the energy profile, along with their increased prevalence in new buildings, they are included as a second end use topic. Good data center design and operations can mean dramatic energy savings, and because of their inherently high energy intensity, they must be designed and operated very efficiently if buildings are to reach the energy savings to qualify as HPBs.
5. Occupant engagement is key to HPBs. Maintaining an HPB must include bringing a facility’s occupants—whether they are tenants or the building is owner-occupied—on board with the concept of low energy consumption. Occupants choose equipment, turn things on and off, open and close doors and windows, etc., and generally give very little thought to the energy implications of their actions unless they are educated, incorporated, and respected as part of the effort to achieve and maintain energy efficiency.
The who and when
This guide is…… directed toward an owner’s integrated project team, which could include owner representatives, procurement services, facility managers, building engineers, energy managers, information technology staff, janitorial supervisors, and occupants. It is intended to encourage early involvement by all these team members to ensure a smooth transition between design and operations.
The chapters in the guide refer to general project phases: planning (early owner preparation), procurement (contract development through design), turnover (end of construction and commissioning through one year of operations), and operations (operating life of the building). The division of content indicates when a recommended action is most relevant but each chapter is not exhaustive in actions for each phase. This guide should be read in planning to instruct project management activities and considerations.
An example of the early, proactive effort might unfold as follows:
Planning. A third-party owner’s representative determines a demand-side energy goal and helps the owner write the design substantiation (energy goal calculation) requirements, and measured performance incentive language, for the project contract.
Planning. The owner’s integrated project team works together to set system-specific contract requirements such as plug load limits for office workstations.
Procurement. Energy champions for various systems such as plug loads are selected to participate in system design reviews.
Procurement through turnover. The team defines the end user requirements for the EIS (i.e., what information each champion needs to see on a dashboard to determine if design intent is being met).
Operations. The facility manager and system-specific energy champions maintain the energy goal in operations (e.g., using the energy information system to monitor performance relative to expectation and continuously working with occupants to balance their environmental preferences with system design intent).
This guide is not…… an attempt to define roles or assign specific tasks. The previous example is just one approach to roles and tasks. An energy manager could set the energy goal as effectively as could an owner’s representative. However, the guide’s framework could serve as the basis for an energy performance assurance scope of work if developed further by an organization’s procurement services.
4 INTRODUCTION

Energy Targets ...................................................................................................................Chapter 1
Energy Information Systems ........................................................................................Chapter 2
Plug and Process Loads ..................................................................................................Chapter 3
Data Centers .......................................................................................................................Chapter 4
Occupant Engagement ..................................................................................................Chapter 5
TABLE OF CONTENTS
Photo by Dennis Schroeder, NREL 25933
5TABLE OF CONTENTS

ASO automated system optimization
BAS building automation system
Btu British thermal unit
DOE U.S. Department of Energy
EIS energy information system
EMCS energy management and control system
EMIS energy management information system
EUI energy use intensity
FDD fault detection and diagnostics
GSA General Services Administration
HPB high-performance building
HVAC heating, ventilation, and air conditioning
IT information technology
LBNL Lawrence Berkeley National Laboratory
LEED Leadership in Energy and Environmental Design
NREL National Renewable Energy Laboratory
PPL plug and process load
RFP request for proposals
RSF Research Support Facility
USGBC U.S. Green Building Council
ZEB zero energy building
ABBREVIATIONS AND ACRONYMS
6 ABBREVIATIONS AND ACRONYMS

ACKNOWLEDGMENTS This guide is a joint product of the National Renewable Energy Laboratory (NREL) and Lawrence Berkeley National Laboratory (LBNL). It was prepared for the U.S. Department of Energy (DOE) under task number BE4C8001 by Shanti Pless and Jennifer Scheib of the Buildings and Thermal Systems Center at NREL, and by Phil Coleman of the Environmental Energy Technologies Division at LBNL.
The authors greatly appreciate the feedback and examples provided by our industry partners in the high-performance buildings operations community who served as the technical advisory group for the project:
§ Jim Dewey of the City of Santa Barbara
§ John Elliott of LBNL (formerly of UC Merced)
§ Matt Ellis of the US Army Corps of Engineers
§ Jake Gedvilas of NREL
§ Rodney Martin of NASA
§ Scott Poll of NASA
§ Len Pettis of California State University
§ Kevin Rodgers of University of Chicago
§ Jason Sielcken of GSA
§ Darrell Smith of Microsoft
§ Porus Antia of Stantec
§ Matt Ganser of Carbon Lighthouse
§ Anna Morton of dbHMS
§ Rob Peña of the University of Washington and the Integrated Design Laboratory
§ Phillip Saieg of McKinstry.
The authors would like to thank the following NREL staff: Otto VanGeet, Ron Judkoff, Stefanie Woodward, and Joelynn Schroeder; and Maureen McIntyre of McIntyre Communications Inc. We also thank the following LBNL staff: Jessica Granderson, Dale Sartor, and Charlie Williams. All provided their time and expertise in developing or reviewing the guide.
The authors would like to thank Sonia Punjabi of the DOE Building Technologies Office for support of this project.
7ACKNOWLEDGMENTS

Advisory Group Project Highlights Discussed in This Chapter
University of California, Merced, campus benchmarking
University of Chicago, dormitory modeling
DOE/NREL, parking structure calculation document
Fort Carson Army Base, barracks write-in target
Photo by Dennis Schroeder, NREL 23186
WHAT IS AN ENERGY TARGET AND WHAT IS ITS ROLE IN A HIGH-PERFORMANCE BUILDING?
An energy target is an annual, whole-building energy use limit defined before a building is designed. It is a critical element of any new or retrofit high-performance building (HPB). An energy target does not use or save energy directly; however, it guides all project decisions toward energy efficiency by directing focus and motivation to a building’s measured performance. Just as the firm-fixed price or completion date reign supreme in project management meetings, the energy target should be a primary motivator in design meetings. Once the target is met in design and proven during the turnover and warranty phases, responsibility for meeting the target should be transitioned to the building operator.
The whole-building energy target should be reviewed often during building operations. Where possible, the target should be divided into goals for individual energy-using systems so discrepancies between actual energy use and the target can be quickly tracked to specific building systems such as plug and process loads (PPLs) or data centers. An energy information system (EIS) is recommended for tracking and reviewing the whole-building and system-level energy use targets.
Energy target variationsAn energy target can take various forms in terms of units and, more importantly, in terms of scope. The following examples illustrate some typical types of energy targets; however, any target shifts owner and design team attention toward energy performance, even if each drives somewhat different decisions in design and operations.
§ Demand side versus supply side: A demand-side energy target emphasizes energy use reduction; a supply-side target drives the use of renewables.
§ Source versus site: A source energy target expands the scope of the goal to the energy required to extract, process, and transport the resource and is more representative of the total energy use; a site target is more straightforward to calculate but may promote somewhat perverse incentives from cost and sustainability perspectives by equally weighting the impact of a British thermal unit (Btu) of natural gas and electricity, for example. Disaggregating the energy target for different sources is one way to address the competing interests of easy measurability and overall accuracy. Source energy calculations can be used to determine if a HPB is achieving zero energy status.
§ Energy consumption versus peak demand: An energy target is more common, but a peak demand target is often a better driver of operating cost reduction and impact on power system infrastructure. It may, however, be a poorer indicator of total energy use.
§ Whole-building versus subsystem: Subsystem targets are often necessary to draw attention to important systems such as data centers or laboratory spaces, but a whole-building goal ensures that all loads are considered.
§ Absolute versus normalized (for design or operations variables): To be useful for comparisons over time and against other buildings, the units and normalization of the goal should be considered. The most common
CHAPTER 1—ENERGY TARGETS
7CHAPTER 1—ENERGY TARGETS

normalization factors are weather (e.g., heating and cooling degree days) and building floor area. Various normalizations have built-in biases. For example, normalizing by floor area favors buildings with large floor areas. For two buildings exactly the same in all respects except floor area, the energy use intensity (energy use per floor area) for the larger building will be less than for the smaller building. Other factors such as occupancy can influence design results. For example, recent HPBs have set energy targets with respect to floor area and total occupancy to encourage high occupant density (instead of allowing the total energy allowance to increase with floor area without constraint).
A set of targets will likely be used for a project; however, no matter which options are selected, the primary target (the one that is publicized and hopefully included in the contract) should be:
§ Specific: One number (e.g., whole-building annual site energy use) that is the responsibility of all team members (owner, designer, contractor, consultants).
§ Measurable: Can be measured at the site and reported with minimal external data or manipulation.
§ Inclusive: Accounts for all loads associated with the building, such as miscellaneous electric loads and outdoor lighting.
§ Appropriately aggressive: The target should have an impact on design and operations, which means it must present a reasonable challenge to the owner and design team.
Minimum requirement for high-performance buildingsSome owners may have the resources to consider which set of goals best suits their organizations’ energy missions and desired operating outcomes. Others may be simply working toward a first HPB. In the latter case, the following target forms should be considered as contractual and primary operating goals:
§ Energy use intensity (EUI)
- Units of kBtu/ft2/yr are commonly used and allow for straightforward comparison across all building and energy source types.
- Example: 25 kBtu/ft2/yr is a 50% reduction (of site energy) versus code for a typical office building in Golden, Colorado. (See www.nrel.gov/docs/fy12osti/55131.pdf for guidance on setting EUI target values.)
§ Zero energy
- Multiple zero energy building (ZEB) definitions can be used based on the primary motivation for a given building, such as emission reduction compliance versus demand cost reduction. Site and cost ZEB metrics, versus source or emissions (Torcellini 2006), can be identified
on energy bills, which makes them simple for building operators to track and report. Source and emissions metrics more accurately account for the total energy and climate impacts of various design and operations decisions.
- Example: A draft definitions report by the U.S. Department of Energy (DOE) recommends the use of source energy; the ZEB designation should be used only for buildings that have demonstrated through annual measurement that the value of on-site renewable exported energy is greater than or equal to the value of delivered energy through the site boundary. National average source-site ratios are given in the report, making the conversion to source energy simple and consistent across the country.
A percent savings goal is often defined for owners who are pursuing Leadership in Energy and Environmental Design (LEED®) certification or for those who are responding to a strategic energy management plan (common for continuously improving performance in existing buildings that were not constructed with measurable energy targets). Although a percent savings metric is valuable for comparing results to a baseline (e.g., measured PPL profiles in existing buildings), it can become convoluted when the baseline cannot be clearly defined (e.g., PPL assumptions in theoretical new construction baselines). Any number of targets and goals can be used to guide improvement, but the set should include at least one of the measurable targets listed above. Ideally, an EUI target would be used on all projects to drive energy demand reduction and then source ZEB would be layered on to drive renewable energy production to match the remaining energy use.
WHAT ARE THE KEY ACTIONS TO SETTING AND USING AN ENERGY TARGET?
Planning The first step in HPB design and operations is for the owner to declare the intent for the project or building to be high performance and to translate that into specific quantitative and qualitative goals. The owner’s project team needs to identify the purpose of the target and then select the appropriate target form. For example:
§ Whole-building energy efficiency (site or source EUI)
§ Overall environmental impact or carbon footprint (source EUI)
§ The use or reduction of certain energy sources (end use EUI)
§ Energy cost control (energy cost per floor area or a peak demand cap, depending on rate structure)
§ Comparison of performance to other buildings (normalized EUI, benchmarking score, Energy Asset Score, etc.)
8 CHAPTER 1—ENERGY TARGETS

§ Influence of occupant density or other design variables (consider normalization factors).
Once the form of the energy target is selected, a variety of approaches can be used to determine its magnitude (Leach 2012). Numerous resources can be used to set this value; ENERGY STAR® Portfolio Manager’s TargetFinder utility, ASHRAE’s Advanced Energy Design Guides, and DOE’s Building Energy Asset Score tool are useful for setting an EUI. Benchmarking can be used to refine the goal or set portfolio-wide standards, or an energy consultant can be hired to perform preliminary modeling or optimizations based on cost and energy performance for stretch goals.
Unless budget is not a constraint, the whole-building EUI target should be set to a stringency that balances cost and performance. A target that is too aggressive does not enable budgets to be met and thus risks being dismissed by the owner. A target that is too easy will not result in an HPB.
ProcurementOnce set, the energy target must become a focus of the owner and the design team (once the team is selected). The target (or targets) should be required and communicated internally with a statement of vision and intent from the owner to any third-party owner’s representative or other members of the owner’s project team. The goals should also be considered in importance relative to other design goals. The final planning step is to require the target in the request for proposals (RFP) and project contract. The actual RFP or contract language can take many forms such as:
§ A single target
§ Multiple, prioritized targets (e.g., two EUI tiers, a “must achieve” and a “stretch goal”)
§ Write-in targets (i.e., the proposing team can choose the EUI based on other constraints such as a fixed budget) with minimum EUI requirement.
When writing the RFP language about energy targets, three specific recommendations are to:
§ Include the targets in a prominent part of the project contract language.
§ Require substantiation of the target through energy modeling at every design stage and at turnover in the form of an as-built energy model.
§ Link performance incentives to the design substantiation results and measured energy use in the first year of operations.
(See https://buildingdata.energy.gov/cbrd/energy_based_acquisition for information on setting up an HPB procurement, or acquisition, process.)
Examples of developing and requiring energy targets in project procurement
University of California, Merced campus
Benchmarking and managing energy strategically
The University of California used an organization-wide, or strategic energy management approach to setting building energy targets for its new Merced campus. Well in advance of acquiring buildings for this campus, the university performed regression analysis on “business-as-usual” energy data for common building types across the organization (Brown 2002). A goal of 50% improvement from the benchmarked energy use was set but phased in over the construction timeline: 80% to start, then 65% of benchmark once the 80% target was proven successful. The 50% target was introduced for the more recent buildings. For each building on the campus, the relevant percent of benchmark was the starting point for the organization’s energy managers to set contractual energy targets. The reduction was translated to peak demand and annual energy targets for each energy commodity, and normalized for the local climate, before it was presented to the design team.
§ EUI target: Based on building type, disaggregated for energy source with a peak demand cap
§ How was the target set and required? An initial benchmarking effort set the business-as-usual case and then a gradual reduction from that value was implemented over time. This is an example of organization-wide strategic energy management.
University of Chicago new dormitory construction
Using a multifaceted goal-setting approach
The 800-bed dormitory building with mixed-use space was the University of Chicago’s first opportunity to use a contractual energy target. The organization’s energy manager proceeded cautiously by using many sources of information to set the value of the target, and presenting the target as a scalable number with respect to total occupancy and floor area.
§ EUI target: 65 kBtu/ft2/yr
§ How was the target set?
- First pass: ENERGY STAR Portfolio Manager’s Target Finder; Commercial Buildings Energy Consumption Survey comparison; peer campus comparisons
- Cross check: Benchmarking to other campus buildings’ EUIs
9CHAPTER 1—ENERGY TARGETS

- Final selection: Energy modeling of EUI versus successive energy efficiency measures (the energy target sits at approximately the third quartile of the modeling results, which sits within the range of the other boundaries developed by the first pass and cross check)
- Normalized by area and total occupancy to constrain energy use and allow for design flexibility (Figure 1-1).
§ How was the target required?
- Required in the project contract (Figure 1-2) - Modeling expectations were given to the design team in
the RFP - Modeled EUI was checked against the target at each
design phase.
National Renewable Energy Laboratory parking structure
Emphasizing a calculation procedure
DOE and the National Renewable Energy Laboratory (NREL) successfully used contractual energy targets for office buildings
and a cafeteria (Scheib 2014)(NREL 2014) before constructing its 1800-space parking structure. However, industry example targets and data for benchmarking this type of structure (new to the organization) were not available when the target value was set. Instead, the project’s energy representatives used a simple spreadsheet calculation and assumptions of end use system efficiency to create the energy target from the ground up. DOE/NREL presented the following simple goal calculation procedure in the project contract to provide a transparent method for the design team to review when responding to the RFP and to later follow in its design substantiation calculations.
§ EUI target: 175 kBtu/parking space/yr
§ How was the target set and required?
- Best-in-class exterior lighting equipment was reviewed because lighting is the primary end use for the structure.
- A simple calculation (the amount of time the best-in-class lights should be on plus miscellaneous electric loads) was used to determine the target and was documented in the RFP (Figure 1-3).
Area (ft2)Total Number of Residents (Including Staff)
826 840 850 860 870 880 890 900 910 920 930
315,000 72.2 73.4 74.3 75.2 76.1 76.9 77.8 78.7 79.6 80.4 81.3
320,000 71.1 72.3 73.2 74.0 74.9 75.7 76.6 77.5 78.3 79.2 80.0
325,000 70.0 71.2 72.0 72.9 73.7 74.6 75.4 76.3 77.1 78.0 78.8
330,000 68.9 70.1 70.9 71.8 72.6 73.4 74.3 75.1 76.0 76.8 77.6
335,000 67.9 69.1 69.9 70.7 71.5 72.4 73.2 74.0 74.8 75.6 76.5
340,000 66.9 68.0 68.9 69.7 70.5 71.3 72.1 72.9 73.7 74.5 75.3
345,000 65.9 67.1 67.9 68.7 69.5 70.3 71.1 71.8 72.6 73.4 74.2
350,000 65.0 66.1 66.9 67.7 68.5 69.2 70.0 70.8 71.6 72.4 73.2
355,000 64.1 65.2 65.9 66.7 67.5 68.3 69.0 69.8 70.6 71.4 72.2
360,000 63.2 64.3 65.0 65.8 66.6 67.3 68.1 68.9 69.6 70.4 71.2
365,000 62.3 63.4 64.1 64.9 65.6 66.4 67.2 67.9 68.7 69.4 70.2
370,000 61.5 62.5 63.3 64.0 64.8 65.5 66.3 67.0 67.7 68.5 69.2
375,000 60.7 61.7 62.4 63.2 63.9 64.6 65.4 66.1 66.8 67.6 68.3
380,000 59.9 60.9 61.6 62.3 63.1 63.8 64.5 65.2 66.0 66.7 67.4
385,000 59.1 60.1 60.8 61.5 62.2 63.0 63.7 64.4 65.1 65.8 66.5
390,000 58.3 59.3 60.0 60.7 61.4 62.1 62.9 63.6 64.3 65.0 65.7
Figure 1-1. University of Chicago example of a sliding scale EUI target (kBtu/ft2/yr)
The Campus North Residence Hall and Dining Commons shall meet at least a site EUI of 65 kBtu/ft2/yr annually or less per year. If the number of residents or size of the facility changes, then the designer should reference Figure 1-1 for the required energy target. The energy target applies to the final combination of resident hall spaces, retail spaces, and dining commons. The goal is intended to serve as a mechanism to create a building that uses less than this energy intensity annually within its own footprint. This target shall be delivered by the design-build team through the use of any variety of energy efficiency measures while utilizing the existing campus chilled water and steam systems. If an on-site boiler or geothermal system is proposed for the project then the EUI
target requirement will be reduced by 10 kBtu/ft2/yr annually (applies to both the 65 kBut/ft2/yr target and any modified EUI from Figure 1-1). The goal is a demand-side goal to be achieved through energy efficiency strategies. Renewable generation options such as biomass, wind, or renewable energy credits do not count toward the 65 kBtu/ft2/yr annual goal. The intent is to use the goal as a tool to develop a comprehensive program of efficiency measures, building operational strategies, and policies to reduce energy use in the buildirg as the first priority, rather than encouraging the use of supply side renewable options coupled with a less efficient building where all energy efficiency options have not been first fully exploited.
Figure 1-2. University of Chicago example of RFP language requiring a whole-building EUI
10 CHAPTER 1—ENERGY TARGETS

Army, Fort Carson new barracks construction
Allowing for stretch goals
Fort Carson used an alternative approach to target setting for a new barracks facility. The owner reviewed case studies of similar buildings in similar climates and thus derived an aggressive, yet very achievable, EUI value. This base target was presented early in the RFP. A write-in energy target above the base target was also presented to allow the industry experts (the proposing design and energy modeling teams) to define
exactly how aggressive the target could be within the project budget.
§ EUI target: 44 kBtu/ft2/yr minimum goal § How was the target set and required?
- Case studies were used to set the minimum EUI goal described with the contract language (Figure 1-4).
- Write-in stretch targets (Figure 1-5) were used to determine stretch goals.
The next step for the owner is to select the design team that can deliver a building that has the potential to be operated to the goal. The owner should differentiate proposals and teams by asking about their experience (1) creating and using models that estimate as-operated energy performance; (2) comparing as-operated performance to models; and (3) code compliance modeling.
Figure 1-4. Fort Carson example of RFP language requiring a minimum whole-building EUI
EUI. The target site energy consumption budget (including plug loads), for this facility, which is located in DOE climate zone 5B, shall not exceed the EUI 44 (kBTU/ft2 yr) value for the Barracks facilities. Facilities meeting this EUI will be in compliance with ECB 2010-14 energy reduction requirements and will be EISA 2007-ready. They will comply with EISA 2007 fossil fuel reduction requirements, when connected to the CAB combined heat and power (CHP) plant and (Consolidated Boilers and Chiller Facility).
In the CLIN Pricing Schedule, page 00 11 00 - 4, complete the Building Energy Efficiency Statement and the Renewable Energy Statement provided below. The proposed percentage for Building Energy Efficiency should be greater than or equal to 40%, excluding the use of renewable energy sources and/or systems as defined as: “Energy from sources that are not depleted by use. Examples include energy from the sun such as photovoltaic (PV), solar thermal (water heating), and bioenergy systems based on wood waste, agricultural crops or residue, animal and other organic waste, or landfill gas. Other examples include energy from wind and active solar thermal energy systems that employ collection panels and/or heat transfer mechanical components (such as pumps or fans) and defined heat storage systems (such as hot water tanks) and Thermal-siphon solar and storage tank batch heaters.”. The proposed percentages must be supported by a life cycle cost analyses as defined below. Should the Offeror receive award, the proposed percentages shall become a contract requirement.
Building Energy Efficiency Statement: EXCLUDING all proposed renewable energy sources, this project will achieve an energy consumption at least ____% less than the consumption of a baseline building meeting the minimum requirements of ASHRAE Standard 90.1-2007.
Renewable Energy Statement: This project will include renewable energy systems that produce an amount of energy that will offset _____% of the annual energy consumption of a baseline building meeting the minimum requirements of ASHRAE Standard 90.1-2007.
Figure 1-5. Fort Carson Example of RFP Language Allowing Write-In Stretch Goals
Figure 1-3. NREL parking garage example of RFP language requiring a whole-building EUI
175 kBtu per Parking Space Annual Goal. This goal is intended to serve as a mechanism to create a building that uses less than this energy intensity annually within its own footprint. The goal is a demand-side goal to be achieved through energy efficiency strategies. Supply-side renewable generation options such as PV, wind, or renewable energy credits do not count toward the 175 kBtu per parking space goal. The intent is to use the goal as a tool to develop a comprehensive program of efficiency measures and building operational strategies and policies to reduce energy use in the building as the first priority, rather than encouraging the use of supply-side renewable options coupled with a less efficient building where all energy efficiency options have not been first fully exploited.
§ The whole building energy use will be measured at the building footprint. It includes all loads in the building: lighting, security cameras, and other miscellaneous equipment connected through the building, such as transformers and control systems.
§ All losses from transformers and inverters are considered part of this energy calculation. Use of direct current lighting that can use the 100,000 kWh PV allotment for the garage will be considered for a to-be-determined credit.
§ Under this definition, PV on or through the building will be considered a supply-side technology, and not count toward the 175 kBtu per parking space goal.
§ Daylighting and natural ventilation are considered demand-side technologies.
§ Based on NREL occupancy data and a typical parking structure daylighting study, the EUI recommendation of 175 kBtu/parking space/year is based on: - 0.05 W/ft2 LPD - 25% hours of operation for daytime hours (75% reduction on
maximum LPD) - 25% hours of operation for nighttime hours (75% reduction
on maximum LPD) - Full annual operating schedule - Approximately 0.10 kBtu/ft2/year controls allowance - 8.5’ x 19.5’ parking space - Transition area equals one-and-a-half times the parking space
area.With 1,500 or 1,800 spaces, the design will fit within the 100,000 kWh PV allotment for the structure.
Excluded loads from the energy goal include: § Power for recharging stations § Power for intermittent plug loads such as those incurred by
power washing structure surfaces.
Continuous load due to transformers required for the plug loads should be included when calculating the annual energy goal.
11CHAPTER 1—ENERGY TARGETS
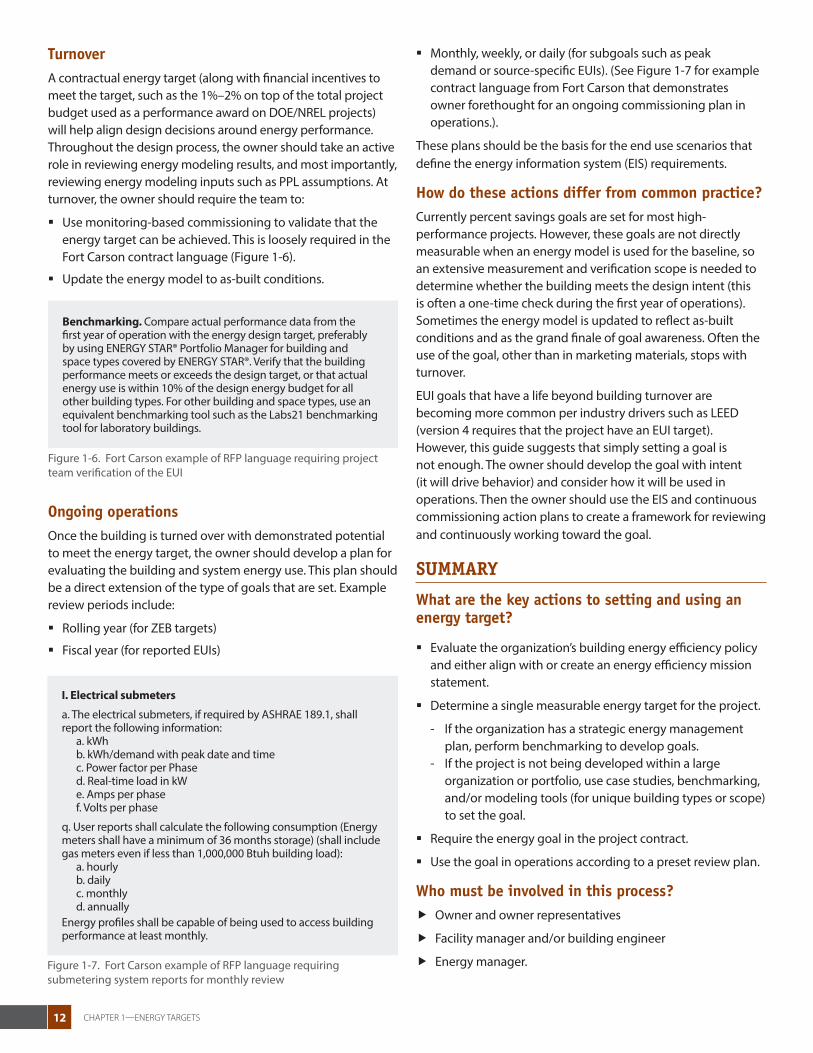
Turnover A contractual energy target (along with financial incentives to meet the target, such as the 1%–2% on top of the total project budget used as a performance award on DOE/NREL projects) will help align design decisions around energy performance. Throughout the design process, the owner should take an active role in reviewing energy modeling results, and most importantly, reviewing energy modeling inputs such as PPL assumptions. At turnover, the owner should require the team to:
§ Use monitoring-based commissioning to validate that the energy target can be achieved. This is loosely required in the Fort Carson contract language (Figure 1-6).
§ Update the energy model to as-built conditions.
Ongoing operations Once the building is turned over with demonstrated potential to meet the energy target, the owner should develop a plan for evaluating the building and system energy use. This plan should be a direct extension of the type of goals that are set. Example review periods include:
§ Rolling year (for ZEB targets)
§ Fiscal year (for reported EUIs)
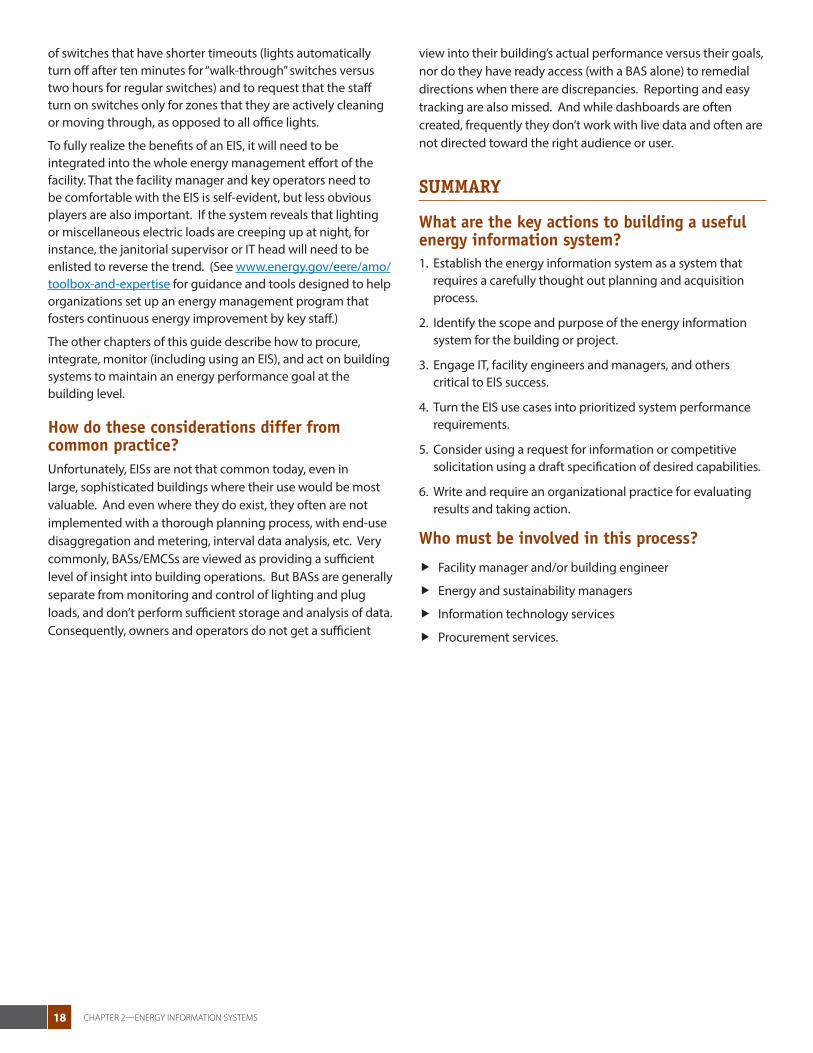
§ Monthly, weekly, or daily (for subgoals such as peak demand or source-specific EUIs). (See Figure 1-7 for example contract language from Fort Carson that demonstrates owner forethought for an ongoing commissioning plan in operations.).
These plans should be the basis for the end use scenarios that define the energy information system (EIS) requirements.
How do these actions differ from common practice?Currently percent savings goals are set for most high-performance projects. However, these goals are not directly measurable when an energy model is used for the baseline, so an extensive measurement and verification scope is needed to determine whether the building meets the design intent (this is often a one-time check during the first year of operations). Sometimes the energy model is updated to reflect as-built conditions and as the grand finale of goal awareness. Often the use of the goal, other than in marketing materials, stops with turnover.
EUI goals that have a life beyond building turnover are becoming more common per industry drivers such as LEED (version 4 requires that the project have an EUI target). However, this guide suggests that simply setting a goal is not enough. The owner should develop the goal with intent (it will drive behavior) and consider how it will be used in operations. Then the owner should use the EIS and continuous commissioning action plans to create a framework for reviewing and continuously working toward the goal.
SUMMARY
What are the key actions to setting and using an energy target?
§ Evaluate the organization’s building energy efficiency policy and either align with or create an energy efficiency mission statement.
§ Determine a single measurable energy target for the project.
- If the organization has a strategic energy management plan, perform benchmarking to develop goals.
- If the project is not being developed within a large organization or portfolio, use case studies, benchmarking, and/or modeling tools (for unique building types or scope) to set the goal.
§ Require the energy goal in the project contract.
§ Use the goal in operations according to a preset review plan.
Who must be involved in this process? � Owner and owner representatives
� Facility manager and/or building engineer
� Energy manager.Figure 1-7. Fort Carson example of RFP language requiring submetering system reports for monthly review
I. Electrical submeters
a. The electrical submeters, if required by ASHRAE 189.1, shall report the following information:
a. kWhb. kWh/demand with peak date and timec. Power factor per Phased. Real-time load in kWe. Amps per phasef. Volts per phase
q. User reports shall calculate the following consumption (Energy meters shall have a minimum of 36 months storage) (shall include gas meters even if less than 1,000,000 Btuh building load):
a. hourlyb. dailyc. monthlyd. annually
Energy profiles shall be capable of being used to access building performance at least monthly.
Figure 1-6. Fort Carson example of RFP language requiring project team verification of the EUI
Benchmarking. Compare actual performance data from the first year of operation with the energy design target, preferably by using ENERGY STAR® Portfolio Manager for building and space types covered by ENERGY STAR®. Verify that the building performance meets or exceeds the design target, or that actual energy use is within 10% of the design energy budget for all other building types. For other building and space types, use an equivalent benchmarking tool such as the Labs21 benchmarking tool for laboratory buildings.
12 CHAPTER 1—ENERGY TARGETS

Advisory Group Project Highlights Discussed in This Chapter
California State University, request for proposals
DOE/NREL, dashboard use cases
Photo by Dennis Schroeder, NREL 23186
WHAT IS AN ENERGY INFORMATION SYSTEM AND HOW CAN IT HELP ME?
Energy information systems (EISs) are the magnifying glasses of building energy management. Although building automation systems (BASs, sometimes also called energy management control systems, EMCSs) provide a snapshot of what is happening in a building in the short term, EISs enable facility managers and operators to compare current and historical energy performance and to view demand and consumption (at the broad level of the utility meter down to any submetered systems) that are normalized for key variables such as weather and occupancy. EISs can also package their analyses on the key elements of energy use into customized reports. They can track trends in your building—for instance, its response to operating hours—offering a ready means to visualize those trends (via a dashboard). They can help you measure the real impacts of your energy conservation measures, isolating them from other factors that affect energy use. Most EISs also provide some degree of anomaly detection, identifying when consumption—at the level of a building system (or more granularly, if the building is submetered)—is out of range. An EIS is not a substitute for the BAS, but it is an important tool for any truly high-performance building.
Energy information system definitionA typical EIS consists of interval metering equipment, a means for data aggregation and storage, and web-accessible visualization or reporting tools for whole-building and, ideally, system-level energy performance (the latter depending on submetering).
A related and overlapping concept, “energy management information system” (EMIS), refers to the broader range of hardware and services that includes the EIS, but extends to those that actually operate the building (BAS/EMCS), as well as ones that perform advanced analysis and, in some instances, take action on the building systems to improve energy use and indoor environmental quality. They include:
§ System-level monitoring and control (typically a heating, ventilation, and air conditioning-focused BAS but also, potentially, lighting and other energy-related building control systems)
§ Fault detection and diagnostics (FDD)
§ Automated system optimization (ASO) (Granderson 2013).
Although this chapter focuses primarily on EISs, we include the EMIS definition to avoid confusion between these two similar (and similarly abbreviated) concepts. A comparison of system definitions and scope is given in Table 2-1. The definition boundaries are not rigid and some systems can fit in more than one category, such as an advanced EIS with submetering.
CHAPTER 2—ENERGY INFORMATION SYSTEMS
EMIS tools Data scope
Whole-building focusBenchmarking and utility bill analysis Monthly utility bills
EIS and Advanced EISInterval meter data (e.g., hourly or 15-minute)
System focus BAS, FDD, and ASOInterval meter data (e.g., 15-minute or less)
Table 2-1. EMIS Tool Comparison (re-created from http://eis.lbl.gov/pubs/emis-crash-course.pdf )
13CHAPTER 2—ENERGY INFORMATION SYSTEMS

Determining what role the EIS will play in the building’s energy management and which features are desired is critical to its success and system cost control. Some organizations might use a mix of tools and that’s where careful specification of the EIS in light of existing data sources becomes increasingly important. For instance, in 2010 DOE and the National Renewable Energy Laboratory (NREL) in Golden, Colorado, focused on a very ambitious energy intensity goal for its planned Research Support Facility (RSF). NREL identified the three main functions of its EIS as being able to (1) identify system performance issues quickly; (2) track adherence to the RSF’s zero energy goal (the design planned for solar photovoltaics to meet 100% of the remaining electricity load); and (3) provide occupants with information about how to save energy and improve comfort. Details of these use cases are described below. The example use cases can serve as a template for creating your own. We use the following elements to define a use case: who will use the EIS interface (primary audiences), how will the interface be used to save energy (description), and a brief sequence of events describing what information will be processed by the EIS and presented. This level of detail is appropriate for an owner team’s first pass at defining EIS requirements—more detailed use cases can be developed as needed with the help of the owner’s information technology (IT) services, or by the EIS vendor.
NREL RSF use case #1: Identify end-use systems’ energy performance issues.Primary audience: Building engineer.
Description: The building engineer responds to real-time power (kilowatts) and energy (kilowatt-hours) relative to hourly expectations.
Success scenario: § For each hour of the year, the EIS
determines the expected energy use of each end-use system from
An EIS of some kind is almost imperative for closely tracking adherence to an energy goal (at least at intervals more frequent than the monthly utility bills). For example, even the most basic EIS (e.g., one without submetering, threshold alarming, or anomaly detection) is needed to assess utility meter trends and continually align a building’s energy use with its intended performance goal. Advanced EMIS elements such as FDD and ASO can be used to address anomalies (e.g., drilling down into subsystem performance) and automate optimal operation where budgets permit.
PURPOSE OF THIS CHAPTERThis chapter is meant to be a primer for project teams and owners on how to lay the groundwork for procuring or building a highly effective EIS, with particular emphasis on whole-building energy target tracking. The following sections provide key considerations at each project phase. The EIS is meant to be an operations tool; however, this chapter also emphasizes the planning stages.
WHAT ARE THE KEY ACTIONS FOR PUTTING A HIGHLY EFFECTIVE ENERGY INFORMATION SYSTEM IN PLACE?
Planning An EIS should be acquired with the same consideration as other integrated business systems (requesting a dashboard is not sufficient). The myriad capabilities represented by available products in the market make it very worthwhile for an owner or design team to clearly define its needs. The considerations include process and human resources, in addition to equipment (metering, sensors, gateways, etc.) and software. A planning effort should include a commitment to use the information the system provides to track and meet the building’s energy target. Plans need to specify what information will be collected and how (including how frequently and by whom) it will be acted upon.
This planning stage is when a number of details should be addressed. To best take advantage of an EIS, close thought should be given to relating meter points and existing physical and sensing infrastructure to desired tracking and analyses. For instance, if the electrical panels are set up to match the desired granularity of the systems from which you want to collect data, the submetering costs (and ultimately the analytical effort) will be considerably lower.
The primary purpose of an EIS should be energy target tracking and tuning. However, an EIS has uses that range from assisting (in conjunction with the BAS/EMCS and possibly an ASO) with high-resolution building component control and optimization by the building engineer to monthly energy cost tracking by the chief financial officer. To ensure that your organization obtains an appropriate system, brainstorm the required and desired uses of the system with those who will need it or might make use of it. The uses, or use cases,1 should identify which data, reports, or metrics (including units and analysis periods) are needed and who will use the information. Examples include:
§ The building engineer daily monitors the BAS (and possibly the lighting control system).
§ The facility manager tracks the monthly utility bills.
1 A use case is the description of interactions between an actor and a system to achieve a desired outcome, a technique largely used in software engineering to arrive at system requirements.
14 CHAPTER 2—ENERGY INFORMATION SYSTEMS

regression or other data-driven baseline modeling results. § Real-time power and energy data are displayed with respect
to the expected operating range (see www.nrel.gov/docs/fy13osti/58521.pdf for a more in-depth case study).
§ The energy engineer can open the “energy dashboard” and determine in less than one minute whether each end use is performing as expected.
NREL RSF use case #2: Verify the RSF’s zero energy building status.Primary audience: Visitors and occupants.
Description: Audiences ranging from visitors to NREL directors are able to understand building energy use versus energy production (and are ultimately motivated to replicate successes).
Success scenario: § Real-time submetered data are displayed for occupants and
visitors in the building lobby: - End-use hourly profiles show the hour-to-hour dynamic
energy use. - A daily summary displays the total energy use and
production along with weather conditions. - An annual summary shows the zero energy building
status of the building over the past year.
NREL RSF use case #3: Manually open and close windows.Primary audience: Occupants.
Description: Occupants open windows during optimal exterior conditions and close windows during non-optimal conditions.
Success scenario: § The BAS identifies appropriate conditions for opening
windows based on temperature, humidity, and wind speed. § A change of status is communicated to the occupants via pop-
up messages on a desktop application. § If occupants miss the alert and are inclined to open or close
a window, they can open the application to see the most recent status.
Other examples of industry experience with EISs have been described through case studies (LBL 2014) and technical advisory group discussions. For example, Walmart sought to easily identify out-of-range store performance at the portfolio level; Sysco wanted to be able to assess the effectiveness—i.e., perform measurement and verification—of prospective energy-saving interventions in its numerous refrigerated warehouses; California State University desired (and made very explicit in its request for proposals) the ability to report on greenhouse gas emissions (Granderson 2013). Each case results in unique equipment architectures and organizational practices for the system.
Figure 2-2 shows the “lobby dashboard” from NREL RSF use case #2
Figure 2-3 shows the resulting desktop interface or “occupant dashboard” that responds to NREL RSF use case #3
Figure 2-1 shows the power (kilowatts) page of the dashboard that responds to NREL RSF use case #1. The white part of the gauges represents the expected operating range, the green represents lower-than-expected power draw. When the dial is in the red range (with any regularity), the building engineer is tipped off to investigate hourly energy use plots and higher resolution BAS sensor and controller readings, and potentially take remedial action.
15CHAPTER 2—ENERGY INFORMATION SYSTEMS

§ The environmental compliance or sustainability group benchmarks annual energy use (e.g., ENERGY STAR) and reports on greenhouse gases (pursuant to regional, state, or municipal requirements).
§ The building owner’s representative or other energy champion tracks monthly or annual energy use intensity.
§ Building operators and others track daily whole-building and system energy use.
§ The energy champion tracks weekly occupant plug loads.
§ The building engineer is alerted to issues through continuous anomaly detection and peak load alarming.
For many, resources may be too scarce to fully develop requirements for broad-ranging EIS implementations. Assuming the building is targeting a specific annual energy use, the recommended minimum elements include:
§ System-level energy use measurement and reporting (e.g., power submeters for systems such as lighting; heating, ventilation, and air conditioning; and possibly other end uses, particularly where the electrical panel design readily accommodates this).
§ Dashboard with a one-minute glance to evaluate each end use; requires that detailed information (at least a daily energy use profile with interval meter data) about each end use can be accessed.
§ Accessible real-time and historical data, including the ability to produce annual reports. - Automated interval analysis (e.g., annual energy use
calculations and comparisons), including data cleaning - Energy use reporting via internal website, displayed with
expected operating bands.
Granted, this recommendation is more involved than one for the most basic EIS, defined as a Web-accessible graphical display showing metered whole-building electricity use (Long 2013). The added elements incorporate (1) submetering, which allows for system comparison to predictions and a first step toward resolving issues; and (2) reporting relative to expectation, which sets accountability for the people who are tasked to act on the information.
A major consideration in planning the EIS is how—and by whom—the information it provides will be used. During the use case development, identify a responsible party, or actor, for each use. Part of deciding what is to be tracked should be identifying whose responsibility it will be to assess—and act upon—the information resulting from that tracking. For instance, one operator may be responsible for tracking out-of-range lighting use (as illustrated in the Walmart case) and another may be responsible for reporting on the greenhouse gas data the system is generating. An analysis service may
be the best option for many organizations without in-house capability. The bottom line is that care should be taken to make sure EIS assignments are reasonable in terms of staff knowledge and time constraints.
ProcurementA working group of DOE’s Better Buildings Alliance developed specification language for EISs. You can use this resource (see https://www4.eere.energy.gov/alliance/activities/technology-solutions-teams/energy-management-information-systems) to select requirements language that matches your relevant use cases. The general process for turning a use case into requirements is to:
§ Define the needed data streams to calculate the desired metrics (Btu/ft2/year, kW/ton, power usage effectiveness, etc.).
§ Define the security requirements related to each user.
§ Define standards for analysis—e.g., International Performance Measurement and Verification Protocol (EVO 2014) and ASHRAE Guideline 14 (ASHRAE 2002), statistical metrics, and confidence interval.
§ Define hardware, software, and security requirements unique to the building or organization (what is already there?).
§ Define internal capability to set up and operate the system, versus the desire or need for third-party assistance.
For a single, small building, a short and internally agreeable list of EIS requirements can probably be defined; alternatively, you may be relegated, due to budget constraints, to a more “off the shelf” type of product. For large buildings or campuses, many “wants” and differing “needs” will need to be defined. Given the rapidly changing EIS market offerings, one way to approach the issue of too many requirements is to break them into tiers. The tiers can serve two purposes:
§ Identify what’s possible for the money: To understand the possibilities within the realm of currently available EIS systems and the project budget, consider a request for information or qualifications. The tier names for the project’s various of EIS requirements might take the form of “required,” “preferred,” and “if possible.”
§ Communicate differing needs: In a campus scenario, for example, set up a suite of packages or EIS requirements with a common base system. This will allow consistency among campus buildings without requiring that the most basic buildings be outfitted with the most advanced “bells and whistles.” The tier terms for this application might be advanced EIS and basic EIS.
An EIS can effectively identify and reduce wasted energy when applied as a retrofit to an existing building. However, the optimal strategy for applying an EIS is to incorporate its planning into the building design, particularly in conjunction
16 CHAPTER 2—ENERGY INFORMATION SYSTEMS

with electrical system circuitry logic and submetering. You should determine ahead of time what you want to measure and track so the appropriate metering and logging can be installed in tandem with the programming of the EIS, and connected to it.
Turnover and ongoing operationsOnce the EIS hardware has been installed and functional testing has been performed, the immediate steps that should be taken before handoff, or as early as possible after handoff, include:
§ System commissioning: Focus on EIS commissioning in advance of other energy infrastructure components so the EIS can then be used to commission other systems. Ensure networking and communications continuity, as well as the accuracy of meters, sensors, and the “point mapping.”
§ Basic operating bound checks: Create an energy model that reflects the as-built conditions, and use the model to set up expected energy performance ranges in the EIS dashboard.
§ Training: Require system training and handoff using a one- to-three-year contract. (See www.bsria.co.uk/services/design/soft-landings for an example delivery framework intended to bridge design intent and operation outcomes.)
To reduce the risk of poor energy performance and to distribute the responsibility for energy performance across a variety of team members, write the EIS use case scenarios into job tasks. The job tasks can be written for roles within the owner’s organization or incorporated into third-party consultant contracts (possibly with the EIS provider itself ), a service structure currently being tested by the General Services
Administration (note that some EIS providers themselves offer these services, particularly data analysis). Include organizational managers in the process by scheduling regular energy performance review meetings.
During ongoing operations, review data (e.g., against dashboard operating ranges) according to the use cases defined:
§ Evaluate data quality and respond to faults regularly (preferably daily).
§ Hold monthly meetings to review metrics and assign actions.
For example, Sysco managers coordinated monthly reviews of the primary EIS metric—a proprietary one they called efficiency factor—with each store’s energy champion. Walmart’s benchmarking analysts used EIS data to find the 20 poorest performing sites for monthly investigations (Granderson 2010).
Almost inevitably, functional or energy performance problems will be identified during the regular EIS evaluations. Consider formalizing a plan for logging and addressing the issues discovered. An example of this proactive approach is a Sysco energy champion who starts each day with a review of refrigeration energy use for the two previous days and then formulates an energy plan for the current day (Granderson 2010).
Returning to the NREL example, energy use is viewed daily for out-of-range end uses. In the first year of operations, evening lighting energy use was out of range, because the custodial staff was not accounted for in the model. Figure 2-4 shows the dashboard with live data that led to the remediation of excessive evening lighting energy use.
Figure 2-4 shows NREL’s internal dashboard with the RSF’s lighting power consumption
To address the issue, two actions were taken: (1) the energy model that was created based on as-built conditions was calibrated slightly to account for the realistic use; and (2) custodial staff are apprised in periodic trainings of the locations
One example of a thoughtful approach to EIS procurement is California State University, where the energy team in 2014 created a specification for a new EIS (which is enterprise wide and covers all of its 23 campuses) to be used in a competitive request for proposals (RFP) process. The specification included all the capabilities that the university desired, breaking them into “required” and “preferred” elements across a multitude of categories ranging from utility metering to monthly reporting to energy forecasting and budgeting. In addition, the spec called out a series of requirements for compatibility with, and security of, existing systems and IT networks.
17CHAPTER 2—ENERGY INFORMATION SYSTEMS
of switches that have shorter timeouts (lights automatically turn off after ten minutes for “walk-through” switches versus two hours for regular switches) and to request that the staff turn on switches only for zones that they are actively cleaning or moving through, as opposed to all office lights.
To fully realize the benefits of an EIS, it will need to be integrated into the whole energy management effort of the facility. That the facility manager and key operators need to be comfortable with the EIS is self-evident, but less obvious players are also important. If the system reveals that lighting or miscellaneous electric loads are creeping up at night, for instance, the janitorial supervisor or IT head will need to be enlisted to reverse the trend. (See www.energy.gov/eere/amo/toolbox-and-expertise for guidance and tools designed to help organizations set up an energy management program that fosters continuous energy improvement by key staff.)
The other chapters of this guide describe how to procure, integrate, monitor (including using an EIS), and act on building systems to maintain an energy performance goal at the building level.
How do these considerations differ from common practice?Unfortunately, EISs are not that common today, even in large, sophisticated buildings where their use would be most valuable. And even where they do exist, they often are not implemented with a thorough planning process, with end-use disaggregation and metering, interval data analysis, etc. Very commonly, BASs/EMCSs are viewed as providing a sufficient level of insight into building operations. But BASs are generally separate from monitoring and control of lighting and plug loads, and don’t perform sufficient storage and analysis of data. Consequently, owners and operators do not get a sufficient
view into their building’s actual performance versus their goals, nor do they have ready access (with a BAS alone) to remedial directions when there are discrepancies. Reporting and easy tracking are also missed. And while dashboards are often created, frequently they don’t work with live data and often are not directed toward the right audience or user.
SUMMARY
What are the key actions to building a useful energy information system? 1. Establish the energy information system as a system that
requires a carefully thought out planning and acquisition process.
2. Identify the scope and purpose of the energy information system for the building or project.
3. Engage IT, facility engineers and managers, and others critical to EIS success.
4. Turn the EIS use cases into prioritized system performance requirements.
5. Consider using a request for information or competitive solicitation using a draft specification of desired capabilities.
6. Write and require an organizational practice for evaluating results and taking action.
Who must be involved in this process?
� Facility manager and/or building engineer
� Energy and sustainability managers
� Information technology services
� Procurement services.
18 CHAPTER 2—ENERGY INFORMATION SYSTEMS

Advisory Group Project Highlights Discussed in This Chapter
NREL, office benchmarking and change management
GSA, workstation monitoring
Bullitt Center, tenant leases
Photo by Dennis Schroeder, NREL 17831
WHAT ARE PLUG AND PROCESS LOADS AND WHY ARE THEY IMPORTANT?
Plug and process loads (PPLs) account for 33% of U.S. commercial building energy consumption (McKenney 2010). (See Figure 3-1.) Minimizing these loads is a significant challenge in the design and operation of a high-performance building. In a minimally code-compliant office building, plug loads typically account for 25% of the total electrical load. In a high-performance office building, plug loads are typically one of the last end uses to be considered for energy conservation and, as a result, can account for more than 50% of the total electrical load (Lobato 2011).
PLUG AND PROCESS LOADS DEFINED
PPLs are all loads in a building except for those associated with general lighting; heating, ventilation, and air conditioning (HVAC); and water heating. PPLs include (but are not limited to) office equipment (computers, monitors, printers, fax machines, scanners, etc.), phone chargers, occupant-provided space heaters, coffee makers, task lights, water fountains, dishwashers, elevators and more. They are a growing fraction of building energy use because the number and variety of electrical devices have increased markedly over recent decades, while other building systems such as lighting and HVAC have grown more efficient. Reducing PPLs is difficult because they are diverse and because our understanding of related energy efficiency opportunities is limited. Centralized educated decisions about possible strategies are difficult to make because, typically, the owner and operator roles in charge of PPLs are almost as diverse as the equipment. The owner, tenant, engineer, architect, information technologies (IT) procurement staff, and facility operator all can have a say in decisions about PPLs. Furthermore, most PPLs are not addressed by building codes.
CHAPTER 3—PLUG AND PROCESS LOADS
Electricity79%
Natural Gas 17%
Petroleum/Coal 3%On-Site
Renewables 1%Ventilation
11%
Water Heating 7%
PPLs33%
Lighting 20%
Space Heating 16%
Space Cooling 13%
Figure 3-1. PPLs account for 33% of the total energy consumed by commercial buildings (DOE 2012)
19CHAPTER 3—PLUG AND PROCESS LOADS

PURPOSE OF THIS CHAPTER
The purpose of this chapter is to provide owners specific approaches for managing the potentially large and variable energy use associated with PPLs in operations. As with the other systems discussed in this guide, the owner must make an upfront effort to set up the loads to be manageable in operations. Therefore, the timespan of action starts in building planning and extends to turnover and operations.
WHAT ARE THE KEY ACTIONS TO PUTTING A MANAGEABLE PLUG AND PROCESS LOAD SYSTEM IN PLACE?
PlanningA valuable first step is to benchmark PPL equipment in the occupants’ previously occupied building (or in a similar, “typical” building). Data from this exercise will serve as a baseline for energy models and formulating energy targets or end-use energy budgets. For example, in the National Renewable Energy Laboratory’s (NREL’s) previously occupied, leased office space, the PPL annual energy use intensity (EUI) was 25 kBtu/ft2/yr [7.3 kWh/ft2/yr]. When NREL was in the planning stages for its new building, the Research Support Facility (RSF), the energy budget for the entire building was 25 kBtu/ft2/yr [7.3 kWh/ft2/yr] (Lobato 2011). Therefore, had NREL kept its PPL practices the same, it would have exceeded the energy budget for the entire building on PPLs alone.
It is important to make a list of the PPLs that are—or will be—installed in the building. Conceptualizing which PPLs will go into the building facilitates the energy modeling and energy goal-setting processes.
ProcurementFor new construction, the owner should specify in the request for proposals (even for performance-based contracting) that all PPL circuits be organized onto dedicated electrical panels. The metering resolution should match the intended ongoing monitoring plan (e.g., workstation monitoring versus office space monitoring). Forethought in the organization of electrical circuits makes the process of monitoring PPLs much easier and cheaper during ongoing operations.
Additionally, for tenant fit-outs, owners should include energy use targets in leases with incentives or penalties for compliance. The target should be aggressive enough to assume best-in-class PPLs are purchased (e.g., ENERGY STAR®) and at least 50% of the plug loads are controlled to off when unused. An energy-aligned leasing strategy is used in the Bullitt Center, a newly constructed 52,000-ft2 office space in Seattle, Washington. Each tenant agrees to use less than 16
kBtu/ft2/yr [4.7 kWh/ft2/yr], and then pays no utility bill (or receives a rent credit if building goals are exceeded). The lease language does not necessarily need to be finalized during project procurement; however, consideration is necessary to ensure that adequate submetering and sizing requirements are provided to the design team early in the project. (See www.nrdc.org/business/cgi for more information on high performance tenant projects.)
Turnover Occupants should receive educational materials as part of the turnover process. For example, in the RSF, occupants received an educational brochure (and training sessions) that told a compelling story about how PPLs in their building were reduced by 47% compared to previously occupied office space and how this translated to a typical workstation setup. (See Figure 3-2 and Figure 3-3.) These materials also provided instructions on: (1) how to use the advanced power strips located at their workstations; (2) how to properly power off their equipment each night; and (3) how to operate the energy-efficient multifunction devices. Because occupants have such a significant impact on PPL efficiency, they need to be aware of the important role they play in helping meet energy budgets.
Ongoing operations Occupants will change electronics several times over a building’s lifetime and may thus jeopardize the overall energy budget. One best practice for ongoing operations is to provide occupants with a menu of recommended electronics; this document should list the most energy-efficient models available (see, for instance, www.epeat.net or the ENERGY STAR® Product Finder utility). A policy can be instituted to
0.00
5.00
10.00
15.00
20.00
0.00
1.5
2.9
4.4
5.9
Baseline RSF
EUI (
kBtu
/ft2 /y
r)
(kWh/ft 2/yr)
Baseline vs RSF Plug Load EUI
CoElevator Lighting Elevators Drinking Fountains Vending Machines Microwaves CoRefrigerators Task Lights Phones Fax Machines Copiers Printers Computers Data Center Conference Room Equipment Telecom Room Equipment Misc
Figure 3-2. NREL’s baseline PPL EUI compared to the PPLs in the RSF
20 CHAPTER 3—PLUG AND PROCESS LOADS

mandate that occupants choose from this menu when they buy (or bring in their own) new workstation electronics, as well as comfort and preference items such as fans and radios.
Figure 3-4 shows an example of a recommended list. The list is updated as new computer hardware becomes available. Ideally, occupants would receive this type of written recommendation at move-in and see the equipment options in the organization’s procurement software. The power specifications of the allowable equipment should match the assumptions used in the building’s energy model.
We recommend that the benchmarking and PPL procurement programs be initiated and maintained (e.g., upkeep of the
recommended hardware procurement list) with the help of a “PPL champion.” This person or team is responsible for maintaining awareness of the organization’s or building’s PPL policy and energy use. This champion can be a third-party consultant, an energy or IT manager, or even a general building occupant in your organization.
The PPL champion also needs to ensure the energy performance of the installed PPLs. For example, in DOE/NREL’s RSF, the computer screensaver settings were preventing computers from going into “sleep” mode. The PPL champion noticed this and worked with the IT department to ensure computers go into sleep mode when idle (see Figure 3-5). This resulted in significant PPL savings.
The PPL champion should include PPL checks (e.g., scanning workstations for unexpected PPLs if a per-occupant budget has been given) during regularly scheduled safety walkthroughs or as part of ongoing commissioning activities. This is an important step in ensuring that PPLs don’t grow over time and exceed the energy budget.
The DOE/NREL RSF example of occupant plug load monitoring takes the form of manual checks and review. In contrast, GSA implemented an automated monitoring solution in a 2014 zero energy retrofit of Wayne Aspinall Courthouse in Grand Junction, Colorado. Each occupant workstation is individually
0.0
10.0
20.0
30.0
40.0
50.0
60.0
70.0
80.0
90.0
11:25 11:40 11:55 12:10 12:25 12:40
Pow
er (W
)
Time
Computer Power Consumption
Monitor and Computer Screensaver On (W) Monitor Standby (W)
Monitor and Computer Standby (W)
Figure 3-5. Computer power consumption before (blue) and after (red) adjustments were made to the screensaver settings on computers
Recommended Computer Hardware - Dell
Approx. $1,600
Dell Latitude E6500 • 15.4” LED Backlit display • Up to Intel® Core™ 2 Duo
3.06GHz • 4GB RAM • Up to 250GB, 7200rpm hard
drive • 8x DVD+/-RW • ~5.5 lbs
Available with : • Solid State Hard Drive • Integrated Broadband (AT&T or
Verizon)
Dell Latitude E6400 • 14.1” LED Backlit display • Up to Intel® Core™ 2 Duo
3.06GHz • 4GB RAM • Up to 250GB, 7200rpm hard
drive • 8x DVD+/-RW • ~4.5 lbs
Available with : • Solid State Hard Drive • Integrated Broadband (AT&T
or Verizon)
Approx $1,600
Approx. $1,700
Dell Latitude E4300 • 13.3” LED Backlit display • Intel® Core™ 2 Duo SP9600 with
VT (2.53GHz) • 4GB RAM • Up to 250GB, 7200rpm hard
drive • 8x DVD+/-RW • ~3.5lbs
Available with : • Solid State Hard Drive • Integrated Broadband (AT&T or
Verizon)
Dell Latitude E4200 • 12.1” LED Backlit display • Intel® Core™2 Duo ULV
SU9600 with VT (1.60GHz) • 3GB RAM • Up to 256GB Solid State Hard
Drive • External 8x DVD+/-RW • (no internal drive bay) • ~2.5lbs.
Available with : • Integrated Broadband (AT&T
or Verizon)
Approx $1,900
Approx. $800
Dell Optiplex 160 • Ultra-small form factor PC • Intel® Atom™ 330 Dual Core
Processor • 4GB RAM • 160GB Hard Drive
Dell LED Backlit LCD G2410h (24”) – $290 G2210h (22”) – $210
• 16:9 aspect ratio and full HD resolution • Up to 1,000,000:1 dynamic contrast ratio (typical) • Height adjustable stand • Uses less than half the energy of a comparably sized TFT LCD • VGA and DVI Inputs
Figure 3-4. NREL example of recommended PPL procurement sheet
Figure 3-3. NREL’s baseline workstation loads compared to those in the RSF
RSF Baseline
ENERGY STAR® VOIP Phones
2 Watts
Conventional VOIP Phones
15 Watts
LED Task Light6 Watts
Flourescent Task Light
2 Watts
24” LCD Monitor18 Watts
24” LCD Monitor50 Watts
Laptop Computer30 Watts
Desktop Computer300 Watts
Shared Printers100 Watts
Personal Printer460 Watts
Load Sensing Power Strip
Personal Space Heater
1500 Watts
21CHAPTER 3—PLUG AND PROCESS LOADS

metered for energy and the result is displayed on an internal dashboard. Figure 3-6 shows an example of per-occupant monitoring, one that could be connected to a building’s energy information system. In this solution, occupants are empowered to monitor and adjust their own plug load use, and building operations staff can use spot checks and automatic notifications to detect out-of-range energy use.
In addition to automated monitoring, automated control of plug loads is an approach that reduces the need for intervention by occupants and the plug load champion. For example, equipment procurement guidelines (see Figure 3-4) might require that purchased computers and servers have a set of power management features including a nighttime “sleep” mode. If the equipment is on a network then network endpoint management software can be used to ensure that the equipment power management settings are working as expected and add an additional layer of power management for servers or other equipment not directly controlled by the occupant. The pros and cons of using occupant engagement versus system automation to control PPL use is discussed in more detail in Chapter 5, Occupant Engagement.
How do these considerations differ from common practice?Architects, engineers, and construction managers typically consider PPLs something that tenants or occupants bring into the building after turnover, and often owners do not think about PPLs until that point. The steps in this chapter differ from current practice because we recommend early consideration of PPL needs and policies that require purchase of best-in-class (for energy efficiency) equipment. Also, we recommend the role of PPL champion be assigned to a person (or group of people) to take ownership of implementing the load control strategies and maintain design intent in operations. PPLs are a “living system”; over time, occupants will move in and out of
the building and PPL needs will change. The changes in PPLs in any given year are likely to exceed the energy target if not proactively managed.
SUMMARY
What are the key actions to managing plug and process loads? The seven key steps to managing PPLs are:
1. Establish a PPL champion.
2. Develop a business case for reducing PPLs by benchmarking conventional equipment.
3. Identify occupants’ “true” needs with respect to PPLs, and meet those needs as efficiently as possible.
4. Turn off PPLs at night and during any other unoccupied hours.
5. Encourage the design team to identify all applicable strategies.
6. Institutionalize procurement decisions and policy programs.
7. Promote occupant awareness.
Who must be involved in this process? To maximize PPL energy savings, the following parties must be involved in this process:
� Facility manager, building engineer, or both
� Energy manager
� IT representative
� PPL equipment procurement officer
� Executive management
� Building occupants.
Figure 3-6. Workstation power monitoring dashboard showing results for one occupant (dashboard used by the PPL champion)
22 CHAPTER 3—PLUG AND PROCESS LOADS

Advisory Group Project Highlights Discussed in This Chapter
DOE/NREL, performance requirements
DOE/LBNL, Better Buildings Challenge partnering
Photo by Dennis Schroeder, NREL 24598
WHY FOCUS ON DATA CENTERS?
Data centers present unique challenges for high-performance buildings (HPBs). Sometimes residing away from the building or outsourced to a cloud provider, or explicitly excluded from HPB energy accounting, data centers (and even the smaller but more ubiquitous server closets) are generally 10–100 times as energy intensive as typical office space. As an example, the campus data center at the DOE/National Renewable Energy Laboratory’s Research Support Facility (34 kBtu/ft2/yr, including the data center) is responsible for about 40% of the building’s energy use, even though it represents only about 0.5% of the floor space. Relegating data centers to an “outside the fence” status (i.e., excluded them from the building’s or campus’s energy accounting) may be convenient; however, it ignores their prominence in energy use (more than 2% of U.S. electricity) and the opportunities to reduce their consumption.
DATA CENTERS DEFINITION
Data centers are building spaces that are specifically dedicated to housing all types of computing equipment, ranging from a rack of central processing units to telecommunication and Internet switchgear to supercomputers. At minimum they have their own zone for cooling. Frequently they are configured with dedicated cooling equipment; sometimes this is tied into the overall building cooling system (e.g., the chilled water loop). This guidance is most applicable to data centers, commonly defined as being larger than 500 ft2; however many of the concepts are equally applicable to smaller rooms and server closets.
PURPOSE OF THIS CHAPTER
This chapter informs owners and operators on how to plan and operate energy-efficient data centers. Much of the guidance is applicable to both new construction and existing space. The design and operations of data centers and data closets are often activities that take place outside the traditional building procurement process and so the project phases of planning, procurement, turnover, and operations are loosely applied to the guidance. Also, while the majority of this guide focuses on operations as opposed to design, the design of data centers is frequently a de facto operations issue, as data centers are often developed as renovation/retrofit projects in existing buildings, rather than being part of new construction. Consequently, this piece veers more into design issues than the previous chapters, touching on strategies of which data center operators must be aware.
WHAT ARE THE KEY ACTIONS TO ACHIEVING A HIGHLY EFFICIENT DATA CENTER OR SERVER CLOSET?
PlanningPrior to data center design or equipment purchase, a wise first step is to survey existing spaces, equipment, and energy use of the existing or comparable data centers. Additionally, current industry metrics should be reviewed for use in driving forward data center performance goals. Consideration in the
CHAPTER 4—DATA CENTERS
23CHAPTER 4—DATA CENTERS

planning phase by the owner and operator will allow for a comprehensive data center design that includes appropriate infrastructure and monitoring equipment. The following sections give non-linear actions to take in the planning phase.
Identify all relevant spaces
As discussed previously, full data centers along with any dedicated server closets (and small rooms) should be identified in the building. This is especially important because of the gains that can be made with consolidation and virtualization strategies, as well as with dedicated space conditioning for the relevant equipment.
Determine appropriate metrics and the means to measure them
The primary metric for assessing data center infrastructure efficiency, power usage effectiveness (PUE) looks at the total energy for the data center divided by that used strictly by the information technology (IT) equipment. Any fraction higher than 1.0 represents parasitic loads (e.g., cooling, power conditioning, lights). The approximate U.S. average is 1.8–2.0;
anything lower than about 1.5 is good practice. Best practice data centers have achieved PUEs lower than 1.1; thus, less than 10% of the datacenter energy is required for cooling, power conditioning, lighting, etc.
Energy reuse effectiveness (ERE) is a related metric that is relevant when waste heat is being harnessed and used. For ERE, the fraction of that heat that is used beneficially is subtracted from the PUE numerator, such that, for instance, a 1.4 PUE data center would have a 0.7 ERE if half its generated heat were diverted as useful heat.
Other metrics can be used to assess the efficiency of the IT equipment, although these are less common than PUE, and the specifics of their measurement less consistent. One is utilization; i.e., the percentage of server CPU capacity that is actually being used. Another is transactions per watt, sometimes called computational productivity (often shortened to productivity). But neither utilization nor productivity has a consistent standard of measurement. A good example of a productivity measurement is eBay, which measures and tracks per-transaction energy consumption—productivity, ostensibly—but taking into account both the IT equipment and infrastructure efficiency (see http://tech.ebay.com/dashboard).
PUE is the most common metric to measure data center efficiency. Facebook used PUE as a guiding metric in its Prineville data center. A qualitative, “best-in-class” target drove the data center’s design and an informal PUE target of 1.07 is guiding ongoing operations. An annual average of 1.06 is the most recent performance report. The company extensively tracks and publicly reports data center performance (see www.facebook.com/PrinevilleDataCenter), and will continue to do so through their Better Buildings Challenge for Data Centers commitment (see https://www4.eere.energy.gov/challenge/partners/data-centers).
DOE/NREL also used a PUE metric in its request for proposals (RFP) for the Energy Systems Integration Facility, which houses a 10-MW supercomputer. ERE was also used to drive the reuse of waste heat since the supercomputer was expected to be part of a larger laboratory building. Figure 4-1 is a snapshot of the RFP language given to proposing design-build teams. Heat recovery from the large computing load was a primary requirement of any proposed design.
The metrics that focus on IT equipment efficiency are useful both in project procurement and ongoing operations to ensure new equipment purchases, upgrades, and equipment use over time are tracked and optimized. Additional metrics are emerging to more clearly define the accounting boundary between IT equipment and infrastructure. Industry-defined metrics should be reviewed and selected at the start of data center design based on desired outcomes (e.g., ERE to drive building integration, productivity to ensure holistic process accounting).
REQUIRED—Request for Proposal Submission
Provided in the RFP Y/N
Design and build the facility by integrating safety including operational safety, fire protection and life safety into every phase of the project including design, construction and anticipated use.
Accommodate all laboratories, a 200 person office and the High Performance Computing Center (HPCDC) described in the program
Achieve an annualized Power Use Effectiveness (PUE) of 1.06 or lower and an annualized Energy Reuse Effectiveness (ERE) of 0.9 or lower for the HPCDC .
Key Subcontractors and Personnel for the MEP Team Member and Data Center Team Member
Provide a schedule with guaranteed Substantial Completion date of October 2011.
REQUIRED—After Subcontract Award
Excess waste heat from the data center above that which is used to heat the facility is exported for use by the remainder of the campus.
Research equipment identified in the Program will be state‐ of‐ the art at the time of occupancy.
GOALS
Achieve an average annualized ERE of 0.6 or less for the HPCDC.
250 staff office space capacity …
Figure 4-1. DOE/NREL data center performance requirements written into a project contract
24 CHAPTER 4—DATA CENTERS

Measure and benchmark current energy use
If you have a data center, you need to assess its current performance, preferably using PUE. If the facility is not already submetered, this is a necessary preliminary activity in order to achieve deep savings. To measure the IT load, it is best to measure the input to the equipment or at the rack level on the outlet of the power distribution units. However, the output of the uninterruptable power supply (UPS) is an easier but less accurate option if all the IT equipment (and only the IT equipment) is served by the UPS.
Proper measurement of data centers is a topic unto itself. For instance, the total energy used by the center needs to be isolated; this generally includes systems such as power distribution and cooling that serve the overall building. A valuable 2012 reference from The GreenGrid (www.thegreengrid.org) that discusses these issues and provides good methods to handle them is called PUE: A Comprehensive Examination of the Metric.
A last step in this measuring and benchmarking exercise is to use the relevant metric to set improvement goals. Savings of 50% or more relative to conventional operations are often attainable; another option is to set the goal at a less challenging level and focus on continual improvement. The Data Center Partnership of DOE’s Better Building Challenge recommends a minimum goal of reducing infrastructure energy (PUE minus 1) by 25% within 5 years.
Procurement through OperationsOnce metrics are defined and numeric goals are set using benchmarking results of existing data centers where possible, a data center can be designed and equipment procured. Whether new or existing, a data center that is part of an HPB must be maintained according to the design intent. This includes using an energy performance monitoring infrastructure as well as performing simple and often overlooked activities such as inserting a blanking panel after removing a server or servicing the computer room air conditioning units. The actions that a data center operator should take in design and regularly over time are described in the following sections.
Identify opportunities in IT equipment and software
One set of efficiency opportunities that isn’t addressed by PUE involves the IT load, the denominator in the PUE metric. Most servers in the United States are substantially underloaded. By consolidating and “virtualizing” (see below) distributed machines (e.g., ones in multiple server closets) into one location (e.g., a dedicated data center), you can raise load factors considerably. As part of this process, you should also investigate the true needs of users. Applications on dedicated servers are often no longer in use; thus, these “zombie” servers
can be shut down or re-deployed to address other needs.
Server virtualization involves using software solutions to simulate separate hardware systems. In this way, independent functions—including operating systems—can reside on the same equipment. This of course also heightens the equipment’s load factors (assuming unneeded equipment is shut down). New equipment procurement is a convenient time to transition from stand-alone computing on old machines to virtualized computing (on the new ones). The combination of new efficient (and more powerful) servers and the higher utilization rate can yield up to a 10 to 1 replacement ratio of old equipment to new.
Another opportunity is equipment efficiency. This includes servers and other components that are covered under the ENERGY STAR® labeling program Because turnover time of this equipment in data centers is fairly rapid, making sure efficient equipment is specified is an especially important (and relatively easy) step toward improving overall data center efficiency over time. An additional step is to make sure to enable the power management features (particularly “sleep” capability) that are integral to efficient equipment.
Use IT to monitor and control IT
One seemingly intuitive, but not always employed, component of data center energy strategy is using data center equipment and software to optimize their operation. Energy information systems (see Chapter 2) or data center infrastructure management (DCIM) systems, if programmed appropriately, represent an excellent tool to monitor data center performance. From the power draw of individual servers to aisle temperatures to the amount and temperature of the chilled water being provided to the cooling equipment, critical energy management information should be collected and monitored by the energy information system/DCIM and used by the operators—with the help of user-friendly “quick glance” dashboards—to home in on the most efficient strategies for operating the data center. For example, NREL tracks its ESIF supercomputer performance metrics using the energy information system interface shown in Figure 4-2.
Optimize environmental conditions, including humidity control
Data center equipment is changing rapidly and so are guidelines. Two of the most common misconceptions regard temperature and humidity requirements. Many facilities keep their data centers at unnecessarily cold temperatures, often in the 60s (Fahrenheit) and at extremely tight humidity levels. ASHRAE’s guidance on data center cooling recommends up to 80.6oF (27oC) as an acceptable temperature for server racks’ inlet (i.e., front, or “cold aisle”) air temperature. Hence the
25CHAPTER 4—DATA CENTERS

outlet or hot aisle can exceed 100oF. Some vendors of data center equipment are willing to furnish equipment with higher temperature tolerances.
Humidity control in data centers is another widely misunderstood parameter. The very common direct expansion computer room air conditioning units often come shipped with a default humidity setting and a very tight control range (e.g., 55% ± 5% relative humidity). Such a range is typically not needed in a modern data center where IT equipment is routinely designed for 20%–80% (or even 10%–90%) relative humidity. Tight humidity specifications were reasonable when computer cards were used in data centers, 40 or more years ago. An efficient data center should have little to no humidity source or removal. Unfortunately, cooling coils often run below the dew point temperature, so unintentional dehumidification occurs and tight set point ranges cause some computer room air conditioners to dehumidify while others humidify. In a data center at Lawrence Berkeley National Laboratory (LBNL), energy was reduced 28% and humidity decreased 3% when the humidity controls were completely turned off. Raising the coil temperatures above the dew point to eliminate condensing can significantly increase efficiency and the effective capacity of air conditioning equipment. Most data centers require no humidification or dehumidification. If some control is needed, it should be coordinated to avoid simultaneous humidification and dehumidification.
While the average temperature in many data centers is too cold, hot spots often drive the operator to reduce the temperature. Therefore, the air management should be improved (discussed in the following section) before the temperature set points are increased. Moving to a warmer data center is best done over an extended period of time with a good monitoring system in place. Thermal maps generated by DCIM systems allow operators to troubleshoot hot spots but raise overall operating temperatures.
Manage airflow
The key piece of guidance regarding airflow in data centers is to avoid homogenization of space conditioning and instead isolate cold supply air and hot exhaust air as much as possible. This starts by orienting the servers, in rows, such that there are hot (outlet) and cold (inlet) aisles, with conditioned air being introduced in the cold aisle and exhausted from the hot. Numerous methods are used to further isolate hot and cold, from simple blanking panels in space voids in the racks to elaborate containment of the hot or cold aisles with rigid structures or curtains. Again, the goal is to minimize the mixing of supply and exhaust air between hot and cold aisles. Ideally, the supply air leaving the air conditioner and entering the IT equipment (the cold aisle) is 75oF–80oF and the return air (hot aisle) exceeds 100oF.
With under-floor air distribution, a common design feature in
Figure 4-2. DOE/NREL supercomputer dashboard for tracking PUE and ERE
26 CHAPTER 4—DATA CENTERS

Figure 4-3. Tidying cable can improve airflow problems
large data centers, another worthwhile practice is to tune the floor tiles for optimum performance. Perforated tiles should be placed in the cold aisle only. They must be selected for proper flow and velocity; too many permeable tiles can result in insufficient air pressure to properly cool the tops of the server racks. Air leakage through the floor and between the hot and cold aisles wastes significant energy. Such leaks need to be stopped to isolate hot and cold air in your data center.
One sometimes overlooked issue regarding airflow is how to manage—minimize and sequester—cable. Unused cable is common in data centers and impedes airflow, both beneath the floor and at the racks. Cable mining—identifying and removing unused cable and wiring—is a worthwhile endeavor in most data centers (Figure 4-3).
Evaluate cooling options
Once good air management is achieved, temperatures can be increased as described previously. This combination of optimized airflow, a high temperature difference between hot and cold aisles, and high operating temperatures lends itself to very high cooling system efficiency. For example, many hours of free cooling using either an air- or water-side economizer
can be achieved.
A few of the many considerations for providing cooling in data centers are economizer design (e.g., air- or water-side), air versus liquid cooling of racks, central plant versus dedicated equipment, and chillers versus direct expansion units. These issues are discussed extensively in the DOE/Federal Energy Management Program’s (FEMP’s) Best Practices Guide for Energy-Efficient Data Center Design (see www1.eere.energy.gov/femp/pdfs/eedatacenterbestpractices.pdf).
Improve electrical efficiency and other infrastructure
Most data center owners and operators are aware of the differing efficiencies of UPSs, especially given the ENERGY STAR® labeling program. In addition, UPSs should be sized properly, because their efficiencies fall off considerably at loading lower than about 40%. Often, a desire for redundancy and the prospect of future loads drive gross oversizing of electrical and mechanical systems, resulting in very poor operating efficiency. In one account from a technical advisory group member, more than half the energy was being lost to heat at the UPS because of low load conditions.
27CHAPTER 4—DATA CENTERS
Many efficiency issues are specific to data centers, so it may be easy to forget that the principles that apply to typical commercial space also apply to data centers. Properly sized motors; variable-speed drives; cooling tower optimization; and efficient, appropriate (i.e., not overlit), and well-controlled lighting are equally applicable to data centers and, in some instances, provide even quicker paybacks (because of the high energy intensity and long operating hours) than they do in conventional space.
How do these considerations differ from common practice?Data center planning and operations often occur outside the scope of work that connects the other HPB systems discussed in this guide. However, data centers that reside in HPBs must be a key operational consideration. Due to continuously changing use profiles and equipment requirements, data centers present a variable load over a long time horizon that could drastically impact whether an HPB meets its energy use target each year. For the same reason, data centers also present incredible opportunity to improve the efficiency of existing buildings and to meet long-term strategic energy goals. Instead of outsourcing the data center energy considerations beyond an HPB’s energy boundary, we recommend that data centers be considered as building systems that must be planned for, monitored with sensing and reporting infrastructure, and tracked and improved over time.
SUMMARY
What are the key actions to achieving a highly efficient data center? 1. Identify all relevant spaces.
2. Determine appropriate metrics and the means to measure them.
3. Measure and benchmark current energy use.
4. Manage the data center to the metrics or performance specifications
- Identify opportunities in IT equipment and software.
- Use IT to monitor and control IT
- Optimize environmental conditions, including temperature and humidity control
- Manage airflow
- Evaluate cooling options
- Improve electrical efficiency.
Who must be involved in this process?
� Facility manager and/or building engineer
� Energy and sustainability managers
� Information technology services
� Procurement services.
28 CHAPTER 4—DATA CENTERS

Advisory Group Project Highlights Discussed in This Chapter
NREL, occupant engagement tools and process
GSA, occupant education
Photo by Dennis Schroeder, NREL 26382
WHAT IS THE ROLE OF OCCUPANTS IN A HIGH-PERFORMANCE BUILDING?
Energy performance is the primary focus of this guide, but occupant comfort and environmental quality are paramount in high-performance operations. To meet occupant comfort and low energy use project requirements, design teams often make building systems highly accessible and give occupants a reasonable level of control over the system status. The obvious benefit is that occupants can tune systems to meet their general preferences and current task needs; additionally, high occupant interaction with a typical commercial building can result in a 10% decrease in energy consumption relative to a well-commissioned, all-automatic building control system (NBI 2011). The risk of giving system control to occupants is that they don’t behave as expected. In this instance, energy consumption can increase (by as much as 40%, in one instance) relative to the design-targeted operating conditions (NBI 2011). The unexpected behavior can take the form of occupants leaving lights on overnight, forgetting to reset thermostats, or permanently overriding sensors.
High-performance building (HPB) operators must engage with occupants to prevent unexpected behavior by helping them understand design intent and find energy-wise solutions to comfort problems. Their role is to manage the building systems over time with respect to seasons, preferences, and turnover, while continuing to meet the whole-building or system-level energy targets. Likewise, an occupant’s role is to maintain awareness of her impact on building energy use and use the available controls in a way that improves comfort and energy performance.
OCCUPANT ENGAGEMENT DEFINED
Occupant engagement starts with the operator or building giving occupants information about the building or its component systems, such as lighting and heating, ventilation, and air conditioning (HVAC). This information should be accompanied by a specific action the occupant can take to improve comfort or energy performance, or both. Engagement occurs when the occupant chooses an action, most commonly one that balances both energy and comfort depending on variables such as temperature and humidity, time of day, or possibly an energy reduction incentive.
PURPOSE OF THIS CHAPTER
The purpose of this chapter is to provide owners specific approaches for managing energy use related to occupant preferences. As with the other systems discussed in this guide, the owner must make an upfront effort—well before the first occupant moves in—to set expectations and communicate about the roles and responsibilities of occupants in an HPB ecosystem. The timespan of action starts in building planning and extends to turnover and operations.
CHAPTER 5—OCCUPANT ENGAGEMENT
29CHAPTER 5—OCCUPANT ENGAGEMENT
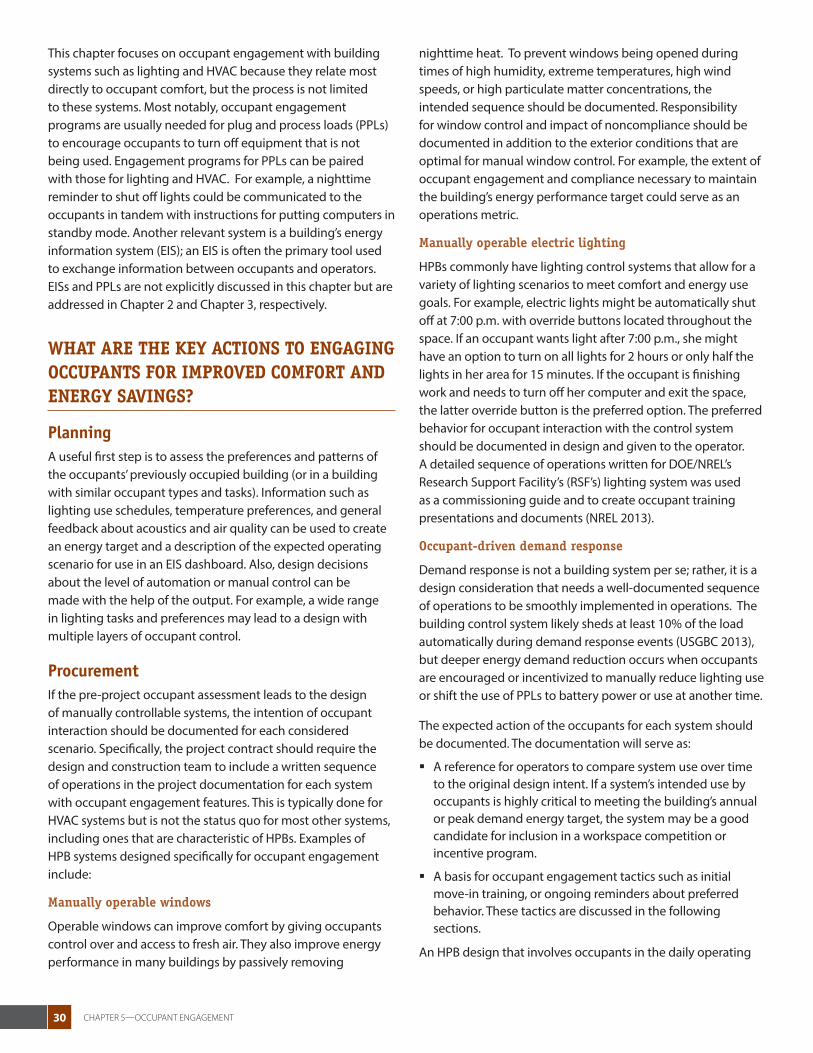
This chapter focuses on occupant engagement with building systems such as lighting and HVAC because they relate most directly to occupant comfort, but the process is not limited to these systems. Most notably, occupant engagement programs are usually needed for plug and process loads (PPLs) to encourage occupants to turn off equipment that is not being used. Engagement programs for PPLs can be paired with those for lighting and HVAC. For example, a nighttime reminder to shut off lights could be communicated to the occupants in tandem with instructions for putting computers in standby mode. Another relevant system is a building’s energy information system (EIS); an EIS is often the primary tool used to exchange information between occupants and operators. EISs and PPLs are not explicitly discussed in this chapter but are addressed in Chapter 2 and Chapter 3, respectively.
WHAT ARE THE KEY ACTIONS TO ENGAGING OCCUPANTS FOR IMPROVED COMFORT AND ENERGY SAVINGS?
Planning A useful first step is to assess the preferences and patterns of the occupants’ previously occupied building (or in a building with similar occupant types and tasks). Information such as lighting use schedules, temperature preferences, and general feedback about acoustics and air quality can be used to create an energy target and a description of the expected operating scenario for use in an EIS dashboard. Also, design decisions about the level of automation or manual control can be made with the help of the output. For example, a wide range in lighting tasks and preferences may lead to a design with multiple layers of occupant control.
ProcurementIf the pre-project occupant assessment leads to the design of manually controllable systems, the intention of occupant interaction should be documented for each considered scenario. Specifically, the project contract should require the design and construction team to include a written sequence of operations in the project documentation for each system with occupant engagement features. This is typically done for HVAC systems but is not the status quo for most other systems, including ones that are characteristic of HPBs. Examples of HPB systems designed specifically for occupant engagement include:
Manually operable windows
Operable windows can improve comfort by giving occupants control over and access to fresh air. They also improve energy performance in many buildings by passively removing
nighttime heat. To prevent windows being opened during times of high humidity, extreme temperatures, high wind speeds, or high particulate matter concentrations, the intended sequence should be documented. Responsibility for window control and impact of noncompliance should be documented in addition to the exterior conditions that are optimal for manual window control. For example, the extent of occupant engagement and compliance necessary to maintain the building’s energy performance target could serve as an operations metric.
Manually operable electric lighting
HPBs commonly have lighting control systems that allow for a variety of lighting scenarios to meet comfort and energy use goals. For example, electric lights might be automatically shut off at 7:00 p.m. with override buttons located throughout the space. If an occupant wants light after 7:00 p.m., she might have an option to turn on all lights for 2 hours or only half the lights in her area for 15 minutes. If the occupant is finishing work and needs to turn off her computer and exit the space, the latter override button is the preferred option. The preferred behavior for occupant interaction with the control system should be documented in design and given to the operator. A detailed sequence of operations written for DOE/NREL’s Research Support Facility’s (RSF’s) lighting system was used as a commissioning guide and to create occupant training presentations and documents (NREL 2013).
Occupant-driven demand response
Demand response is not a building system per se; rather, it is a design consideration that needs a well-documented sequence of operations to be smoothly implemented in operations. The building control system likely sheds at least 10% of the load automatically during demand response events (USGBC 2013), but deeper energy demand reduction occurs when occupants are encouraged or incentivized to manually reduce lighting use or shift the use of PPLs to battery power or use at another time.
The expected action of the occupants for each system should be documented. The documentation will serve as:
§ A reference for operators to compare system use over time to the original design intent. If a system’s intended use by occupants is highly critical to meeting the building’s annual or peak demand energy target, the system may be a good candidate for inclusion in a workspace competition or incentive program.
§ A basis for occupant engagement tactics such as initial move-in training, or ongoing reminders about preferred behavior. These tactics are discussed in the following sections.
An HPB design that involves occupants in the daily operating
30 CHAPTER 5—OCCUPANT ENGAGEMENT

plan will need a way to enable a conversation between “the building” and the occupant. The conversation should be two-way as described in the following sections. Such a system is likely to be part of the building automation and control system and should therefore be considered, and developed or procured prior to turnover.
The communication, informed by the written sequence of operations provided by the design team, must alert for ongoing communication to occupants about when to turn off lights, use specific lighting scenes, open or close windows, or participate in demand response events. The communication could take the form of an electronic notification, an indicator light near the light switch or window, or an established communication channel.
Just as operators or “the building” should be able to provide information to occupants about expected behavior, occupants should be able to relay feedback to operators about comfort or control system issues. NREL’s approach to comfort feedback is to use a software application that accepts occupant comfort reports and plots the information on a plan for use by the operator, as shown in Figure 5-1. A more typical ticketing system is also used, but the additional layer of information contributes to a proactive building management approach and the ability to compare actual operating comfort to the expectation set by the initial design criteria.
The communication system should be initiated before or immediately after turnover. Ensure that sufficient human resources and capital are planned to make the transition between design intent and a functioning notification system. This recommendation may seem trivial, but occupant
Figure 5-1. NREL’s formal occupant-operator communication systemLeft: Webpage for operator to view comfort reports and feedback from the occupants. This information can be used to make decisions about system change requests or operations issues. Inset: Software application for occupants to report comfort information to the operator. Figure 5-2. Snapshot of GSA’s occupant move-in and training guide,
example
s u s t a i n a b l ep r e s e r v a t i o nthe wayne n. aspinall federal building and u.s. courthouse modernization project net zero goal sustainability leed platinum target contemporary design impact collaboration participation plan-ning engagement energy consumption shared success the wayne n. aspinall federal building and u.s. courthouse sustainable preservation modernization project net zero goal sustainabil-ity leed platinum target contemporary design impact collaboration participation planning en-gagement energy consumption shared success the wayne n. aspinall federal building and u.s. courthouse modernization project net zero goal sustainability leed platinum target contempo-rary design impact collaboration participation planning engagement energy consumption shared success modernization project net zero goal sustainability leed platinum contemporary design
Wayne N. Aspinall Federal Building and U.S. Courthouse
GSA Rocky Mountain Region
welcome toyour updated workplaceWe are thrilled to welcome you to your modernized work place. We’d like to thank you for your patience
and diligence during this project. This modernization not only preserved an anchor in the Grand Junction
community, but also converted it into one of the most energy efficient and sustainable buildings in the
country. So we think you’ll agree, it was worth the wait. Additionally, we’d like to share some important
information about the building’s technology, energy goals and usage guidance.
The Wayne N. Aspinall Federal Building and U.S. Courthouse has the potential to become:
• The first net zero office building for every agency housed at the federal building.
• The first net zero building listed on the National Register of Historic Places.
• The first LEED Platinum building in the nation for almost every one of the nine agencies.
You will play a crucial role in making all of these incredible goals a reality. The Wayne N. Aspinall Federal
Building and U.S. Courthouse project has become one of the most visible federal building projects in the
country. If it reaches its goal of net zero, it will truly be because of how you’ve managed your own energy
consumption and developed innovative ways to further reduce the building’s energy use.
This document serves as a guide on how to effectively use the tools provided to you as part of this proj-
ect. What we’re trying to accomplish has never been done in a building like this, so we’re creating the
roadmap to net zero. If you have ideas on how to better manage our energy use, want to share ways your
agency has reduced its energy consumption, or have questions, please feel free to contact the building
contacts listed in the back of this guide. working togetherto achieve net zeropurchasing Decisions regarding the equipment you purchase for your space can help reduce energy
loads in the building. For example, choosing Energy Star® rated equipment can provide substantial en-
ergy savings. Energy Star® computers can power down into deep sleep modes and Energy Star copiers
are 40% more efficient, run cooler, and last longer.
• Buy energy efficient equipment: Look for Energy Star®/EPEAT equipment.
• Choose a laptop instead of a desktop: Laptops can save up to 90% in electricity use
compared to desktop computers.
• Upgrade CRT monitors to LCD: Save energy by buying a flat screen monitor for your
desktop. An LCD monitor uses roughly 40% less power than a CRT.
• Replace old refrigerators and microwaves: New refrigerators on average use about half
of the energy of models sold from 1990. Personal refrigerators, coffee makers and microwaves
are not allowed in areas that are not designated as kitchens or kitchenettes.
standby power “Vampire energy” or “phantom power” is the energy used by some electronic devices
that are turned off but still plugged into an outlet. This energy accounts for more than 100 billion kilowatt
hours of annual U.S. electricity consumption. Smart plug strips and load shedding outlets will help to
manage these types of energy draw, however there are more things you can do.
• Unplug: Simply unplug items you don’t use very often.
• Use a smart plug strip: As described in the previous section, efficient use of the smart plug
strips will combat standby power draw.
thermal comfort Saving energy doesn’t have to mean sacrificing comfort. There are a variety of ways
to ensure that you are comfortable within your space.
• Use sunlight wisely: Block direct sunlight by drawing the roller shades at your windows. In
colder weather, leave the shades open on sunny days and draw the shades at night to help reduce
heat loss. In the summer, close the shades during the day to reduce heat gain.
• Dress for the season: If your organization’s dress code allows, wear weather appropriate
clothing such as short sleeve dress shirts in the summer and a sweater in the winter.
• Feel the breeze: Although large fans are not allowed in spaces by GSA’s “fire safety guidance
for appliances”, small desktop fans can be plugged into a shedding receptacle on your plug strip.
In addition, many of these desktop fans are battery or solar powered which further reduces our
energy demands.
• Control your space: The zoned mechanical system is run on thermostats located within your
space. You will be able to adjust the temperature on those devices within three degrees of the set
point. The mechanical system is set on a time schedule and occupancy. If you work late or on a
weekend, that unit will turn on and stay on as long as you are working in that area.
• Net Zero Advocates: The building manager will be able to answer questions for you; you can
also enlist an office member to be a Net Zero Advocate. Allow this person to help others by
reminding them to turn lights and equipment off when not in use, answer questions about the
devices in your space, and rally your team to reduce your use.
• Friendly competition: Let’s face it, this building is small and we know everyone who works
here. The interactive energy dashboard located in the lobby has a screen devoted to energy use
by agency. The dashboard will show each agency’s energy use based on square feet of office so
the playing field has been leveled. Let’s see who can use the least amount of energy each month!
• Be innovative: A goal of net zero has never been accomplished before in a federal office
building or a building on the National Register of Historic Places. This is the time for innovation.
If you have ideas to further reduce energy use, implement them in your office and share your success
stories with the rest of us. When the accomplishment is realized, it will be because of you!
get involved
31CHAPTER 5—OCCUPANT ENGAGEMENT
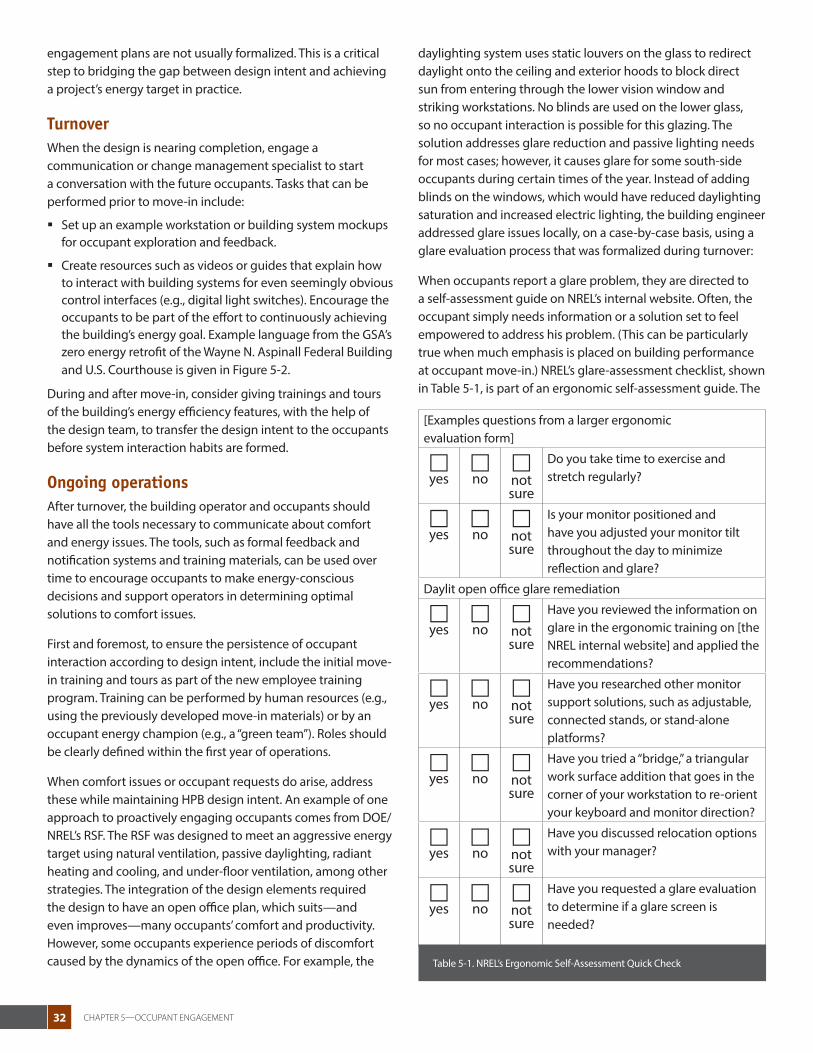
engagement plans are not usually formalized. This is a critical step to bridging the gap between design intent and achieving a project’s energy target in practice.
Turnover When the design is nearing completion, engage a communication or change management specialist to start a conversation with the future occupants. Tasks that can be performed prior to move-in include:
§ Set up an example workstation or building system mockups for occupant exploration and feedback.
§ Create resources such as videos or guides that explain how to interact with building systems for even seemingly obvious control interfaces (e.g., digital light switches). Encourage the occupants to be part of the effort to continuously achieving the building’s energy goal. Example language from the GSA’s zero energy retrofit of the Wayne N. Aspinall Federal Building and U.S. Courthouse is given in Figure 5-2.
During and after move-in, consider giving trainings and tours of the building’s energy efficiency features, with the help of the design team, to transfer the design intent to the occupants before system interaction habits are formed.
Ongoing operations After turnover, the building operator and occupants should have all the tools necessary to communicate about comfort and energy issues. The tools, such as formal feedback and notification systems and training materials, can be used over time to encourage occupants to make energy-conscious decisions and support operators in determining optimal solutions to comfort issues.
First and foremost, to ensure the persistence of occupant interaction according to design intent, include the initial move-in training and tours as part of the new employee training program. Training can be performed by human resources (e.g., using the previously developed move-in materials) or by an occupant energy champion (e.g., a “green team”). Roles should be clearly defined within the first year of operations.
When comfort issues or occupant requests do arise, address these while maintaining HPB design intent. An example of one approach to proactively engaging occupants comes from DOE/NREL’s RSF. The RSF was designed to meet an aggressive energy target using natural ventilation, passive daylighting, radiant heating and cooling, and under-floor ventilation, among other strategies. The integration of the design elements required the design to have an open office plan, which suits—and even improves—many occupants’ comfort and productivity. However, some occupants experience periods of discomfort caused by the dynamics of the open office. For example, the
daylighting system uses static louvers on the glass to redirect daylight onto the ceiling and exterior hoods to block direct sun from entering through the lower vision window and striking workstations. No blinds are used on the lower glass, so no occupant interaction is possible for this glazing. The solution addresses glare reduction and passive lighting needs for most cases; however, it causes glare for some south-side occupants during certain times of the year. Instead of adding blinds on the windows, which would have reduced daylighting saturation and increased electric lighting, the building engineer addressed glare issues locally, on a case-by-case basis, using a glare evaluation process that was formalized during turnover:
When occupants report a glare problem, they are directed to a self-assessment guide on NREL’s internal website. Often, the occupant simply needs information or a solution set to feel empowered to address his problem. (This can be particularly true when much emphasis is placed on building performance at occupant move-in.) NREL’s glare-assessment checklist, shown in Table 5-1, is part of an ergonomic self-assessment guide. The
[Examples questions from a larger ergonomic evaluation form]
£yes
£no
£not sure
Do you take time to exercise and stretch regularly?
£yes
£no
£not sure
Is your monitor positioned and have you adjusted your monitor tilt throughout the day to minimize reflection and glare?
Daylit open office glare remediation
£yes
£no
£not sure
Have you reviewed the information on glare in the ergonomic training on [the NREL internal website] and applied the recommendations?
£yes
£no
£not sure
Have you researched other monitor support solutions, such as adjustable, connected stands, or stand-alone platforms?
£yes
£no
£not sure
Have you tried a “bridge,” a triangular work surface addition that goes in the corner of your workstation to re-orient your keyboard and monitor direction?
£yes
£no
£not sure
Have you discussed relocation options with your manager?
£yes
£no
£not sure
Have you requested a glare evaluation to determine if a glare screen is needed?
Table 5-1. NREL’s Ergonomic Self-Assessment Quick Check
32 CHAPTER 5—OCCUPANT ENGAGEMENT

glare remediation checklist directs the occupant to information about daylighting system intent and glare control options. The checklist also suggests adjusting workstation configuration and relocating to another workstation (the typical daylight contribution varies from workstation to workstation and so occupants can be assigned to a space that best meets their tolerance and need for light) with the help of a personnel manager. Once these options have been explored, the building engineer or operator engages with the occupant to investigate building or system changes, which is termed “glare evaluation.” During the glare evaluation, the occupant and operator work together to find a solution that addresses the concern without simply adding blinds to an area or disabling daylighting control. A common solution used in the RSF is a glare screen, shown in Figure 5-3. These screens are used to block low angle, direct sun in the early morning or late afternoon for occupants who sit at the south perimeter.
In the bigger picture of building operations, a checklist such as the one used for glare at NREL engages occupants by giving them a process to follow and solutions for addressing comfort issues that also align with design intent. Because occupant comfort is a primary goal (along with energy efficiency) of any HPB, operators can consider system changes, but these should be executed only after exploring other options. The operator should use a considered approach that allows occupants to opt-in to design options (e.g., NREL’s glare screens) that can decrease energy performance versus making those options the standard (e.g., providing a glare screen to all occupants at move-in).
How do these considerations differ from current practice?True high performance in buildings necessitates proactive occupant interaction, in contrast to the more customary patterns of isolating occupants from building control and responding to complaints by tweaking building systems without considering other alternatives first. Designing occupants into the building control systems, and setting up an infrastructure for considered communication and action by the building operator and occupants can help ensure aggressive energy performance targets are met. This results in occupant acceptance, productivity, and well-being.
SUMMARY
What are the key actions to engaging occupants? 1. Assess occupant preferences and patterns.
2. Require the design team to provide a written sequence of operations for all HPB systems; turn the sequence into training materials for occupants.
3. Develop a formal communication system for operators and occupants.
a. Remind occupants about preferred behavior.
b. Accept and respond to feedback about occupant comfort.
4. Prepare occupants for move-in using trainings, tours, and mockups.
5. Proactively engage occupants to support the energy target using:
a. Ongoing training
b. A case-by-case review of requests for building system changes.
Who must be involved in this process?
� Occupants
� Communications representatives
� Facility manager and/or building engineer
� Energy manager
� Information technology services.
Figure 5-3. NREL’s daylighting solution and result of occupant engagement process Left: NREL’s previous solution: manual blinds and lights onMiddle: NREL’s RSF solution: no blinds on the lower glass but some hours of direct sunRight: Occupant engagement process result: glare screens used only where and when needed
33CHAPTER 5—OCCUPANT ENGAGEMENT

ASHRAE. (2005). “The Commissioning Process (ASHRAE Guideline 0-2005).” Atlanta, GA: American Society of Heating, Refrigerating and Air-Conditioning Engineers.
ASHRAE. (2002). “Measurement of Energy and Demand Savings (ASHRAE Guideline 14-2002.” Atlanta, GA: American Society of Heating, Refrigerating and Air-Conditioning Engineers.
Brown, K.; Anderson, M.; Harris, J. (2006). “How Monitoring-Based Commissioning Contributes to Energy Efficiency in Commercial Buildings.” Accessed November 8, 2013: http://uc-ciee.org/downloads/MBCx_ACEEE_2006_revised_9jan07.pdf.
Brown, K.; Daly, A.; Elliott, J.; Higgins, C.; Granderson, J. (2010). “Hitting the Whole Target: Setting and Achieving Goals for Deep Efficiency Buildings.” In Proceedings of the 2010 Summer Study on Energy Efficiency in Buildings 3: 28-39. Accessed September 10, 2014: www.aceee.org/files/proceedings/2010/start.htm.
Clark, L. (2013). “Committed to Commissioning.” Heating/Piping/Air Conditioning (HPAC) Engineering.” Accessed November 5, 2013: http://hpac.com/blog/committed-commissioning.
Diamond, R.; Opitz, M.; Hicks, T.; Von Neida, B.; Herrera, S. (2006). “Evaluating the Energy Performance of the First Generation of LEED-Certified Commercial Buildings.” In Proceedings of the 2006 ACEEE Summer Study on Energy Efficiency in Buildings 3: 41-52. Accessed September 10, 2014: http://aceee.org/files/proceedings/2006/data/papers/SS06_Panel3_Paper04.pdf.
DOE (2010). 2010 Buildings Energy Data Book. Washington, DC: U.S. Department of Energy, Office of Energy Efficiency and Renewable Energy. http://buildingsdatabook.eren.doe.gov.
Efficiency Valuation Organization (2014). “International Performance Measurement and Verification Protocol (IPMVP): Core Concepts, 2014.” Accessed September 10, 2014: www.evo-world.org.
Efficiency Valuation Organization (2012). “International Performance Measurement and Verification Protocol (IPMVP): Concepts and Options for Determining Energy and Water Savings Volume 1. 2012.” Accessed September 10, 2014: www.evo-world.org.
Elliott, J.; Brown, K. (2010). “Not Too Fast, Not Too Slow: A Sustainable University Campus Community Sets an Achievable Trajectory toward Zero Net Energy.” In Proceedings of the 2010 ACEEE Summer Study on Energy Efficiency in Buildings 11: 76-87. Accessed September 10, 2014: http://aceee.org/files/proceedings/2010/data/papers/2281.pdf.
Granderson, J. (2013). “Energy Management Information Systems (EMIS): Technology Classification Framework.” Report prepared for DOE. Accessed September 10, 2014: http://www4.eere.energy.gov/alliance/sites/default/files/uploaded-files/emis-technology-classification-framework.pdf.
Granderson, J.; Lin, G.; Piette, M.A. (2013). Energy Information Systems: Technology Costs, Benefit, and Best Practice Uses. Accessed
September 10, 2014: http://eetd.lbl.gov/sites/all/files/6476e.pdf.
Granderson, J.; Piette, M.A.; Ghatikar, G. (2010). “Building Energy Information Systems: User Case Studies.” Energy Efficiency. DOI 10.1007/s12053-010-9084-4LBNL-6476E. Accessed September 10, 2014: http://eis.lbl.gov/pubs/beis-case-studies.pdf.
Harris, D.; Higgins, C. (2013). Methodology for Reporting Commercial Office Plug Load Energy Use: Establishing Common Reporting Metrics for the Energy Use of Plug Load Equipment and Aggregated Office Spaces To Support Energy Modeling, Benchmarking, and the Evaluation of Plug Load Measures. New Buildings Institute. Accessed September 10, 2014: http://assets.fiercemarkets.com/public/sites/energy/reports/PlugLoadMetricsReportingGuide_CaseStudy.pdf.
International Standards Organization. (2011). “ISO 50001: Energy Management Systems - Requirements With Guidance for Use.” Accessed September 10, 2014: www.iso.org/iso/home/standards/management-standards/iso50001.htm.
Leach, M.; Bonnema, E.; Pless, S. (2012). “Setting Whole Building Absolute Energy Use Targets for the K-12 School, Retail, and Healthcare Sectors.” Preprint. Presented at ACEEE Summer Study on Energy Efficiency in Buildings, Pacific Grove, California August 12–17, 2012. NREL CP-5500-55131. Golden, CO: National Renewable Energy Laboratory. Accessed September 10, 2014: www.nrel.gov/docs/fy12osti/55131.pdf.
Lobato, C.; Pless, S.; Sheppy, M. (2011). “Reducing Plug and Process Loads for a Large Scale, Low Energy Office Building: NREL’s Research Support Facility.” Presented at the ASHRAE Winter Conference, Las Vegas, Nevada January 29 – February 2, 2011. NREL/CP-5500-49002. Golden, CO: National Renewable Energy Laboratory. Accessed September 10, 2014: www.nrel.gov/docs/fy11osti/49002.pdf.
Long, N.; Scheib, J.; Pless, S.; Schott, M. (2013). “Using Models to Provide Predicted Ranges for Building-Human Interfaces.” Presented at the 2013 Building Simulation Conference, Chambéry, France, August 25–28, 2013. NREL CP-5500-58521. Golden, CO: National Renewable Energy Laboratory. Accessed September 10, 2014: www.nrel.gov/docs/fy13osti/58521.pdf.
McKenney, K.; Guernsey, M.; Ponoum, R.; Rosenfeld, J. (2010). Commercial Miscellaneous Electric Loads: Energy Consumption Characterization and Savings Potential in 2008 by Building Type. Lexington, MA: TIAX LLC. May. Accessed September 10, 2014: http://zeroenergycbc.org/pdf/2010-05-26 TIAX CMELs Final Report.pdf.
Mills, E. (2011). “Building Commissioning: A Golden Opportunity for Reducing Energy Costs and Greenhouse Gas Emissions in the United States.” Energy Efficiency 2011 (4): 145–173.
Mills, E.; Mathew, P. (2009). “Monitoring-Based Commissioning: Benchmarking Analysis of 24 UC/CSU/IOU Projects.” Berkeley, CA: Lawrence Berkeley National Laboratory. Accessed September 10, 2014: http://escholarship.org/uc/item/06t5w9mg.
New Buildings Institute. (2013). “PIER Research Results (Evidence-
REFERENCES AND RESOURCES
34 REFERENCES AND RESOURCES

Based Design and Operations).” Accessed November 5, 2013: http://newbuildings.org/PIER-Research.
New Buildings Institute. (2011). “Sensitivity Analysis: Comparing the Impact of Design, Operation, and Tenant Behavior on Building Energy Performance.” Accessed September 9, 2014: http://newbuildings.org/sites/default/files/SensitivityAnalysisReport.pdf.
New Buildings Institute. (2008). “Energy Performance of LEED for New Construction Buildings.” Accessed September 9, 2014: http://newbuildings.org/sites/default/files/Energy_Performance_of_LEED-NC_Buildings-Final_3-4-08b.pdf.
National Renewable Energy Laboratory (2014). “How-To Guide for Energy-Performance-Based Procurement: An Integrated Approach for Whole Building High Performance Specifications in Commercial Buildings.” Accessed September 9, 2014: http://apps1.eere.energy.gov/buildings/publications/pdfs/rsf/performance_based_how_to_guide.pdf.
National Renewable Energy Laboratory (2013). “NREL Research Support Facility (RSF) Energy Efficiency Manual.” Accessed September 9, 2014: https://buildingdata.energy.gov/cbrd/resource/679.
Scheib, J.; Pless, S.; Torcellini, P. (2006). “An Energy-Performance-Based Design-Build Process: Strategies for Procuring High-Performance Buildings on Typical Construction Budgets.” Preprint. Presented at ACEEE Summer Study on Energy Efficiency in Buildings, Pacific Grove, California August 17–22, 2014. NREL/CP-5500-61571. Golden, CO: National Renewable Energy Laboratory. Accessed September 10, 2014: www.nrel.gov/docs/fy14osti/61571.pdf.
Sullivan, G.P.; Hunt, W.D.; Pugh, R.; Sandusky, W.F.; Koehler, T.M.; Boyd, B.K. (2011). Metering Best Practices: A Guide to Achieving Utility Resource Efficiency. Washington, D.C: U.S. Department of Energy. Accessed September 10, 2014: http://www1.eere.energy.gov/femp/pdfs/mbpg.pdf.
The U.S. Department of Energy and the Pacific Northwest National Laboratory. (2013) “Re-tuning Commercial Buildings.” Accessed November 5, 2013: http://buildingretuning.pnnl.gov.
Torcellini, P.; Pless, S.; Deru, M.; Crawley, D. (2006). “Zero Energy Buildings: A Critical Look at the Definition.” Preprint. NREL/CP-550-39833. Golden, CO: National Renewable Energy Laboratory.
Torcellini P.; Pless, S.; Deru, M.; Griffith, B.; Long, N.; Judkoff, R. (2006). Lessons Learned from Case Studies of Six High-Performance Buildings. NREL TP-550-37542. Golden, CO: National Renewable Energy Laboratory. Accessed September 10, 2014: www.nrel.gov/docs/fy06osti/37542.pdf.
U.S. Green Building Council. (2013). “LEED for New Construction and Major Renovations v4.” Accessed September 9, 2014: www.usgbc.org/leed/v4.
Whole Building Design Guide. (2012). “Building Commissioning.” Accessed November 5, 2013: www.wbdg.org/project/buildingcomm.php.
Yudelson, J.; Meyer, U. (2013). The World’s Greenest Buildings, Routledge Publishers, New York, NY, pp.17–20.
35REFERENCES AND RESOURCES
National Renewable Energy Laboratory 15013 Denver West Parkway, Golden, CO 80401 303-275-3000 • www.nrel.gov
NREL is a national laboratory of the U.S. Department of Energy Office of Energy Efficiency and Renewable Energy Operated by the Alliance for Sustainable Energy, LLC
NREL/BR-5500-62530 • March 2015
NREL prints on paper that contains recycled content.
Cover photo by Dennis Schroeder, NREL 17408
REALIZING HIGH-PERFORMANCE BUILDINGSHow To Maintain Energy-Efficient Design Intent During Building Operation
A guide written for owners and operators of high-performance buildings, based on the experience of field successes in the United States