reasonable defense appendix: us military end strength ... · end strength, deployment, force...
TRANSCRIPT
PROJECT ON DEFENSE ALTERNATIVESCOMMONWEALTH INSTITUTE, CAMBRIDGE, MASSACHUSETTS
PDA
Reasonable Defense - AppendixEnd Strength, Deployment, Force Structure,and Budget Tables Carl Conetta
14 NOVEMBER 2012Updated 30/12/12

Reasonable DefenseA Sustainable Approach to Securing the Nation
Appendix: End Strength, Deployment, Force Structure, and Budget Tables
Carl Conetta14 November 2012
INDEX
A1. Personnel . . . . . . . . . . . . . . . . . . . . . . . . . . . . . . . . . . . . . . . . . . . . . . . . . . . . . . . . 1
A1.1 – Active-component military personnel . . . . . . . . . . . . . . . . . . . . . . . . . . . . . . 1
A1.2 – Reserve-component military personnel . . . . . . . . . . . . . . . . . . . . . . . . . . . . 1
A1.3 – Allocation of Personnel to Operating Forces and Infrastructure . . . . . . . . . . 2
A1.4 – Active Personnel Routinely Stationed Overseas during Peacetime . . . . . . . 2
A2. Force Structure . . . . . . . . . . . . . . . . . . . . . . . . . . . . . . . . . . . . . . . . . . . . . . . . . . . . 3
A2.1 – US Nuclear Forces . . . . . . . . . . . . . . . . . . . . . . . . . . . . . . . . . . . . . . . . . . . 3
A2.2 – US Air Power . . . . . . . . . . . . . . . . . . . . . . . . . . . . . . . . . . . . . . . . . . . . . . . . 3
A2.3 – US Sea Power . . . . . . . . . . . . . . . . . . . . . . . . . . . . . . . . . . . . . . . . . . . . . . . 4
A2.4 – US Marine Corps . . . . . . . . . . . . . . . . . . . . . . . . . . . . . . . . . . . . . . . . . . . . . 4
A2.4 – US Army . . . . . . . . . . . . . . . . . . . . . . . . . . . . . . . . . . . . . . . . . . . . . . . . . . . 5
A3. Budget Tables . . . . . . . . . . . . . . . . . . . . . . . . . . . . . . . . . . . . . . . . . . . . . . . . . . . . . 6
A3.1 – Comparison of DoD Base Budget Options for 2012-2022 (current dollars) . 6
A3.2 – Comparison of DoD Base Budget Options for 2012-2022 (2012 dollars) . . . 6
A3.3 – DoD Base Budget (non-war) 2001-2022 in Constant 2012 Dollars . . . . . . . 7
A3.4 – Budget Authority 2013-2022 by Appropriation Title, DoD vs. RD Model . . . . 8
A3.5 – Alternative Future-Years Defense Plans by Appropriation Title . . . . . . . . . . 8
A3.5.1 – DoD FY-2012 10-year Plan (billions of dollars) . . . . . . . . . . . . . . . . . . . . . 8
A3.5.2 – DoD FY-2013 10-year Plan (billions of dollars) . . . . . . . . . . . . . . . . . . . . . 9
A3.5.3 – Reasonable Defense 10-year Plan (billions of dollars) . . . . . . . . . . . . . . . 9
A3.6 – Future “Steady State” Budget, DoD Plan vs. Reasonable Defense . . . . . . 10
Page 1
A1. PERSONNEL
A1.1 Active-component military personnel
A1.2 Reserve-component military personnel
A1.3 Allocation of Personnel to Operating Forces and Infrastructure
A1.4 Active Personnel Routinely Stationed Overseas during Peacetime
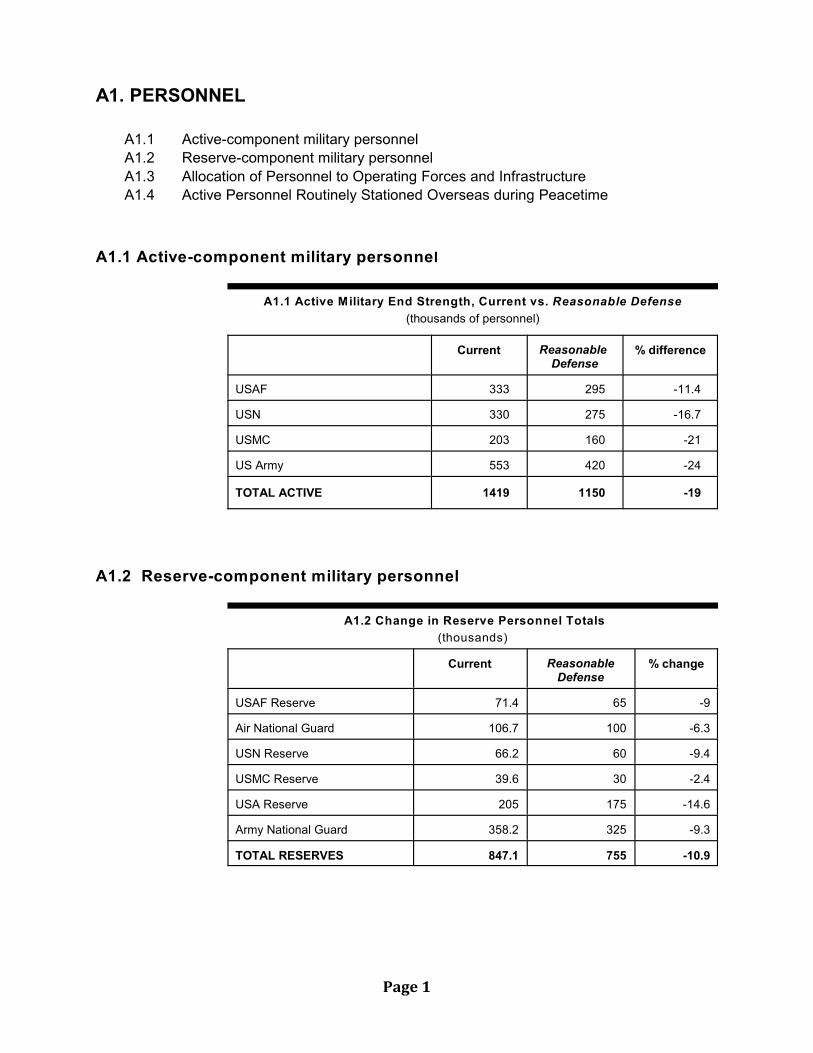
A1.1 Active-component military personnel
A1.1 Active Military End Strength, Current vs. Reasonable Defense
(thousands of personnel)
Current Reasonable Defense
% difference
USAF 333 295 -11.4
USN 330 275 -16.7
USMC 203 160 -21
US Army 553 420 -24
TOTAL ACTIVE 1419 1150 -19
A1.2 Reserve-component military personnel
A1.2 Change in Reserve Personnel Totals
(thousands)
Current ReasonableDefense
% change
USAF Reserve 71.4 65 -9
Air National Guard 106.7 100 -6.3
USN Reserve 66.2 60 -9.4
USMC Reserve 39.6 30 -2.4
USA Reserve 205 175 -14.6
Army National Guard 358.2 325 -9.3
TOTAL RESERVES 847.1 755 -10.9

Page 2
A1.3 Allocation of Personnel to Operating Forces and Infrastructure
A1.3 Reasonable Defense Active Component Personnel
Operating Forces vs. Infrastructure Assignment
Current Reasonable
Defense
%
Change
USAF 333 295 -11.4
Op Forces 207 190 -8.2
Infrastructure 126 105 -16.7
USN 330 275 -16.7
Op Forces 179 155 -13.4
Infrastructure 151 120 -9.2
USMC 203 160 -21.2
Op Forces 139.5 115 -17.5
Infrastructure 63.5 45 -29
USA 553 420 -24
Op Forces 402 310 -22.9
Infrastructure 151 110 -27
TOTAL 1419 1150 -19
Op Forces 927.5 770 -17
Infrastructure 491.5 380 -22.7
A1.4 Active Personnel Routinely Stationed Overseas during Peacetime
A1.4 Future US Military Personnel Deployed Abroad
(Excluding Contingency Operations)
Planned 2016(est.)
ReasonableDefense 2016
RD as % ofDoD Plan
Europe 70000 30000 43%
Asia 85,000+ 65000 76%
Central Command area 30,000+ ~ 15,000 50%
Other 5,000+ < 5,000 90%
TOTAL 190,000+ ~ 115,000 ~60%
Page 3
A2. FORCE STRUCTURE
A2.1 US Nuclear Forces
A2.2 US Air Power
A2.3 US Sea Power
A2.4 US Marine Corps
A2.4 US Army
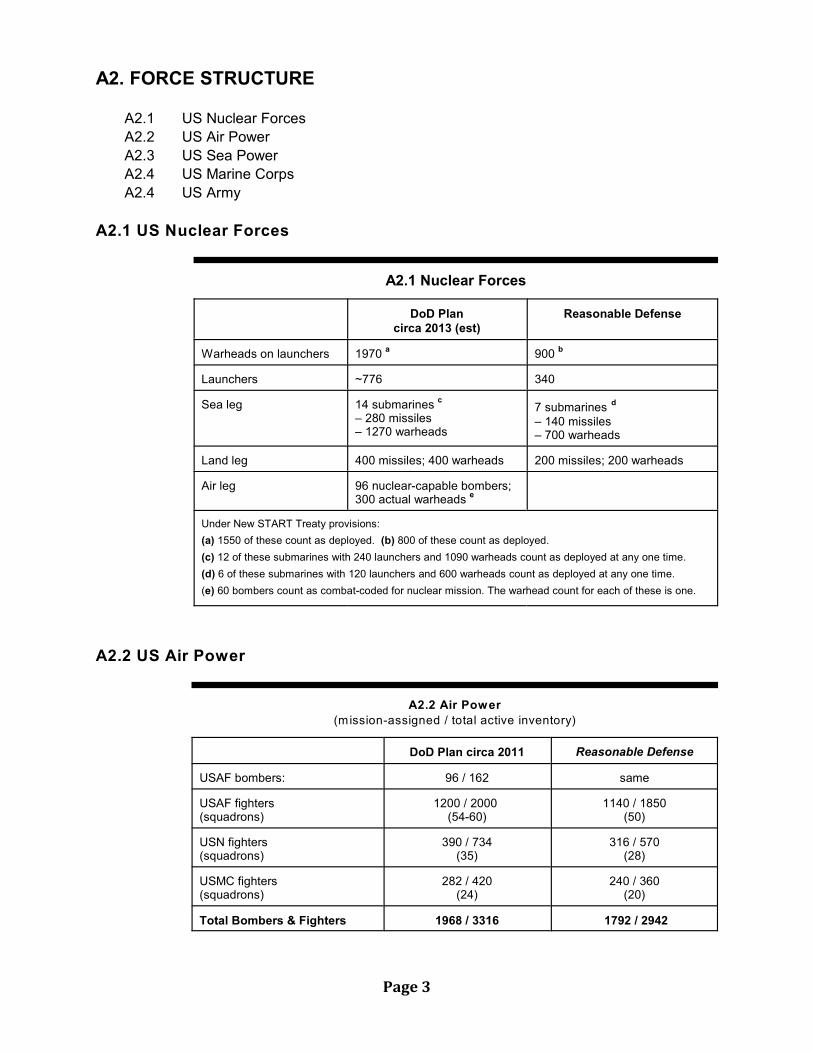
A2.1 US Nuclear Forces
A2.1 Nuclear Forces
DoD Plancirca 2013 (est)
Reasonable Defense
Warheads on launchers 1970 900 a b
Launchers ~776 340
Sea leg 14 submarines c
– 280 missiles– 1270 warheads
7 submarines d
– 140 missiles– 700 warheads
Land leg 400 missiles; 400 warheads 200 missiles; 200 warheads
Air leg 96 nuclear-capable bombers;300 actual warheads
e
Under New START Treaty provisions:
(a) 1550 of these count as deployed. (b) 800 of these count as deployed.
(c) 12 of these submarines with 240 launchers and 1090 warheads count as deployed at any one time.
(d) 6 of these submarines with 120 launchers and 600 warheads count as deployed at any one time.
(e) 60 bombers count as combat-coded for nuclear mission. The warhead count for each of these is one.
A2.2 US Air Power
A2.2 Air Power
(mission-assigned / total active inventory)
DoD Plan circa 2011 Reasonable Defense
USAF bombers: 96 / 162 same
USAF fighters (squadrons)
1200 / 2000 (54-60)
1140 / 1850(50)
USN fighters (squadrons)
390 / 734(35)
316 / 570(28)
USMC fighters(squadrons)
282 / 420(24)
240 / 360(20)
Total Bombers & Fighters 1968 / 3316 1792 / 2942

Page 4
A2.3 US Sea Power
A2.3 Sea Power
DoD Plan circa 2011 Reasonable Defense
Aircraft Carriers 11 9
Large Surface Combatants 84-88 72-74
Small Surface Combatants 28-42 28-33
Amphibious Warfare Ships 29-31 23-24
Command, support, and logistics ships 47-58 38-39
Ballistic Missile submarines 14 7
Guided Missile submarines 4 4-6
Attack Submarines 53-55 42
Total 290 (+/-) 230
A2.4 US Marine Corps
A2.4 Marine Corps
DoD Plan circa 2011 Reasonable Defense
Marine expeditionary forces 3 same
Marine Divisions 3 AC*, 1 RC* same
Marine expeditionary unit 7 5
Infantry Battalions 27 AC, 9 RC 18 AC, 6 RC
Other combat battalions: tank, lt. armor,amphibious assault, recon, artillery
21 AC, 7 RC 18 AC, 6 RC
Special Operations Battalions 3 same
Security Force Battalion 2300 marines same
Embassy Security Group 1000 marines same
Helicopter and tilt-rotor squadrons 36 30
Fixed-wing fighter squadrons 24 18 plus 4 ECM squadrons
Maritime Prepositioning Squadrons 3 with 16 ships same
Prepositioned stocks in Norway 1 0
Amphibious Ready Groups with 9 30-38 ships
7 23-24 ships
* AC: Active Component **RC: Reserve Component

Page 5
A2.5 US Army
US Army
DoD Plan circa 2011 Reasonable Defense
Corps HQs 4 3
Division HQs 18 12
Brigade Combat Teams 73 54
Infantry Brigade Teams (20 AC,* 20 RC**) (14 AC, 16 RC)
Stryker Brigade Teams (8 AC) (8 AC)
Heavy Brigade Teams (17 AC, 8 RC) (11 AC, 5 RC)
Combat Aviation Brigades 13 AC, 8 RC 11 AC, 7 RC
Artillery Brigades 6 AC, 7 RC 5 AC, 6 RC
Patriot battalions 15 same
Terminal High Altitude Area Defense batteries
7 5
* AC: Active Component **RC: Reserve Component

Page 6
A3. BUDGET TABLES
A3.1 Comparison of DoD Base Budget Options for 2012-2022 (billions of “then year”
dollars)
A3.2 Comparison of DoD Base Budget Options for 2012-2022 (billions of 2012 dollars)
A3.3 DoD Base Budget (non-war) 2001-2022 in Constant 2012 Dollars
A3.4 Total Budget Authority 2013-2022 by Appropriation Title, DoD Plans vs.
Reasonable Defense
A3.5 Alternative Future-Years Defense Plans by Appropriation Title
A3.5.1 DoD FY-2012 10-year Plan (billions of dollars)
A3.5.2 DoD FY-2013 10-year Plan (billions of dollars)
A3.5.3 Reasonable Defense 10-year Plan (billions of dollars)
A3.6 Future “Steady State” Base Budget by Appropriation Title, 2013 DoD Plan vs.
Reasonable Defense
A3.1 Comparison of DoD Base Budget Options for 2012-2022 (billions of “then year” dollars)
2013 2014 2015 2016 2017 2018 2019 2020 2021 2022
DoD FY-2012 Plan 570.7 586.4 598.2 610.6 621.6 632.8 644.1 655.7 667.5 681.6
DoD FY-2013 Plan 525.4 533.6 545.9 555.9 567.3 579.3 592.4 605.4 617.9 634.2
Reasonable Defense 512.6 508 505 504 500 510 520.5 531.7 543.9 554
A3.2 Comparison of DoD Base Budget Options for 2012-2022 (billions of 2012 dollars)
2013 2014 2015 2016 2017 2018 2019 2020 2021 2022
DoD FY-2012 Plan 561.2 566.9 568.7 570.2 569.6 569.1 568.2 568 567.4 568.5
DoD FY-2013 Plan 516.7 515.9 519 519.2 519.9 521 522.8 524.4 525.2 529
Reasonable Defense 504 491.2 480.1 470.7 458.2 458.7 459.4 460.5 462.3 462.1
Page 7
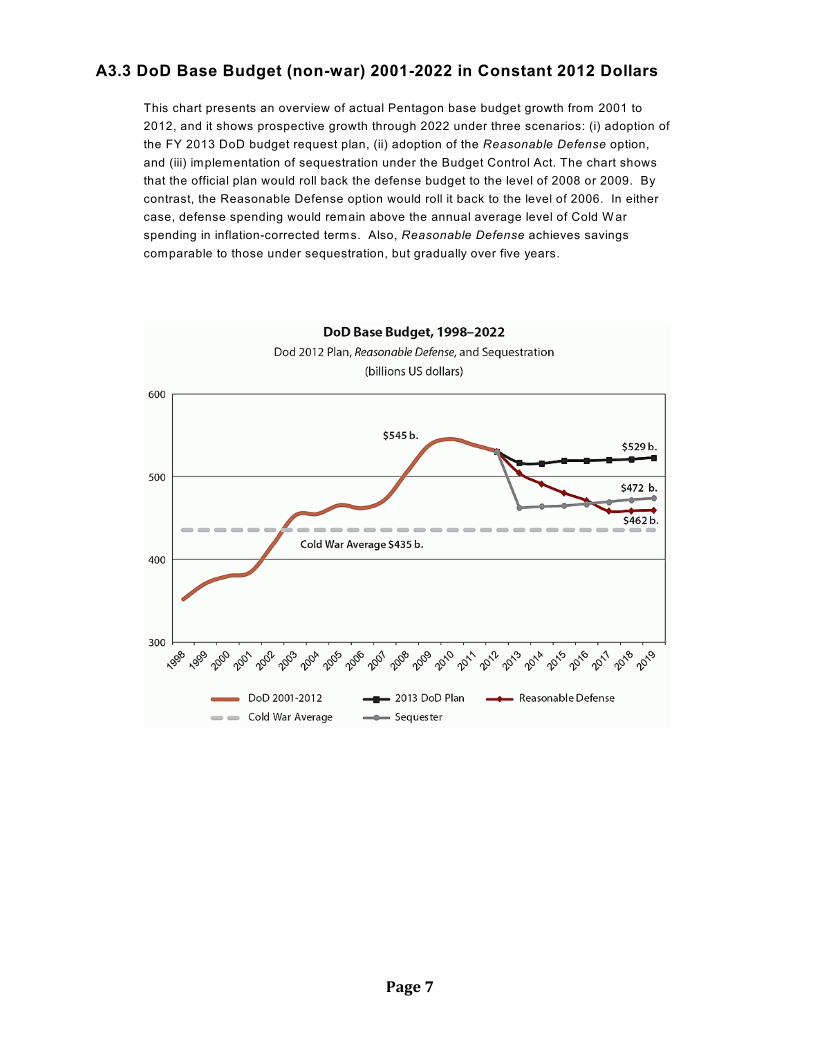
A3.3 DoD Base Budget (non-war) 2001-2022 in Constant 2012 Dollars
This chart presents an overview of actual Pentagon base budget growth from 2001 to
2012, and it shows prospective growth through 2022 under three scenarios: (i) adoption of
the FY 2013 DoD budget request plan, (ii) adoption of the Reasonable Defense option,
and (iii) implementation of sequestration under the Budget Control Act. The chart shows
that the official plan would roll back the defense budget to the level of 2008 or 2009. By
contrast, the Reasonable Defense option would roll it back to the level of 2006. In either
case, defense spending would remain above the annual average level of Cold W ar
spending in inflation-corrected terms. Also, Reasonable Defense achieves savings
comparable to those under sequestration, but gradually over five years.

Page 8
A3.4 Total Budget Authority 2013-2022 by Appropriation Title, DoD Plans vs. Reasonable Defense
Total Expenditures 2013-2022
(billions of dollars)
DoD
2012 Plan
DoD
2013 Plan
Reasonable
Defense
RD vs.
2012 plan
RD vs.
2013 plan
Military personnel 1604.2 1469.3 1417 -11.7 -3.6
Operation and maintenance 2379.3 2271.1 2006 -15.7 -11.7
Procurement 1384.3 1206.4 1038 -25 -14
R&D 732.2 692.8 618 -15.6 -10.8
Military construction 137.3 90.9 78.9 -42.6 -13.3
Family housing 17 16.7 15.3 -9 -8.4
Revolving, management, trust funds & other 14.8 10.3 16.5 +11.5 +60
TOTAL 6269.1 5757.5 5203.7 -17 -9.6
A3.5 Alternative Future-Years Defense Plans, Annual Breakout by Appropriation Title
A3.5.1 DoD FY-2012 10-year Plan (billions of dollars)
2012 2013 2014 2015 2016 2017 2018 2019 2020 2021
Mil Personnel 142.8 145.4 149.6 152.6 154.7 158.1 161.5 165.1 168.7 172.5
O&M 204.4 215.0 221.2 228.9 233.2 236.7 240.3 245.0 248.7 252.5
Procurement 113.0 117.6 125.9 129.8 137.2 139.8 142.4 143.9 146.5 149.1
R&D 75.3 75.7 73.5 71.0 69.3 70.5 71.8 73.1 74.4 75.7
Mil Construction 13.1 14.3 13.0 12.8 13.1 13.4 13.6 13.9 14.1 14.4
Family housing 1.7 1.5 1.5 1.6 1.7 1.7 1.7 1.8 1.8 1.8
Trusts & Funds 2.7 1.2 1.5 1.5 1.4 1.5 1.5 1.5 1.5 1.6
TOTAL 553.1 570.7 586.4 598.2 610.6 621.6 632.8 644.2 655.7 667.5

Page 9
A3.5.2 DoD FY-2013 10-year Plan (billions of dollars)
2012 2013 2014 2015 2016 2017 2018 2019 2020 2021 2022
Mil Personnel 141.8 135.1 136.4 138.4 141.0 144.0 147.5 151.1 154.7 158.4 162.8
O&M 197.2 208.8 209.9 212.8 219.2 224.4 228.6 234.5 239.4 243.6 249.9
Procurement 104.5 98.8 104.3 112.3 116.3 122.9 125.5 127.2 130.0 132.8 136.3
R&D 71.4 69.4 69.8 69.2 66.8 65.8 67.3 68.8 70.3 71.8 73.7
Mil Construction 11.4 9.6 10.2 11.0 9.3 8.0 8.2 8.4 8.5 8.7 8.9
Family housing 1.7 1.7 1.6 1.5 1.6 1.6 1.7 1.7 1.8 1.8 1.8
Trusts & Funds 2.6 2.1 1.4 0.8 1.6 0.7 0.7 0.7 0.7 0.8 0.8
TOTAL 530.6 525.4 533.6 545.9 555.9 567.3 579.3 592.4 605.4 617.9 634.2
A3.5.3 Reasonable Defense 10-year Plan (billions of dollars)
2012 2013 2014 2015 2016 2017 2018 2019 2020 2021 2022
Mil Personnel 141.8 142.0 141.0 139.0 137.0 135.0 138.0 141.0 144.0 148.0 152.0
O&M 197.2 204.0 200.0 198.0 196.0 192.0 195.0 199.0 203.0 208.0 211.0
Procurement 104.5 88.0 92.0 96.0 100.0 104.0 107.0 109.0 112.0 114.0 116.0
R&D 71.4 66.0 63.0 60.0 60.0 59.0 60.0 61.0 62.0 63.0 64.0
Mil Construction 11.4 9.0 9.0 9.0 8.0 7.0 7.0 7.2 7.4 7.6 7.7
Family housing 1.7 1.6 1.5 1.5 1.5 1.5 1.6 1.6 1.6 1.6 1.6
Trusts & Funds 2.6 2.0 1.5 1.5 1.6 1.6 1.6 1.7 1.7 1.7 1.7
TOTAL 530.6 512.6 508.0 505.0 504.0 500.0 510.0 520.5 531.7 543.9 554.0

Page 10
A3.6 Future “Steady State” Base Budget by Appropriation Title, 2013 DoD Plan vs. Reasonable Defense
Looking forward to 2023 and beyond, Table A3.6 estimates and compares the future “steady state” Defense Department base
budget in accord with two different trend lines: The official FY 2013 DoD “austerity” budget (submitted in February 2012) and the
Reasonable Defense alternative. In this case, the “steady state” represents the target or goal budget that attains once the current
process of retrenchment is complete. Further major change would depend on changes in defense goals, strategy, technology,
organization, or threat environment. Notably, the “steady state” budget is expressed in constant dollars (2012 USD). This reflects
the fact that the “steady state” incorporates routine growth due to inflation. Growth above inflation in military compensation levels –
pay and benefits (including health care) – would also force the “steady state” upwards. Apart from these factors, annual budgets
would fluctuate by a few percentage points around the steady-state average.
Future Steady State (billions 2012 dollars) 2013 DoD
“Austerity” Plan
Reasonable Defense RDef as % of New
DoD Plan
Military personnel 136 128 94%
Operations and maintenance 208 177 85%
Procurement 114 97 85%
R&D 61 55 90%
Military Construction 7.5 5.7 76%
Family Housing 1.5 1.4 93%
Revolving, management, trust funds & other 1 0.9 90%
TOTAL 530 465 88%
Active Duty End Strength (thousands) 1320 1150 87%