reasonable progress demonstration case study (dec 7, 2006) analysis done for dec 7, 2006 wrap iwg...
TRANSCRIPT
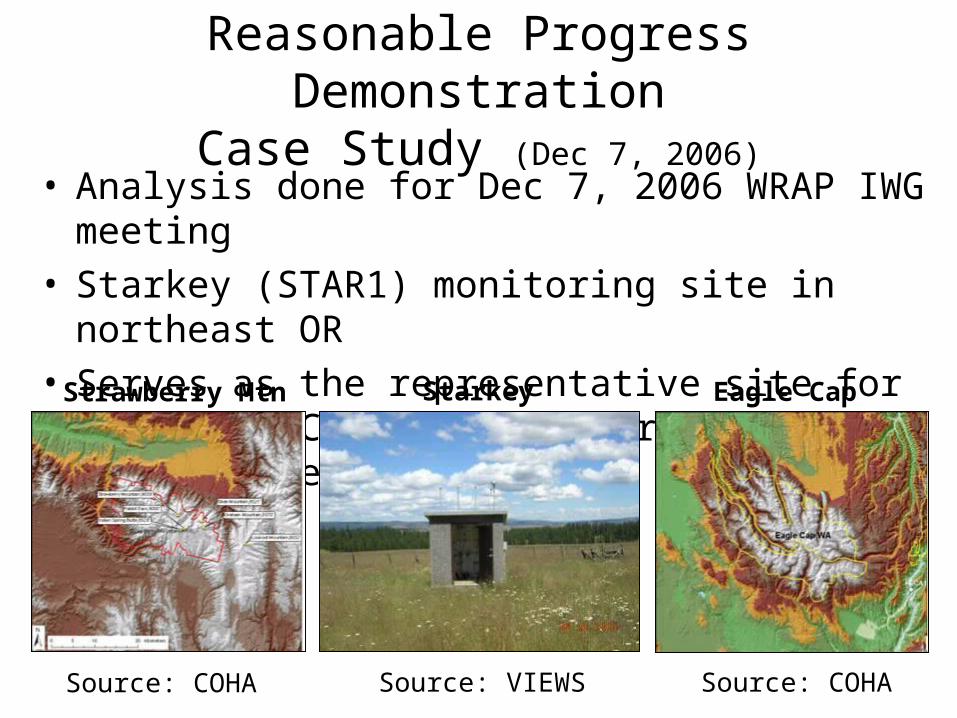
Reasonable Progress DemonstrationCase Study (Dec 7, 2006)
• Analysis done for Dec 7, 2006 WRAP IWG meeting• Starkey (STAR1) monitoring site in northeast OR• Serves as the representative site for the Eagle Cap
and Strawberry Mountain Class I aresStarkeyStrawberry Mtn Eagle Cap
Source: COHA Source: COHASource: VIEWS

Proposed Format for Demonstrating
Reasonable Progress

Regional Haze Rule• Promulgated in 1999• Requires states to set RPGs based on 4 statutory factors
and consideration of a URP• URP = 20% reduction in manmade haze (dv) per planning
period (10 years)• URP heavily dependent on:
– Assumptions regarding future natural conditions– Contribution of non-WRAP sources to baseline– Representativeness of 2000-04 baseline
• 24 of the 77 Class I sites have no more than 3 years of data in baseline period
– These issues more accute in the West

Why A Species-Based Approach?
• Isolate some of the URP issues previously noted• Species differ significantly from one another in
their:– Contribution to visibility impairment– Spatial and seasonal distributions– Source types– Contribution from natrual and international sources– Emissions data quality– Atmospheric science quality– Tools available for assessment and projection

SO2 NOx OC CM
Emission Sources
Almost entirely anthro.
Mostly point sources.
Mostly anthro.
Mix of combustion sources.
Diverse.
Mix of anthro, fire, and biogenic VOCs.
Diverse.
Very difficult to partition wb dust into nat/anthro.
Emissions Data Quality
Very good overall.
Activity data less good for area sources.
Good.Activity data less good, some coding concerns w/ smaller point, area, and O&G sources.
Fair.Good activity data & conf. in PM2.5 emissions, but uncertain spec. of PM2.5 & bio. VOCs.
Poor, except for some locales.Categorically complete but accuracy very uncertain.
Emission Projections
Very good.
Uncertain about area sources.
Good.
Uncertain about offshore and O&G.
Fair.
What to expect from fire?
Fair.
What to expect from wb dust?
Atmospheric Science Quality
Very good.
Meteorology probably largest uncertainty.
Fair.
Chemistry more complex, but meteorology too.
Fair.
Most complex, least understood, but model perf. OK.
Fair.
No major chemistry, but model resolution, met. insufficient.
WRAP Tools Emission Inv.
CMAQ Proj.
PSAT Apport.
Emission Inv.
CMAQ Proj.
PSAT Apport.
Emission Inv.
CMAQ Proj.
PMF, WEP.
Emission Inv.
Causes of Dust.
WEP.

What Is A Potential Process?
• For each site and species …• Estimate progress expected from Base Case + BART
in 2018• Determine any other LTSs which may be reasonable
for that pollutant and recalculate 2018 species concentration
• Add up improvements from all species into dv• This becomes the RPG for the 20% worst days• Explain why this is less than URP
– Large international and natural contributions, large uncertainties in dust inventory preclude action, etc.
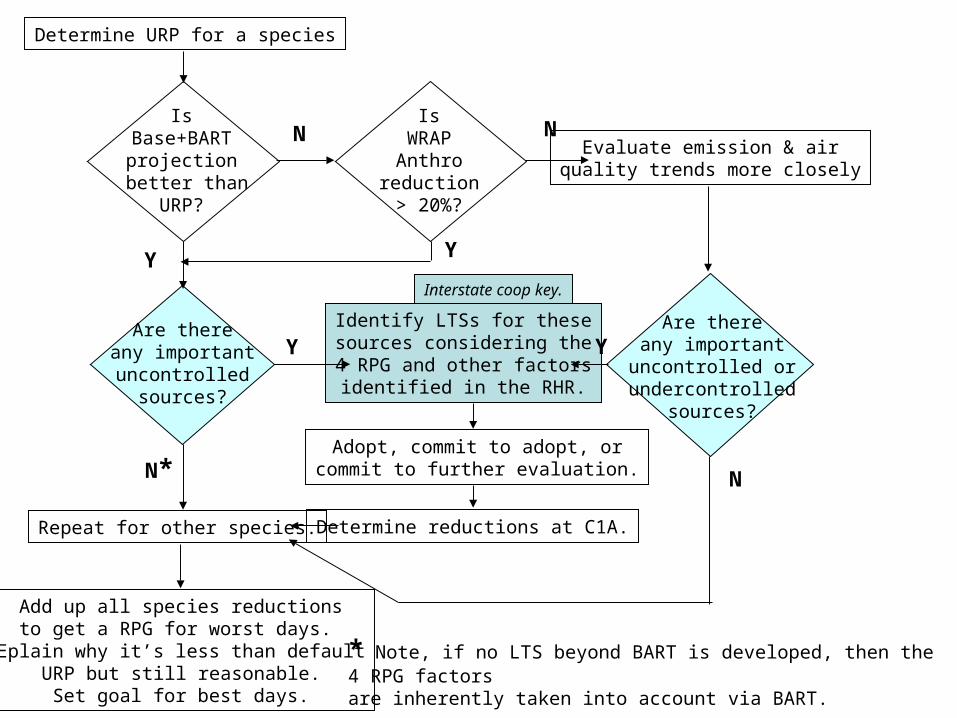
Determine URP for a species
IsBase+BART
projection better than
URP?
IsWRAPAnthro
reduction> 20%?
Are thereany importantuncontrolled
sources?
Are thereany important
uncontrolled orundercontrolled
sources?
Repeat for other species.
Evaluate emission & airquality trends more closely
Identify LTSs for thesesources considering the4 RPG and other factors
identified in the RHR.
Adopt, commit to adopt, orcommit to further evaluation.
Determine reductions at C1A.
Add up all species reductionsto get a RPG for worst days.
Eplain why it’s less than defaultURP but still reasonable.Set goal for best days.
Y
Y Y
N*
N N
N
Y
* Note, if no LTS beyond BART is developed, then the 4 RPG factorsare inherently taken into account via BART.
Interstate coop key.

Determining Non-BART LTSs
• Determine species glidepath and 2018 URP value• Estimate progress expected from Base Case +
BART in 2018• If progress is better than or equal to 2018 URP:
– Check inventory for “important sources” which may be uncontrolled
• If progress is worse than 2018 URP, but WRAP antho contribution declines by at least 20%:– Check inventory for important sources which may be
uncontrolled

Determining Non-BART LTSs
• If progress is worse than 2018 URP, and WRAP antho contribution declines by less than 20%:– Evaluate air quality & emission trends in more detail– Check inventory for important sources which may be
uncontrolled or undercontrolled– Identify LTSs for these sources considering the 4
RPG factors and 7 LTS factors, where applicable– Either adopt these strategies, commit to adopting
them post 2007, or commit to evaluating them further

“Important Sources”
• Identified and qualitatively ranked based on some or all of the following:– Size, proximity, current/potential degree of control,
feasibility of control, cost effectiveness, etc.• If point sources important, identify ~10 facilities• If area sources important, identify 3-5 categories
• Identification of important sources should not be limitted by state boundaries

Case Study

Eagle Cap / Strawberry MountainBaseline Extinction Budget
Source: WRAP Technical Support System >> Resources >> Monitoring >> Composition

Eagle Cap / Strawberry MountainSpecies Trends and URP Glidepaths
Source: WRAP Technical Support System >> Resources >> Monitoring >> Time Series
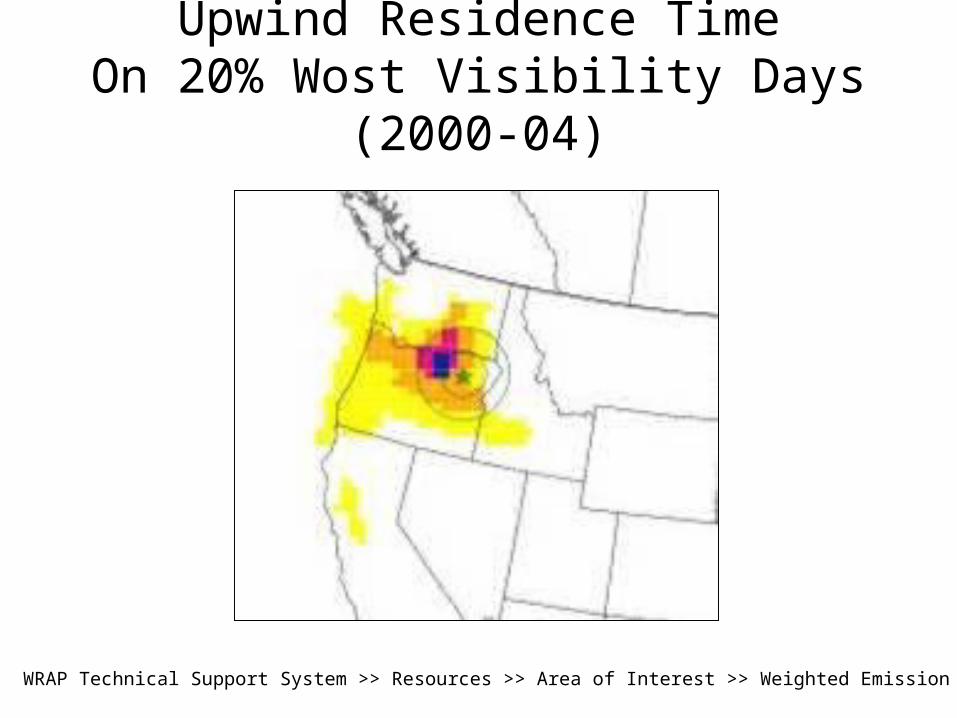
Upwind Residence TimeOn 20% Wost Visibility Days (2000-04)
Source: WRAP Technical Support System >> Resources >> Area of Interest >> Weighted Emission Potential

Ammonium Nitrate (NO3)

NO3
• Is the Base+BART projection better than URP?– Yes: CMAQ base case projections for 2018 show a
25% reduction in extinction due to NO3.• Results do not yet include BART• Results not yet available on TSS
– Precise projection method not yet finalized
• WRAP anthro reduction is 33%– See PSAT results on next slide

NO3
• Are there any important uncontrolled upwind sources?– Use TSS to examine inventory upwind
• PSAT results• PMF results• WEP results• Emission inventories

NO3 PSAT Results2002 and 2018 base cases
Source: WRAP Technical Support System >> Resources >> Area of Interest >> SOx/NOx Tracer

STAR PMF Apportionment of NitrateWorst Visibility Days (2001-2004)
Smoke19%
Dust0%
Sulfate-rich Secondary
54%
Road Dust/Mobille15%
Nitrate-rich Secondary/Mobile
12%
Source: Chart made after manipulation of data posted on WRAP Causes of Hase Website:http://coha.dri.edu/web/general/tools_PMFModeling.html

Sources and Areas of Potential Nitrogen Oxide Emissions Influence2000-2004 Baseline for Starkey, OR
20% Worst Visibility Days
0.1
6.6
0.04.2
0.5 0.5 0.0 0.0
57.8
0.0 0.1
25.1
0.02.3
0.0 0.0 0.02.8
0
10
20
30
40
50
60
70
80
90
100
Arizon
a
Califo
rnia
Colora
doId
aho
Mon
tana
Nevad
a
New M
exico
North
Dak
ota
Orego
n
South
Dak
ota
Utah
Was
hingt
on
Wyo
ming
Pacific
Offs
hore
CENRAP
Easte
rn U
S
Mex
ico
Canad
a
Per
cen
t o
f T
ota
l D
ista
nce
Wei
gh
ted
Em
is x
Res
Tim
e
Biogenic Natural Fire Point Area WRAP Area O&G Off-Shore
On-Road Mobile Off-Road Mobile Road Dust Fugitive Dust WB Dust Anthro Fire
NO3 WEP Results (2000-04)
Source: WRAP Technical Support System >> Resources >> Area of Interest >> Weighted Emission Potenital

Sources and Areas of Potential Nitrogen Oxide Emissions Influence2018 Projections for Starkey, OR
20% Worst Visibility Days
0.15.1
0.04.7
0.5 0.6 0.0 0.0
61.9
0.0 0.1
20.4
0.02.8
0.0 0.0 0.03.8
0
10
20
30
40
50
60
70
80
90
100
Arizon
a
Califo
rnia
Colora
doId
aho
Mon
tana
Nevad
a
New M
exico
North
Dak
ota
Orego
n
South
Dak
ota
Utah
Was
hingt
on
Wyo
ming
Pacific
Offs
hore
CENRAP
Easte
rn U
S
Mex
ico
Canad
a
Per
cen
t o
f T
ota
l D
ista
nce
Wei
gh
ted
Em
is x
Res
Tim
e
Biogenic Natural Fire Point Area WRAP Area O&G Off-Shore
On-Road Mobile Off-Road Mobile Road Dust Fugitive Dust WB Dust Anthro Fire
NO3 WEP Results (2018)
Source: WRAP Technical Support System >> Resources >> Area of Interest >> Weighted Emission Potenital

OR NOx Emissions
0
50,000
100,000
150,000
200,000
250,000
Point
Area
WRAP A
rea
O&G
Off-Shore
On-Road
Mobile
Off-Road
Mobile
Road D
ust
Fugitive
Dust
WB D
ust
Anthro
Fire
Natura
l Fire
Biogen
ic
Total
Anthro
To
ns
Pe
r Y
ea
r
2002 (tpy) 2018 (tpy)
-38%
Source: WRAP Technical Support System >> Resources >> Emissions

Source Category PSAT WEP Notes
Boundary conditions Outside state authority.
High uncertainty.
OR, WA mobile sources
Note large reductions (53% in PSAT).
OR point sources* Boardman EGU largest source, but BART not yet determined.
ID mobile sources Note large reductions (61% in PSAT).
ID area sources* Large wood-fired boiler emissions.
Data should be checked.
Most Likely NOx Sources Significantly Contributing to NO3at STAR On the 20% Worst Visibility Days
* See following slides.

Bituminous/Subbituminous Coal Portland General Electric Company 9,418Wood/Bark Waste Fort James Operating Company 520
Roseburg Forest Products Co. 1,059Smurfit Newsprint Corporation 802Boise Cascade Corporation 527
Natural Gas Boise Cascade Corporation 749Cement Manufacturing (Dry Process) Ash Grove Cement Company 2,290Sulfate (Kraft) Pulping Boise Cascade Corporation 843
Fort James Operating Company 706Pope & Talbot, Inc. 430Georgia-Pacific West, Inc. 413Weyerhaeuser Company 392
Natural Gas Future Natural Gas EGU (COB Energy Facility) 1,880Future Natural Gas EGU (PGE Port Westward) 1,153Future Natural Gas EGU (Klamath Generating) 887
Natural Gas Gas Transmission Northwest Corporation 524
NOx Sources > 500 tpy in the 2018Oregon Point Source Pivot Table
Source: WRAP website: Emissions Forum pivot tables: http://www.wrapair.org/forums/ssjf/pivot.html

* Emission maps not yet available on TSS. Hence, the above map is used as a placeholder and is for illustration purposes only. This map was obtained from the Causes of Haze website.
1996 Point Source NOx Emissions*
Illustr
ation O
nly

Pollutant NOXState ID
Sum of EmissionsSCC1_DESC SCC3_DESC SCC6_DESC SCC8_DESC TotalStationary Source Fuel Combustion Industrial Wood Total: All Boiler Types 22,057
Bituminous/Subbituminous CoalTotal: All Boiler Types 1,631Distillate Oil Total: Boilers and IC Engines 1,508Natural Gas Total: Boilers and IC Engines 1,067Liquified Petroleum Gas (LPG) 160Residual Oil 2Kerosene 1
Residential Natural Gas Residential Furnaces 958Liquified Petroleum Gas (LPG) 421Distillate Oil Total: All Combustor Types 190Wood Total: Woodstoves and Fireplaces 170
Commercial/Institutional Natural Gas Total: Boilers and IC Engines 739Distillate Oil Total: Boilers and IC Engines 273Liquified Petroleum Gas (LPG) 99Bituminous/Subbituminous CoalTotal: All Boiler Types 99Kerosene 2
Waste Disposal, Treatment, and Recovery Open Burning 919Miscellaneous Area Sources 23Grand Total 30,318
2002 Idaho Area Source NOx Emissions
Source: WRAP website: Emissions Forum pivot tables: http://www.wrapair.org/forums/ssjf/pivot.html
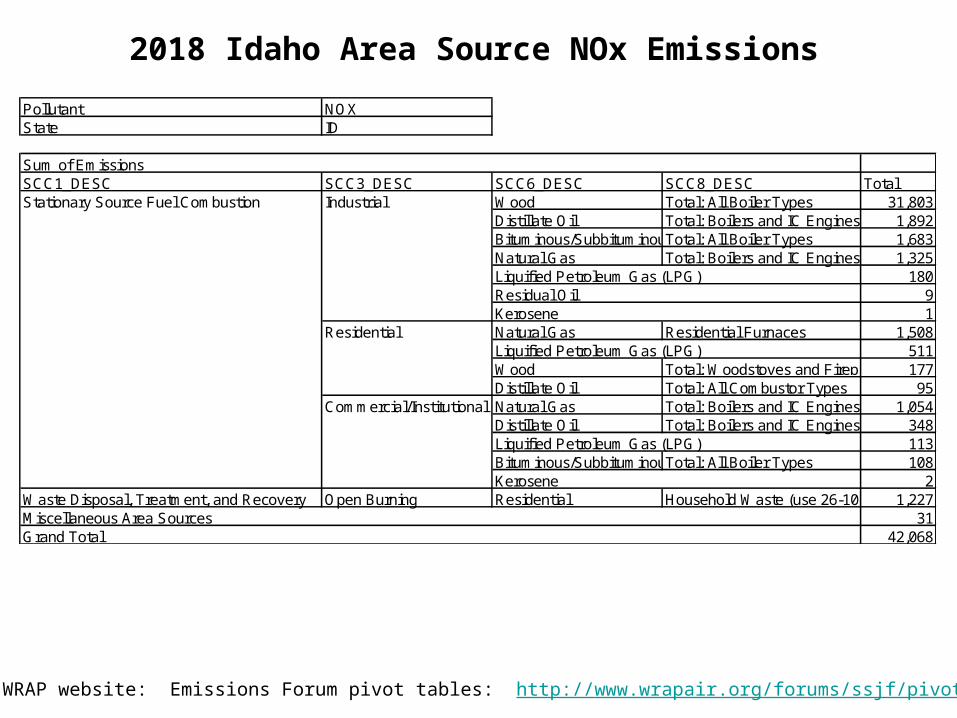
Pollutant NOXState ID
Sum of EmissionsSCC1_DESC SCC3_DESC SCC6_DESC SCC8_DESC TotalStationary Source Fuel Combustion Industrial Wood Total: All Boiler Types 31,803
Distillate Oil Total: Boilers and IC Engines 1,892Bituminous/Subbituminous CoalTotal: All Boiler Types 1,683Natural Gas Total: Boilers and IC Engines 1,325Liquified Petroleum Gas (LPG) 180Residual Oil 9Kerosene 1
Residential Natural Gas Residential Furnaces 1,508Liquified Petroleum Gas (LPG) 511Wood Total: Woodstoves and Fireplaces 177Distillate Oil Total: All Combustor Types 95
Commercial/Institutional Natural Gas Total: Boilers and IC Engines 1,054Distillate Oil Total: Boilers and IC Engines 348Liquified Petroleum Gas (LPG) 113Bituminous/Subbituminous CoalTotal: All Boiler Types 108Kerosene 2
Waste Disposal, Treatment, and Recovery Open Burning Residential Household Waste (use 26-10-000-xxx for Yard Wastes)1,227Miscellaneous Area Sources 31Grand Total 42,068
Source: WRAP website: Emissions Forum pivot tables: http://www.wrapair.org/forums/ssjf/pivot.html
2018 Idaho Area Source NOx Emissions
Ammonium Sulfate (SO4)

SO4
• Is the Base+BART projection better than URP?– No: CMAQ base case projections for 2018 show only a 1%
reduction in extinction due to SO4.• Sources outside the WRAP have a large influence• Results not yet available on TSS
• Is WRAP anthro reduction > 20%?– No: PSAT apportionment shows only a 10% reduction from
WRAP anthro SO2 sources• BART not yet included, but may likely increase reduction
to 20%• Major reductions at Centralia “missed” by selection of
2002 as the base year

SO4
• Are there any important uncontrolled upwind sources?– Use TSS to examine inventory upwind
• PSAT results• PMF results• WEP results• Emission inventories

SO4 PSAT Results 2002 and 2018 base cases
Source: WRAP Technical Support System >> Resources >> Area of Interest >> SOx/NOx Tracer
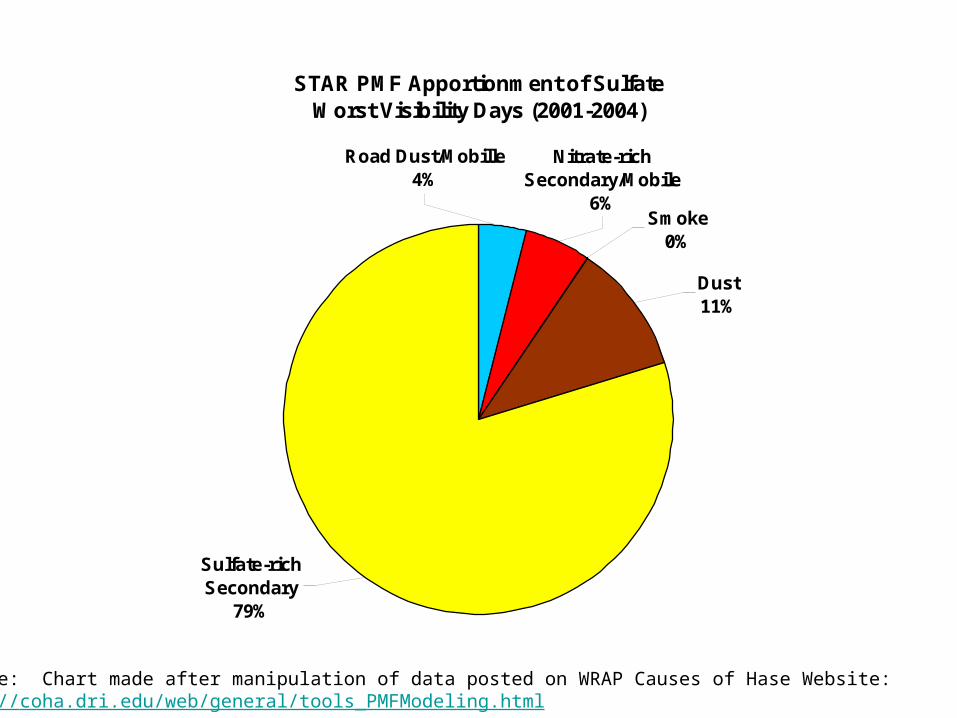
STAR PMF Apportionment of SulfateWorst Visibility Days (2001-2004)
Smoke0%
Dust11%
Sulfate-rich Secondary
79%
Road Dust/Mobille4%
Nitrate-rich Secondary/Mobile
6%
Source: Chart made after manipulation of data posted on WRAP Causes of Hase Website:http://coha.dri.edu/web/general/tools_PMFModeling.html

Sources and Areas of Potential Sulfur Oxide Emissions Influence2000-2004 Baseline for Starkey, OR
20% Worst Visibility Days
0.0 2.0 0.0 1.7 0.2 0.5 0.0 0.0
70.6
0.0 0.0
15.9
0.04.1
0.0 0.0 0.05.0
0
10
20
30
40
50
60
70
80
90
100
Arizon
a
Califo
rnia
Colora
doId
aho
Mon
tana
Nevad
a
New M
exico
North
Dak
ota
Orego
n
South
Dak
ota
Utah
Was
hingt
on
Wyo
ming
Pacific
Offs
hore
CENRAP
Easte
rn U
S
Mex
ico
Canad
a
Per
cen
t o
f T
ota
l D
ista
nce
Wei
gh
ted
Em
is x
Res
Tim
e
Biogenic Natural Fire Point Area WRAP Area O&G Off-Shore
On-Road Mobile Off-Road Mobile Road Dust Fugitive Dust WB Dust Anthro Fire
SO4 WEP Results (2000-04)
Source: WRAP Technical Support System >> Resources >> Area of Interest >> Weighted Emission Potenital

Sources and Areas of Potential Sulfur Oxide Emissions Influence2018 Projections for Starkey, OR
20% Worst Visibility Days
0.0 2.1 0.0 1.1 0.2 0.5 0.0 0.0
73.5
0.0 0.0
13.8
0.03.8
0.0 0.0 0.04.9
0
10
20
30
40
50
60
70
80
90
100
Arizon
a
Califo
rnia
Colora
doId
aho
Mon
tana
Nevad
a
New M
exico
North
Dak
ota
Orego
n
South
Dak
ota
Utah
Was
hingt
on
Wyo
ming
Pacific
Offs
hore
CENRAP
Easte
rn U
S
Mex
ico
Canad
a
Per
cen
t o
f T
ota
l D
ista
nce
Wei
gh
ted
Em
is x
Res
Tim
e
Biogenic Natural Fire Point Area WRAP Area O&G Off-Shore
On-Road Mobile Off-Road Mobile Road Dust Fugitive Dust WB Dust Anthro Fire
SO4 WEP Results (2018)
Source: WRAP Technical Support System >> Resources >> Area of Interest >> Weighted Emission Potenital

OR SO2 Emissions
0
5,000
10,000
15,000
20,000
25,000
30,000
35,000
40,000
45,000
50,000
Point
Area
WRAP A
rea
O&G
Off-Shore
On-Road
Mobile
Off-Road
Mobile
Road D
ust
Fugitive
Dust
WB D
ust
Anthro
Fire
Natura
l Fire
Biogen
ic
Total
Anthro
To
ns
Pe
r Y
ea
r
2002 (tpy) 2018 (tpy)
Source: WRAP Technical Support System >> Resources >> Emissions

Source Category PSAT WEP Notes
Boundary Conditions Outside state authority.
High uncertainty.
Offshore shipping Outside state authority.
WA point sources* See Centralia trends to follow. BART not yet included at other WA sources.
OR point sources* See following table. Nearly all emissions are from BART sources.
OR area* See following table, esp. diesel orchard heaters and industrial oil combustion.
OR and WA mobile Note large reductions (83% in PSAT).
Canadian point Outside state authority.
Most Likely SO2 Sources Significantly Contributing to SO4at STAR On the 20% Worst Visibility Days
* See following slides.
SO2 Sources > 500 tpy in the 2018Washington Point Source Pivot Table

Centralia SO2 Emission Trends
0
10,000
20,000
30,000
40,000
50,000
60,000
70,000
80,000
90,000
2000 2001 2002 2003 2004 2005
SO
2 T
on
s P
er Y
ear
Base Case Modeling Year
Source: EPA Clean Air Markets Division Website
Significant progress made in WA point sources not reflectedin choice of base case years (2002 and 2018).

SO2 Sources > 500 tpy in the 2018Oregon Point Source Pivot Table
Source: WRAP website: Emissions Forum pivot tables: http://www.wrapair.org/forums/ssjf/pivot.html
Bituminous/Subbituminous Coal Portland General Electric Company 14,917Wood/Bark Waste Smurfit Newsprint Corporation 831Bituminous/Subbituminous Coal Amalgamated Sugar Company, The 503Sulfate (Kraft) Pulping Boise Cascade Corporation 1,613
Fort James Operating Company 688Fuel Fired Equipment Fort James Operating Company 983
Note: All these sources are BART-eligible.

* Emission maps not yet available on TSS. Hence, the above map is used as a placeholder and is for illustration purposes only. This map was obtained from the Causes of Haze website.
1996 Point Source SO2 Emissions*
Illustr
ation O
nly

Oregon Area Source SO2 Emissions (2002 tpy) for 2002 and 2018 Base Cases
SCC1_DESC SCC3_DESC SCC6_DESC SCC8_DESC 2002 2018Stationary Source Fuel Combustion Residential Natural Gas 12 14
Wood 616 642Liquified Petroleum Gas (LPG) 1 1Distillate Oil 992 753Kerosene 160 160Bituminous/Subbituminous Coal 27 27
Industrial Natural Gas 15 17Liquified Petroleum Gas (LPG) 0 0Residual Oil 2,693 1,800Distillate Oil 1,453 449Kerosene 49 60Bituminous/Subbituminous Coal
Commercial/Institutional Liquified Petroleum Gas (LPG) 0 0Natural Gas 8 10Distillate Oil 989 1,376Residual Oil 398 398Kerosene 63 63
Waste Disposal, Treatment, and Recovery 292 410Industrial ProcessesSolvent UtilizationMiscellaneous Area Sources Agriculture Production - Crops Agriculture - Crops
Orchard Heaters Diesel 2,164 2,243Propane 0 0Total, all fuels 0 0
Agricultural Propaning - tractor-pulled burners to burn stubble only0 1Agricultural Stack Burning - straw stacks moved from field for burning
Other CombustionStorage and TransportGrand Total 9,932 8,422
2002 and 2018 Oregon Area Source SO2 Emissions
Source: WRAP website: Emissions Forum pivot tables: http://www.wrapair.org/forums/ssjf/pivot.html

Organic Carbon (OC)

0.00
0.10
0.20
0.30
0.40
0.50
0.60
0.70
0.80
0.90
1.00
Vermont Brig GreatSmoky
Mt Rainier Puget Sound
Biogenic
Fossil
Fraction of Carbon That Is Modern or Fossil
Source: National Park Service presentation

OC
• Is the Base+BART projection better than URP?– No: CMAQ base case projections for 2018 show a 6%
reduction in extinction due to OC.
• Is WRAP anthro reduction > 20%?– Unclear: Reduction in primary anthro carbon is about
20%, but secondary carbon is a larger contributor and it is unclear what portion is anthro.
• These reductions assume implementation of smoke emission reduction techniques (ERTs)

OC
• Are there any important uncontrolled upwind sources?– Use TSS to examine inventory upwind
• CMAQ results• PMF results• WEP results• Emission inventories

OC CMAQ Results 2002 and 2018 base cases
Source: WRAP Technical Support System
AORGA Change = +2%AORGB Change = -4%AORGPA Change = -18%
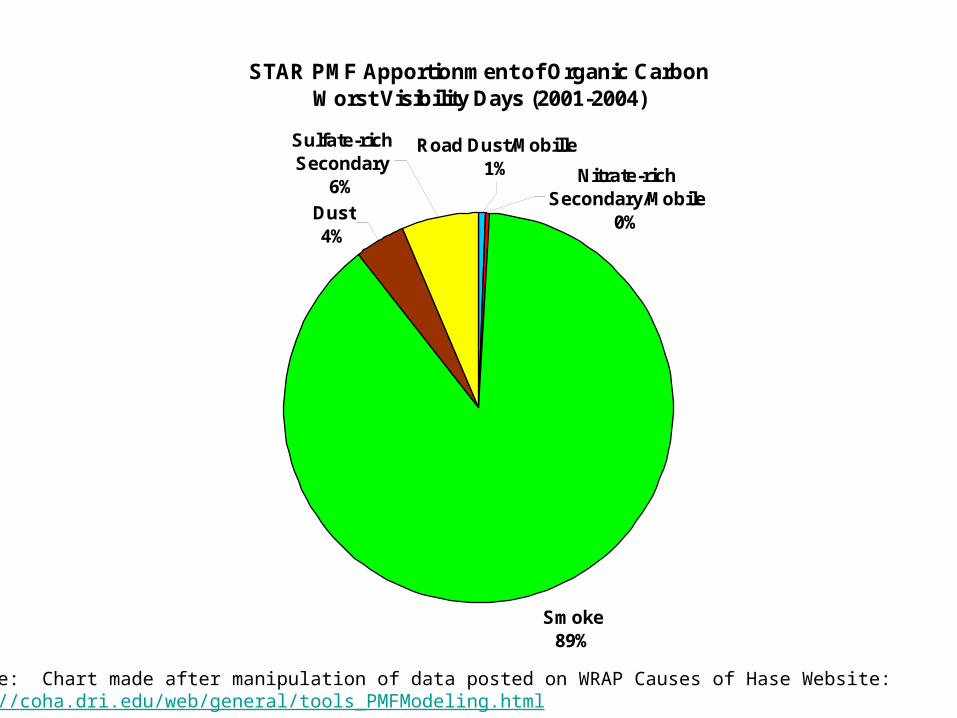
STAR PMF Apportionment of Organic CarbonWorst Visibility Days (2001-2004)
Smoke89%
Dust4%
Sulfate-rich Secondary
6%
Road Dust/Mobille1% Nitrate-rich
Secondary/Mobile0%
Source: Chart made after manipulation of data posted on WRAP Causes of Hase Website:http://coha.dri.edu/web/general/tools_PMFModeling.html

Sources and Areas of Potential Organic Carbon Emissions Influence2000-2004 Baseline for Starkey, OR
20% Worst Visibility Days
0.02.5
0.0 1.8 0.4 0.1 0.0 0.0
74.4
0.0 0.0
19.7
0.0 0.3 0.0 0.0 0.0 0.8
0
10
20
30
40
50
60
70
80
90
100
Arizon
a
Califo
rnia
Colora
doId
aho
Mon
tana
Nevad
a
New M
exico
North
Dak
ota
Orego
n
South
Dak
ota
Utah
Was
hingt
on
Wyo
ming
Pacific
Offs
hore
CENRAP
Easte
rn U
S
Mex
ico
Canad
a
Per
cen
t o
f T
ota
l D
ista
nce
Wei
gh
ted
Em
is x
Res
Tim
e
Biogenic Natural Fire Point Area WRAP Area O&G Off-Shore
On-Road Mobile Off-Road Mobile Road Dust Fugitive Dust WB Dust Anthro Fire
OC WEP Results (2000-04)
Source: WRAP Technical Support System >> Resources >> Area of Interest >> Weighted Emission Potenital

OC WEP Results (2018)Sources and Areas of Potential Organic Carbon Emissions Influence
2018 Projections for Starkey, OR20% Worst Visibility Days
0.02.9
0.0 1.6 0.4 0.1 0.0 0.0
68.8
0.0 0.0
24.8
0.0 0.4 0.0 0.0 0.0 1.1
0
10
20
30
40
50
60
70
80
90
100
Arizon
a
Califo
rnia
Colora
doId
aho
Mon
tana
Nevad
a
New M
exico
North
Dak
ota
Orego
n
South
Dak
ota
Utah
Was
hingt
on
Wyo
ming
Pacific
Offs
hore
CENRAP
Easte
rn U
S
Mex
ico
Canad
a
Per
cen
t o
f T
ota
l D
ista
nce
Wei
gh
ted
Em
is x
Res
Tim
e
Biogenic Natural Fire Point Area WRAP Area O&G Off-Shore
On-Road Mobile Off-Road Mobile Road Dust Fugitive Dust WB Dust Anthro Fire
Source: WRAP Technical Support System >> Resources >> Area of Interest >> Weighted Emission Potenital

OR OC Emissions
0
5,000
10,000
15,000
20,000
25,000
30,000
35,000
40,000
45,000
Point
Area
WRAP A
rea
O&G
Off-Shore
On-Road
Mobile
Off-Road
Mobile
Road D
ust
Fugitive
Dust
WB D
ust
Anthro
Fire
Natura
l Fire
Biogen
ic
Total
Anthro
To
ns
Pe
r Y
ea
r
2002 (tpy) 2018 (tpy)
-28%
-32% -36%
+5%
-6%
Source: WRAP Technical Support System >> Resources >> Emissions
Elemental Carbon (EC)

EC
• Is the Base+BART projection better than URP?– Yes: CMAQ base case projections for 2018 show a
33% reduction in extinction due to EC.
• Are there any important uncontrolled upwind sources?– Use TSS to examine inventory upwind
• PMF results• WEP results• Emission inventories

STAR PMF Apportionment of Elemental CarbonWorst Visibility Days (2001-2004)
Smoke87%
Dust2%
Sulfate-rich Secondary
7%
Road Dust/Mobille1%
Nitrate-rich Secondary/Mobile
3%
Source: Chart made after manipulation of data posted on WRAP Causes of Hase Website:http://coha.dri.edu/web/general/tools_PMFModeling.html
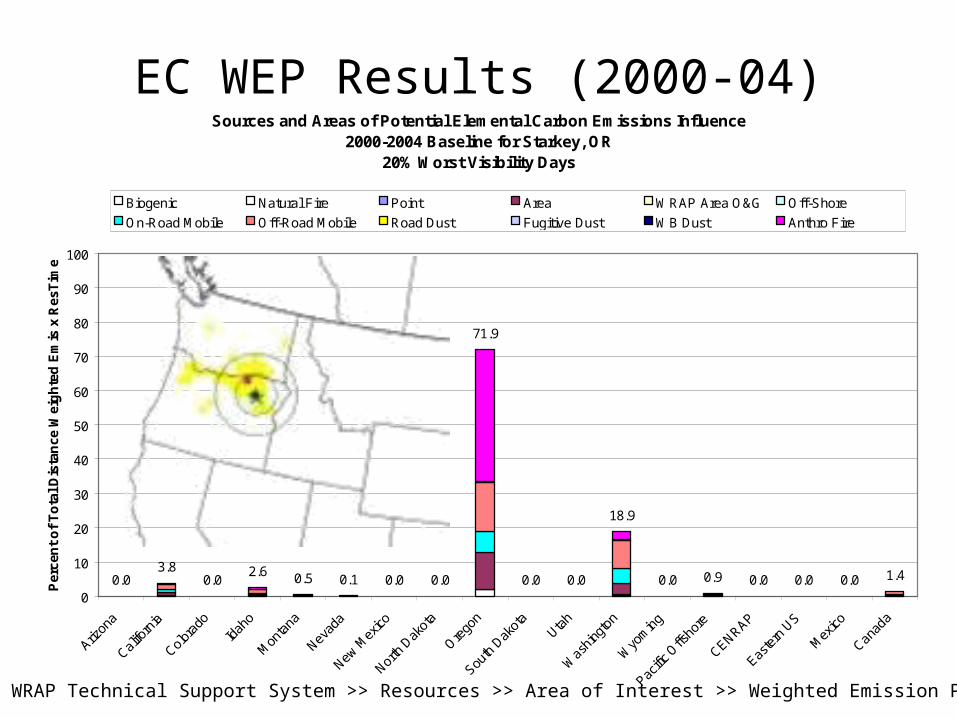
Sources and Areas of Potential Elemental Carbon Emissions Influence2000-2004 Baseline for Starkey, OR
20% Worst Visibility Days
0.03.8
0.02.6 0.5 0.1 0.0 0.0
71.9
0.0 0.0
18.9
0.0 0.9 0.0 0.0 0.0 1.4
0
10
20
30
40
50
60
70
80
90
100
Arizon
a
Califo
rnia
Colora
doId
aho
Mon
tana
Nevad
a
New M
exico
North
Dak
ota
Orego
n
South
Dak
ota
Utah
Was
hingt
on
Wyo
ming
Pacific
Offs
hore
CENRAP
Easte
rn U
S
Mex
ico
Canad
a
Per
cen
t o
f T
ota
l D
ista
nce
Wei
gh
ted
Em
is x
Res
Tim
e
Biogenic Natural Fire Point Area WRAP Area O&G Off-Shore
On-Road Mobile Off-Road Mobile Road Dust Fugitive Dust WB Dust Anthro Fire
EC WEP Results (2000-04)
Source: WRAP Technical Support System >> Resources >> Area of Interest >> Weighted Emission Potenital
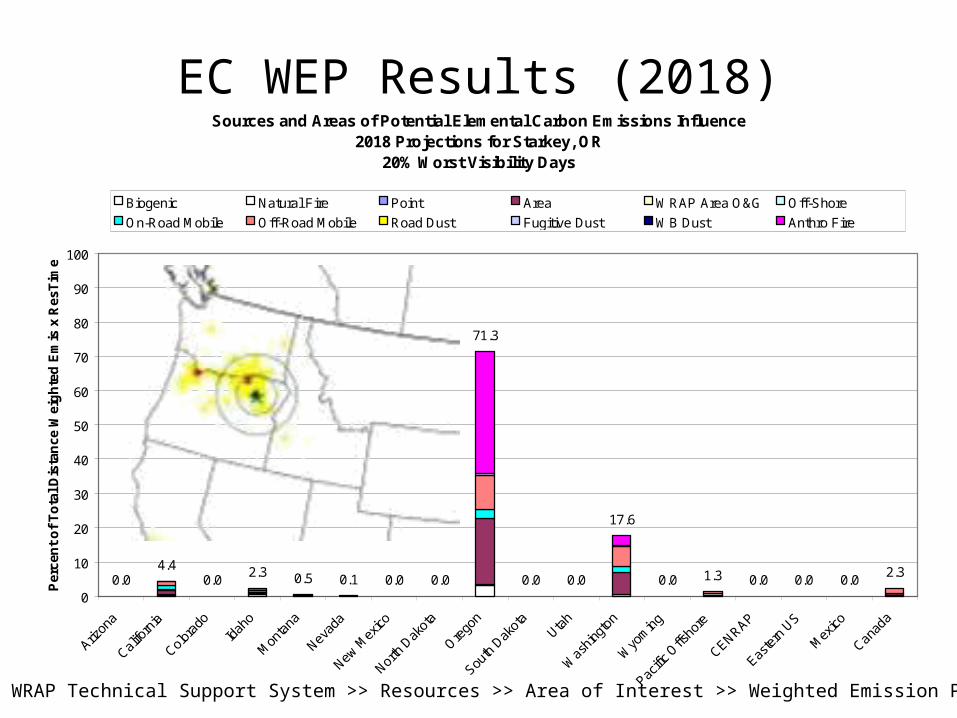
Sources and Areas of Potential Elemental Carbon Emissions Influence2018 Projections for Starkey, OR
20% Worst Visibility Days
0.04.4
0.02.3 0.5 0.1 0.0 0.0
71.3
0.0 0.0
17.6
0.0 1.3 0.0 0.0 0.02.3
0
10
20
30
40
50
60
70
80
90
100
Arizon
a
Califo
rnia
Colora
doId
aho
Mon
tana
Nevad
a
New M
exico
North
Dak
ota
Orego
n
South
Dak
ota
Utah
Was
hingt
on
Wyo
ming
Pacific
Offs
hore
CENRAP
Easte
rn U
S
Mex
ico
Canad
a
Per
cen
t o
f T
ota
l D
ista
nce
Wei
gh
ted
Em
is x
Res
Tim
e
Biogenic Natural Fire Point Area WRAP Area O&G Off-Shore
On-Road Mobile Off-Road Mobile Road Dust Fugitive Dust WB Dust Anthro Fire
EC WEP Results (2018)
Source: WRAP Technical Support System >> Resources >> Area of Interest >> Weighted Emission Potenital

OR EC Emissions
0
2,000
4,000
6,000
8,000
10,000
12,000
14,000
Point
Area
WRAP A
rea
O&G
Off-Shore
On-Road
Mobile
Off-Road
Mobile
Road D
ust
Fugitive
Dust
WB D
ust
Anthro
Fire
Natura
l Fire
Biogen
ic
Total
Anthro
To
ns
Pe
r Y
ea
r
2002 (tpy) 2018 (tpy)
+5%
-75%
-61%
-27%
-33%
Source: WRAP Technical Support System >> Resources >> Emissions

Draft Summary Table for Worst Visibility Days
Strawberry Mountain and Eagle Cap Class I Areas, Oregon
2000-04Baseline
Conditions (Mm-1)
2064Natural
Conditions (Mm-1)
2018URP
(Mm-1)
2018Base Case
(Mm-1)
2018Control Case
(Mm-1)
Change In Statewide Emissions1
(tons / %)
Change In Upwind
Weighted Emissions1
(%)
Change InWRAP Antrho
Contribution1
(%)
Other Apportion-
ment Results
SO4 7.75 1.13 5.79 7.65 / PSAT PMF
NO3 15.8 0.94 10.8 11.9 / PSAT PMF
OC 24.1 1.88 16.2 23.0 /
NotApplicable
PMF
EC 4.21 0.2 3.08 2.81 / PMF
FS 1.27 0.5 1.08 2 2 / PMF
CM 4.77 1.8 3.97 2 2 / PMF
DV3 17.9 7.54 15.3 17.0 4 Not Applicable
1 Represents change between control case and 2000-04 baseline condition.2 Visibility projections not available due to model performance issues.3 Unitless value.4 This becomes the reasonable progress goal for the worst visibility days.


CMAQ OC Species at STARCMAQ Species
Species Definition Annual Average Modeled Concentration (ug/m3)
Clean02a Plan02b Base18b (% change)
AORGA Secondary Organic Aerosols from Anthropogenic Sources
0.00 0.08 0.08
(-3%)
AORGB Secondary Organic Aerosols from Biogenic Sources
0.73 1.23 1.14
(-4%)
AORGPA Primary Organic Aerosols from All Sources
0.07 0.41 0.37
(-8%)
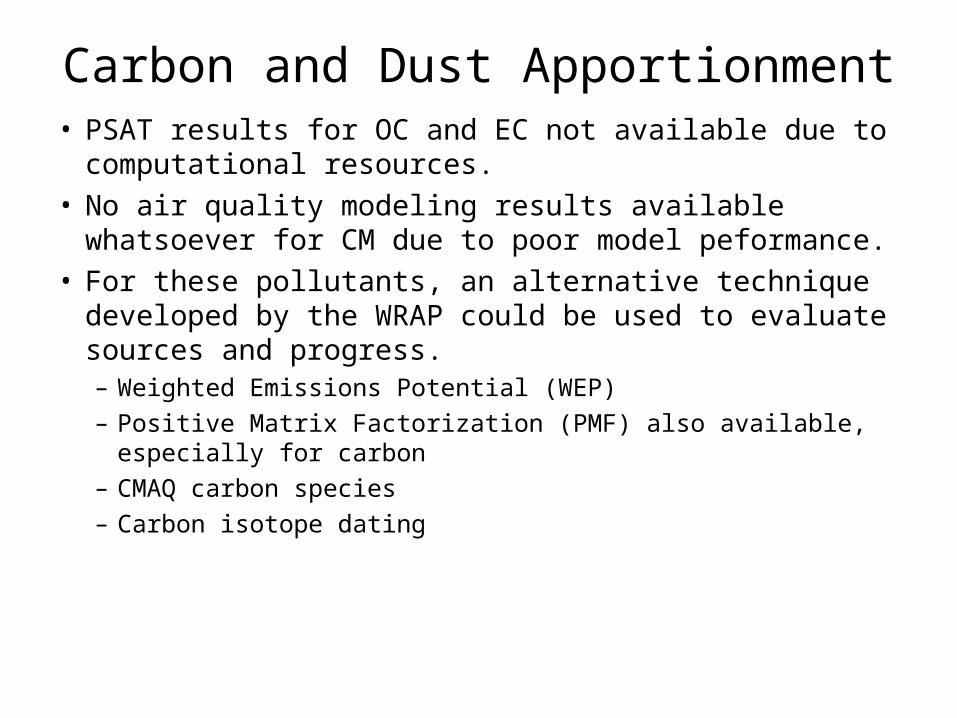
Carbon and Dust Apportionment• PSAT results for OC and EC not available due to
computational resources.• No air quality modeling results available whatsoever for
CM due to poor model peformance.• For these pollutants, an alternative technique developed
by the WRAP could be used to evaluate sources and progress.– Weighted Emissions Potential (WEP)– Positive Matrix Factorization (PMF) also available, especially
for carbon– CMAQ carbon species– Carbon isotope dating

Weighted Emissions Potential Method
• Combine gridded emissions data with gridded backtrajectory residence times to determine sources with the most potential to affect a site.
• Sources with the greatest potential will tend to be both upwind on the worst visibility days and have relatively large emissions.– 2002 and 2018 annual average emissions– 3-5 years of 20% worst days back trajectories– Discount sources based on distance from site– Ignore grid cells with very low residence times– Does not account for chemistry, dispersion, deposition– Method being finalized

Weighted Emissions Potential MethodPrototype example for Salt Creek, New Mexico
Emissions ResidenceTimes
Weighted EmissionsPotential
X =