reasoning in geometry how first learning to appreciate the
TRANSCRIPT

Reasoning in geometry
How first learning to appreciate the generality of arguments helpsstudents come to grips with the notion of proof
MSc Thesis
written by
Olga Grigoriadou
under the supervision of Dr. Wolter Kaper, and submitted in partial fulfillment of therequirements for the degree of
MSc in Mathematics and Science Education
at the University of Amsterdam.
February 2012

Abstract
One of the aims of teaching geometry at school level is to help students understand what countsas an acceptable argument in mathematics (a ‘proof’) and to move from using inductive ar-guments to using deductive ones for supporting mathematical statements. The research studydescribed in this thesis focuses on students’ reasoning when they start abandoning inductivearguments for deductive ones. More specifically, we propose a teaching module (partly basedon existing literature) which assists students in this learning process, and we present the resultsof implementing this module on a sample of 20 students in a Greek highschool. We examine thechange in the kinds of reasoning used by students at each point of the intervention and the effectof this change on the beliefs of students about mathematics and proof. Our results suggest thatlaying emphasis on making clear to the students the distinction between deductive and inductivearguments at the beginning of the lessons cycle, can help them to understand better the conceptof mathematical proof and to produce proofs.


Acknowledgements
First and foremost I would like to thank Wolter, my supervisor. I still have vivid memoriesof the moment when I first talked to Wolter about my ideas. He was so enthusiastic that wekept exchanging long emails about the topic for a few days after, sharing our ideas and ourenthusiasm. This was a great push forward for me, and made me even more excited to putall my ideas to work. I feel very lucky to have worked with such an enthusiastic, helpful andhardworking supervisor. Wolter’s feedback and support always came right when I needed them,and we exchanged productive criticism at all times. Without him, the way to the end of thisproject would have been much more difficult.
I would also like to thank the students that participated in the teaching intervention. Thesestudents offered with enthusiasm much of their free time in return for new experiences in math-ematics. I greatly appreciate the effort they put in, all the way through the intervention, and theirfeedback. It was my first teaching experience, and I feel lucky that this was with such lovelyand motivated students. I thank them all wholeheartedly and I wish them good luck in whateverthey do in their lives! Of course, I would not have met these students had it not been for thecooperating teacher, Makis Panteliadis, who gave me permission to work with the students fromhis classes for this project. His comments, help and support were at all times useful, for whichI would like to thank him.
Finally, I would like to thank all the people that supported me during this project: my teach-ers and fellow students at the AMSTEL institute who guided me and shared their experienceswith me; my friends all over the world for supportingme and helpingme forget about this projectduring my holidays; Olga, Rodi, Vassilis and Giannis for taking pictures and videos during theintervention; my professor Anastasios Patronis from the University of Patras for introducing meto the world of mathematics education and for the fruitful discussions we had during the firststages of this project; my parents for teaching me to never stop learning; and my partner Tikitufor proofreading and helping me structure this thesis and for being there for me whatever I do.

Contents
Contents i
List of Figures v
List of Tables vii
1 Introduction 1
2 Theoretical Framework 32.1 The meaning of proof . . . . . . . . . . . . . . . . . . . . . . . . . . . . . . . 32.2 Deductive versus inductive reasoning . . . . . . . . . . . . . . . . . . . . . . 42.3 Geometry as a deductive science . . . . . . . . . . . . . . . . . . . . . . . . . 52.4 Previous research on students’ geometrical reasoning . . . . . . . . . . . . . . 6
2.4.1 The Van Hiele theory . . . . . . . . . . . . . . . . . . . . . . . . . . . 62.4.2 Schoenfeld on students’ beliefs about proof . . . . . . . . . . . . . . . 72.4.3 The Harel & Sowder proof schemes . . . . . . . . . . . . . . . . . . . 82.4.4 The project Justifying and Proving in School Mathematics (JPSM) . . . 15
2.5 Van Hiele levels and Harel & Sowder proof schemes: A correspondence . . . . 162.6 Previous research on the Van Hiele theory . . . . . . . . . . . . . . . . . . . . 172.7 Teaching strategies assisting the move through the Van Hiele levels . . . . . . 182.8 Conclusions and how our research builds on the literature . . . . . . . . . . . . 22
3 Aims and Research Questions 253.1 Aims . . . . . . . . . . . . . . . . . . . . . . . . . . . . . . . . . . . . . . . . 253.2 Research Questions . . . . . . . . . . . . . . . . . . . . . . . . . . . . . . . . 263.3 Hypotheses . . . . . . . . . . . . . . . . . . . . . . . . . . . . . . . . . . . . 26
4 Research Setting 294.1 The place . . . . . . . . . . . . . . . . . . . . . . . . . . . . . . . . . . . . . 294.2 The Greek educational system . . . . . . . . . . . . . . . . . . . . . . . . . . 294.3 Geometry in the Greek curriculum . . . . . . . . . . . . . . . . . . . . . . . . 294.4 The geometry books of the Greek Gymnasium . . . . . . . . . . . . . . . . . . 30
5 Methodology, Teaching Design and Analysis Framework 355.1 Identifying the students’ Van Hiele levels . . . . . . . . . . . . . . . . . . . . 365.2 Identifying the students’ kinds of reasoning . . . . . . . . . . . . . . . . . . . 36
i

CONTENTS
5.2.1 Adapting the instruments of the JPSM project to our research . . . . . 365.2.2 Classifying the students’ kinds of reasoning based on the Harel & Sow-
der proof schemes . . . . . . . . . . . . . . . . . . . . . . . . . . . . 405.3 Identifying the students’ beliefs about mathematics and proof . . . . . . . . . . 40
5.3.1 The adapted Schoenfeld questionnaire . . . . . . . . . . . . . . . . . . 405.3.2 Our questionnaire about what the students believe they learned . . . . . 405.3.3 An adapted version of certain JPSM project tasks . . . . . . . . . . . . 41
5.4 Determining the correlation between proof schemes and Van Hiele levels . . . 415.5 Designing and evaluating a teaching strategy . . . . . . . . . . . . . . . . . . 41
5.5.1 The move from the descriptive to the theoretical level in three stages . . 425.5.2 The five Van Hiele phases for eight concepts in our teaching sequence . 445.5.3 Method for evaluating our teaching strategy . . . . . . . . . . . . . . . 49
5.6 Other data collection methods . . . . . . . . . . . . . . . . . . . . . . . . . . 50
6 The Intervention 516.1 Population and sample . . . . . . . . . . . . . . . . . . . . . . . . . . . . . . 516.2 Student participation . . . . . . . . . . . . . . . . . . . . . . . . . . . . . . . 546.3 Diary of the intervention . . . . . . . . . . . . . . . . . . . . . . . . . . . . . 55
7 Results 657.1 The Usiskin Van Hiele test results . . . . . . . . . . . . . . . . . . . . . . . . 657.2 The Harel & Sowder proof schemes coding process . . . . . . . . . . . . . . . 697.3 Correlations between Van Hiele level and Harel & Sowder proof scheme . . . . 787.4 The role of our teaching strategy: A qualitative analysis . . . . . . . . . . . . . 82
7.4.1 Moving through the three stages towards deductive proof schemes . . . 827.4.2 Moving through the five Van Hiele teaching phases towards the theo-
retical Van Hiele level . . . . . . . . . . . . . . . . . . . . . . . . . . 1007.5 Students’ beliefs about mathematics and proof . . . . . . . . . . . . . . . . . . 120
7.5.1 Modified Schoenfeld questionnaire results . . . . . . . . . . . . . . . . 1207.5.2 Students’ own ideas on how their beliefs changed . . . . . . . . . . . . 1247.5.3 Students’ understanding of the validity, convincingness and generality
of arguments . . . . . . . . . . . . . . . . . . . . . . . . . . . . . . . 131
8 Conclusions and Discussion 1498.1 Conclusions . . . . . . . . . . . . . . . . . . . . . . . . . . . . . . . . . . . . 149
8.1.1 Answering SQ.1 and H.1 . . . . . . . . . . . . . . . . . . . . . . . . . 1498.1.2 Answering SQ.2 and H.2 . . . . . . . . . . . . . . . . . . . . . . . . . 1508.1.3 Answering SQ.3 and H.3 . . . . . . . . . . . . . . . . . . . . . . . . . 1518.1.4 Answering our main research question . . . . . . . . . . . . . . . . . . 152
8.2 Discussion and recommendations . . . . . . . . . . . . . . . . . . . . . . . . . 153
References 159
Further Reading 165
ii

CONTENTS
A Pre- and post- tests and questionnaires 167A.1 The original Usiskin Van Hiele test . . . . . . . . . . . . . . . . . . . . . . . . 168A.2 The Van Hiele test as used in our research . . . . . . . . . . . . . . . . . . . . 181A.3 The modified Schoenfeld questionnaire . . . . . . . . . . . . . . . . . . . . . 190A.4 Beliefs & reflections questionnaire . . . . . . . . . . . . . . . . . . . . . . . . 192
B Task related worksheets 193B.1 TRIANGLES . . . . . . . . . . . . . . . . . . . . . . . . . . . . . . . . . . . 194B.2 ANGLE SUM . . . . . . . . . . . . . . . . . . . . . . . . . . . . . . . . . . . 200B.3 CHOOSING . . . . . . . . . . . . . . . . . . . . . . . . . . . . . . . . . . . . 201B.4 CONCEPTIONS ABOUT PROOF . . . . . . . . . . . . . . . . . . . . . . . . 205B.5 QUAD . . . . . . . . . . . . . . . . . . . . . . . . . . . . . . . . . . . . . . . 206B.6 OPPANG . . . . . . . . . . . . . . . . . . . . . . . . . . . . . . . . . . . . . 207B.7 BIS . . . . . . . . . . . . . . . . . . . . . . . . . . . . . . . . . . . . . . . . 208B.8 BIS-GROUP . . . . . . . . . . . . . . . . . . . . . . . . . . . . . . . . . . . 209B.9 EXT-GROUP . . . . . . . . . . . . . . . . . . . . . . . . . . . . . . . . . . . 210B.10 TRIMID . . . . . . . . . . . . . . . . . . . . . . . . . . . . . . . . . . . . . . 211B.11 TRIMID-GROUP . . . . . . . . . . . . . . . . . . . . . . . . . . . . . . . . . 212B.12 QUADMID . . . . . . . . . . . . . . . . . . . . . . . . . . . . . . . . . . . . 213B.13 IF THEN . . . . . . . . . . . . . . . . . . . . . . . . . . . . . . . . . . . . . 214
C Handouts 215C.1 Invitation . . . . . . . . . . . . . . . . . . . . . . . . . . . . . . . . . . . . . 216C.2 Introduction to the lessons content and expectations . . . . . . . . . . . . . . . 218C.3 The pros and cons of arguments . . . . . . . . . . . . . . . . . . . . . . . . . 219C.4 How new truths are discovered in geometry . . . . . . . . . . . . . . . . . . . 222C.5 What we discovered in the geometry lessons . . . . . . . . . . . . . . . . . . . 223C.6 Where does it all begin? The map of axioms . . . . . . . . . . . . . . . . . . . 240C.7 The story of Euclidean geometry . . . . . . . . . . . . . . . . . . . . . . . . . 241
D Tables and results 243D.1 Van Hiele pre-test: Analysis and comparison with other studies . . . . . . . . . 244D.2 Distribution of answers to the VR and EP questions in Task CHOOSING . . . 256D.3 VR and EP scores before and after our intervention . . . . . . . . . . . . . . . 258D.4 More results of the beliefs & reflections questionnaire . . . . . . . . . . . . . . 258
iii

CONTENTS
iv

List of Figures
2.1 The Harel & Sowder proof schemes . . . . . . . . . . . . . . . . . . . . . . . 102.2 The revised Harel & Sowder deductive proof schemes . . . . . . . . . . . . . . 102.3 Figure accompanying a proof . . . . . . . . . . . . . . . . . . . . . . . . . . . 122.4 An example of a non-causal proof . . . . . . . . . . . . . . . . . . . . . . . . 132.5 An example of a causal proof . . . . . . . . . . . . . . . . . . . . . . . . . . . 13
4.1 Introducing new concepts in geometry — the Greek book . . . . . . . . . . . . 33
6.1 Term grades in mathematics for the participating students . . . . . . . . . . . . 526.2 Making conjectures about the properties of opposing angles . . . . . . . . . . . 586.3 Figure drawn by the teacher to introduce Task BIS . . . . . . . . . . . . . . . 606.4 Students’ conjectures for Task EXT . . . . . . . . . . . . . . . . . . . . . . . 606.5 Explaining Task QUADMID . . . . . . . . . . . . . . . . . . . . . . . . . . . 63
7.1 Example of the empirical/inductive proof scheme . . . . . . . . . . . . . . . . 727.2 Example of the empirical/inductive proof scheme . . . . . . . . . . . . . . . . 727.3 Example of the empirical/perceptual proof scheme . . . . . . . . . . . . . . . 737.4 Example of a deductive argument for Task QUAD . . . . . . . . . . . . . . . . 737.5 Example of an incomplete deductive argument for Task TRIMID . . . . . . . . 747.6 Example of a causal proof scheme for Task OPPANG . . . . . . . . . . . . . . 757.7 A deductive proof offered to the students in Task CHOOSING . . . . . . . . . 867.8 Example of an empirical argument for Task QUAD . . . . . . . . . . . . . . . 897.9 Example of a deductive argument for Task QUAD . . . . . . . . . . . . . . . . 897.10 Example of an argument of an externally convinced student for Task QUAD . . 907.11 A student who correctly identified the non-generality of her argument . . . . . 917.12 A student that mistakenly believed her argument to be general . . . . . . . . . 917.13 A student who offered a correct deductive argument and identified it as convincing 917.14 A student who offered a correct deductive argument but still expressed doubts . 917.15 A deductive and an empirical argument for Task BIS . . . . . . . . . . . . . . 927.16 A circular and an empirical argument for Task BIS . . . . . . . . . . . . . . . 927.17 The figure used in Task BIS . . . . . . . . . . . . . . . . . . . . . . . . . . . 1037.18 The figure used in Task TRIMID . . . . . . . . . . . . . . . . . . . . . . . . . 1057.19 Sketch used by the teacher for the discussion of axioms . . . . . . . . . . . . . 1107.20 Students’ choices for own approach and best grade before and after our inter-
vention . . . . . . . . . . . . . . . . . . . . . . . . . . . . . . . . . . . . . . 1337.21 Validity Ratings of four arguments before our intervention . . . . . . . . . . . 135
v
LIST OF FIGURES
7.22 Validity Ratings of four arguments after our intervention . . . . . . . . . . . . 1367.23 Explanatory Power of four arguments before our intervention . . . . . . . . . . 1367.24 Explanatory Power of four arguments after our intervention . . . . . . . . . . . 137
vi
List of Tables
2.1 The Van Hiele levels of thinking . . . . . . . . . . . . . . . . . . . . . . . . . 72.2 The Van Hiele levels on which our study focuses . . . . . . . . . . . . . . . . 82.3 Correspondence between Van Hiele levels and Harel & Sowder proof schemes . 172.4 The stages of the learning sequence we propose for introducing students to proof 222.5 Strategies for introducing students to proof . . . . . . . . . . . . . . . . . . . . 23
4.1 Correspondence of the Van Hiele levels numbering between Fuys, Geddes, andTischler (1985) and van Hiele (1986) . . . . . . . . . . . . . . . . . . . . . . . 31
5.1 Codes for the Harel & Sowder proof schemes . . . . . . . . . . . . . . . . . . 405.2 Tasks used for the ‘inquiry’ phase . . . . . . . . . . . . . . . . . . . . . . . . 455.3 Tasks used for the ‘directed orientation’ phase . . . . . . . . . . . . . . . . . . 465.4 Methods used for the ‘explication’ phase . . . . . . . . . . . . . . . . . . . . . 475.5 Tasks used during the ‘free orientation’ phase . . . . . . . . . . . . . . . . . . 485.6 Hand-out used during the ‘integration’ phase . . . . . . . . . . . . . . . . . . 495.7 Tasks used for each Van Hiele teaching phase by concept . . . . . . . . . . . . 50
6.1 Term grades in Mathematics, and Van Hiele levels of the participating students 536.2 Timeline of teaching intervention . . . . . . . . . . . . . . . . . . . . . . . . . 546.3 Students’ absences during the intervention . . . . . . . . . . . . . . . . . . . . 55
7.1 Van Hiele levels of the participants before and after our intervention . . . . . . 687.2 Coding of students’ main proof schemes for all tasks . . . . . . . . . . . . . . 767.3 Coding of students’ proof scheme subcategories for all tasks . . . . . . . . . . 777.4 Variables used for the statistical analysis . . . . . . . . . . . . . . . . . . . . . 797.5 Correlation (1-tailed) between Van Hiele level and frequency of deductive Harel
& Sowder proof schemes at the beginning of the intervention . . . . . . . . . . 807.6 Correlation (1-tailed) between Van Hiele level and frequency of deductive Harel
& Sowder proof schemes at the end of the intervention . . . . . . . . . . . . . 807.7 Correlation (1-tailed) between progress in Van Hiele level and progress in Harel
& Sowder proof schemes . . . . . . . . . . . . . . . . . . . . . . . . . . . . . 817.8 Correlation (1-tailed) between progress in Van Hiele level and Harel & Sowder
proof schemes . . . . . . . . . . . . . . . . . . . . . . . . . . . . . . . . . . . 817.9 Kinds of arguments offered by the students for Task ANGLESUM . . . . . . . 837.10 Kinds of arguments offered by the students for Task QUAD . . . . . . . . . . . 907.11 Students who used inductive arguments for Task QUAD . . . . . . . . . . . . 91
vii
LIST OF TABLES
7.12 Students who used deductive arguments for Task QUAD . . . . . . . . . . . . 927.13 Kinds of arguments offered by the students for Task BIS . . . . . . . . . . . . 937.14 The kinds of students’ main proof schemes by task (in chronological order) . . 997.15 Answers to ‘classroom practice’ questions before the intervention . . . . . . . 1207.16 Answers to ‘classroom practice’ questions after the intervention . . . . . . . . 1217.17 Answers to questions related to students’ perceptions about mathematics and
geometry before the intervention . . . . . . . . . . . . . . . . . . . . . . . . . 1227.18 Answers to questions related to students’ perceptions about mathematics and
geometry after the intervention . . . . . . . . . . . . . . . . . . . . . . . . . . 1227.19 Answers to questions related to the nature of geometric proofs, reasoning and
constructions before the intervention . . . . . . . . . . . . . . . . . . . . . . . 1227.20 Answers to questions related to the nature of geometric proofs, reasoning and
constructions after the intervention . . . . . . . . . . . . . . . . . . . . . . . . 1237.21 Categories of answers for the question: ‘Do you believe that what we have done
in these lessons is useful? In what way?’ . . . . . . . . . . . . . . . . . . . . . 1267.22 Categories of answers for the question: ‘Do you believe that the lessons have
affected the ideas you have about mathematics? If yes, how?’ . . . . . . . . . . 1287.23 Categories of answers for the question: ‘Do you believe that the lessons have
affected the ideas you have about proof? If yes, how?’ . . . . . . . . . . . . . 1307.24 Distribution of arguments chosen in Task CHOOSING before the intervention . 1317.25 Distribution of arguments chosen in Task CHOOSING after the intervention . . 1327.26 Types of arguments in Task CHOOSING . . . . . . . . . . . . . . . . . . . . . 1327.27 Valitidy Ratings (VR) scoring scheme . . . . . . . . . . . . . . . . . . . . . . 1357.28 Explanatory Power (EP) scoring scheme . . . . . . . . . . . . . . . . . . . . . 1357.29 Generality rating of the statement ‘The sum of the angles of a triangle is 180°’
before and after our intervention . . . . . . . . . . . . . . . . . . . . . . . . . 1377.30 Assessing the role of proof before and after our intervention . . . . . . . . . . 1387.31 Variables used . . . . . . . . . . . . . . . . . . . . . . . . . . . . . . . . . . . 1397.32 Change in students’ VR scores as they move from the descriptive to the theo-
retical Van Hiele level . . . . . . . . . . . . . . . . . . . . . . . . . . . . . . . 1397.33 Change in students’ VR scores for the students that did not make the move from
the descriptive to the theoretical Van Hiele level . . . . . . . . . . . . . . . . . 1407.34 Change in students’ VR scores as they move from the empirical to the deductive
Harel & Sowder proof schemes . . . . . . . . . . . . . . . . . . . . . . . . . . 1417.35 Change in VR scores for the students that did not make the move from the em-
pirical to the deductive Harel & Sowder proof schemes . . . . . . . . . . . . . 1417.36 Change in students’ EP scores as they move from the descriptive to the theoret-
ical Van Hiele level . . . . . . . . . . . . . . . . . . . . . . . . . . . . . . . . 1427.37 Change in students’ EP scores for the students that did not make the move from
the descriptive to the theoretical Van Hiele level . . . . . . . . . . . . . . . . . 1437.38 Change in students’ EP scores as they move from the empirical to the deductive
Harel & Sowder proof schemes . . . . . . . . . . . . . . . . . . . . . . . . . . 1447.39 Change in EP scores for the students that did not make the move from the em-
pirical to the deductive Harel & Sowder proof schemes . . . . . . . . . . . . . 144
viii

LIST OF TABLES
7.40 Change in students’ beliefs about convincingness of arguments as they movefrom the descriptive to the theoretical Van Hiele level . . . . . . . . . . . . . . 146
7.41 Change in students’ beliefs about convincingness of arguments for the studentsthat did not make the move from the descriptive to the theoretical Van Hiele level146
D.1 Distribution of answers regarding the VR and EP of Stamatis’s (Dylan’s) argu-ment before our intervention . . . . . . . . . . . . . . . . . . . . . . . . . . . 256
D.2 Distribution of answers regarding the VR and EP of Stamatis’s (Dylan’s) argu-ment after our intervention . . . . . . . . . . . . . . . . . . . . . . . . . . . . 256
D.3 Distribution of answers regarding the VR and EP of Georgia’s (Cynthia’s) ar-gument before our intervention . . . . . . . . . . . . . . . . . . . . . . . . . . 256
D.4 Distribution of answers regarding the VR and EP of Georgia’s (Cynthia’s) ar-gument after our intervention . . . . . . . . . . . . . . . . . . . . . . . . . . . 257
D.5 Distribution of answers regarding the VR and EP of Lefteris’s (Ewan’s) argu-ment before our intervention . . . . . . . . . . . . . . . . . . . . . . . . . . . 257
D.6 Distribution of answers regarding the VR and EP of Lefteris’s (Ewan’s) argu-ment after our intervention . . . . . . . . . . . . . . . . . . . . . . . . . . . . 257
D.7 Distribution of answers regarding the VR and EP of Kalliopi’s argument beforeour intervention . . . . . . . . . . . . . . . . . . . . . . . . . . . . . . . . . . 257
D.8 Distribution of answers regarding the VR and EP of Kalliopi’s argument afterour intervention . . . . . . . . . . . . . . . . . . . . . . . . . . . . . . . . . . 258
D.9 Validity Rating (VR) and Explanatory Power (EP) of the various arguments be-fore and after the intervention . . . . . . . . . . . . . . . . . . . . . . . . . . . 258
D.10 Categories of answers for the question: ‘Do you believe you learned somethingnew in the lessons we had? If yes, what?’ . . . . . . . . . . . . . . . . . . . . 260
D.11 Categories of answers for the question: ‘Did you like the lessons? Would youprefer that anything would be done in a different way? Explain’ . . . . . . . . 261
D.12 Categories of answers for the question: ‘If we had some more lessons togetherfor the coming weeks, which would be the subject that you would prefer todiscuss and why?’ . . . . . . . . . . . . . . . . . . . . . . . . . . . . . . . . . 263
D.13 Categories of answers for the question: ‘Do you believe that what we have donein these lessons is useful? In what way?’ . . . . . . . . . . . . . . . . . . . . . 264
ix

LIST OF TABLES
x
Chapter 1
Introduction
My interest in the topic of this thesis dates back to my years as a mathematics student in Greece,when I first started wondering about the logic behind mathematical proofs. What was it thatmade a proof correct and indisputable, and what was the relation between mathematical proofsand everyday reasoning? More generally, I was interested in investigating the nature of math-ematics, which I thought was to a great extent determined by the notions of proof, truth andargumentation. Back then I had already developed a strong interest in education, and I hopedto become able someday to explain the nature of mathematics to young people who were strug-gling to find some meaning in the often distorted image of mathematics presented to them inschool.
This brought me to Amsterdam, to attend a Masters degree in Logic, where I had the oppor-tunity to study several interesting and interrelated fields such as mathematical logic (in a sensemuch wider than that of classical propositional/predicate logic as usually taught at undergrad-uate level), philosophy of language, philosophy of logic, decision theory, formal linguistics,cognitive science and psychology of reasoning. Within this context I chose to examine in myMSc in Logic thesis (Grigoriadou, 2009) the issue of rationality and of logical reasoning fromthe perspective of philosophy, cognitive science, and psychology of reasoning. The natural nextstep was to pursue a further study in education, in an attempt to use my knowledge from Logicto understand how students reason while proving mathematical statements, what meaning thisprocess of proof has for them, and how a teacher can effectively guide students through theprocess of learning how to construct valid arguments.
The focus of this research project is therefore the teaching and learning of Euclidean ge-ometry in school, and specifically in the Greek school. The choice of geometry came quitenaturally since the axiomatic system of Euclidean geometry is both a good example of an ax-iomatic system taught in school and is also tied to an interpretation within physical space whichmakes it easier to understand for students, since it is less abstract than other fields. The choiceof Greece as the context of my research also came rather naturally. Euclidean geometry in theGreek school holds a special place in the curriculum and is taught as a separate subject, whichdoes not always happen in other countries. The way geometry is taught in Greece, however, istraditional: axioms, theorems and propositions are imposed on students instead of letting themdiscover them for themselves. Knowing this, and also having personal experience as a studentin the Greek educational system, I wanted to offer Greek students a learning experience which,unlike those of their ordinary school, would help them discover geometry by themselves and ex-
1

Chapter 1. Introduction
perience the activities that real mathematicians do: conjecturing, formulating propositions andproviding valid arguments for their conjectures. At the same time this would help me examinethe students’ reasoning while they engaged in proving activities.
The research study we describe in this thesis is therefore focused on students’ reasoningwhile doing geometrical proofs, and on a teaching strategy that aims at assisting students inthinking about and doing geometry as a mathematician does. Earlier research on the same sub-ject is plentiful and studying it helped in the formulation of our research questions. In Chapter 2we give an overview of the most important past research studies and we describe in detail howthey helped us in formulating our own research questions and hypotheses, which are presentedin Chapter 3. The context of this study, that is, the Greek educational system and the teaching ofgeometry in the Greek Gymnasium, is described in Chapter 4. In Chapter 5 we offer a detailedpresentation of the methodology we followed, the design of the research and the analysis frame-work. Before presenting the detailed results of our study, in Chapter 7, we offer to the readera diary of the intervention (Chapter 6) and a timeline of the research study in order to give aclearer picture of what happened when, and what the reactions of the students were. Finally,in Chapter 8 we summarise and discuss our results and we give recommendations for futureresearch.
2
Chapter 2
Theoretical Framework
2.1 The meaning of proof
Proof is thought to be one of the building blocks of mathematics, since it is via proofs that math-ematical truths are established. It is commonly accepted that proof occupies a central positionin mathematics (Arsac, 2007). But, what exactly is considered as proof in mathematics?
Most of us are familiar with the everyday, informal meaning of the word ‘proof.’ Often,when we face a claim which is not immediately obvious to us, we ask for stronger argumentsin order to be convinced. In this informal sense, ‘proving’ means ‘convincing.’ Besides this in-formal, conceptual sense of proof there exists a more formal, mathematical sense which is alsoconnected with a specific syntactic structure (Rav, 1999, p. 11). In this formal sense, mathemati-cal proof is the systematic derivation of a conclusion based on a set of axioms by following rulesof logic. Proof in this sense is spelled out by following a rigorous syntactic structure commonlyaccepted by the community of mathematicians. Mathematicians tend to consider formal proofs(in the sense of derivations) as the only mathematically acceptable proofs and claim that outsideaxiomatic systems there is no rigorous mathematics (Freudenthal, 1973, p. 149). However, oftenformal proofs do not “fit mathematical practice” and are not “capable of explaining the source ofmathematical knowledge and the dynamics of its growth” (Rav, 1999, p. 15). Rav (1999, p. 12)gives an illuminative metaphor for illustrating the difference between conceptual proofs (whathe calls “proofs”) and their formal counterparts:
Metaphorically speaking, the relation between a proof and its formalised versionis about the same as the relationship between a full-view photo of a human beingand a radiograph of that person. Surely, if one is interested in the skeletal structureof an individual for diagnostic purposes, then the X-ray picture yields valuable in-formation. But from a radiograph one cannot reconstruct the ordinary full-fledgedview of the individual.
When it comes to education, and specifically to the teaching of proof, the teacher shouldthink about which kind of proof would be more meaningful for students. Are rigorous, formalproofs accessible to students who are being introduced to the world of mathematics? Accordingto Freudenthal (1973, p. 148), students can learn mathematical rigour only by reinvention. Thismeans that students should first understand and experience the need for proofs and the informal
3
Chapter 2. Theoretical Framework
(conceptual) meaning of proofs, and only after that will they be able to abstract from the con-ceptual meaning and move to the rigor of the syntactic structure of formal proofs. Accordingto Freudenthal (1973, p. 150) experimental mathematics (or the mathematics of free discoveryas he calls it) “is much more important than that which is confined to axioms imposed by theteacher or textbook author, and there is no reason to claim that it is any less rigorous. There arelevels of rigour and for each subject matter there is a level of rigour adapted to it; the learnershould pass through the levels and acquire their rigour.”
Whether formal or informal, proof has certain functions. According to Bell (1976, p. 24),there are three main functions of mathematical proof:
The first is verification or justification, concerned with the truth of a proposition;the second is illumination, in that a good proof is expected to convey an insightinto why the proposition is true; this does not affect the validity of a proof, butits presence in a proof is aesthetically pleasing. The third sense of proof is themost characteristically mathematical, that of systematisation, i.e. the organisationof results into a deductive system of axioms, major concepts and theorems, andminor results derived from these.
In order to understand and be able to produce proofs in geometry all three functions men-tioned by Bell need to be understood and experienced. The third function is concerned with theprocess of deduction and it will be one of the main focus points of our study. In mathematicsdeductive reasoning plays a central role and is very often contrasted with inductive reasoningwhich is considered less mathematically strong. Inductive reasoning, however, employs quitestrongly the second function of proof: illumination. Inductive arguments are based on obser-vations, and as such they serve for getting an insight into which mathematical claims may begenerally true. It seems that all three functions cited above are equally important for arriving atthe understanding of proofs in geometry (Freudenthal, 1973, p. 149). I will discuss further thiswell-known distinction between deductive and inductive reasoning in the following section.
2.2 Deductive versus inductive reasoning
Deduction is a specific kind of reasoning concerned with the yielding of true conclusions fromtrue given premises, or else with the yielding of valid conclusions (Johnson-Laird, 1999).1 Inother words, deductive reasoning is about drawing specific conclusions from true given premisesby following certain rules of logic. Inductive reasoning on the other hand, is a way of coming upwith general conclusions from specific observations. These observations may support the con-clusion but they do not ensure it. This is because there might exist counterexamples which wehaven’t observed yet and which would make our conclusion actually wrong.2 Thus, although in-ductive reasoning might serve as a tool for coming up with interesting conjectures and it is closer
1A classical example of deductive reasoning comes from Aristotle, the ‘father’ of logic and deductive reasoning:“All men are mortal. Socrates is a man. Therefore, Socrates is mortal.” One can easily see that in case the premises(the two first sentences) of this argument are true, then the conclusion (the last sentence) of the argument is also true.We can say thus that the above argument scheme is valid—although of course this does not necessarily give us anyinformation about whether the specific premises of this argument are actually true.
2For example, if we measure all angles of a specific triangle we will find out (given that our measurements arevery accurate) that they add up to 180°. If we repeat this measurement and calculation for more triangles, we willfind out that this is the case for any other type of triangle that we come up with. From this observation one could
4

2.3. Geometry as a deductive science
to our intuition, it certainly gives less valid outcomes when it comes to formal mathematics thandeductive reasoning does.
This of course should not be interpreted as implying that inductive reasoning is of less valuefor mathematics in general. Deductive reasoning is indeed the only way for mathematicians toestablish truth. However, for finding truth, empirical and intuitive methods, like induction, arenecessary and helpful (Clements & Battista, 1992, p. 437). This observation is very importantfor mathematics education. Young students most often use inductive, intuitive methods forreasoning about mathematics, which led Schoenfeld characterize them as “naive empiricists”(Schoenfeld, 1985, p. 41). Given these observations, the purpose ofmathematics teaching shouldpartly be to show students how to use in a productive way their sense of inductive reasoning ontheir way to understanding the need for deductive reasoning inmathematics. This process is afterall similar to the way mathematics was historically developed, as Poincaré (1900, pp. 123-124)also suggests (as cited by Freudenthal (1973, p. 147)):
When mathematical science becomes rigorous it assumes an artificial charac-ter which cannot be overlooked. It forgets about its historic origin: it shows howproblems can be solved but not how and why they are posed.
This shows that logic does not suffice; the science of proofs is not the wholescience, intuition is assigned a complementary part, I would say, as counterpart orantidote of logic.
And especially when the deductive system of geometry is taught to students, it is not ap-propriate to introduce students to the deductive part of the system without first showing themthe importance of the role of induction in the creation of this system. In the words of Kruyt-bosch (1936), as cited in the translated version of Dina van Hiele’s dissertation (Fuys, Geddes,& Tischler, 1984, p. 33), “The stiff deductive teaching of mathematics is wrong, not only froma didactic perspective, but also from an historic perspective. Many important results have beenfound through the inductive method. Why then should these be displaced to an a posteriori roleby the deductive method?” Dina van Hiele supports this claim and adds that “a system of teach-ing that has the tendency to be based exclusively on deduction or on induction is wrong. In theinitial instruction neither purely deductive nor purely inductive reasoning is appropriate. Whatis important here is that the pupils establish relations between empirically obtained results, andthat they gain insight into the empiricism” (Fuys et al., 1984, p. 190).
2.3 Geometry as a deductive science
Geometry is a typical example of a field where deductive reasoning occupies a central position.From the axioms of geometry, and by using certain rules, one proves propositions and theo-rems. The focus of this research study will be the area of geometry, and we will look closelyat the process of deductive reasoning. One of the aims will be to examine students’ reasoningat different levels of thinking3 as well as their reasoning during the transition from one level of
make the generalization that for any triangle, the sum of its angles gives 180°. This is an example of inductivereasoning. However, this kind of reasoning is not considered to provide a valid mathematical proof since a singlecounterexample would be enough to make the conclusion false.
3By ‘levels of thinking’ we mean the levels of thinking in geometry as those were defined by the Van Hieles(van Hiele, 1986). These levels will be discussed in more detail in the following sections.
5

Chapter 2. Theoretical Framework
thinking to the next. This transition is not immediately obvious. The reason is that “the abil-ity to read abstract mathematics and do proofs depends on a complex constellation of beliefs,knowledge, and cognitive skills” (Moore, 1994, p. 250). Therefore, to understand this transitionone needs to look at students’ cognitive skills, knowledge background, and beliefs about math-ematics and about the world. I will now give a brief overview of some of the relevant researchwithin education which will be useful for our study.
2.4 Previous research on students’ geometrical reasoning
Lately there has been an increasing interest in research which looks at students’ reasoning andthe levels of their cognitive development (Hanna, 2000). It is generally observed that studentshave difficulties with understanding the deductive process and with appreciating the meaningof mathematical (geometrical or other) proof (Usiskin, 1982; Senk, 1985; Schoenfeld, 1985;Porteous, 1986; Clements & Battista, 1992; Moore, 1994; Coe & Ruthven, 1994; Harel & Sow-der, 1998; Jones, 2000; Weber, 2001; Szendrei-Radnai & Török, 2007; Hoyles & Healy, 2007;Knuth, Choppin, & Bieda, 2009). Of specific interest for our study is that area of research whichfocuses on students’ reasoning while they engage in geometrical proofs. Piaget (1953) was oneof the first to give a thorough account of the ability of people to make inferences (Johnson-Laird, 1999, p. 110), an ability which is rather fundamental for proving. However, althoughthere is plenty of research the last fifty year which identifies the ‘problem’ of students to under-stand and appreciate deductive proof, there is not enough research on “students’ opportunitiesto develop deductive reasoning and to learn skills for evaluating the validity of others’ math-ematical arguments” (Bieda, 2009, p. 351). Our intention is therefore to use some of the mostprominent theories describing students’ thinking while engaging with mathematical proof and,based on these theories, to carry out a research project which would aim at providing to studentsopportunities to develop deductive reasoning. These theories will be described in what follows.
2.4.1 The Van Hiele theory
Almost parallel to Piaget, in 1957, a pair of Dutch mathematicians, Pierre and Dina van Hiele,noted that there exist distinct levels of thinking during the process of learning geometry (Fuys,Geddes, & Tischler, 1985, p. 1). Since then the Van Hieles have produced many writings ex-plaining the idea of the levels, and the Van Hiele levels have been established in the mathematicseducation communities. In his writings, Pierre van Hiele offers an explanation of the Van Hielelevels and their relation to the teaching of geometry (with a primary interest in secondary educa-tion). Given the focus of our research (students’ geometrical reasoning) and the wide acceptanceof the Van Hiele theory, we chose to use it as a basic element of our research. Below we give amore detailed description of the theory.
Table 2.1 shows the Van Hiele levels as described by van Hiele (1986, p. 53). At the visuallevel students are able to identify, name, compare and operate on geometric figures (Fuys et al.,1985, p. 5). At the descriptive level students are able to “apply operative properties of a wellknown figure” (van Hiele, 1986, p.41). For example, students can recognize figures by theirproperties rather than by how they look, and they empirically discover classes of figures whichare defined by the properties of these figures. Moreover, at this level the students are able touse informal arguments in order to operate on the properties they discovered. According to
6

2.4. Previous research on students’ geometrical reasoning
Van Hiele, “the transition from the base level to the second level is one from a level withouta network of relations to a level that has such a network” (p. 49). At the theoretical level, thestudent “deals with the structures of the descriptive level” (p. 50). During the transition fromthe descriptive to the theoretical level “the ordering of properties of geometric figures is theobject of study,” and eventually, when the theoretical level is reached, “figures are understoodas an ordered set of properties” (p. 63). Students are able to reason deductively and understandthe axiomatic system of Euclidean geometry. The two final levels, formal logic and nature oflogical laws, are not encountered often at school level. More specifically, levels like the fifthor higher are difficult to discern (p. 47) and, according to Van Hiele, checking whether studentshave attained the fifth or higher levels can only be of theoretical value (p. 47).
First level: VisualSecond level: DescriptiveThird level: TheoreticalFourth level: Formal LogicFifth level: The nature of logical laws
Table 2.1: The Van Hiele levels of thinking.
At every Van Hiele level of thinking the student is able to internally organize the previ-ous level (van Dormolen, 1977, p. 32). Moreover, the Van Hiele levels of thinking have twoimportant properties; they are discontinuous and hierarchical:
[T]he most distinctive property of the levels of thinking is their discontinuity, thelack of coherence between their networks and relations [their structures]. (vanHiele, 1986, p. 49)
The ways of thinking of the base level, the second level, and the third level havea hierarchic arrangement. Thinking at the second level is not possible without thatof the base level; thinking at the third level is not possible without thinking at thesecond level. (p. 51)
In addition, the most important characteristics of the transition between consequent levelsare that it is not a natural process and that it depends on language: “The transition from onelevel to the other is not a natural process; it takes place under the influence of a teaching-learningprogram. […] The transition is not possible without the learning of a new language.” (van Hiele,1986, p. 50).
From the five Van Hiele levels described in Table 2.1 the first four are the ones encounteredat school level (van Hiele, 1986, p. 47). Particularly at the lower secondary school (ages 12 to15) students do not even reach level 4 (Formal Logic). Therefore, although we are not opposedto the existence of the other two levels of thinking (fourth and fifth), the first three Van Hielelevels (see Table 2.2) are the ones that we will use in our research.
2.4.2 Schoenfeld on students’ beliefs about proof
Schoenfeld is another researcher in the area of education a contemporary of Piaget and the VanHieles who was interested in explaining students’ behaviour while solving mathematical prob-lems. Schoenfeld was particularly interested in students’ beliefs about proof and about the nature
7

Chapter 2. Theoretical Framework
Label Level descriptionvH1: VisualvH2: DescriptivevH3: Theoretical
Table 2.2: The Van Hiele levels on which our study focuses.
of mathematics, and in how these beliefs affect the way students do mathematics. Schoenfeld(1989) conducted a research project involving secondary geometry students, which revealedthat, although the students were highly motivated and scored generally high in the assessments,they had the following beliefs and expectations: they expected to be able to solve very fast themathematical problems they were asked to solve, and if they could not then they believed it wasimpossible to solve them; “they behave on construction problems as though their proof-relatedknowledge were nonexistent”; and, “they claim that mathematics is best learned by memoriza-tion” (pp. 348–349).
According to Schoenfeld students appear to be “pure empiricists” (Schoenfeld, 1985, p. 41and p. 160), that is, students base their solutions to mathematical problems on empirical ob-servations rather than on valid logical arguments. Schoenfeld (1985) has made an attempt toconstruct a model for the kind of ‘axioms’ students use while solving mathematical problems.It turns out that students’ behaviour fits this model, which Schoenfeld calls the model of pureempiricism and which is comprised not of the logical/deductive axioms we know, but by a setof attitudes which Schoenfeld calls “empirical axioms” (for example, one such ‘axiom’ is that“insight and intuition come from drawings. The more accurate the drawing, the more likely oneis to discover useful information” Schoenfeld, 1985, p. 160).
The issue of how students reason, especially when they engage in geometrical, deductiveproofs, is still to this day at the center of educational research. More recent work in this areaincludes: Hanna, 1990; Clements and Battista, 1992; Chazan, 1993; Moore, 1994; Harel andSowder, 1998; Stanovich and West, 2000; Recio and Godino, 2001; Hoyles and Kücheman,2002; Harel, 2007; Duval, 2006, 2007; A. J. Stylianides, 2007; Tall, 2008; G. J. Stylianidesand A. J. Stylianides, 2008; A. J. Stylianides and G. J. Stylianides, 2009. Moreover, severalprojects have been funded for investigating students’ reasoning related to proof (for instancethe Longitudinal Proof Project4 which is a continuation of the Justifying and Proving in SchoolMathematics5 project, the Proof Project,6 etc.), and a Newsletter exists especially for the teach-ing and learning of mathematical proof7 which includes a section with relevant bibliography.
2.4.3 The Harel & Sowder proof schemes
From the research cited above, Harel and Sowder (1998) and Harel (2007) will be especiallysignificant for our study. After examining the literature we chose to use the Harel and Sowderresearch in our theoretical framework because they offer a detailed categorisation of students’attitudes while they prove in mathematics. This would enable us to have a tool for identifyingthe kinds of reasonings of students who learn geometry. The details of the Harel and Sowder
4http://www.mathsmed.co.uk/ioe-proof/5http://www.mathsmed.co.uk/ioe-proof/proof.htm6http://www.tpp.umassd.edu/7http://www.lettredelapreuve.it/
8
2.4. Previous research on students’ geometrical reasoning
research are explained below.Harel and Sowder (1998) have created a categorization of cognitive schemes called ‘proof
schemes’ which have been consistently observed in their experiments. Each category of proofschemes represents “a cognitive stage, an intellectual ability, in students’ mathematical devel-opment” (p. 244). Thus, the classification of proof schemes offered by Harel and Sowder is notmerely a classification of the content or the method of proofs, and it is not an a priori classifica-tion. Rather, it is based entirely on the observations of students’ conceptions and actions whileattempting to do mathematical proofs, that is, when attempting to find convincing arguments forsupporting the truth of mathematical statements. In the authors’ words, “it is the individual’sscheme of doubts, truths, and convictions, in a given social context” that underlies their charac-terization of proof schemes (p. 244). The proof schemes of Harel and Sowder were later revisedby Harel (2007). The three main (revised) categories of proof schemes are the following:
• External conviction (EXT)
• Empirical (EMP)
• Deductive (DED)
In the external conviction proof schemes the students believe that mathematical justificationis all about ritual and form (Harel & Sowder, 1998, p. 245). Proving in this category mightdepend on (a) the authority of the teacher, (b) the appearance of an argument or (c) mere symbolmanipulation (Harel, 2007, pp. 66-67). These three cases constitute the three different proofschemes which belong to the External Conviction category.
In the empirical proof schemes the students’ attitudes depend heavily on physical facts orsensory experiences (Harel & Sowder, 1998, p. 252). We have two main subcategories here:inductive and perceptual proof schemes. In the inductive proof schemes the students evalu-ate a conjecture based on one or more specific cases which they generalize over all cases. Inthe perceptual proof schemes students “ignore transformations on objects or are incapable ofanticipating results of transformations completely or accurately” (p. 255).8
Finally, the category of deductive proof schemes consists of two main subcategories: thetransformational proof schemes, which share the characteristics of generality, operational thoughtand logical inference Harel (2007, p. 67), and the modern axiomatic proof schemes which in-clude the same characteristics just described but include others too which we will discuss inmore detail later. In Figure 2.1 the detailed diagram of the Harel and Sowder (1998) proofschemes is provided, whereas in Figure 2.2 we offer a diagram of the revised deductive proofscheme subcategories and is similar to the one given in Figure 2.1. The diagram of Figure 2.2 isnot actually offered by Harel, but we created it based on our understanding of the revised proofschemes as they are described by Harel (2007).
Let us now look at the Harel and Sowder proof schemes in more detail. In what follows wewill describe each of the subcategories of the three main proof schemes described above.
8Here Harel and Sowder draw on Piaget and Inhelder, who describe such mental images as constituting “animitation of actions that can be carried out in thought …[but they] cannot be adequately visualized all the way to[their] ultimate conclusion before [they have been performed]” (Piaget & Inhelder, 1967, p. 259) as quoted in (Harel& Sowder, 1998, p. 252).
9

Chapter 2. Theoretical Framework
Figure 2.1: The Harel & Sowder proof schemes (Harel & Sowder, 1998, p. 245).
....Deductive Proof Schemes.
.... ..Modern Axiomatic.
.... ..Axiomatizing.
.... ..Structural Symbolic.
....Structural
.
....Transformational.
.... ..Generic
.
.... ..Contextual.
.... ..Arithmetic Symbolic.
....Greek Axiomatic
..... ..Constructive
.....Causal
Figure 2.2: The revised Harel & Sowder deductive proof schemes.
The External Conviction Proof Schemes
• Ritual (RIT)A student is considered to have a ‘ritual’ proof scheme when he or she accepts a proofas valid only when it is written in a specific form which looks ‘mathematical’ althoughit might be a wrong argument. The same category includes students who would reject acorrect proof as wrong because it does not include any mathematical notation. As Harel
10
2.4. Previous research on students’ geometrical reasoning
and Sowder (1998) state, often students wonder whether specific arguments can be con-sidered as proofs because they do not look like proofs. “Typically, such doubts are raisedwhen the argument is not communicated via mathematical notations and does not includesymbolic expressions or computations” (p. 246).
• Authoritarian (AUTH)A student with the authoritarian proof scheme believes a proof to be valid only becausethe book or the teacher (i. e., an authority) says so. This proof scheme is re-enforced bycurricula which stress truth in mathematics but do not stress the reasons for truth (justifi-cation) in mathematics (Harel & Sowder, 1998, p. 247). According to Harel and Sowderthe authoritarian proof scheme has (at least) five observed manifestations:
1. Memorizing and applying ready-made formulas as the main expectation.2. Asking for help for a problem without first making an attempt to solve it.3. When a sentence is called a ‘theorem’ students stop trying to prove it.4. Proving a certain statement by rephrasing it into a statement that is a fact.5. Being reluctant to challenge the teacher’s justification of a conjecture by asking
questions.
• Symbolic (SYMB)The symbolic proof scheme covers those attitudes where students blindly use symbolswithout considering their meaning. As Harel and Sowder put it, “the main characteristicof the symbolic reasoning is the behavior of approaching the solution of a problemwithoutfirst comprehending its meaning, that is, without building a coherent image of the problemsituation” (Harel & Sowder, 1998, p. 251).
The Empirical Proof Schemes
• Inductive (IND)According to Harel and Sowder students who possess the inductive proof scheme arguefor the truth of a conjecture by evaluating the conjecture only in a few specific cases, andfrom there they conclude that the conjecture holds for the general case. For example, astudent that measures the sum of the angles of a few specific triangles finds them 180°andhence concludes that the sum will be 180°for all triangles, has an inductive proof scheme.
• Perceptual (PER)In the perceptual proof scheme the transformations of an image are not anticipated, thusthe proof becomes specific to the figure drawn. An example of this proof scheme is givenin Harel and Sowder (1998, p. 256), where a student makes an attempt to prove that themidpoints of any isosceles trapezoid form a rhombus. In figure 2.3 we can see the shapethat the teacher had drawn on the board.Based on her own figure, the student claimed that she proved that FH and EG are con-gruent by showing that triangles FEH and HEG are congruent. This student came to ageneral conclusion based on her perceptual observations made for her own figure, that is,based on observations regarding a specific figure.
11

Chapter 2. Theoretical Framework
Figure 2.3: Figure accompanying a proof.
The Deductive Proof Schemes
The deductive proof schemes “validate conjectures by means of logical deductions” (Harel &Sowder, 1998, p. 258) and are divided into two main categories: The transformational proofschemes and the modern axiomatic proof schemes. We will look at these two categories andtheir subcategories separately.
• Transformational (TRAN)The three essential characteristics of transformational proof schemes (Harel, 2007, p. 67)are:
1. Generality (the individual understands that the goal is to prove a ‘for all’ argumentand not an argument relevant only to specific cases),
2. Operational thought (the individual has the ability to set goals and sub-goals and toanticipate outcomes while proving),
3. Logical inference (the individual understands that mathematical proof is based onrules of logic).
Moreover, a distinctive characteristic of transformational proofs is that the operationsmade on the objects of the proof involve transformations of images by means of deduction(Harel & Sowder, 1998, p. 258). In other words, people possessing a transformationalproof scheme are able to foresee the changes in an object and how these will affect thevalidity of an argument. Based on certain restrictions observed in the proof schemes of thestudents who participated in the research of Harel and Sowder, the transformational proofschemes were divided into three subcategories depending on the kind of the restriction.The restrictions were “on either the conjecture, the generality of the justification, or themode of justification,” (p. 267) and the subcategories were named respectively contextual,generic, or constructive/causal. In the revised version of the proof schemes (Harel, 2007)the transformational proof schemes were divided into four categories instead of three,again with the same restrictions. These were: Causal, Constructive, Contextual (includesthe Greek Axiomatic and the Arithmetic Symbolic proof schemes) and Generic.
– Causal (CAUS)A causal proof scheme is one that reveals the cause of a conjecture. For example,
12
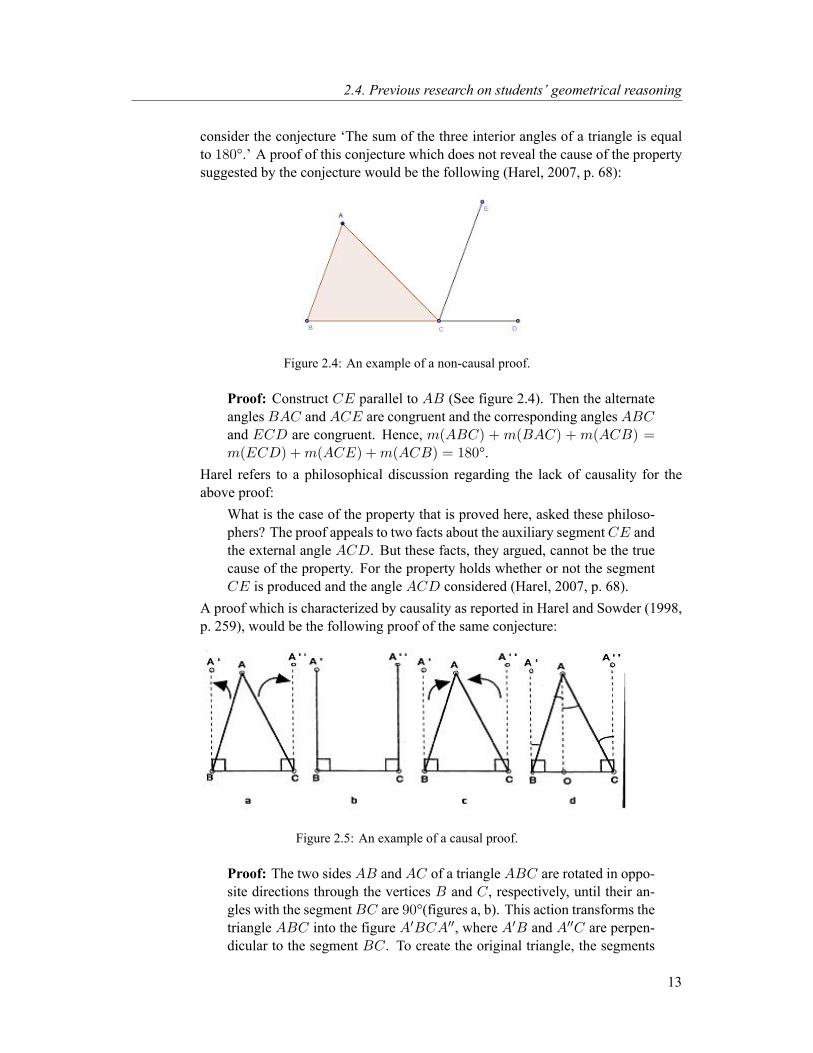
2.4. Previous research on students’ geometrical reasoning
consider the conjecture ‘The sum of the three interior angles of a triangle is equalto 180°.’ A proof of this conjecture which does not reveal the cause of the propertysuggested by the conjecture would be the following (Harel, 2007, p. 68):
Figure 2.4: An example of a non-causal proof.
Proof: Construct CE parallel to AB (See figure 2.4). Then the alternateangles BAC and ACE are congruent and the corresponding angles ABCand ECD are congruent. Hence, m(ABC) + m(BAC) + m(ACB) =m(ECD) +m(ACE) +m(ACB) = 180°.
Harel refers to a philosophical discussion regarding the lack of causality for theabove proof:
What is the case of the property that is proved here, asked these philoso-phers? The proof appeals to two facts about the auxiliary segmentCE andthe external angle ACD. But these facts, they argued, cannot be the truecause of the property. For the property holds whether or not the segmentCE is produced and the angle ACD considered (Harel, 2007, p. 68).
A proof which is characterized by causality as reported in Harel and Sowder (1998,p. 259), would be the following proof of the same conjecture:
Figure 2.5: An example of a causal proof.
Proof: The two sides AB and AC of a triangle ABC are rotated in oppo-site directions through the vertices B and C, respectively, until their an-gles with the segmentBC are 90°(figures a, b). This action transforms thetriangle ABC into the figure A′BCA′′, where A′B and A′′C are perpen-dicular to the segment BC. To create the original triangle, the segments
13
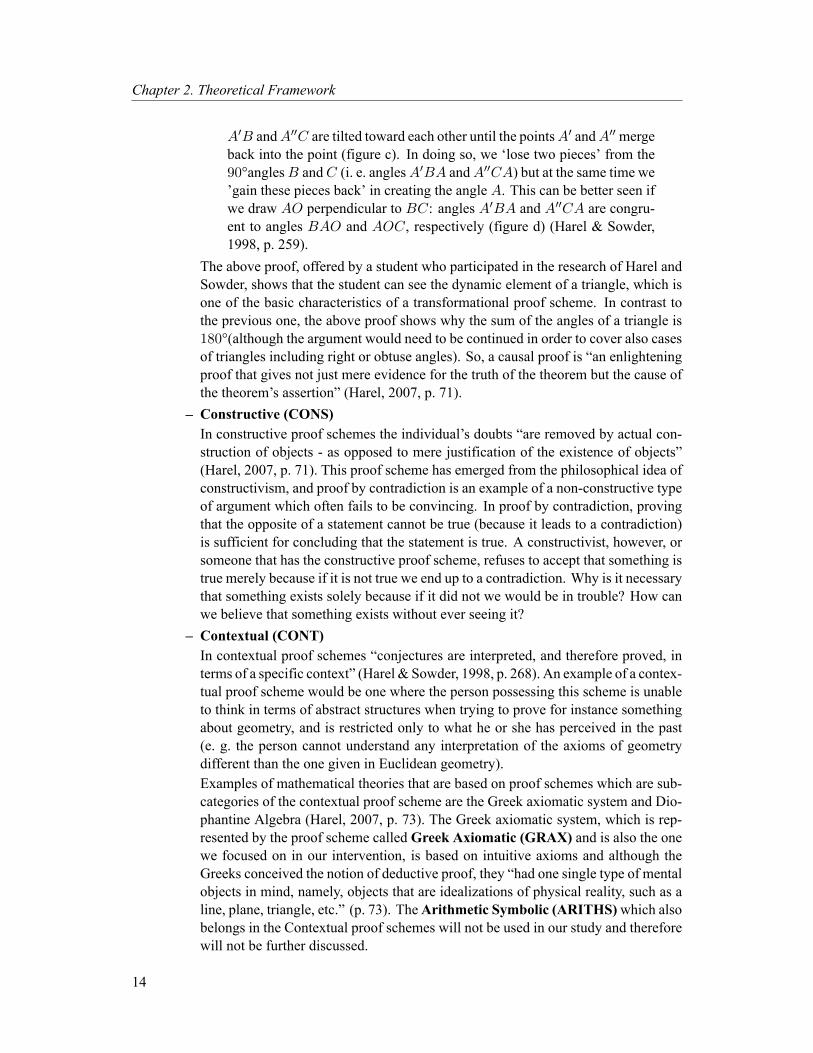
Chapter 2. Theoretical Framework
A′B andA′′C are tilted toward each other until the pointsA′ andA′′ mergeback into the point (figure c). In doing so, we ‘lose two pieces’ from the90°anglesB andC (i. e. anglesA′BA andA′′CA) but at the same time we’gain these pieces back’ in creating the angle A. This can be better seen ifwe draw AO perpendicular to BC: angles A′BA and A′′CA are congru-ent to angles BAO and AOC, respectively (figure d) (Harel & Sowder,1998, p. 259).
The above proof, offered by a student who participated in the research of Harel andSowder, shows that the student can see the dynamic element of a triangle, which isone of the basic characteristics of a transformational proof scheme. In contrast tothe previous one, the above proof shows why the sum of the angles of a triangle is180°(although the argument would need to be continued in order to cover also casesof triangles including right or obtuse angles). So, a causal proof is “an enlighteningproof that gives not just mere evidence for the truth of the theorem but the cause ofthe theorem’s assertion” (Harel, 2007, p. 71).
– Constructive (CONS)In constructive proof schemes the individual’s doubts “are removed by actual con-struction of objects - as opposed to mere justification of the existence of objects”(Harel, 2007, p. 71). This proof scheme has emerged from the philosophical idea ofconstructivism, and proof by contradiction is an example of a non-constructive typeof argument which often fails to be convincing. In proof by contradiction, provingthat the opposite of a statement cannot be true (because it leads to a contradiction)is sufficient for concluding that the statement is true. A constructivist, however, orsomeone that has the constructive proof scheme, refuses to accept that something istrue merely because if it is not true we end up to a contradiction. Why is it necessarythat something exists solely because if it did not we would be in trouble? How canwe believe that something exists without ever seeing it?
– Contextual (CONT)In contextual proof schemes “conjectures are interpreted, and therefore proved, interms of a specific context” (Harel & Sowder, 1998, p. 268). An example of a contex-tual proof scheme would be one where the person possessing this scheme is unableto think in terms of abstract structures when trying to prove for instance somethingabout geometry, and is restricted only to what he or she has perceived in the past(e. g. the person cannot understand any interpretation of the axioms of geometrydifferent than the one given in Euclidean geometry).Examples of mathematical theories that are based on proof schemes which are sub-categories of the contextual proof scheme are the Greek axiomatic system and Dio-phantine Algebra (Harel, 2007, p. 73). The Greek axiomatic system, which is rep-resented by the proof scheme called Greek Axiomatic (GRAX) and is also the onewe focused on in our intervention, is based on intuitive axioms and although theGreeks conceived the notion of deductive proof, they “had one single type of mentalobjects in mind, namely, objects that are idealizations of physical reality, such as aline, plane, triangle, etc.” (p. 73). TheArithmetic Symbolic (ARITHS)which alsobelongs in the Contextual proof schemes will not be used in our study and thereforewill not be further discussed.
14
2.4. Previous research on students’ geometrical reasoning
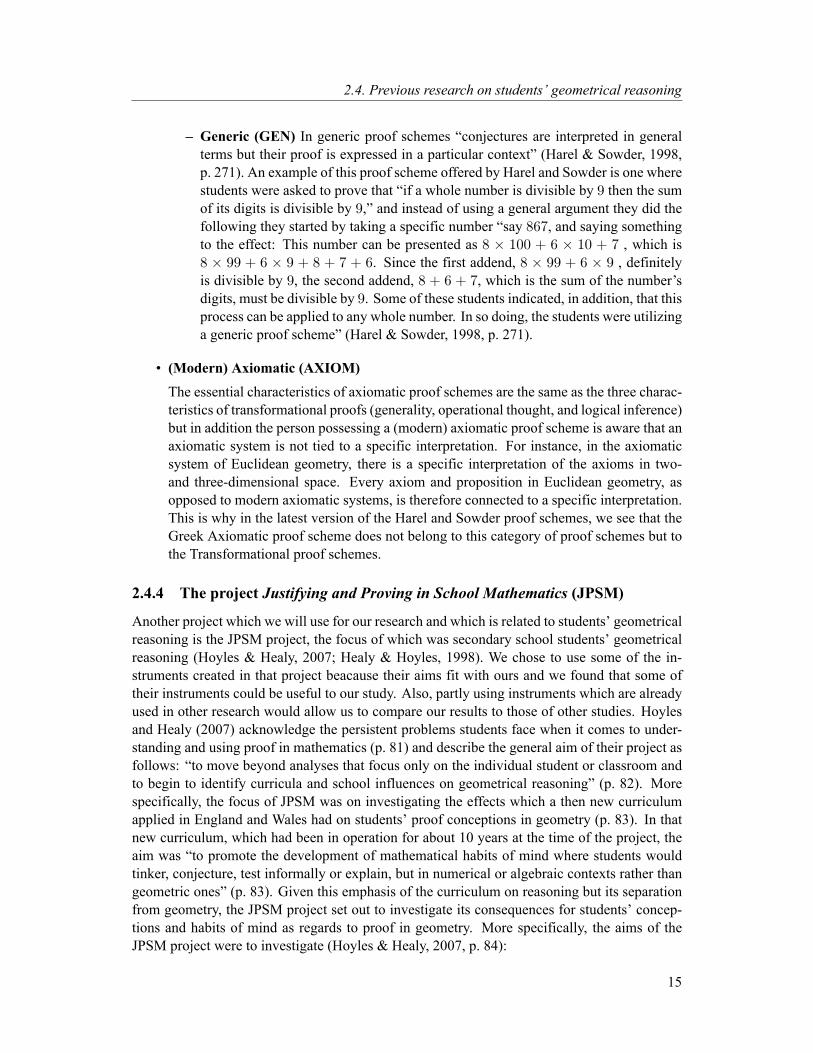
– Generic (GEN) In generic proof schemes “conjectures are interpreted in generalterms but their proof is expressed in a particular context” (Harel & Sowder, 1998,p. 271). An example of this proof scheme offered by Harel and Sowder is one wherestudents were asked to prove that “if a whole number is divisible by 9 then the sumof its digits is divisible by 9,” and instead of using a general argument they did thefollowing they started by taking a specific number “say 867, and saying somethingto the effect: This number can be presented as 8 × 100 + 6 × 10 + 7 , which is8 × 99 + 6 × 9 + 8 + 7 + 6. Since the first addend, 8 × 99 + 6 × 9 , definitelyis divisible by 9, the second addend, 8 + 6 + 7, which is the sum of the number’sdigits, must be divisible by 9. Some of these students indicated, in addition, that thisprocess can be applied to any whole number. In so doing, the students were utilizinga generic proof scheme” (Harel & Sowder, 1998, p. 271).
• (Modern) Axiomatic (AXIOM)The essential characteristics of axiomatic proof schemes are the same as the three charac-teristics of transformational proofs (generality, operational thought, and logical inference)but in addition the person possessing a (modern) axiomatic proof scheme is aware that anaxiomatic system is not tied to a specific interpretation. For instance, in the axiomaticsystem of Euclidean geometry, there is a specific interpretation of the axioms in two-and three-dimensional space. Every axiom and proposition in Euclidean geometry, asopposed to modern axiomatic systems, is therefore connected to a specific interpretation.This is why in the latest version of the Harel and Sowder proof schemes, we see that theGreek Axiomatic proof scheme does not belong to this category of proof schemes but tothe Transformational proof schemes.
2.4.4 The project Justifying and Proving in School Mathematics (JPSM)
Another project which we will use for our research and which is related to students’ geometricalreasoning is the JPSM project, the focus of which was secondary school students’ geometricalreasoning (Hoyles & Healy, 2007; Healy & Hoyles, 1998). We chose to use some of the in-struments created in that project beacause their aims fit with ours and we found that some oftheir instruments could be useful to our study. Also, partly using instruments which are alreadyused in other research would allow us to compare our results to those of other studies. Hoylesand Healy (2007) acknowledge the persistent problems students face when it comes to under-standing and using proof in mathematics (p. 81) and describe the general aim of their project asfollows: “to move beyond analyses that focus only on the individual student or classroom andto begin to identify curricula and school influences on geometrical reasoning” (p. 82). Morespecifically, the focus of JPSM was on investigating the effects which a then new curriculumapplied in England and Wales had on students’ proof conceptions in geometry (p. 83). In thatnew curriculum, which had been in operation for about 10 years at the time of the project, theaim was “to promote the development of mathematical habits of mind where students wouldtinker, conjecture, test informally or explain, but in numerical or algebraic contexts rather thangeometric ones” (p. 83). Given this emphasis of the curriculum on reasoning but its separationfrom geometry, the JPSM project set out to investigate its consequences for students’ concep-tions and habits of mind as regards to proof in geometry. More specifically, the aims of theJPSM project were to investigate (Hoyles & Healy, 2007, p. 84):
15
Chapter 2. Theoretical Framework
(i) The characteristics of arguments recognized as proofs by high-attaining students aged14–15 years,
(ii) The reasons behind their judgments, and
(iii) The ways they constructed proofs for themselves.
The findings of this research show that the majority of students, even after the new curricu-lum was applied, still appeared to “rely on inductive inference rather than any logical argumentto determine the truth of mathematical statements” (Hoyles & Healy, 2007, p. 107). However,the students who followed this curriculum “rarely if ever acted out meaningless formal ritualswhen producing proofs” as opposed to reports of other research projects in the past (p. 107).Hoyles and Healy (2007) point out that their research raises questions for the planning of curric-ula for teaching geometry: any curricula that include the teaching of proof in their aims should“explicitly be designed to achieve this goal” (p. 108), and they add that a way to do this is to useresearch that has already documented ways to effectively teach geometry and proof and to buildfrom this research systematic teaching plans. This is what we aim to do in our research and inthe following paragraphs we will show how some of the theories discussed in this chapter canbe combined in order to create an effective teaching strategy for the learning of proof. We findthe instruments used by Hoyles and Healy (2007) to reveal students’ methods for proving andtheir beliefs useful and we will explain in detail in Chapter 5 how we used these in our research.
2.5 Van Hiele levels and Harel & Sowder proof schemes: A corre-spondence
Based on the available literature, we can see a rough correspondence between the Van Hielelevels of thinking and the Harel and Sowder proof schemes. Wewill explain this correspondencehere.
On the one hand we have the Van Hiele levels which, as discussed in Section 2.4.1, arehierarchical. This means that a student cannot be at a later level without passing through theprevious one. For example, being at the theoretical Van Hiele level implies that one is ableto internally organize the empirical level, that is, the previous level. Moreover, it follows thatwhen you are at any one level, then you are not able to reason (yet) in the way suggested bythe following level. Therefore, one who is at the empirical level cannot reason at the theoreticallevel until he or she reaches that level.
On the other hand, the Harel & Sowder proof schemes do not intend to suggest any hierarchy.However, when a person is at the descriptive Van Hiele level, he or she cannot (by definition ofthe level) consistently possess any of the analytical Harel & Sowder proof schemes. Only whenthe theoretical Van Hiele level is reached are students able to reason deductively and begin tounderstand the axiomatic system of Euclidean geometry. This implies that at the descriptiveVan Hiele level or below, a student will not display any analytical proof schemes since he or sheis not able to do so yet. Similarly, at the theoretical Van Hiele level, students will not be ableto use any of the proof schemes that presuppose understanding of various competing axiomaticsystems.
Moreover, although it is not impossible, we do not expect students at the theoretical or higherVan Hiele levels to have external or empirical proof schemes. We may assume that the move to
16
2.6. Previous research on the Van Hiele theory
a higher thinking level is accompanied more often than not by the abandoning of proof schemesused in the previous levels, especially for the first three levels of thinking (visual, descriptiveand theoretical).
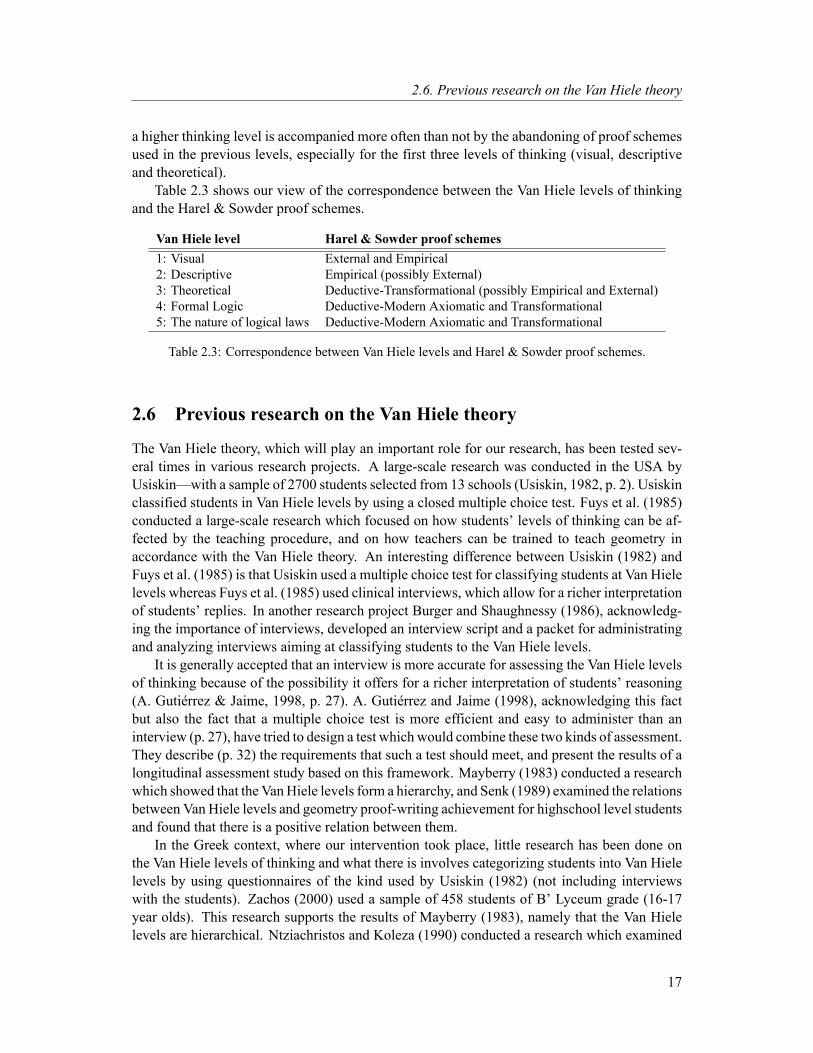
Table 2.3 shows our view of the correspondence between the Van Hiele levels of thinkingand the Harel & Sowder proof schemes.
Van Hiele level Harel & Sowder proof schemes1: Visual External and Empirical2: Descriptive Empirical (possibly External)3: Theoretical Deductive-Transformational (possibly Empirical and External)4: Formal Logic Deductive-Modern Axiomatic and Transformational5: The nature of logical laws Deductive-Modern Axiomatic and Transformational
Table 2.3: Correspondence between Van Hiele levels and Harel & Sowder proof schemes.
2.6 Previous research on the Van Hiele theory
The Van Hiele theory, which will play an important role for our research, has been tested sev-eral times in various research projects. A large-scale research was conducted in the USA byUsiskin—with a sample of 2700 students selected from 13 schools (Usiskin, 1982, p. 2). Usiskinclassified students in Van Hiele levels by using a closed multiple choice test. Fuys et al. (1985)conducted a large-scale research which focused on how students’ levels of thinking can be af-fected by the teaching procedure, and on how teachers can be trained to teach geometry inaccordance with the Van Hiele theory. An interesting difference between Usiskin (1982) andFuys et al. (1985) is that Usiskin used a multiple choice test for classifying students at Van Hielelevels whereas Fuys et al. (1985) used clinical interviews, which allow for a richer interpretationof students’ replies. In another research project Burger and Shaughnessy (1986), acknowledg-ing the importance of interviews, developed an interview script and a packet for administratingand analyzing interviews aiming at classifying students to the Van Hiele levels.
It is generally accepted that an interview is more accurate for assessing the Van Hiele levelsof thinking because of the possibility it offers for a richer interpretation of students’ reasoning(A. Gutiérrez & Jaime, 1998, p. 27). A. Gutiérrez and Jaime (1998), acknowledging this factbut also the fact that a multiple choice test is more efficient and easy to administer than aninterview (p. 27), have tried to design a test which would combine these two kinds of assessment.They describe (p. 32) the requirements that such a test should meet, and present the results of alongitudinal assessment study based on this framework. Mayberry (1983) conducted a researchwhich showed that the VanHiele levels form a hierarchy, and Senk (1989) examined the relationsbetween Van Hiele levels and geometry proof-writing achievement for highschool level studentsand found that there is a positive relation between them.
In the Greek context, where our intervention took place, little research has been done onthe Van Hiele levels of thinking and what there is involves categorizing students into Van Hielelevels by using questionnaires of the kind used by Usiskin (1982) (not including interviewswith the students). Zachos (2000) used a sample of 458 students of B’ Lyceum grade (16-17year olds). This research supports the results of Mayberry (1983), namely that the Van Hielelevels are hierarchical. Ntziachristos and Koleza (1990) conducted a research which examined
17
Chapter 2. Theoretical Framework
how students of grades 5 and 6 of the elementary school (10-12 year olds) can be classifiedaccording to the Van Hiele levels, and what kinds of errors these students make in geometry.Ntziachristos and Zaranis (2001) investigated how a teaching strategy based on the Van Hielemodel in combination with the use of educational software in the geometry classroom mayimprove the achievement of students of A’ Gymnasium level in geometry. Tzifas (2005) in hisMaster’s thesis summarizes the previous research (pp. 54–57) and offers the results of his ownresearch on a sample of 1838 students from the levels Γ’ Gymnasium and A’, B’ Lyceum in45 schools in Greece. Tzifas classified students in a similar way to Usiskin, by using Usiskin’smultiple choice tests, however he acknowledges that a research with interviews combined withthe Usiskin tests would probably have better and more accurate results (Tzifas, 2005, p. 101).
2.7 Teaching strategies assisting the move through the Van Hielelevels
Themove from oneVanHiele level to the next does not happen naturally (vanHiele, 1986, p.50).Therefore, appropriate teaching strategies need to be designed and implemented for a successfulmove through the VanHiele levels. It is rather encouraging that in the last decades there has beena developing interest in including geometry and proof in the mathematics curricula at all levels(Hanna et al., 2009). However, important as the teaching of geometry has become, it has alsobeen observed that “middle school students’ classroom experiences with justification and proofare insufficient for developing desired conceptions of mathematical proof” (Bieda, 2009, p. 65).Moreover, many studies show students’ preference towards empirical arguments over deductiveones (Williams, 1979; Usiskin, 1982; Schoenfeld, 1985; Senk, 1985; Porteous, 1986; Balacheff,1988; Clements & Battista, 1992; Coe & Ruthven, 1994; Moore, 1994; Harel & Sowder, 1998;Jones, 2000; Weber, 2001; Knuth et al., 2009). But why do students show this preference?
It is a fact that understanding how students’ deductive reasoning develops is difficult andthere is still much in this area that is unknown (Dreyfus, 1999). A lot of research is thereforebeing carried out in this area. In an attempt to answer the above question, a classification ofstudents’ beliefs about empirical and deductive arguments as well as of the reasons behind thesebeliefs has been made by Chazan (1993). For answering the above question one can claim basedon the theory of geometrical thinking of the Van Hieles (van Hiele, 1986; Fuys et al., 1984) thatstudents who show this preference may still be in the descriptive (or earlier) Van Hiele level,and need to move on to the theoretical level before they start showing a preference for deductivearguments.
Chazan (1993) found that “explicit attention devoted to discussion of the relative meritsof these forms of argumentation [deductive and empirical]” (p. 382) actually helped studentsunderstand these two forms better. More specifically, Chazan examined students’ beliefs aboutproof in mathematics in a context where lessons included empirical exploration with the help ofdynamic geometry software, “an emphasis on deductive proof, and a willingness [on the part ofthe teacher] to use a unit for teaching explicitly about mathematical argumentation” (Chazan,1993, p. 363). As Chazan (1993, p. 363) mentions, in the sites where the research took place“after the teachers had completed their traditional instruction about what a deductive proof isand how to do simple deductive proofs, they began the instructional unit about the methodsof measurement of examples and deductive proof. This unit included activities which werecreated to highlight differences between measurement of examples and deductive proof.” The
18
2.7. Teaching strategies assisting the move through the Van Hiele levels
results reported by Chazan were generally positive as to how the juxtaposition of empirical anddeductive arguments may affect students’ understanding of the meaning of proof.9
Traditionally, the teaching of Euclidean geometry is done by first introducing students to theEuclidean axioms and propositions and then proceeding to prove theorems and new propositionsby using what has already been proven. Usually the teachers and textbooks give to the studentsthe theorems and propositions and then the students are asked to provide a proof for these,knowing already that they are true.10 This teaching method imposes the axiomatic system onstudents (Freudenthal, 1973; Hanna, 1989; Douek, 2007). The teacher presents the axioms tothe students and offers propositions to be proven. In this process the act of conjecturing, anact central to the understanding of the meaning of proof, is totally absent. In the words ofFreudenthal, “it is a long way to come to this point in this or that system, and the pupil has tolearn this fact, but he will never learn it if an axiomatic system is imposed on him. Didacticallythis could be a wrong procedure. It is the task of rigour to convince, but ready-mademathematicsnever convinces. To progress in rigour, the first step is to doubt the rigour one believes in atthis moment. Without this doubt there is little learned by letting other people prescribe oneselfnew criteria of rigour” (Freudenthal, 1973, p. 151). According to Freudenthal (1973, p. 150)experimental mathematics (or the mathematics of free discovery as he calls it) “is much moreimportant than that which is confined to axioms imposed by the teacher or textbook author, andthere is no reason to claim that it is any less rigorous. There are levels of rigour and for eachsubject matter there is a level of rigour adapted to it; the learner should pass through the levelsand acquire their rigour.”
What are then some appropriate teaching strategies for teaching geometry and proof thatcan replace the traditional one? Admittedly there have been attempts within mathematics ed-ucation at all levels to change this traditional way of teaching and learning into one where thelearning experiences are “more cooperative, more conceptual and more connected” (Dreyfus,1999, p. 85), by asking students more frequently to explain their reasoning. According to Douek(2007, p. 165) the process of asking students to form their own conjecture “fixes very firmly”the conjecture in their minds and thus it becomes more meaningful to them. Research studiesfrom all over the world support this claim (Chazan, 1990; Bussi Bartolini, 2009; Boero, Garuti,& Lemut, 2007; Parenti, Barberis, Pastorino, & Viglienzone, 2007).
As Mariotti (2007b) points out, there have been numerous research projects during the lastdecades which aimed at designing teaching methods for introducing students to proof and prov-ing. One of the common features of these projects, according to Mariotti, is the attempt toengage students to an investigation of meaningful and thoughtful mathematical activities withan aim to establish a “mathematical community in the classroom” (Mariotti refers here to thework of: Bussi Bartolini, 1991; Arsac, 1992; Maher andMartino, 1996; Yackel and Cobb, 1996;Bussi Bartolini, 1998). In such a ‘community’ students are encouraged to discuss and argue foror against mathematical claims, a process that is connected to proving in mathematics. Discus-sion as a way of learning more effectively is of course not a new idea, and in the area of the
9We think that an appropriate teaching strategy which guides students to the discovery of the differences betweenempirical and deductive arguments can change the beliefs of students about proof and can eventually lead them toprefer deductive arguments over inductive ones in the context of mathematics, and our claim is supported by theresearch of Chazan (1993). As we will shortly explain, we believe that if this juxtaposition is placed at the beginningof the introduction of students to deductive proof—rather than after completing the traditional instruction about whatdeductive proof is, as Chazan’s research suggests)—results may improve even further.
10This way of teaching geometry is followed in Greece, where this research project took place.
19
Chapter 2. Theoretical Framework
teaching of geometry we already read about these considerations in Dina van Hiele’s writingsfrom the year 1957 (Fuys et al., 1984, p. 13): “class conversation is an indispensable part of theclass hour. […] The class conversation is precisely directed towards stimulating the children toas lively a thinking as possible.”
Related to the teacher’s role in the didactics of geometry, Freudenthal suggests that theteacher should only proceed to giving out more information and answers to the students whenthey have reached the level of wondering why certain things in mathematics are the way theyare: “The most important pedagogical quality is patience. One day the child will ask “Why?”.It is useless to start with systematic geometry prior to that day. Stronger yet, it can even beharmful. Geometry instruction should be a means of making the children aware of the powerof the human mind - of their own mind. Are we allowed then to rob them of the privilege ofmaking their own discoveries? The secret of geometry is the word “why”. He who does notwant to be a spoil-sport should be able to keep a secret.” (In Freudenthal (1956), as cited inthe translated version of Dina van Hiele’s dissertation by (Fuys et al., 1984, p. 48)). Dina vanHiele in her dissertation (Fuys et al., 1984, pp. 190-191) makes a similar point: “The first goalis not yet the building of a system of theorems, but the development of thinking. The class as aunit analyzes a certain level, and the pupils learn to analyze by participating in discussion. Theteacher only guides discussions and provides favorable learning situations. Parts of a system oftheorems are found, and only after insight has been gained into the structure of this system is itappropriate to try and build a system from a certain given set of axioms by using a deductiveapproach.”
Chazan (1990), in line with the above ideas, offers an approach to teaching geometry inwhich students are put in the position of mathematicians as they explore the properties of ge-ometrical objects and their relations. This approach differs from the typical instruction sinceit includes the following points: “exploration and conjecturing; presentation of demonstrativereasoning as explanatory; treatment of proving as a social activity; and emphasis on deductiveproofs as part of an exploratory process, not its end point” (p. 19). This approach to teachinggeometry gives value to the conclusions students arrive at and gives them a chance to worklike real mathematicians do. Students have thus the opportunity to gain a real insight into whatmight be the uncertainties that mathematicians come across in their area and to appreciate theuse not only of deductive reasoning but also of the empirical arguments that are used on the wayto ‘firm’ conclusions.
One of the first teaching strategies tested and reported for moving students from one levelto the next is that of van Hiele-Geldof (1984a), who reports in her dissertation on the lessonsshe created for moving students from the visual to the descriptive level. In her dissertation,Dina van Hiele suggests that there are five phases of learning for moving from the visual to thedescriptive Van Hiele level. These levels were later summarised by her in a different article(van Hiele-Geldof, 1984b, p. 223):
1. Information by means of representative material gathered from the existing substratumof empirical experiences in order to bring the pupils to purposeful action and perception;
2. Directed orientationwhich is possible when the child demonstrates a disposition towardsexploration and is willing to carry out the assigned operations;
3. Explication through which subjective experiences are objectified and geometric symbolsare formed;
20
2.7. Teaching strategies assisting the move through the Van Hiele levels
4. Free orientation which is the willful activity to choose one’s own actions as the objectof study in order to explore the domain of abstract symbols;
5. Integration which can be recognized as being oriented in the domain, as being able tooperate with the figures as a totality of properties.
The above phases of learning can be applied for moving from any of the first three Van Hielelevels to the next. A more general description of these phases, not attached to the move betweentwo specific Van Hiele levels, is given by van Hiele (1984b, p. 247) (note that the name of thefist phase has been changed):
1. Inquiry: “The student learns to know the field under investigation by means of the ma-terial which is presented to him. This material leads him to discover a certain structure.”
2. Directed orientation: “The student explores the field of investigation by means of thematerial. He already knows in what direction the study is directed; the material is chosenin such a way that the characteristic structures appear to him gradually.”
3. Explication: “Acquired experience is linked to exact linguistic symbols and the studentslearn to express their opinions about the structures observed during discussions in class.The teacher takes care that these discussions use the habitual terms. It is during this thirdphase that the system of relations is partially formed.”
4. Free orientation: “The field of investigation is for the most part known, but the studentmust still be able to find his way there rapidly. This is brought about by giving taskswhich can be completed in different ways. All sorts of signposts are placed in the field ofinvestigation: they show the path towards symbols.”
5. Integration: “The student has oriented himself, but he must still acquire an overviewof all the methods which are at his disposal. Thus he tries to condense into one wholethe domain that his thought has explored. At this point, the teacher can aid this work byfurnishing global surveys. It is important that these surveys do not present anything newto the student; they must only be a summary of what the student already knows. At theclose of the fifth phase a new level of thought is attained.”
Based on the work of the Van Hieles, Fuys et al. (1985) developed and tested three modulesfor teaching properties of quadrilaterals, angle relationships for polygons and area of quadrilat-erals. The study included also clinical interviews with some of the students. One of the mainaims of the study was to find out whether it is “possible to follow a didactic as a way of rep-resenting material so that the thinking of the child is developed from the lowest level to higherlevels [of thinking] in a continuous process” (Fuys et al., 1985, p. 9). The results of the studyshowed that the instructional method suggested had positive results in moving students fromone Van Hiele level to the next for the topics dealt with in the module. It is suggested thereforethat there should be further research for creating and evaluating teaching strategies for othertopics. It will be our intention in this study to create a teaching strategy for introducing studentsto deductive proof, and assisting them to make the move from the descriptive to the theoreticalVan Hiele level.
21
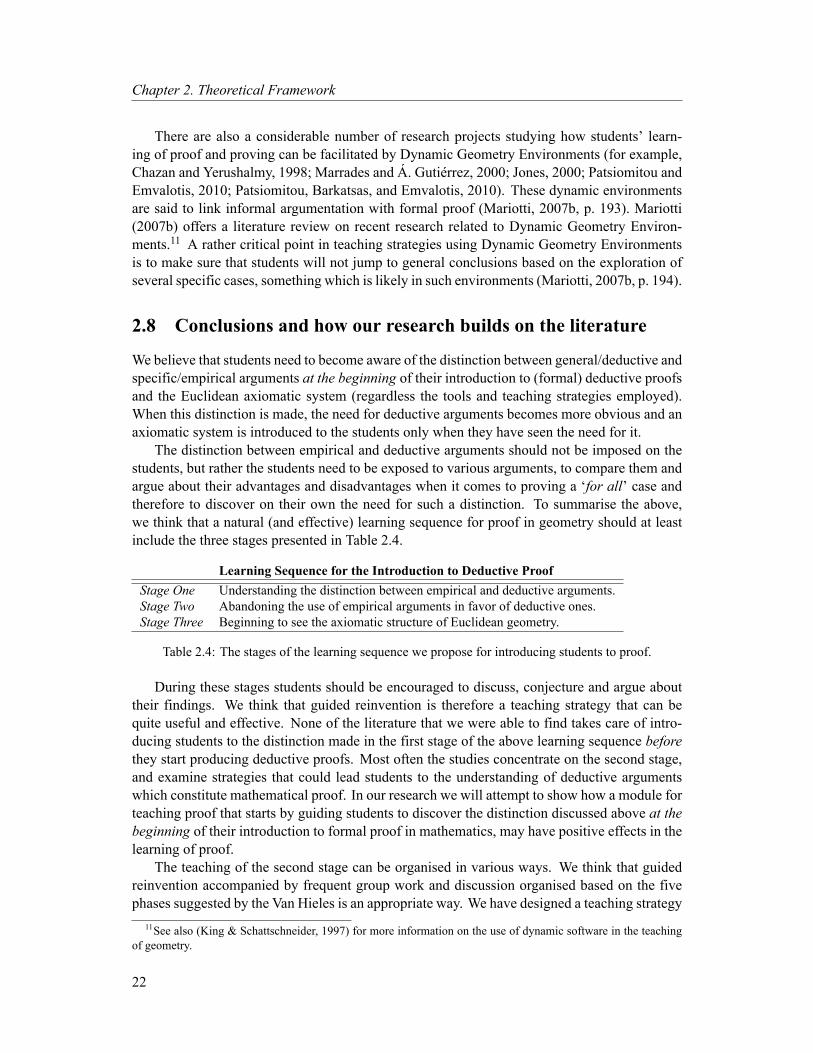
Chapter 2. Theoretical Framework
There are also a considerable number of research projects studying how students’ learn-ing of proof and proving can be facilitated by Dynamic Geometry Environments (for example,Chazan and Yerushalmy, 1998; Marrades and Á. Gutiérrez, 2000; Jones, 2000; Patsiomitou andEmvalotis, 2010; Patsiomitou, Barkatsas, and Emvalotis, 2010). These dynamic environmentsare said to link informal argumentation with formal proof (Mariotti, 2007b, p. 193). Mariotti(2007b) offers a literature review on recent research related to Dynamic Geometry Environ-ments.11 A rather critical point in teaching strategies using Dynamic Geometry Environmentsis to make sure that students will not jump to general conclusions based on the exploration ofseveral specific cases, something which is likely in such environments (Mariotti, 2007b, p. 194).
2.8 Conclusions and how our research builds on the literature
We believe that students need to become aware of the distinction between general/deductive andspecific/empirical arguments at the beginning of their introduction to (formal) deductive proofsand the Euclidean axiomatic system (regardless the tools and teaching strategies employed).When this distinction is made, the need for deductive arguments becomes more obvious and anaxiomatic system is introduced to the students only when they have seen the need for it.
The distinction between empirical and deductive arguments should not be imposed on thestudents, but rather the students need to be exposed to various arguments, to compare them andargue about their advantages and disadvantages when it comes to proving a ‘for all’ case andtherefore to discover on their own the need for such a distinction. To summarise the above,we think that a natural (and effective) learning sequence for proof in geometry should at leastinclude the three stages presented in Table 2.4.
Learning Sequence for the Introduction to Deductive ProofStage One Understanding the distinction between empirical and deductive arguments.Stage Two Abandoning the use of empirical arguments in favor of deductive ones.Stage Three Beginning to see the axiomatic structure of Euclidean geometry.
Table 2.4: The stages of the learning sequence we propose for introducing students to proof.
During these stages students should be encouraged to discuss, conjecture and argue abouttheir findings. We think that guided reinvention is therefore a teaching strategy that can bequite useful and effective. None of the literature that we were able to find takes care of intro-ducing students to the distinction made in the first stage of the above learning sequence beforethey start producing deductive proofs. Most often the studies concentrate on the second stage,and examine strategies that could lead students to the understanding of deductive argumentswhich constitute mathematical proof. In our research we will attempt to show how a module forteaching proof that starts by guiding students to discover the distinction discussed above at thebeginning of their introduction to formal proof in mathematics, may have positive effects in thelearning of proof.
The teaching of the second stage can be organised in various ways. We think that guidedreinvention accompanied by frequent group work and discussion organised based on the fivephases suggested by the Van Hieles is an appropriate way. We have designed a teaching strategy
11See also (King & Schattschneider, 1997) for more information on the use of dynamic software in the teachingof geometry.
22
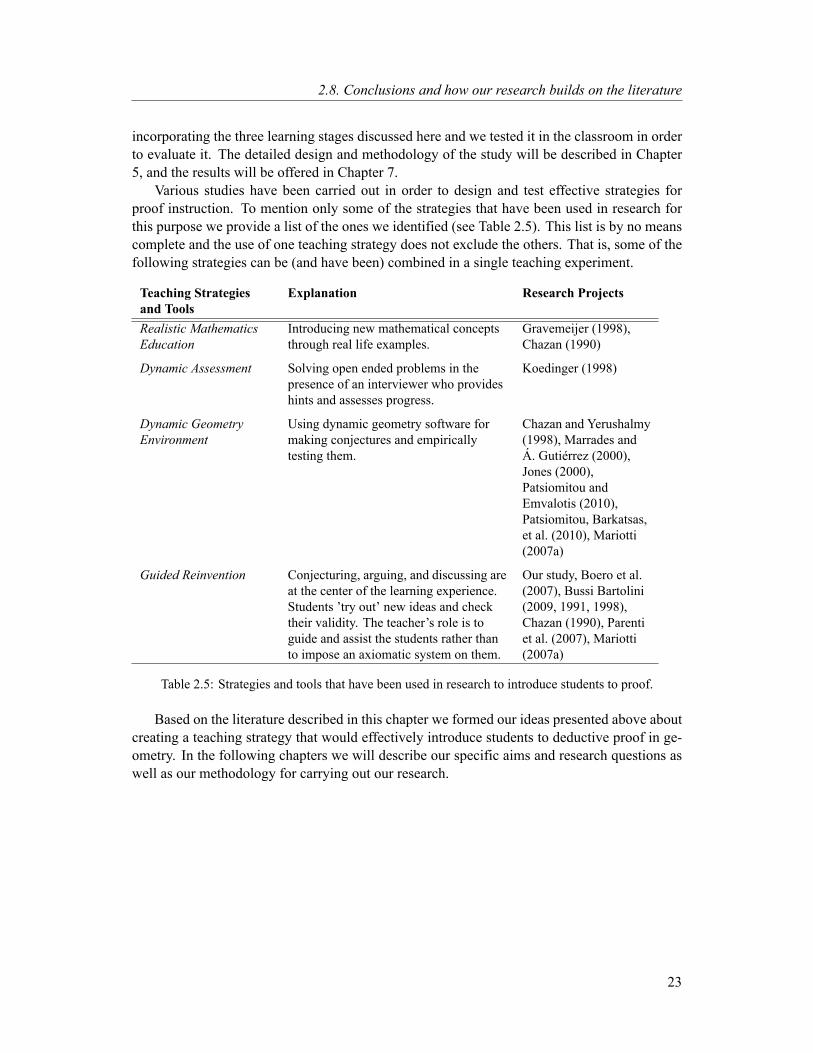
2.8. Conclusions and how our research builds on the literature
incorporating the three learning stages discussed here and we tested it in the classroom in orderto evaluate it. The detailed design and methodology of the study will be described in Chapter5, and the results will be offered in Chapter 7.
Various studies have been carried out in order to design and test effective strategies forproof instruction. To mention only some of the strategies that have been used in research forthis purpose we provide a list of the ones we identified (see Table 2.5). This list is by no meanscomplete and the use of one teaching strategy does not exclude the others. That is, some of thefollowing strategies can be (and have been) combined in a single teaching experiment.
Teaching Strategiesand Tools
Explanation Research Projects
Realistic MathematicsEducation
Introducing new mathematical conceptsthrough real life examples.
Gravemeijer (1998),Chazan (1990)
Dynamic Assessment Solving open ended problems in thepresence of an interviewer who provideshints and assesses progress.
Koedinger (1998)
Dynamic GeometryEnvironment
Using dynamic geometry software formaking conjectures and empiricallytesting them.
Chazan and Yerushalmy(1998), Marrades andÁ. Gutiérrez (2000),Jones (2000),Patsiomitou andEmvalotis (2010),Patsiomitou, Barkatsas,et al. (2010), Mariotti(2007a)
Guided Reinvention Conjecturing, arguing, and discussing areat the center of the learning experience.Students ’try out’ new ideas and checktheir validity. The teacher’s role is toguide and assist the students rather thanto impose an axiomatic system on them.
Our study, Boero et al.(2007), Bussi Bartolini(2009, 1991, 1998),Chazan (1990), Parentiet al. (2007), Mariotti(2007a)
Table 2.5: Strategies and tools that have been used in research to introduce students to proof.
Based on the literature described in this chapter we formed our ideas presented above aboutcreating a teaching strategy that would effectively introduce students to deductive proof in ge-ometry. In the following chapters we will describe our specific aims and research questions aswell as our methodology for carrying out our research.
23


Chapter 3
Aims and Research Questions
3.1 Aims
In Chapter 2 we discussed some of the main theories related to students’ reasoning: the VanHiele theory, Piaget’s theory, Schoenfeld’s theory, and Harel & Sowder’s proof schemes. Wethink there are certain aspects to these theories which, if combined, might result in a betterunderstanding regarding two important aspects of mathematics education: students’ levels ofthinking while they engage in geometry activities, and successful strategies for helping students’transition from the descriptive to the theoretical Van Hiele level.
More specifically, the first aim of our study is:
To further investigate the correspondence that we believe exists between the firstthree Van Hiele levels and the proof schemes of Harel & Sowder (see Section 2.5).
The second aim is:
To examine and describe students’ kinds of reasoning in geometry while they movefrom the descriptive to the theoretical Van Hiele level.
Our third aim is:
To create and test a teaching strategy that facilitates the move from the descriptiveto the theoretical Van Hiele level.
Related to the aims described above is the need to look closely at the beliefs of studentsabout mathematics in general and about proofs in particular. This will help us understand betterthe way students interpret and solve proof tasks. For this reason, another aim of this study is:
To find out the beliefs and conceptions of the participating students about mathe-matics and proof both before and after our intervention (building on the work ofSchoenfeld (1989) and Healy and Hoyles (1998)).
25
Chapter 3. Aims and Research Questions
3.2 Research Questions
Our main research question is formulated as follows:
(RQ) What kind(s) of reasoning do students1 use for proving while they are at dif-ferent levels of thinking in geometry as well as during the transition from the levelof informal-visual proofs2 to the level of formal-logical proofs,3 and how do thesekinds of reasoning relate to students’ beliefs about proof?
There are three subquestions related to the above research question:
SQ.1 What are the beliefs of students1 about the nature and the meaning of mathematical proof,and mathematics in general, and how do these change when they move from the descrip-tive to the theoretical Van Hiele level?
SQ.2 Is there a correlation between the Harel & Sowder proof schemes and the Van Hiele levelsof thinking?
SQ.3 Can we make the distinction between deductive and inductive arguments understandableto students before they start producing deductive proofs for themselves, and how can thisprocess be planned according the Van Hiele teaching phases?
The first subquestion (SQ1) is answered by asking students’ conceptions of proof and math-ematics before and after our intervention, and by examining the discussions between studentsand teacher as well as among students. To answer the second subquestion (SQ2) we checkedthe kinds of proof schemes, as defined in the literature (Harel and Sowder, 1998; Harel, 2007),that are employed by students when proving geometrical propositions. We also checked whetherthere is a consistent correspondence between the proof schemes used and the students’ Van Hielelevels of thinking. Finally, to answer the third subquestion (SQ3) we designed a series of lessonsbased on the Van Hiele phases of teaching which specifically aimed at making the distinctionbetween deductive and inductive arguments understandable to students before they start pro-ducing deductive proofs for themselves, and we assessed this method by looking at students’progress through the lessons.
3.3 Hypotheses
We have the following hypotheses:
H.1 As students progress from the descriptive to the theoretical level, their beliefs about math-ematics and proof change.
1All the research questions are specific to the context of this research study. Whenever the word ‘students’ isused, what is meant is ‘students of the Gymnasium Γ’ level of the Greek public school curriculum, who have alreadybeen taught the geometry chapter of the school book (Argyrakis, Bourganas, Mentis, Tsikopoulou, & Chrysovergis,2007).’
2We call this level the ‘descriptive Van Hiele level’ or ‘Van Hiele level 2.’3We call this level the ‘theoretical Van Hiele level’ or ‘Van Hiele level 3.’
26
3.3. Hypotheses
H.2 Given the correspondence4 between the Harel & Sowder proof schemes and the Van Hielelevels of thinking, there should be a correlation between corresponding Van Hiele levelsand Harel & Sowder proof schemes.
H.3 The move of students from the descriptive to the theoretical Van Hiele level can be de-scribed in three stages (related to the arguments students use during proving) which werepresented in Table 2.4; a teaching strategy based on these three stages and the five VanHiele teaching phases—like the one used in this research study—can facilitate this move.
4See Section 2.5 for a definition of this correspondence.
27

Chapter 4
Research Setting
4.1 The place
The research took place in a Greek lower secondary school1 in Katerini. Katerini is situatedin the north of Greece. The school is an ordinary Greek public school. This means that thereis no special selection method for students; students who live close to the school go to thisschool. Thus, one finds students coming from all social backgrounds, as is the case in mostpublic Greek schools, and the abilities of the students are mixed. We chose to do our researchin a public school in order to ensure that our sample would be heterogeneous.
4.2 The Greek educational system
Education in Greece is public, and compulsory for all children within the age range 6-15. Com-pulsory education includes Primary Education (from 6 to 12 years old) and Lower SecondaryEducation, the Greek ‘Gymnasium’ (from 12-15 years old). Higher Secondary Education, theGreek ‘Lyceum’ (from 15 to 18 years old), is not compulsory and consists of two school types:the Unified Upper Secondary Schools (Eniaia Lykeia) and the Technical Vocational EducationalSchools (TEE).
Having a public educational system means (in the case of Greece) that students are notobliged to pay anything at all, not even for books (which are the same for all students in allpublic schools throughout Greece), during their entire education, from the Elementary Schoolto University. Greek students have thus a constitutionally secured right to free education. How-ever, the level of education within public schools is not always high, therefore students often gethelp outside school hours, especially when they enter Lyceum, where the demands are higher.At the Gymnasium level, to which our study refers, very few students get help outside schoolhours.
4.3 Geometry in the Greek curriculum
The way geometry is taught in Greece matches the description offered by Mariotti (2007a,pp. 287–288) of the way geometry is taught in Italy. In Greek secondary schools students are
1The school’s web page is: http://5gym-kater.pie.sch.gr/
29

Chapter 4. Research Setting
taught geometry for 5 years (ages 12 to 17). In the first two years of this period (grades A’ andB’ of Gymnasium), they are intuitively introduced to definitions, basic geometrical conceptsand their properties. For example: lines, angles, points, symmetry, triangles, parallelograms (atage 12–13), circles and solids (at age 13–14). They are for the first time asked to prove geomet-rical propositions at the age of 14–15 (grade Γ’ of Gymnasium), but still they are not explicitlyintroduced to the idea of a formal-theoretical geometrical proof. Most of the tasks studentshave to do involve calculating and drawing. In other words, in the Greek Gymnasium studentsare introduced only to practical geometry which is based on intuition and requires empiricalreasoning.
It is only when they enter the upper secondary school (Lyceum) that students are introducedto theoretical geometry. According to the A’ Lyceum geometry textbook the difference betweenpractical and theoretical geometry is that in the latter one has to systematically use logic in orderto establish knowledge whereas in the former one depends on measuring and other practical(and thus imperfect from a mathematical point of view) procedures. The aim of mathematicseducation at the A’ Lyceum level, according to the school textbook, is to introduce students tothe formal-deductive method of proof.
The focus of our research is the transition from Gymnasium level geometry to the level ofgeometry first introduced at Lyceum. Our research has thus been carried out with students thathave already been taught the geometry of the last Gymnasium level and involves trying to bringthese students to the next level and observe their kinds of reasoning before, during and afterthe transition. Below we offer a more detailed description of the geometry books of the GreekGymnasium in order to understand better the background and level of the students involved inour study.
4.4 The geometry books of the Greek Gymnasium
We will examine in this section how the Van Hiele levels are encountered in the Greek Gym-nasium geometry textbooks. For doing this we need to establish first the descriptors that cor-respond to each Van Hiele level. This has already be done by Fuys et al. (1985) and below wepresent the results of their study.
Descriptors of Van Hiele levels in the literature
Fuys et al. (1985) give a description of the characteristics of each Van Hiele level and providea detailed characterization of the levels by formulating “specific behavioral and level descrip-tors” (Fuys et al., 1985, p. 56). In their study they use a slightly different level scale than thatused by Van Hiele. Their level 0 which is the level of “recognition of shapes as a whole” (p. 1)corresponds to the Van Hiele visual level. Their levels 1-2 are the levels of “progressing to dis-covery of properties of figures and informal reasoning about these figures and their properties”(p. 1). Level 1 corresponds to the Van Hiele descriptive level, and level 2 is a level of transitionfrom the descriptive to the theoretical level. Thus, level 2 does not correspond directly withany of the Van Hiele levels as described in van Hiele (1986). Their level 3 corresponds to theVan Hiele theoretical level, and their level 4 to the formal logic level. There is no level in Fuyset al. (1985) that corresponds to the nature of logical laws Van Hiele level. Table 4.1 shows thecorrespondence of the Van Hiele levels as described by Fuys et al. (1985) with the Van Hiele
30
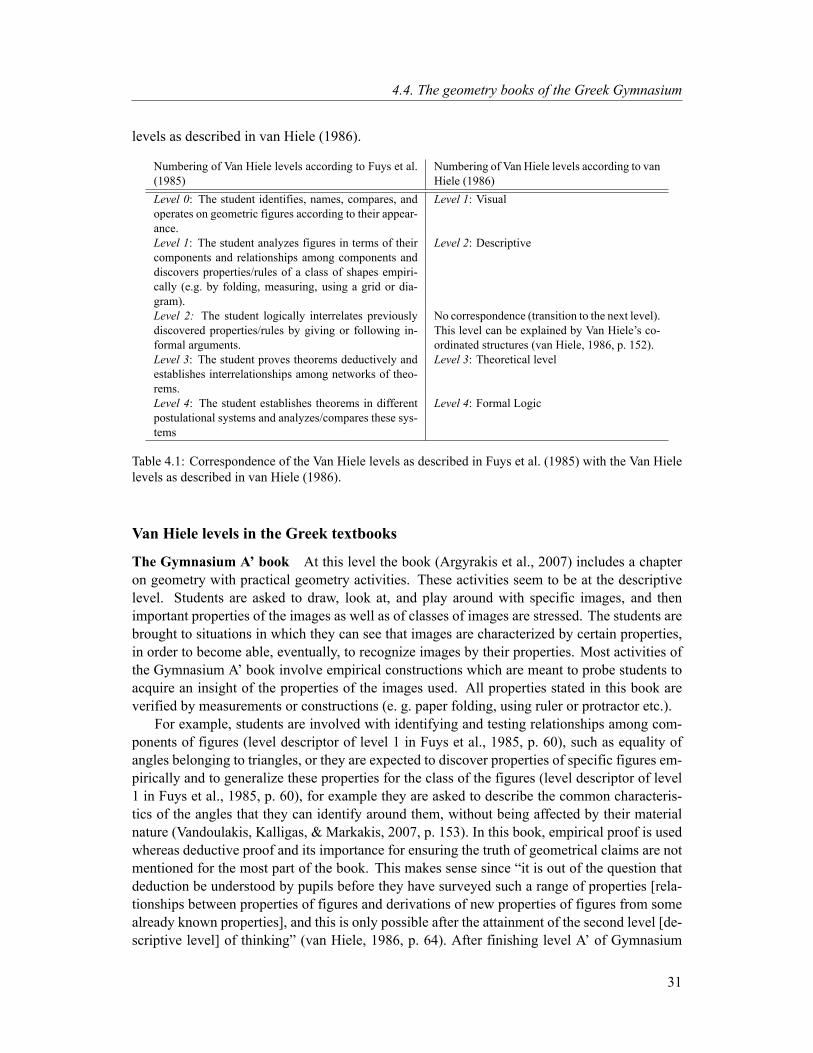
4.4. The geometry books of the Greek Gymnasium
levels as described in van Hiele (1986).
Numbering of Van Hiele levels according to Fuys et al.(1985)
Numbering of Van Hiele levels according to vanHiele (1986)
Level 0: The student identifies, names, compares, andoperates on geometric figures according to their appear-ance.
Level 1: Visual
Level 1: The student analyzes figures in terms of theircomponents and relationships among components anddiscovers properties/rules of a class of shapes empiri-cally (e.g. by folding, measuring, using a grid or dia-gram).
Level 2: Descriptive
Level 2: The student logically interrelates previouslydiscovered properties/rules by giving or following in-formal arguments.
No correspondence (transition to the next level).This level can be explained by Van Hiele’s co-ordinated structures (van Hiele, 1986, p. 152).
Level 3: The student proves theorems deductively andestablishes interrelationships among networks of theo-rems.
Level 3: Theoretical level
Level 4: The student establishes theorems in differentpostulational systems and analyzes/compares these sys-tems
Level 4: Formal Logic
Table 4.1: Correspondence of the Van Hiele levels as described in Fuys et al. (1985) with the Van Hielelevels as described in van Hiele (1986).
Van Hiele levels in the Greek textbooks
The Gymnasium A’ book At this level the book (Argyrakis et al., 2007) includes a chapteron geometry with practical geometry activities. These activities seem to be at the descriptivelevel. Students are asked to draw, look at, and play around with specific images, and thenimportant properties of the images as well as of classes of images are stressed. The students arebrought to situations in which they can see that images are characterized by certain properties,in order to become able, eventually, to recognize images by their properties. Most activities ofthe Gymnasium A’ book involve empirical constructions which are meant to probe students toacquire an insight of the properties of the images used. All properties stated in this book areverified by measurements or constructions (e. g. paper folding, using ruler or protractor etc.).
For example, students are involved with identifying and testing relationships among com-ponents of figures (level descriptor of level 1 in Fuys et al., 1985, p. 60), such as equality ofangles belonging to triangles, or they are expected to discover properties of specific figures em-pirically and to generalize these properties for the class of the figures (level descriptor of level1 in Fuys et al., 1985, p. 60), for example they are asked to describe the common characteris-tics of the angles that they can identify around them, without being affected by their materialnature (Vandoulakis, Kalligas, & Markakis, 2007, p. 153). In this book, empirical proof is usedwhereas deductive proof and its importance for ensuring the truth of geometrical claims are notmentioned for the most part of the book. This makes sense since “it is out of the question thatdeduction be understood by pupils before they have surveyed such a range of properties [rela-tionships between properties of figures and derivations of new properties of figures from somealready known properties], and this is only possible after the attainment of the second level [de-scriptive level] of thinking” (van Hiele, 1986, p. 64). After finishing level A’ of Gymnasium
31

Chapter 4. Research Setting
the students are somewhat familiar with the language that belongs to the descriptive level ofthinking, which includes names of figures and of figure properties.
The Gymnasium B’ book At this level the chapter on geometry of the book (Vlamos, Drout-sas, Presvis, & Rekoumis, 2007) offers activities at the descriptive level (for example, studentsare asked to find the area of a figure by subdividing the figure into other figures which theyalready know how to calculate the area of) and seems to be aiming also at giving some first‘hints’ to students about the transition which leads to the theoretical level (for example, studentsare given some information about a figure, and they are asked to reach a conclusion which theyhave to justify based on the information given). The book deals with fewer concepts than theones of the previous year but it goes into more depth on each concept. General propositions arestated, which are supported mainly by inductive arguments based on observations. Relation-ships among properties are formulated in an informal way (that is, not proved by deduction butbased on observations).
An example of such a relationship is: “Every inscribed angle is equal to the half of a centralangle with a corresponding arch” (Vlamos et al., 2007, p. 176). In this book, the students are forthe first time introduced to a theorem, the Pythagorean Theorem, and to a proof of the theoremthat is based on a construction and on measuring of areas of several shapes. This may be con-sidered as an opportunity for students to discuss informally what theorems are and why they areuseful for mathematics.
The Gymnasium Γ’ book At this level, which is also the level of the students we workedwith in our project, the book (Argyrakis et al., 2007) aims at building on the descriptive level inorder to start introducing students to the theoretical level. The book is mainly dealing with thetransition level (Level 2 according to Fuys et al., 1985) from the descriptive to the theoreticallevel. The book provides activities which correspond to level descriptors like the following:the student “gives informal deductive arguments”, “gives more than one explanation to provesomething”, “identifies and uses strategies or insightful reasoning to solve problems”, “recog-nizes the role of deductive argument and approaches problems in a deductive manner” but “doesnot grasp the meaning of deduction in an axiomatic sense” (Fuys et al., 1985, p. 67–68).
The teacher’s book accompanying the students’ Gymnasium Γ’ textbook (Argyrakis, Bour-ganas, Mentis, Tsikopoulou, & Chrysovergis, 2009) includes guidelines for the teacher. It isworth quoting some parts (our translation): “In many sections the proof of the basic propositionof the section is given. Students of Γ’ Gymnasium level are now in the position to understandbetter than in the previous years the proving process. For this reason in this book there are op-portunities offered for them to practice on simple and short proofs. Initiation of students intothe process of proof aims at making students realize the power of proof over the control of thetruth of a proposition” (Argyrakis et al., 2009, pp. 9–10). The book uses a basic scheme (p. 10)for the introduction of a new concept (see Figure 4.1), and teachers are required to follow thisscheme while teaching:
Most of the sections (in the geometry chapter) of the book start with a concrete activitywhich is supposed to lead the students to the speculation of a law that is introduced in thatsection. Then the formulation of the law is offered by the book. Whenever this is appropriate,that is, not always (and in fact in less than half of the cases in the book), a proof of the law is alsoprovided. This is always followed by applications of the law. We conclude that the deductive
32
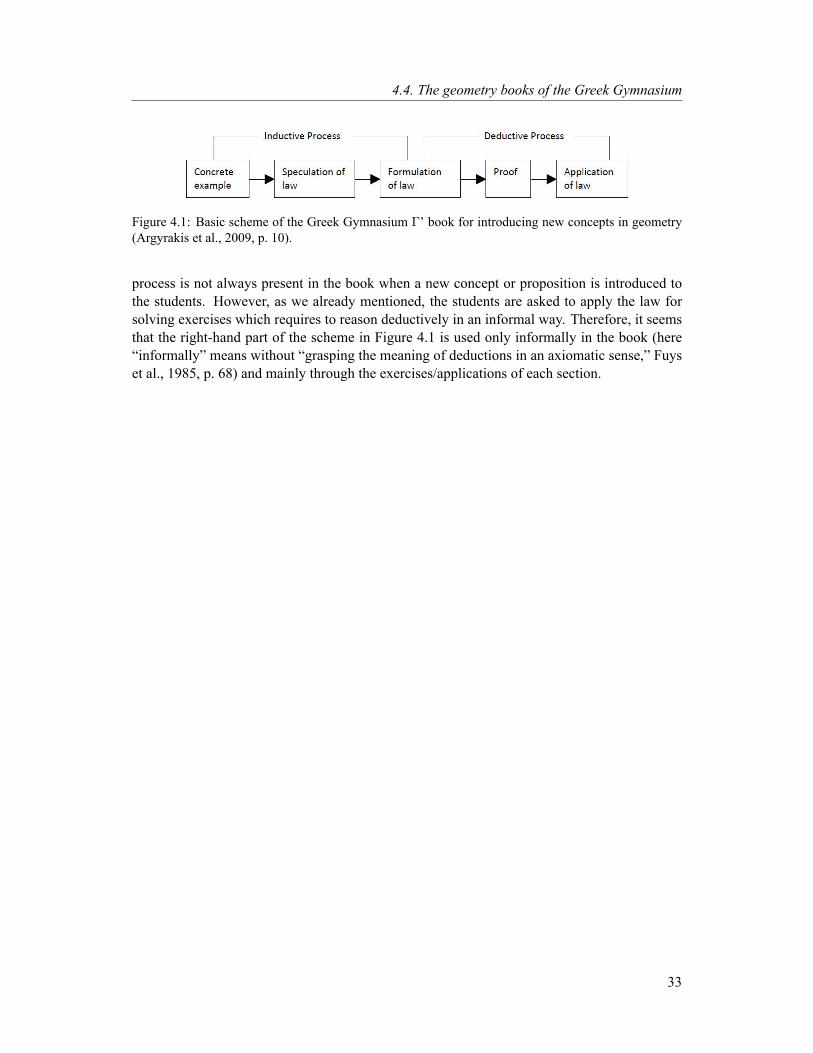
4.4. The geometry books of the Greek Gymnasium
Figure 4.1: Basic scheme of the Greek Gymnasium Γ’ book for introducing new concepts in geometry(Argyrakis et al., 2009, p. 10).
process is not always present in the book when a new concept or proposition is introduced tothe students. However, as we already mentioned, the students are asked to apply the law forsolving exercises which requires to reason deductively in an informal way. Therefore, it seemsthat the right-hand part of the scheme in Figure 4.1 is used only informally in the book (here“informally” means without “grasping the meaning of deductions in an axiomatic sense,” Fuyset al., 1985, p. 68) and mainly through the exercises/applications of each section.
33


Chapter 5
Methodology, Teaching Design andAnalysis Framework
Given the time frame and size of this research, our study is a small-scale study. The characterof our study is both exploratory and explanatory, that is, we aim both at generating certainhypotheses that might be tested in larger studies in the future and at testing some already existingtheories (Van Hiele, Harel & Sowder). Moreover, our study is mostly qualitative but has alsosome quantitative characteristics.
In the following sections we describe our methodology and how it affected the design ofour study. The chapter is structured around the research questions and hypotheses which werepresented in Chapter 3. Thus, each of the following sections explains the method we used toanswer our research questions and check our hypotheses. Below we give an overview of theparts of this chapter.
Our main research question is the following:
What kind(s) of reasoning do students use for proving while they are at differentlevels of thinking in geometry as well as during the transition from the descriptiveto the theoretical Van Hiele level, and how do these kinds of reasoning relate tostudents’ beliefs about proof?
In order to answer this question we first had to choose a method for identifying the VanHiele level, the kinds of reasoning, and the beliefs about proof of the students before and afterour intervention. This would also allow us to answer our first subquestion1 and to confirm orreject our first hypothesis.2 We will present the methods we chose for identifying the Van Hielelevel of students, their kinds of reasoning and their beliefs about proof in sections 5.1, 5.2 and5.3 respectively.
Our second subquestion was about the correlations between students’ proof schemes and1SQ.1: What are the beliefs of students about the nature and the meaning of mathematical proof and how do these
change when they move from the descriptive to the theoretical Van Hiele level?2H.1: As students progress from the descriptive to the theoretical level, their beliefs about mathematics and proof
change.
35
Chapter 5. Methodology, Teaching Design and Analysis Framework
their Van Hiele levels.3 It was our hypothesis4 that as students progress from the descriptive tothe theoretical Van Hiele level their proof schemes will change from empirical to deductive. Insection 5.4 we explain how we checked this hypothesis.
Finally, our third subquestion5 asked for a teaching method which would be planned ac-cording to our three stages idea and the five Van Hiele teaching phases which were explained inChapter 2. Our related hypothesis6 was that such a teaching method would facilitate the moveof students from the descriptive to the theoretical Van Hiele level. The design of our teachingmethod, as well as the method we used to evaluate it, is presented in detail in Section 5.5.
5.1 Identifying the students’ Van Hiele levels
In order to make a first selection of our study sample we used Usiskin’s Van Hiele test (seeAppendix A.1) for the whole population of the third grade of the chosen school (n = 85). TheUsiskin Van Hiele test is a multiple choice test according to which one can classify studentsto Van Hiele levels. The original test includes 25 questions; these questions are divided in 5subgroups each of which corresponds to a Van Hiele level, from level 1 to level 5. We usedonly the first 20 questions of this test, which correspond to Van Hiele levels 1 through 4, sincethe 5th Van Hiele level is not encountered at the highschool level. We translated the test intoGreek before distributing it to the students (the version which we used in our research can beseen in Appendix A.2). We used the same test at the end of our intervention, in order to checkthe progress of students in their Van Hiele level.
5.2 Identifying the students’ kinds of reasoning
For identifying the kinds of reasoning used by the students and for classifying them into cat-egories, we used the studies of Hoyles and Healy (2007) and Harel and Sowder (1998). Boththese studies were discussed in Chapter 2. Here we will discuss separately how we used eachof these studies in our research.
5.2.1 Adapting the instruments of the JPSM project to our research
The focus of our research is similar to that of the JPSM project, the aims of which were describedin section 2.4.4. Our research is small scale and thus inevitably focuses on the individual studentand classroom, however it is still comparable to some extent to the JPSM. The specific aims ofJPSM were to investigate (Hoyles & Healy, 2007, p. 84):
3SQ.2: Is there a correlation between the Harel & Sowder proof schemes and the Van Hiele levels of thinking?4H.2: Given the correspondence between the Harel & Sowder proof schemes and the Van Hiele levels of thinking
there should be a correlation between corresponding Van Hiele levels and Harel & Sowder proof schemes.5SQ.3: Can we make the distinction between deductive and inductive arguments understandable to students
before they start producing deductive proofs for themselves, and how can this process be planned according to theVan Hiele teaching phases?
6H.3: The move of students from the descriptive to the theoretical Van Hiele level can be described in three stages(related to the arguments students use during proving) which were presented in Table 2.4; a teaching strategy basedon these three stages and the five Van Hiele teaching phases—like the one used in this research study—can facilitatethis move.
36
5.2. Identifying the students’ kinds of reasoning
(i) The characteristics of arguments recognized as proofs by high-attaining students aged14–15 years,
(ii) The reasons behind their judgments, and
(iii) The ways they constructed proofs for themselves.
A first comparison to our research shows that there are several important similarities. Firstof all, our sample shares similar characteristics: 14–15 year old, high attaining students onthe one hand (JPSM), and 14–15 year old, high-attaining, motivated students on the other (ourresearch). The difference between the two samples is only that in our case the students thatparticipated in the research were volunteers so they were mainly motivated students (at leastfor the lesson of mathematics) who were willing to spend some of their time on extra lessonsoutside normal school hours (we will talk in more detail about the characteristics of our samplein a later chapter).
The first and third—see (i) and (iii) above—aims of the JPSM are immediately related to ourmain research question. More specifically, the first part of our research question is related to aim(iii) of the JPSM, since an investigation of the ways students construct proofs for themselvesmaylead to an understanding of the kinds of reasoning students use at different levels of thinking. Thesecond part of our research question is related to aim (i) of the JPSM, since an investigation ofthe characteristics of arguments recognized as proofs by students may lead to an understandingof students’ conceptions about proof.
Given the similarity between the two research projects we used some of the research in-struments (sometimes in slightly modified versions) produced by JPSM. These instruments andhow we adapted them are explained in the following paragraphs.
Research Instruments created by and used in the JPSM project One research instrumentused in JPSM was a student proof questionnaire which aimed at probing students’ “views ofproof from a variety of perspectives” (p. 86). It contained three parts (Hoyles & Healy, 2007,p. 86):
1. “Students were asked to describe in an open format what they thought about proof andits purposes. Their responses were coded according to a simplified version of de Villier’sclassification of the functions of proof, using the categories, truth (verification), explana-tion and discovery together with a fourth category ‘none/other’ if students wrote nothingor if their contributions appeared to be irrelevant.”
2. “Students were presented with mathematical conjectures and a range of arguments in sup-port of them in a multiple-choice format. They were asked to make two selections fromthese arguments: the argument that would be nearest to their own approach and the argu-ment they believed would receive the best mark from their teacher.”
3. “Students were asked to judge all the arguments according to their validity and how farthey were convincing and explained the conjecture. Two conjectures were included ingeometry, one familiar and one unfamiliar.”
The researchers based their choice of arguments presented to the students as proofs of theconjectures on Van Dormolen’s and Balacheff’s analyses (p. 87). There were two empirical
37

Chapter 5. Methodology, Teaching Design and Analysis Framework
arguments, an argument which “relied on common properties or a generic case” (p. 87), twodeductive arguments (one correct and one incorrect), and a narrative, valid argument which iscommonly used in English mathematics textbooks.
The specific questions asked of the students in order to find out their ideas about the validityof the arguments, their generality and how convincing they are, were the following:
• For validity:
1. X’s argument shows that the statement is always true.2. X’s argument only shows that the statement is true for some triangles.
• For generality:
Suppose it has now been proved that, when you add the interior angles of any triangle,your answer is always 180°. Zoe asks what needs to be done to prove whether, whenyou add the interior angles of any right-angled triangle, your answer is always 180°. Tickeither A or B.
(A) Zoe doesn’t need to do anything; the first statement has already proved this.(B) Zoe needs to construct a new proof.
• For convincingness:
1. X’s argument shows you why the statement is true.2. X’s argument is an easy way to explain to someone in class who is unsure.
How we adapted the JPSM’s research instruments to our context We adapted the Hoylesand Healy test to the needs of our research and we used parts of it both as pre- and post-tests.The adapted version also contained three parts:
Part I: Constructing a proof for a familiar conjecture This part was not taken from theJSPM project. We created and used the first part of the test only at the beginning of our in-tervention in order to identify the proof schemes of students at that moment (see also Section5.2.2). The task was to show that the (familiar) conjecture ‘when you add the interior angles ofa triangle the sum is always 180°’ is true (see Task ANGLE SUM in Appendix B.2). The reasonfor giving this question first as an open format question was to reveal the kinds of argumentsthat students use for proving familiar conjectures before they are presented with other argumentsfor showing the same conjecture (Part II of the questionnaire) and before our intervention. It isimportant to mention that students had possibly heard a couple of times a deductive proof forthis conjecture,7 however, in general students of this level in Greece are not yet introduced todeductive proofs as such. Most often the conjectures of geometry are introduced to studentsas already given facts, and students are presented only with some examples which verify theconjecture in order to be convinced of the validity of the conjecture.
7It is included at the end of the book of the previous year as a worked example in the book, but also their teacherhad mentioned it to them that year in class, however without insisting on it. (Personal communication with theteacher.)
38

5.2. Identifying the students’ kinds of reasoning
Part II: Choosing a proof of a familiar conjecture After revealing their arguments in favourof the above conjecture in an open format (Part I), students were provided with a range of ar-guments in support of that conjecture and were asked to make five selections (instead of thetwo that were included in the JPSM project) from these arguments: the argument that wouldbe nearest to their own approach, the argument they believed would receive the best grade, theargument that they found most convincing, the argument that they found most easy and the ar-gument that they found most difficult. In addition to the range of arguments used in the JPSMproject, we included an argument borrowed from Harel and Sowder (1998) which was a causaland valid argument (see the last argument in Task CHOOSING Appendix B.3). This means thatit was an argument which can easily be generalized for all triangles and which shows a reasonwhy the sum of the angles of any triangle is 180°. The specific choices the students had to makewere the following:
• Whose method would you choose in order to check whether the above statement is trueor false? Explain why.
• Whose answer you find more convincing and why?
• Whose answer you think would get the highest grade in a test and why?
• Whose answer is easier for you to understand and whose is more difficult?
After making their choices the students had to answer specific questions related to the va-lidity of the arguments, and how convincing they are. We used the same questions suggested bythe JPSM project, although only for 4 out of the range of 8 arguments. We made sure that weincluded all 4 different kinds of arguments in our range. The questions were the following:
• For validity:
1. X’s argument shows that the statement is always true2. X’s argument only shows that the statement is true for some triangles.
• For convincingness:
1. X’s argument shows you why the statement is true2. X’s argument is an easy way to explain to someone in class who is unsure.
The arguments for which these questions were asked were: Stamatis’s (an empirical, induc-tive argument), Georgia’s (a theoretical, deductive argument), Lefteris’s (a narrative, practical,but valid argument), and Kalliopi’s (a theoretical, causal, valid argument). The questions canbe seen in Appendix B.3.
Part III: Sharing views on the role of proof In the last part of this test the students had todescribe in an open format their ideas about the role of proof. Finally, the students had to answera question (the same one used by the JPSM project) regarding the generality of the conjecture(see Task CONCEPTIONS ABOUT PROOF in Appendix B.4).
39
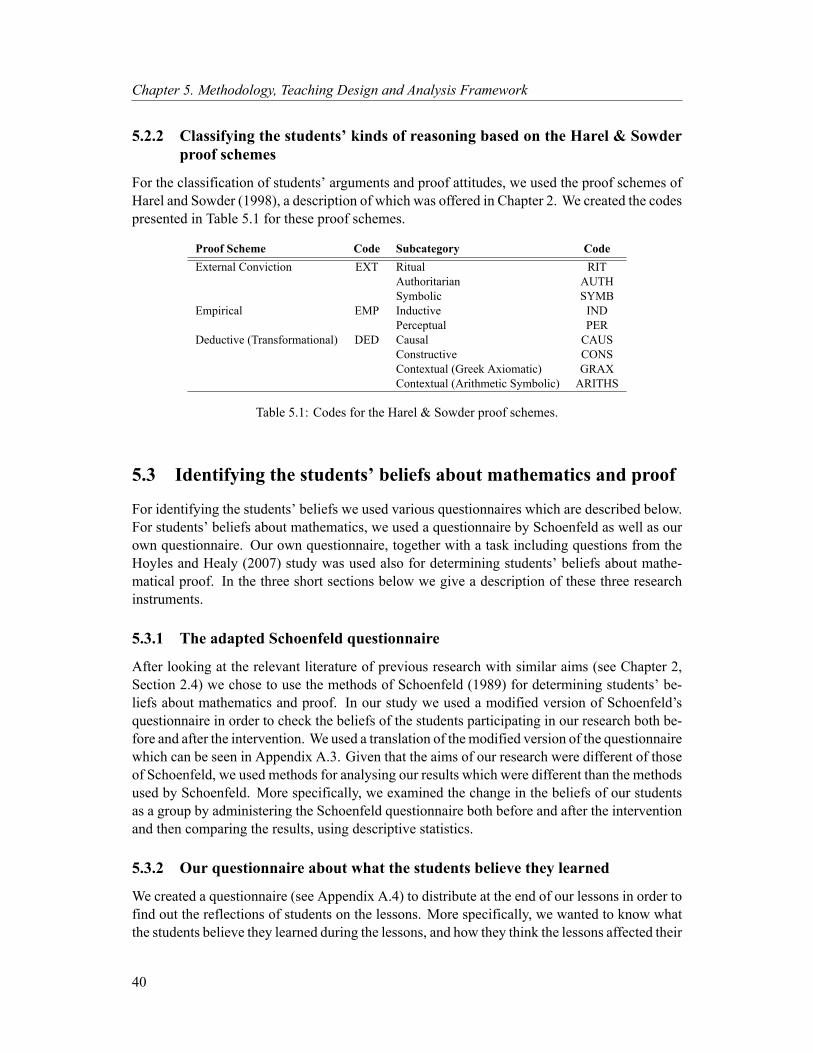
Chapter 5. Methodology, Teaching Design and Analysis Framework
5.2.2 Classifying the students’ kinds of reasoning based on the Harel & Sowderproof schemes
For the classification of students’ arguments and proof attitudes, we used the proof schemes ofHarel and Sowder (1998), a description of which was offered in Chapter 2. We created the codespresented in Table 5.1 for these proof schemes.
Proof Scheme Code Subcategory CodeExternal Conviction EXT Ritual RIT
Authoritarian AUTHSymbolic SYMB
Empirical EMP Inductive INDPerceptual PER
Deductive (Transformational) DED Causal CAUSConstructive CONSContextual (Greek Axiomatic) GRAXContextual (Arithmetic Symbolic) ARITHS
Table 5.1: Codes for the Harel & Sowder proof schemes.
5.3 Identifying the students’ beliefs about mathematics and proof
For identifying the students’ beliefs we used various questionnaires which are described below.For students’ beliefs about mathematics, we used a questionnaire by Schoenfeld as well as ourown questionnaire. Our own questionnaire, together with a task including questions from theHoyles and Healy (2007) study was used also for determining students’ beliefs about mathe-matical proof. In the three short sections below we give a description of these three researchinstruments.
5.3.1 The adapted Schoenfeld questionnaire
After looking at the relevant literature of previous research with similar aims (see Chapter 2,Section 2.4) we chose to use the methods of Schoenfeld (1989) for determining students’ be-liefs about mathematics and proof. In our study we used a modified version of Schoenfeld’squestionnaire in order to check the beliefs of the students participating in our research both be-fore and after the intervention. We used a translation of the modified version of the questionnairewhich can be seen in Appendix A.3. Given that the aims of our research were different of thoseof Schoenfeld, we used methods for analysing our results which were different than the methodsused by Schoenfeld. More specifically, we examined the change in the beliefs of our studentsas a group by administering the Schoenfeld questionnaire both before and after the interventionand then comparing the results, using descriptive statistics.
5.3.2 Our questionnaire about what the students believe they learned
We created a questionnaire (see Appendix A.4) to distribute at the end of our lessons in order tofind out the reflections of students on the lessons. More specifically, we wanted to know whatthe students believe they learned during the lessons, and how they think the lessons affected their
40

5.4. Determining the correlation between proof schemes and Van Hiele levels
way of thinking as well as their ideas about mathematics and proof. We examined the changein the beliefs of our students as a group after the intervention by using descriptive statistics.
5.3.3 An adapted version of certain JPSM project tasks
We used some of the questions in Task CHOOSING (see Appendix B.3) and Task CONCEP-TIONS ABOUT PROOF (see Appendix B.4) in order to find out the ideas of students about theconvincingness, validity and explanatory power of certain types of arguments both before andafter our intervention. This would enable us to understand whether students consider mathemat-ical proof as something which is valid and which can explain. For analysing the results, useddescriptive statistics and to check whether the change of the students’ beliefs correlates to thechange in their Van Hiele level or in their kinds of reasoning. We also compared our results tothose of Hoyles and Healy (2007).
5.4 Determining the correlation between proof schemes and VanHiele levels
As discussed in Section 2.5 there is an obvious correspondence between the Harel & Sowderproof schemes and the Van Hiele levels of thinking. More specifically, we saw (Table 2.3 onpage 17) that at the descriptive Van Hiele level students are expected to possess mainly empiricalproof schemes while at the theoretical level students are expected to possess mainly deductive-transformational proof schemes. Therefore, it is one of our hypotheses (see hypothesis H.2 inSection 3.3) that, if the test for measuring the Van Hiele level of students and our methods forclassifying students’ reasoning to Harel & Sowder proof schemes are valid, there will be a strongcorrelation between the Harel & Sowder proof schemes and the Van Hiele levels of thinking.
Our methodology for checking this was to use: (1) the Usiskin Van Hiele test to determinethe Van Hiele level of the students before and after the intervention, and (2) the coding schemefor Harel & Sowder proof schemes shown in Table 5.1 for determining the proof schemes ofstudents before and after the intervention, and to use appropriate statistical tests to determinethe correlation between the two.
5.5 Designing and evaluating a teaching strategy
We designed a cycle of lessons in order to first make students aware of the distinction betweeninductive and deductive arguments and to then give opportunities to the students to producedeductive proofs for themselves. As was discussed in Chapter 2 we think that the move fromthe descriptive to the theoretical Van Hiele level, which was the aim of our lessons, can bedone in three stages and at the same time follow the five Van Hiele teaching phases. In thetwo sections below we present the way we designed our lessons in the three stages we propose(Section 5.5.1), and the way the lessons fit with the five Van Hiele teaching phases (Section5.5.2). Finally, we present the method we used for evaluating our teaching strategy (Section5.5.3).
41
Chapter 5. Methodology, Teaching Design and Analysis Framework
5.5.1 The move from the descriptive to the theoretical level in three stages
We propose that the move from the descriptive to the theoretical Van Hiele level for the conceptof proof can be organised in three stages (see hypothesis H.3 in Section 3.3). These stages alongwith the goals in each stage and the tasks we designed for achieving them are presented below.
1. Understanding the distinction between empirical and deductive arguments. One be-gins to make the distinction between empirical and deductive arguments when one discovers thebasic differences between general (thus more convincing) arguments and arguments specific tothe figure (empirical and thus not convincing for all cases). This may happen after evaluatingthe advantages and disadvantages of both. This first ‘discovery’ which makes one aware of thedistinction between empirical and deductive arguments can be thought of as the first part of thisstage. The second part would then be when students actually understand this difference throughproducing different kinds of arguments and classifying them as empirical or deductive.
2. Abandoning the use of empirical arguments in favor of deductive ones. This stage fol-lows from the realisation during the previous stage that empirical arguments are not convincingfor all cases. After this realisation, one (by definition) starts showing a preference towards de-ductive arguments. However, coming up with deductive arguments is much more difficult thancoming up with empirical ones, especially when you are doing it for the first time. Therefore,one may stay in this stage for a long period. Moreover, depending on the individual, this stagemight take longer or less long. After sufficient practice, finding a good deductive argumentstarts happening more naturally. During this stage there might be cases when, in the absence ofan idea for a general, deductive argument, the student may offer an empirical argument whichalthough not convincing enough may be considered a better option than offering no argument.
We believe that making explicit, and practicing on, the idea that certain properties of figuresremain unaltered after applying transformations on the figures may assist the students to makingconjectures that hold generally and to finding a deductive proof. This process can be assistedby the use of dynamic software where the transformations are easy to see, however we didnot use such software in our research because of the lack of computers in the context of ourresearch. Instead, we used the idea of giving ‘movement’ to a figure in order to introduce tothe students this character of generality of certain properties of figures in Euclidean geometry,and we expected that the students would use this idea in their individual attempts to prove theirconjectures. This idea is also central to the transformational proof schemes, and especially tothe subcategory of causal proof schemes, where the reasons that cause a general property aretaken into consideration.
3. Starting to see the axiomatic structure of Euclidean geometry. In this stage the stu-dent starts to see that for the arguments that he or she comes up with, only previously provenknowledge can be used, and that it all starts from a few basic assumptions, the axioms.
Based on the above learning sequence, we designed a six session lesson for the group ofstudents selected. The above three stages that take place during the move from the descriptiveto the theoretical level played an important role in the way we designed our intervention. Belowwe explain what the goal of our intervention was in terms of each stage and what our strategyfor achieving this goal was.
42
5.5. Designing and evaluating a teaching strategy
Stage one: Understanding the distinction between empirical and deductive arguments.The first goal of our first lesson was to make the students aware of the advantages and disad-vantages of empirical and deductive arguments. The second goal was to offer them opportunitiesto begin to understand this distinction better.
To achieve the first goal we designed an activity which would lead students to make the fol-lowing discovery: empirical arguments are less convincing than deductive ones when it comesto proving that something holds for all existing cases rather than only for a few examples. Morespecifically, we asked students to share and discuss the advantages and disadvantages of theirown arguments (as well as some arguments that had been provided to them) for proving that ‘thesum of the angles of a triangle is 180°’ (see the tasks in Appendices B.2 and B.3). For that firstlesson we prepared a hand-out which would include some examples of arguments the studentswould have used as well as some of the arguments provided in Task CHOOSING which theyhad to complete the previous day (Task B.3). The handout would comprise of two columns:the first includes the arguments to be discussed and the second is blank. After discussion in theclassroom the students would be asked to fill in the blank column with the advantages and thedisadvantages that they believe each argument has. The role of the teacher is to assist and guidethe discussion, especially for making clear that we are looking for arguments that will convinceus that the proposition ‘the sum of the angles of a triangle is 180°’ is true for all triangles.
The second goal refers to students’ actual understanding of the distinction. For students toachieve real understanding we believe that they need to practice enough on their own the follow-ing: first, providing arguments to support conjectures and then commenting on the advantagesand disadvantages of their own arguments (whether empirical or deductive); second, providingboth empirical and deductive arguments for supporting the same conjecture. To promote under-standing we designed a task (see Task QUAD in Appendix B.5) for the students to complete atthe end of the first lesson. The task asks for an argument supporting the proposition ‘The sumof the angles of a quadrilateral is 360°’ as well as for a description of the advantages and the dis-advantages of the argument. With this task we aimed at finding out to what extent the studentsare able to understand whether their argument is general enough to cover all cases, and thusbegin to realise the distinction between empirical and deductive arguments. We also designed atask (see Task BIS in Appendix B.7) explicitly asking for two different kinds of arguments: onespecific to the figure and one general. This kind of task can be useful both for the students (tounderstand better the distinction between the two kinds of argumentation) and for the teacher(for assessing the understanding of students regarding this distinction).
Stage two: Abandoning the use of empirical arguments. This stage may take a long timeto be completed. The goal here is to bring students to a point where they will always try tofind deductive arguments to prove mathematical statements and never stop looking for sucharguments even when they have found an empirical argument because they will be able to realisethat empirical arguments are not considered as proof in mathematics. For achieving this, oneneeds to practice a lot the act of proving and to have many opportunities to see that empiricalarguments are not really convincing for all cases.
For this stage we created several tasks new to the students, where they could come up withtheir own conjectures (to avoid the cases where students would know already from what theylearned before that a certain conjecture was actually true) and then try to come up with con-vincing arguments. We also planned discussion time for the end of each session regarding the
43
Chapter 5. Methodology, Teaching Design and Analysis Framework
arguments and their convincingness.
Stage three: Beginning to see the axiomatic structure of Euclidean geometry. The goal ofthis stage is to lead students to a point where the axiomatic structure of Euclidean geometry isobvious to them. When students reach this stage they will be able to see that in order to proveanything in geometry you have to rely on the previous propositions you have proven, and thatit all starts from a few propositions that we accept as true without proof: the axioms. Giventhat our intervention was short and that our students started at the empirical level, our goal waslimited to just starting off our students with stage three and letting them get just a first glimpseof what this involves.
To achieve this goal, we planned the last lesson for a discussion that would lead students tostage three. We drew together with the students a ‘map’ of all propositions we had proven sofar and the connection they had with previous propositions that were used for the proof, whichwould already have been proven at an earlier stage. By discussing this map and by asking stu-dents where they think this ‘going backwards’ process of connecting to the previous propositionsproven would end, we planned to help students discover that there is a few assumptions called‘axioms’ from which all propositions in geometry are derived.
5.5.2 The five Van Hiele phases for eight concepts in our teaching sequence
As was discussed in Chapter 2 (Section 2.7), the Van Hieles presented a teaching sequence com-prised of five phases (inquiry, directed orientation, explication, free orientation and integration)for moving students from one Van Hiele level to the next. Given that we wanted to move ourstudents from the descriptive to the theoretical Van Hiele level, all tasks of the three stages inour teaching sequence were designed also based on the five Van Hiele phases (as well as thethree stages explained in the previous section).
We need to stress that the five Van Hiele phases are related to our three-stage learning se-quence. Our three-stage learning sequence is designed especially for moving students from thedescriptive to the theoretical Van Hiele level for the concept of mathematical (deductive) proof.The teaching sequence suggested by Van Hiele is also designed for this move but can be appliedto any concept. Moreover, our three-stage sequence outlines the specific tasks that need to becompleted by the student during the learning sequence for proof in mathematics with emphasisgiven to the first stage (which we consider essential for the learning sequence to be successful);on the other hand the five Van Hiele phases are more general and allow variations for the specifictasks used. The two strategies are related in the following way:
• our first stage falls into the area of the first two Van Hiele phases (inquiry, directed ori-entation) and suggests a specific strategy for completing these two phases for the conceptof proof in mathematics;
• our second stage falls into the area of the Van Hiele phases 3 and 4 (explication, freeorientation);
• our third stage falls into the area of the Van Hiele phases 4 and 5 (free orientation, inte-gration).
Below we repeat the description of each phase and we present the tasks we designed foreach phase along with a short explanation of each task and its objectives.
44

5.5. Designing and evaluating a teaching strategy
1. Inquiry: “The student learns to know the field under investigation by means of the ma-terial which is presented to him. This material leads him to discover a certain structure”(van Hiele, 1984b, p. 247).Before the beginning of the first phase, students were asked to complete a test (see TaskTRIANGLES in Appendix B.1) related to the properties of triangles, which was meant toreveal whether students were in the integration phase of the descriptive Van Hiele levelfor the concept of triangle and the properties related to triangles. The objective was tocheck how well students know the properties of figures that would be most often usedfor the proof tasks that would follow. This test was created by Burger and Shaughnessy(1986) and we adapted it and translated it into Greek in order to use it in our study.The inquiry phase of the concepts introduced during our intervention was designed bycreating the tasks described in Table 5.2. Task CHOOSING8 in combination with TaskANGLESUM and the discussion that follows it (see later phases) were the first tasks tobe used in our intervention.
Task Concept Description / ObjectivesANGLESUM(B.2)
Proving Students are asked to find an argument for showing that the sumof the angles of a triangle is 180°. (This task is combined withthe next.) The aim is to let students get involved with the field ofEuclidean geometry and the concept of providing an argumentsupporting or rejecting a mathematical proposition.
CHOOSING(B.3) - Part 1
Empiricalvs. Deductivearguments(Proof),Proving
Students choose, among various arguments, one that they thinkshows why the sum of the angles of a triangle is 180°. Some ofthe arguments are empirical and some deductive. Students answera series of closed and open questions on the convincingness of thearguments. Students will thus realise there exist different kindsof arguments in the field under investigation.
OPPANG (B.6) -Part 1
Conjecture,Theorem
Students make their own conjecture (for a familiar example). Theterm ‘conjecture’ should not be used at this stage; it is going tobe introduced in the explication phase, that is, only after the stu-dents have had some experience in making conjectures. Until thatpoint conjectures should be referred to as ‘observations’. The aimis to introduce students to the way mathematicians work whendiscovering new theorems.
AXIOMS-Part 1 Axioms, Un-defined terms,AxiomaticSystem
The teacher initiates a discussion regarding the previous knowl-edge that students used in order to prove theorems in class. Theteacher asks: ‘What knowledge did you use to prove these theo-rems? How far back do you think one can go in using previousknowledge for proving new theorems?’ A philosophical discus-sion is initiated and students are thus directed to the question‘where does it all begin?’, in the context of Euclidean geometry.
Table 5.2: Tasks used for the ‘inquiry’ phase of our teaching sequence.
It is important to note that the tasks of the inquiry phase need not all be given to students atthe beginning of the teaching sequence. Various concepts are introduced to the students,and not all at the same time. Therefore, some tasks which belong in this phase are to be
8An adapted version of a task created by Hoyles and Healy (2007).
45

Chapter 5. Methodology, Teaching Design and Analysis Framework
used at other points of the intervention than the beginning. (See Table 5.7 on page 50 fora chronological overview.) The structure that we want the students to start discovering ishighlighted in Table 5.2. Characteristic of the inquiry phase is the exploration of a newquestion without being ‘pushed’ towards the desired answer yet.
2. Directed orientation: “The student explores the field of investigation by means of thematerial. He already knows in what direction the study is directed; the material is chosenin such a way that the characteristic structures appear to him gradually” (van Hiele, 1984b,p. 247).Like before, there are various concepts students work towards during this phase. Thetasks we designed (Table 5.3) aim at helping students to discover the characteristic struc-tures of Euclidean geometry through the individual concepts introduced (Proof, Proving,Theorem, Conjecture, Counterexample, Axioms, Axiomatic System).
Task Concept Description / ObjectivesCHOOSING(B.3) -Part 2
Proof,Proving,Counterex-ample
A thorough discussion, guided by the teacher, on the advantages and disadvantagesof all arguments that the students came up with in Part 1 of this task. Studentscome up with the advantages and disadvantages of each argument and theteacher does not use any of the terminology that is still unknown to the students(like ‘proof’, ‘deductive argument’, ‘inductive argument’).
QUAD(B.5)
Proof, Prov-ing
Students give an argument for a certain proposition familiar to them and are di-rected to offer the advantages and disadvantages of their own argument basedto a great extent on the earlier discussion on advantages and disadvantages of otherarguments.
BIS (B.7) Proof,Proving,Theorem,Conjecture
Students make their own conjectures for a certain figure and provide two kindsof argument: one practical that depends on the figure (empirical/inductive) andone theoretical that does not depend on the figure (deductive). Students are thusdirected to understand better the distinction between these two kinds of argu-ments by experiencing coming up with both for the same conjecture.
OPPANG(B.6)
Proof,Proving,Theorem,Conjecture
Students provide arguments to convince others about the truth or the falsity oftheir own conjecture (for a familiar example). Students are thus expected to startabandoning the empirical proof schemes in favour of deductive ones.
IF-THEN(B.13)-Part 1
Implication,Inverseimplication
An ‘if then’ proposition (for which the inverse does not hold) is to be proven bythe students. Students are then asked to think about the inverse proposition andwhether that would also hold. (This task belongs also to the free orientation phasefor the concepts of Proving, Proof, and Theorem.) Students’ attention is directedtowards the form of the proposition (implication).
TRIMID(B.10)
Counter-example
All students have to give arguments for two conjectures. Without them knowingin advance, one of the conjectures should be true and one false. Students arethis way directed to discover what kind of arguments are used for disprovingconjectures (counterexample).
AXIOMS- Part 2
Axioms,Undefinedterms, Ax-iomaticSystem
The teacher puts on display some of the main theorems proven earlier in class, andasks students what they had used to prove these theorems. As students reply, theteacher draws a backwards diagram of what other propositions were used. Theobjective is to arrive at a ‘dead end’ which is the axioms that form the basisof Euclidean geometry. This task directs students to discover specific axioms,namely the ones that were used during the intervention.
Table 5.3: Tasks used for the ‘directed orientation’ phase of our teaching sequence.
46
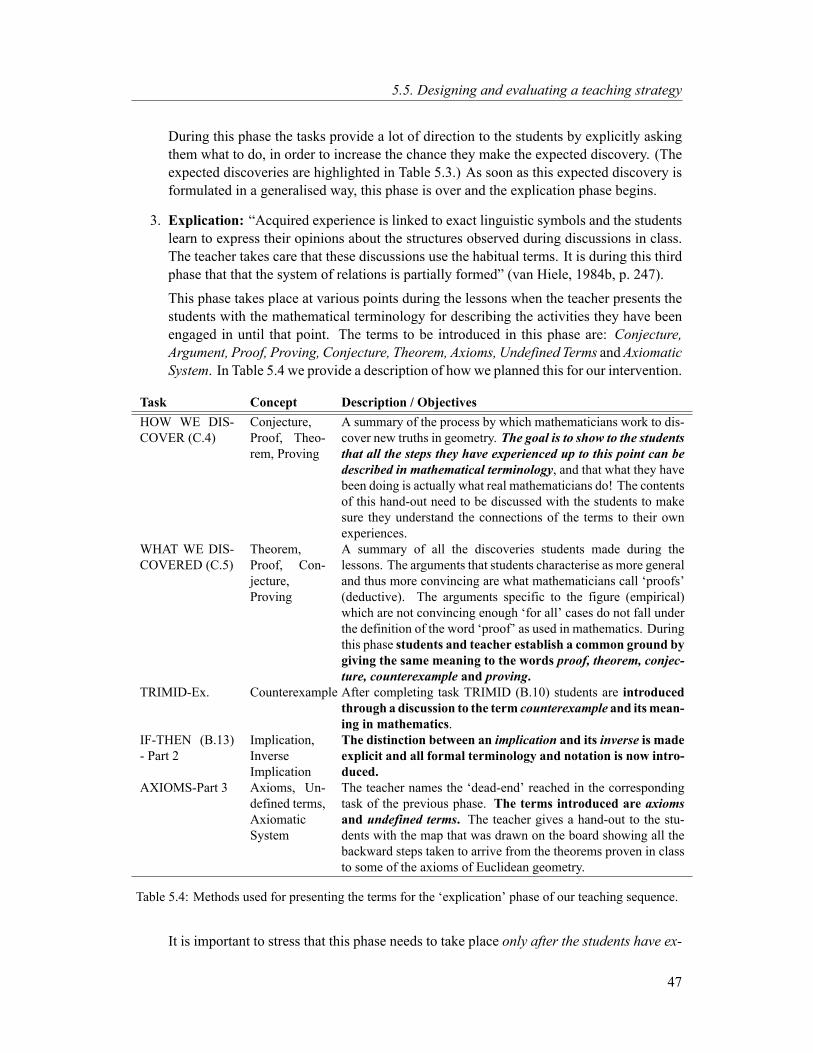
5.5. Designing and evaluating a teaching strategy
During this phase the tasks provide a lot of direction to the students by explicitly askingthem what to do, in order to increase the chance they make the expected discovery. (Theexpected discoveries are highlighted in Table 5.3.) As soon as this expected discovery isformulated in a generalised way, this phase is over and the explication phase begins.
3. Explication: “Acquired experience is linked to exact linguistic symbols and the studentslearn to express their opinions about the structures observed during discussions in class.The teacher takes care that these discussions use the habitual terms. It is during this thirdphase that that the system of relations is partially formed” (van Hiele, 1984b, p. 247).
This phase takes place at various points during the lessons when the teacher presents thestudents with the mathematical terminology for describing the activities they have beenengaged in until that point. The terms to be introduced in this phase are: Conjecture,Argument, Proof, Proving, Conjecture, Theorem, Axioms, Undefined Terms andAxiomaticSystem. In Table 5.4 we provide a description of howwe planned this for our intervention.
Task Concept Description / ObjectivesHOW WE DIS-COVER (C.4)
Conjecture,Proof, Theo-rem, Proving
A summary of the process by which mathematicians work to dis-cover new truths in geometry. The goal is to show to the studentsthat all the steps they have experienced up to this point can bedescribed in mathematical terminology, and that what they havebeen doing is actually what real mathematicians do! The contentsof this hand-out need to be discussed with the students to makesure they understand the connections of the terms to their ownexperiences.
WHAT WE DIS-COVERED (C.5)
Theorem,Proof, Con-jecture,Proving
A summary of all the discoveries students made during thelessons. The arguments that students characterise as more generaland thus more convincing are what mathematicians call ‘proofs’(deductive). The arguments specific to the figure (empirical)which are not convincing enough ‘for all’ cases do not fall underthe definition of the word ‘proof’ as used in mathematics. Duringthis phase students and teacher establish a common ground bygiving the same meaning to the words proof, theorem, conjec-ture, counterexample and proving.
TRIMID-Ex. Counterexample After completing task TRIMID (B.10) students are introducedthrough a discussion to the term counterexample and itsmean-ing in mathematics.
IF-THEN (B.13)- Part 2
Implication,InverseImplication
The distinction between an implication and its inverse is madeexplicit and all formal terminology and notation is now intro-duced.
AXIOMS-Part 3 Axioms, Un-defined terms,AxiomaticSystem
The teacher names the ‘dead-end’ reached in the correspondingtask of the previous phase. The terms introduced are axiomsand undefined terms. The teacher gives a hand-out to the stu-dents with the map that was drawn on the board showing all thebackward steps taken to arrive from the theorems proven in classto some of the axioms of Euclidean geometry.
Table 5.4: Methods used for presenting the terms for the ‘explication’ phase of our teaching sequence.
It is important to stress that this phase needs to take place only after the students have ex-
47
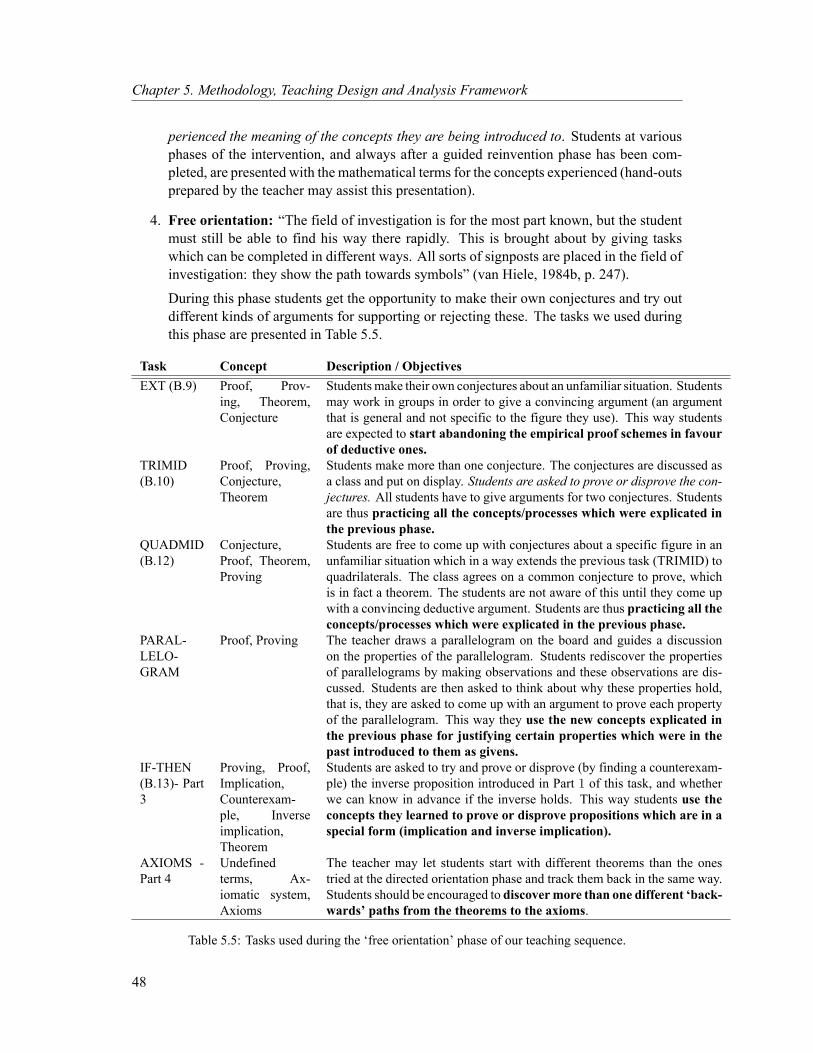
Chapter 5. Methodology, Teaching Design and Analysis Framework
perienced the meaning of the concepts they are being introduced to. Students at variousphases of the intervention, and always after a guided reinvention phase has been com-pleted, are presented with the mathematical terms for the concepts experienced (hand-outsprepared by the teacher may assist this presentation).
4. Free orientation: “The field of investigation is for the most part known, but the studentmust still be able to find his way there rapidly. This is brought about by giving taskswhich can be completed in different ways. All sorts of signposts are placed in the field ofinvestigation: they show the path towards symbols” (van Hiele, 1984b, p. 247).
During this phase students get the opportunity to make their own conjectures and try outdifferent kinds of arguments for supporting or rejecting these. The tasks we used duringthis phase are presented in Table 5.5.
Task Concept Description / ObjectivesEXT (B.9) Proof, Prov-
ing, Theorem,Conjecture
Studentsmake their own conjectures about an unfamiliar situation. Studentsmay work in groups in order to give a convincing argument (an argumentthat is general and not specific to the figure they use). This way studentsare expected to start abandoning the empirical proof schemes in favourof deductive ones.
TRIMID(B.10)
Proof, Proving,Conjecture,Theorem
Students make more than one conjecture. The conjectures are discussed asa class and put on display. Students are asked to prove or disprove the con-jectures. All students have to give arguments for two conjectures. Studentsare thus practicing all the concepts/processes which were explicated inthe previous phase.
QUADMID(B.12)
Conjecture,Proof, Theorem,Proving
Students are free to come up with conjectures about a specific figure in anunfamiliar situation which in a way extends the previous task (TRIMID) toquadrilaterals. The class agrees on a common conjecture to prove, whichis in fact a theorem. The students are not aware of this until they come upwith a convincing deductive argument. Students are thus practicing all theconcepts/processes which were explicated in the previous phase.
PARAL-LELO-GRAM
Proof, Proving The teacher draws a parallelogram on the board and guides a discussionon the properties of the parallelogram. Students rediscover the propertiesof parallelograms by making observations and these observations are dis-cussed. Students are then asked to think about why these properties hold,that is, they are asked to come up with an argument to prove each propertyof the parallelogram. This way they use the new concepts explicated inthe previous phase for justifying certain properties which were in thepast introduced to them as givens.
IF-THEN(B.13)- Part3
Proving, Proof,Implication,Counterexam-ple, Inverseimplication,Theorem
Students are asked to try and prove or disprove (by finding a counterexam-ple) the inverse proposition introduced in Part 1 of this task, and whetherwe can know in advance if the inverse holds. This way students use theconcepts they learned to prove or disprove propositions which are in aspecial form (implication and inverse implication).
AXIOMS -Part 4
Undefinedterms, Ax-iomatic system,Axioms
The teacher may let students start with different theorems than the onestried at the directed orientation phase and track them back in the same way.Students should be encouraged to discovermore than one different ‘back-wards’ paths from the theorems to the axioms.
Table 5.5: Tasks used during the ‘free orientation’ phase of our teaching sequence.
48
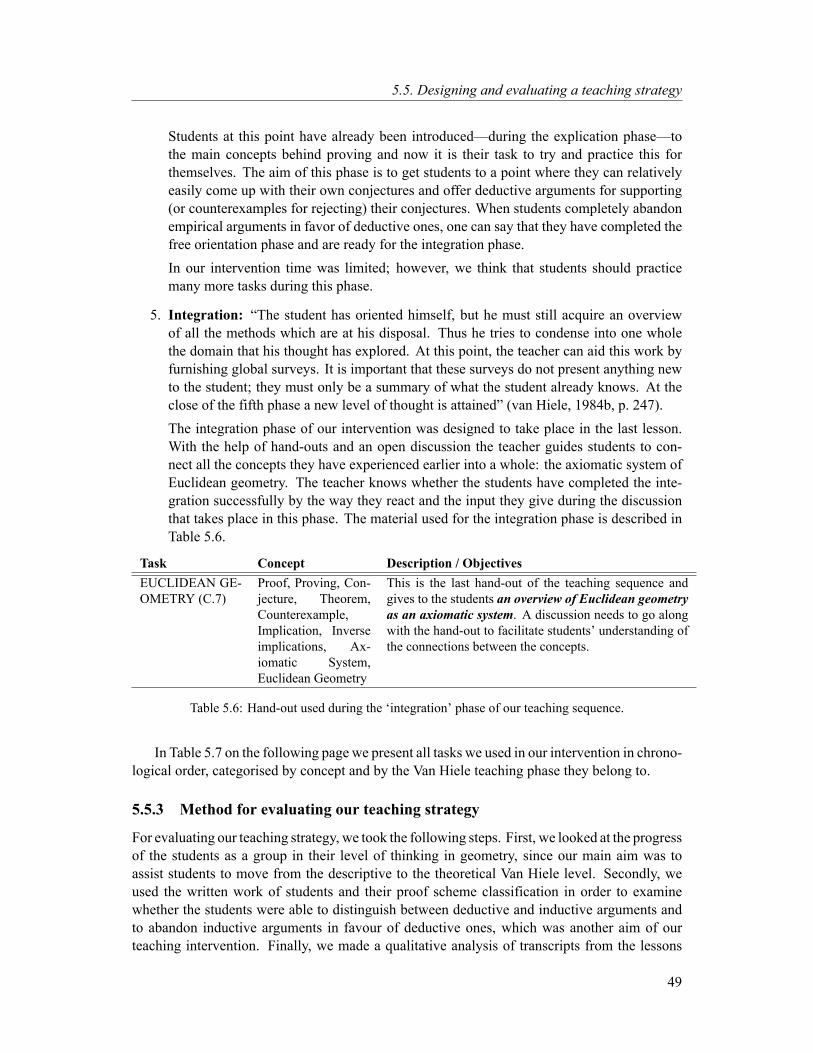
5.5. Designing and evaluating a teaching strategy
Students at this point have already been introduced—during the explication phase—tothe main concepts behind proving and now it is their task to try and practice this forthemselves. The aim of this phase is to get students to a point where they can relativelyeasily come up with their own conjectures and offer deductive arguments for supporting(or counterexamples for rejecting) their conjectures. When students completely abandonempirical arguments in favor of deductive ones, one can say that they have completed thefree orientation phase and are ready for the integration phase.In our intervention time was limited; however, we think that students should practicemany more tasks during this phase.
5. Integration: “The student has oriented himself, but he must still acquire an overviewof all the methods which are at his disposal. Thus he tries to condense into one wholethe domain that his thought has explored. At this point, the teacher can aid this work byfurnishing global surveys. It is important that these surveys do not present anything newto the student; they must only be a summary of what the student already knows. At theclose of the fifth phase a new level of thought is attained” (van Hiele, 1984b, p. 247).The integration phase of our intervention was designed to take place in the last lesson.With the help of hand-outs and an open discussion the teacher guides students to con-nect all the concepts they have experienced earlier into a whole: the axiomatic system ofEuclidean geometry. The teacher knows whether the students have completed the inte-gration successfully by the way they react and the input they give during the discussionthat takes place in this phase. The material used for the integration phase is described inTable 5.6.
Task Concept Description / ObjectivesEUCLIDEAN GE-OMETRY (C.7)
Proof, Proving, Con-jecture, Theorem,Counterexample,Implication, Inverseimplications, Ax-iomatic System,Euclidean Geometry
This is the last hand-out of the teaching sequence andgives to the students an overview of Euclidean geometryas an axiomatic system. A discussion needs to go alongwith the hand-out to facilitate students’ understanding ofthe connections between the concepts.
Table 5.6: Hand-out used during the ‘integration’ phase of our teaching sequence.
In Table 5.7 on the following page we present all tasks we used in our intervention in chrono-logical order, categorised by concept and by the Van Hiele teaching phase they belong to.
5.5.3 Method for evaluating our teaching strategy
For evaluating our teaching strategy, we took the following steps. First, we looked at the progressof the students as a group in their level of thinking in geometry, since our main aim was toassist students to move from the descriptive to the theoretical Van Hiele level. Secondly, weused the written work of students and their proof scheme classification in order to examinewhether the students were able to distinguish between deductive and inductive arguments andto abandon inductive arguments in favour of deductive ones, which was another aim of ourteaching intervention. Finally, we made a qualitative analysis of transcripts from the lessons
49
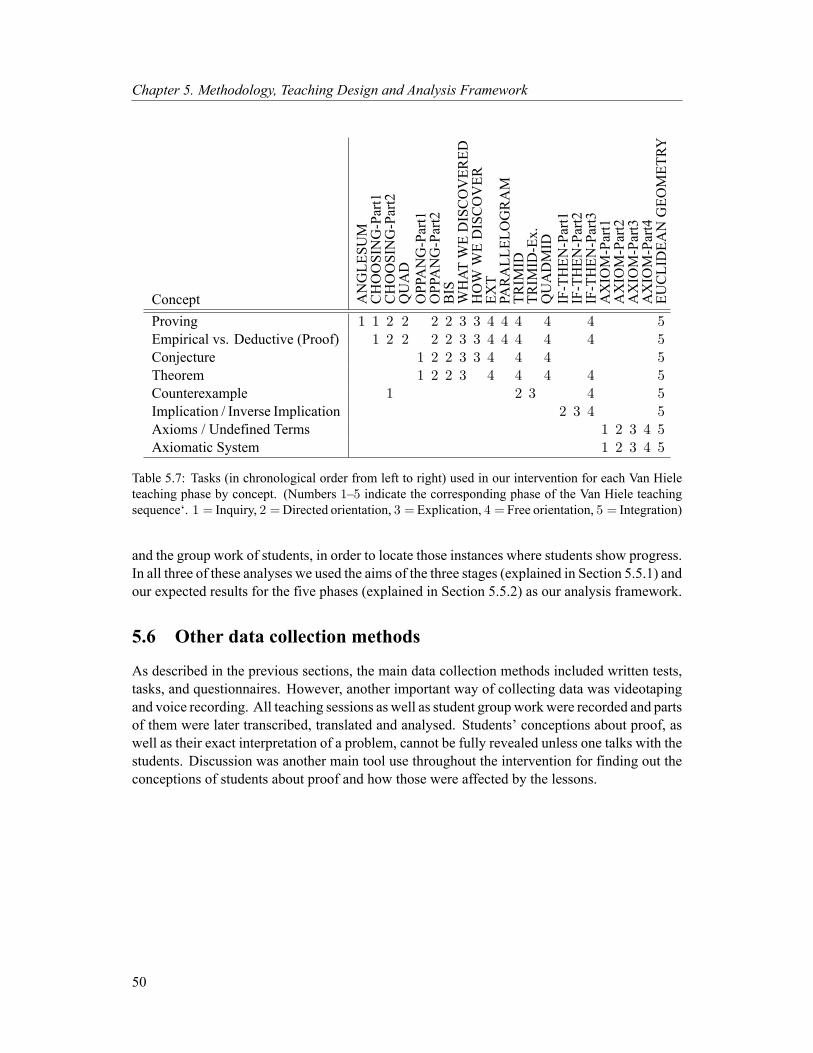
Chapter 5. Methodology, Teaching Design and Analysis Framework
Concept ANGLE
SUM
CHOOSING-Part1
CHOOSING-Part2
QUAD
OPPANG-Part1
OPPANG-Part2
BIS
WHAT
WEDISCOVER
EDHOW
WEDISCOVER
EXT
PARALL
ELOGRAM
TRIM
IDTR
IMID-Ex.
QUADMID
IF-THEN
-Part1
IF-THEN
-Part2
IF-THEN
-Part3
AXIOM-Part1
AXIOM-Part2
AXIOM-Part3
AXIOM-Part4
EUCLIDEA
NGEO
MET
RY
Proving 1 1 2 2 2 2 3 3 4 4 4 4 4 5Empirical vs. Deductive (Proof) 1 2 2 2 2 3 3 4 4 4 4 4 5Conjecture 1 2 2 3 3 4 4 4 5Theorem 1 2 2 3 4 4 4 4 5Counterexample 1 2 3 4 5Implication / Inverse Implication 2 3 4 5Axioms / Undefined Terms 1 2 3 4 5Axiomatic System 1 2 3 4 5
Table 5.7: Tasks (in chronological order from left to right) used in our intervention for each Van Hieleteaching phase by concept. (Numbers 1–5 indicate the corresponding phase of the Van Hiele teachingsequence‘. 1 = Inquiry, 2 =Directed orientation, 3 = Explication, 4 = Free orientation, 5 = Integration)
and the group work of students, in order to locate those instances where students show progress.In all three of these analyses we used the aims of the three stages (explained in Section 5.5.1) andour expected results for the five phases (explained in Section 5.5.2) as our analysis framework.
5.6 Other data collection methods
As described in the previous sections, the main data collection methods included written tests,tasks, and questionnaires. However, another important way of collecting data was videotapingand voice recording. All teaching sessions as well as student groupworkwere recorded and partsof them were later transcribed, translated and analysed. Students’ conceptions about proof, aswell as their exact interpretation of a problem, cannot be fully revealed unless one talks with thestudents. Discussion was another main tool use throughout the intervention for finding out theconceptions of students about proof and how those were affected by the lessons.
50
Chapter 6
The Intervention
6.1 Population and sample
Population The main aim of our study was to find out how the students’ reasoning changeswhen moving from the descriptive to the theoretical Van Hiele level while doing geometricalproofs, and how their beliefs about mathematics and proof are then affected. Because our mainaim is directly related to proofs in geometry and to students who start at the descriptive VanHielelevel, we had to choose a population of students who are likely to be at this Van Hiele level ofthinking in geometry at the start of our teaching intervention. As was explained in Chapter 4,in the Greek Gymnasium students are introduced only to practical geometry which is based onintuition and requires empirical reasoning (the descriptive Van Hiele level). It is only when theyenter the upper secondary school (Lyceum) that students are introduced to theoretical geometry(the theoretical Van Hiele level). Therefore, our population has to be comprised of students atthe last Gymnasium level (level Γ’). In order to ensure that our population is heterogeneous asto the background of students, we chose our population to come from Greek public schools.1
Another characteristic of our population is that it should be comprised of students of rela-tively good ability in Mathematics. This was necessary in order to ensure that the students hadachieved a relatively good mastery of the descriptive Van Hiele level before participating in ourintervention. It was important for our research to have students who were not only already inthe descriptive Van Hiele level, but also ready to make the move to the theoretical level.
Finally, our population is comprised of motivated students. For practical reasons the re-search had to take place outside of ordinary school hours. Therefore, we had to ask for volun-teers, which made it inevitable to attract the more motivated students. We decided that indeedthis population is interesting in itself. To summarise the above, the population about which wewould like to generalise can be characterised as follows:
Motivated students of the Γ’ Gymnasium level (14–15 years old) in Greek publicschools who have a relatively good mastery of the descriptive Van Hiele level.
Sample selection method For our teaching intervention we needed to select a small sample ofstudents (no more than 30, given that the researcher would be the only teacher) at the descriptiveVan Hiele level. The selection was made based firstly on a pre-test for classifying students into
1The characteristics of Greek public schools were described in Chapter 4.
51
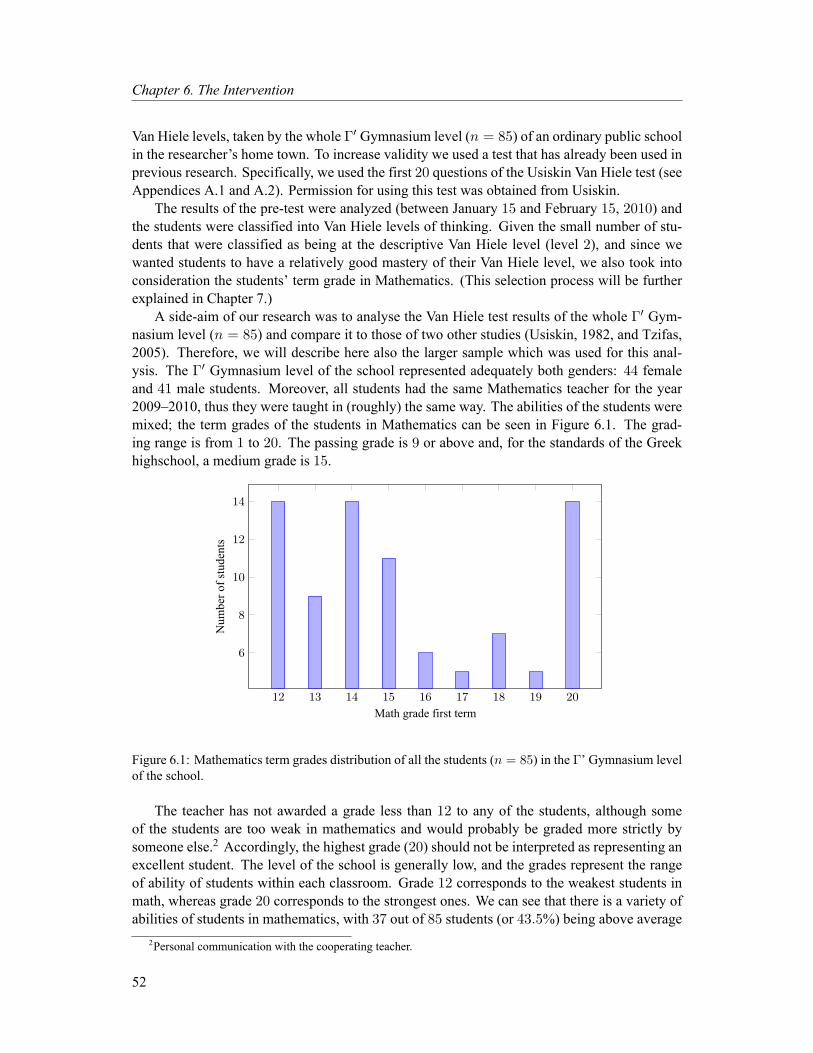
Chapter 6. The Intervention
Van Hiele levels, taken by the whole Γ′ Gymnasium level (n = 85) of an ordinary public schoolin the researcher’s home town. To increase validity we used a test that has already been used inprevious research. Specifically, we used the first 20 questions of the Usiskin Van Hiele test (seeAppendices A.1 and A.2). Permission for using this test was obtained from Usiskin.
The results of the pre-test were analyzed (between January 15 and February 15, 2010) andthe students were classified into Van Hiele levels of thinking. Given the small number of stu-dents that were classified as being at the descriptive Van Hiele level (level 2), and since wewanted students to have a relatively good mastery of their Van Hiele level, we also took intoconsideration the students’ term grade in Mathematics. (This selection process will be furtherexplained in Chapter 7.)
A side-aim of our research was to analyse the Van Hiele test results of the whole Γ′ Gym-nasium level (n = 85) and compare it to those of two other studies (Usiskin, 1982, and Tzifas,2005). Therefore, we will describe here also the larger sample which was used for this anal-ysis. The Γ′ Gymnasium level of the school represented adequately both genders: 44 femaleand 41 male students. Moreover, all students had the same Mathematics teacher for the year2009–2010, thus they were taught in (roughly) the same way. The abilities of the students weremixed; the term grades of the students in Mathematics can be seen in Figure 6.1. The grad-ing range is from 1 to 20. The passing grade is 9 or above and, for the standards of the Greekhighschool, a medium grade is 15.
.....
12
.
13
.
14
.
15
.
16
.
17
.
18
.
19
.
20
.6
.
8
.
10
.
12
.
14
.
Math grade first term
.
Num
berofstudents
Figure 6.1: Mathematics term grades distribution of all the students (n = 85) in the Γ’ Gymnasium levelof the school.
The teacher has not awarded a grade less than 12 to any of the students, although someof the students are too weak in mathematics and would probably be graded more strictly bysomeone else.2 Accordingly, the highest grade (20) should not be interpreted as representing anexcellent student. The level of the school is generally low, and the grades represent the rangeof ability of students within each classroom. Grade 12 corresponds to the weakest students inmath, whereas grade 20 corresponds to the strongest ones. We can see that there is a variety ofabilities of students in mathematics, with 37 out of 85 students (or 43.5%) being above average
2Personal communication with the cooperating teacher.
52
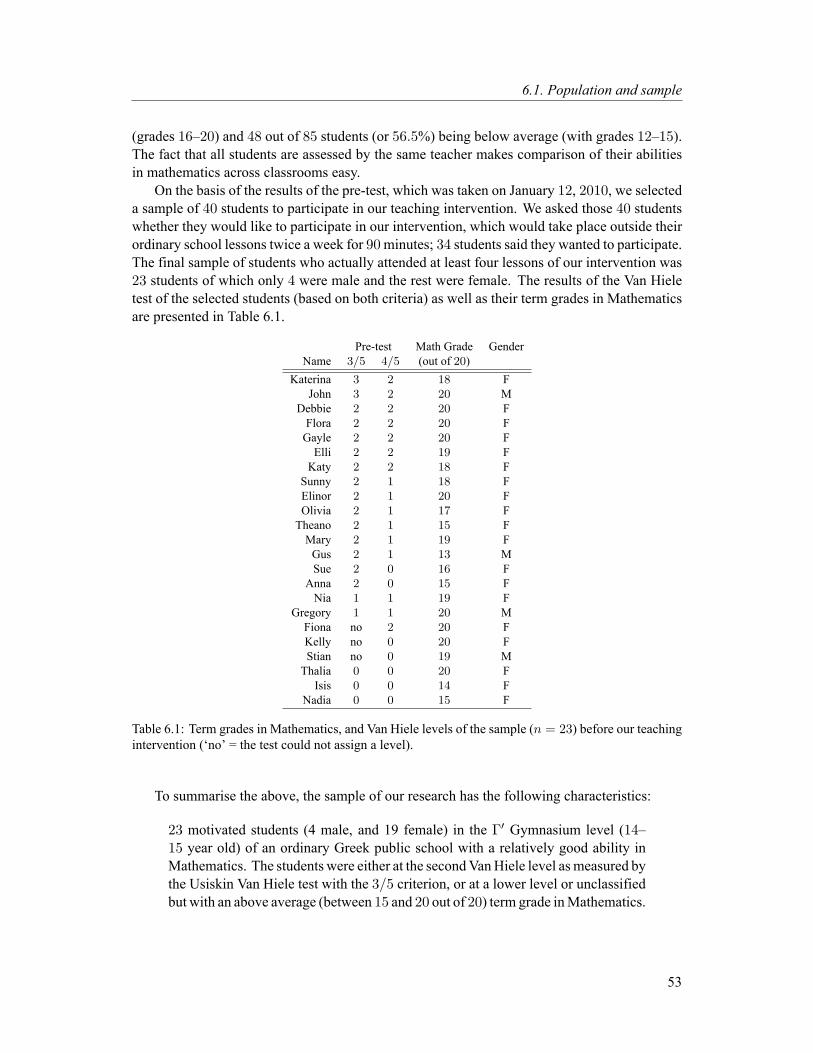
6.1. Population and sample
(grades 16–20) and 48 out of 85 students (or 56.5%) being below average (with grades 12–15).The fact that all students are assessed by the same teacher makes comparison of their abilitiesin mathematics across classrooms easy.
On the basis of the results of the pre-test, which was taken on January 12, 2010, we selecteda sample of 40 students to participate in our teaching intervention. We asked those 40 studentswhether they would like to participate in our intervention, which would take place outside theirordinary school lessons twice a week for 90minutes; 34 students said they wanted to participate.The final sample of students who actually attended at least four lessons of our intervention was23 students of which only 4 were male and the rest were female. The results of the Van Hieletest of the selected students (based on both criteria) as well as their term grades in Mathematicsare presented in Table 6.1.
Pre-test Math Grade GenderName 3/5 4/5 (out of 20)
Katerina 3 2 18 FJohn 3 2 20 M
Debbie 2 2 20 FFlora 2 2 20 FGayle 2 2 20 FElli 2 2 19 FKaty 2 2 18 F
Sunny 2 1 18 FElinor 2 1 20 FOlivia 2 1 17 FTheano 2 1 15 FMary 2 1 19 FGus 2 1 13 MSue 2 0 16 F
Anna 2 0 15 FNia 1 1 19 F
Gregory 1 1 20 MFiona no 2 20 FKelly no 0 20 FStian no 0 19 MThalia 0 0 20 F
Isis 0 0 14 FNadia 0 0 15 F
Table 6.1: Term grades in Mathematics, and Van Hiele levels of the sample (n = 23) before our teachingintervention (‘no’ = the test could not assign a level).
To summarise the above, the sample of our research has the following characteristics:
23 motivated students (4 male, and 19 female) in the Γ′ Gymnasium level (14–15 year old) of an ordinary Greek public school with a relatively good ability inMathematics. The students were either at the secondVanHiele level asmeasured bythe Usiskin Van Hiele test with the 3/5 criterion, or at a lower level or unclassifiedbut with an above average (between 15 and 20 out of 20) term grade inMathematics.
53

Chapter 6. The Intervention
6.2 Student participation
On February 26, 2010, the orientation meeting of our intervention took place, in which webriefly discussed the form of the lessons and the schedule of the meetings. The actual lessonsbegan on March 4, 2010 and ended on March 27, 2010. The first and the last meetings of theselessons were entirely reserved for the pre- and post-tests respectively. Out of the 28 students thatparticipated in the intervention, only 19 were present at both these meetings. Between March 4and 27 there were six meetings in which the students had to complete tasks individually or ingroups, and to discuss their ideas. Table 6.2 shows an overview of the meetings’ time line andof the number of students present. We also present the detailed list of students’ nicknames andabsences in Table 6.3.
Date Activity Students presentJan 12 Usiskin Van Hiele test 85Feb 26 Orientation meeting 20Mar 4 Pre-tests 24Mar 6 Lesson 1 25Mar 11 Lesson 2 22Mar 13 Lesson 3 23Mar 18 Lesson 4 18Mar 20 Lesson 5 16Mar 24 Lesson 6 19Mar 27 Post-tests 20
Table 6.2: Timeline of our teaching intervention and number of students present.
Only 12 students were present in all meetings from the 4th to the 27th of March. For thesestudents we can follow their progress through the lessons without any problems. An extra fivestudents were absent only once, and this one absence was neither on the pre-test nor on the post-test day; two students were absent only two times and again their absences were neither on thepre-test nor on the post-test day, so for these students we can also follow their progress withoutmuch problem. In total, there are 19 students whose progress we can follow from the data wehave collected. We will not consider at all for our analysis those students who participated inless than two meetings.
54

6.3. Diary of the intervention
Student name VanHielepre-test
OrientationMeetin
g
Other
Pre-tests
Lesson1
Lesson2
Lesson3
Lesson4
Lesson5
Lesson6
AllPost-tets
1. Gregory ∗ ∗ ∗ ∗ ∗ ∗ ∗ ∗ ∗ ∗2. Kelly ∗ ∗ ∗ ∗ ∗ ∗ ∗ ∗ ∗ ∗3. Elli ∗ ∗ ∗ ∗ ∗ ∗ ∗ ∗ ∗ ∗4. Nia ∗ ∗ ∗ ∗ ∗ ∗ ∗ ∗ ∗ ∗5. Mary ∗ ∗ ∗ ∗ ∗ ∗ ∗ ∗ ∗ ∗6. John ∗ ∗ ∗ ∗ ∗ ∗ ∗ ∗ ∗ ∗7. Flora ∗ ∗ ∗ ∗ ∗ ∗ ∗ ∗ ∗ ∗8. Katy ∗ ∗ ∗ ∗ ∗ ∗ ∗ ∗ ∗ ∗9. Debbie ∗ ∗ ∗ ∗ ∗ ∗ ∗ ∗ ∗ ∗10. Nadia ∗ ∗ ∗ ∗ ∗ ∗ ∗ ∗ ∗ ∗11. Thalia ∗ ∗ ∗ ∗ ∗ ∗ ∗ ∗ ∗12. Olivia ∗ ∗ ∗ ∗ ∗ ∗ ∗ ∗ ∗13. Theano ∗ ∗ ∗ ∗ ∗ ∗ ∗ ∗14. Gayle ∗ ∗ ∗ ∗ ∗ ∗ ∗ ∗ ∗15. Sue ∗ ∗ ∗ ∗ ∗ ∗ ∗ ∗16. Katerina ∗ ∗ ∗ ∗ ∗ ∗ ∗ ∗17. Fiona ∗ ∗ ∗ ∗ ∗ ∗ ∗ ∗18. Isis ∗ ∗ ∗ ∗ ∗ ∗ ∗ ∗ ∗19. Sunny ∗ ∗ ∗ ∗ ∗ ∗ ∗20. Elinor ∗ ∗ ∗ ∗ ∗ ∗ ∗ ∗ ∗21. Anna ∗ ∗ ∗ ∗ ∗22. Gus ∗ ∗ ∗ ∗ ∗23. Stian ∗ ∗ ∗ ∗ ∗24. Gary ∗ ∗25. Minas ∗ ∗ ∗ ∗26. Chrystal ∗ ∗27. Alice ∗ ∗ ∗28. Elisa ∗ ∗ ∗Total Present 28 20 24 25 22 23 18 16 19 20
Table 6.3: Students’ absences during the intervention (∗ = present).
6.3 Diary of the intervention
Below we provide a description of what took place in the classroom in each of the meetings withthe students. An overview of the tasks completed by the students as well as the main points thatcame out of the group discussions and the atmosphere in the classroom is presented.
1st meeting: orientation
Date Duration No. students ActivitiesFeb 26, 2010 15 min. 20 Hand-out ‘Geometry and proof with different eyes’
The purpose of the meeting was to introduce the expectations of the lessons to the partici-pating students. To motivate the volunteering students to attend all lessons of the intervention,
55

Chapter 6. The Intervention
they were promised to get a present at the end of the intervention along with a certificate ofattendance. The condition was that they would not miss any of the lessons (with a maximum ofone absent in case they had a valid excuse). The students were given a handout called ‘Geome-try and proof with different eyes…’ (see Appendix C.2) which included information about theexpectations in the lessons, and what students will gain if they participate in all lessons. Manystudents were absent because some of their school lessons that day were canceled and they didnot want to spend their whole afternoon at school waiting for our meeting. Absent studentswould be informed about what happened during this meeting by their present classmates.
2nd meeting: pre-tests
Date Duration No. students ActivitiesMar 4, 2010 90 min. 24 Task TRIANGLES (Appendix B.1)
Task ANGLESUM (Appendix B.2)Task CHOOSING (Appendix B.3)Task CONCEPTIONS ABOUT PROOF (Appendix B.4)
The students were quite chatty and disappointed they had to do so many tests; they werecomplaining and asking whether the following lessons would also be like this (although theyhad already been told in the previous meeting that this was not going to be the case). In TaskANGLESUM the students did not understand what they needed to do and did not know whereto start. This shows that the students were not familiar with proving (as it was expected). Theyalso had difficulty understanding some of the questions, especially the proofs, given in TaskCHOOSING so they kept asking questions throughout the test. The researcher made sure thatthe answers would clarify the questions of students without revealing the correct answer.
3rd meeting: lesson 1
Date Duration No. students ActivitiesMar 6, 2010 90 min. 25 Discussion / Hand-out Pros and Cons (Appendix C.3)
Task QUAD (Appendix B.5)
The lesson started with a discussion of students’ answers in Task ANGLESUM. A hand outwas given to the students (see Appendix C.3) with various of their own proofs but also of theproofs that were included in Task CHOOSING as sample proofs (Eleni’s, Georgia’s and Left-eris’s proofs). Beside each proof there was space for writing the advantages and the disadvan-tages of each proof. Proofs in this first lesson were not referred to by the teacher with the word‘proof’, but rather with the word ‘arguments’ which all have advantages and disadvantages.
The students came up with interesting ideas about possible advantages and disadvantagesfor each argument. Almost all of them could see that the restriction to one specific figure isa disadvantage and that it makes an argument less convincing, although they all agreed that itmight be more practical and easy. At the beginning of the lesson the teacher stressed that theproposition ‘The sum of the angles of any triangle is 180°’ is not already true and that whenasked to show that this proposition is true, this means that it might be either true or false; bothoptions are possible. This was not immediately understood by the students, as the discussion
56

6.3. Diary of the intervention
in class revealed. This was evident also in the work of students, since several students in TaskANGLESUM used a circular argument because they assumed the proposition already to be true.
There was an opportunity to talk about the ‘proof by contradiction’ idea since one girl hadtried to prove the proposition by assuming that the sum of the angles of a triangle is either less ormore than 180°, and ending up with a non-triangular shape. There was also a discussion abouttransformational reasoning, because the teacher stressed that some of the proofs include somekind of ‘movement’. The class agreed on calling this: ‘it has movement’, and decided it is to beadded on the ‘advantages’ column. It was also noted that moving the figure helps one considermore cases so it helps to move from a more specific to a more general argument. A discussionabout practical and theoretical arguments was also included in this meeting.
In general students were participating and contributing a lot and seemed to enjoy the lesson.For the last ten minutes the teacher asked students to complete Task QUAD. The teacher stressedthat now students could take as a given that the sum of the angles of a triangle is 180°. Itis interesting to note that although many students chose to measure the angles of one specificquadrilateral in order to show that the proposition is true (possibly because it is the easiest todo), they commented on it as having the disadvantage of not being very convincing because itis specific to the figure they drew.
4th meeting: lesson 2
Date Duration No. students ActivitiesMar 11, 2010 90 min. 22 Task OPPANG (Appendix B.6)
Task BIS (Appendix B.7)
Task OPPANG started with the teacher showing on the board two intersecting lines (seealso Figure 6.2). The teacher said to the students that from now on she would not offer readymathematical statements to be proven, but students would observe a figure and formulate theirown general mathematical statements. Some of the propositions may turn out to be correct forthe general case, and some wrong. The students were then asked to guess what relations holdbetween some of the angles that are formed by the intersecting lines. Here are some of thestudents’ observations:
1. Adjacent angles add up to 180°.
2. Opposing angles are equal.
3. All four angles together add up to 360°.
A fourth observation was brought up by the teacher and it was the following:
4. The sum of the pair of the smaller angles is equal to 60°.
The teacher had drawn the figure in such a way so that when she measured them they reallyadded up to 60°. This was done in order to see whether the students would realize that this iswrong because it does not hold in general but depends on the specific figure.
The students very quickly came up with arguments for the first, third and fourth observations(they already knew and took as a given that the straight line has 180°and the circle has 360°).
57

Chapter 6. The Intervention
Figure 6.2: Making conjectures about the properties of opposing angles.
However, they had difficulty finding an argument for the second guess because they again tookit as a given (students had learned this before as a fact in their mathematics lesson). The studentswere then asked to work on finding a proof individually, and while the sheets were being handedout students were complaining loudly: ‘We know this is true!’ Students were given some time towork on it, and only two or three of them managed to come up with a deductive argument. Theteacher talked to them about the ‘movement’ idea in order to give them a hint: she took two pensin her hands as if they were two intersecting lines and turned them around their intersecting pointin order to show that something remains always the same, namely the sum of two neighboringangles. So the teacher told them they can use this fact in order to give a general argument aboutthe second proposition.
In total seven students gave a correct deductive argument, three of which had given an empir-ical argument in the previous lesson; three students gave a wrong deductive argument, probablyguided by the teacher but not having enough hints. One of those three had given an empiricalargument last time, while the rest had given a deductive argument. When the students finishedthe individual work on this proof, the teacher presented the problem on the board. The teacherdrew two new intersecting lines and said:
“We want to show that these angles which you call opposing are equal. We want togive an argument; a good one. Some of you say ‘let’s measure them.’ I saw this.We go and measure them. This one is…55°. This one is 48°. What did we say?Does this convince us?”
The students said that it was not convincing because the teacher made a mistake. The teachercontinued:
“We have said that measurements are not precise. We cannot trust measurements.We want something more convincing, so that we don’t have a problem for anyfigure. That is, in whatever way we draw the figure our argument should hold.”
58
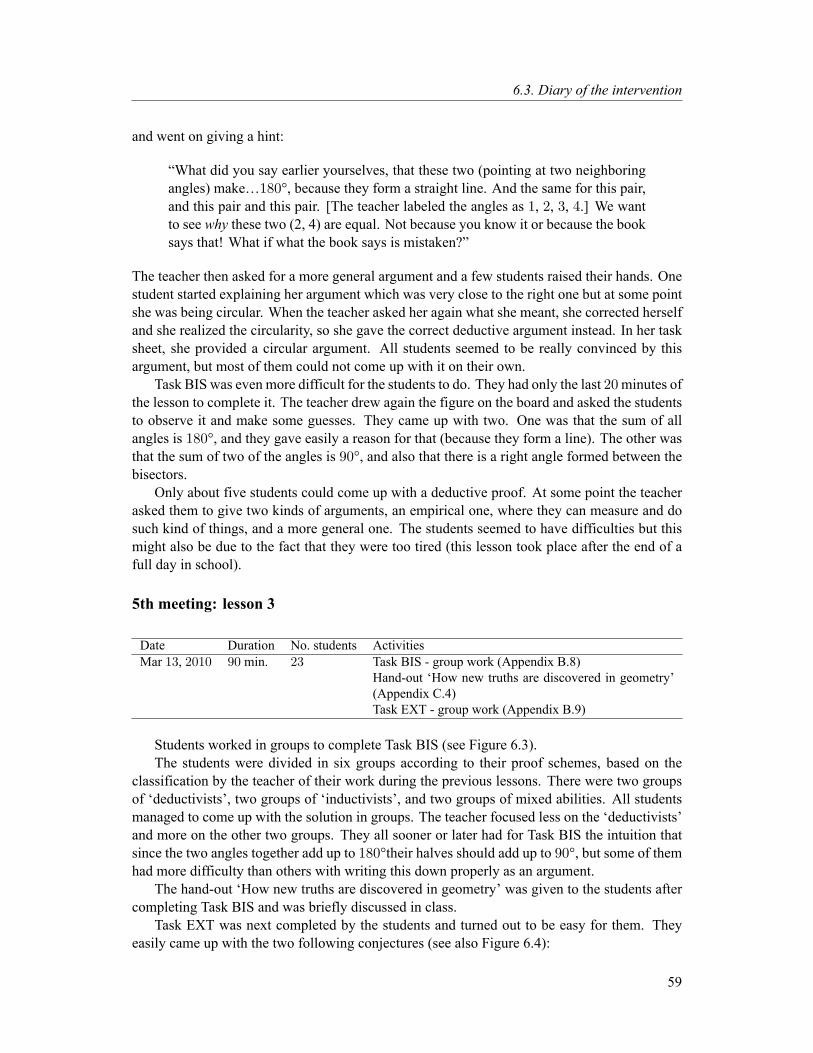
6.3. Diary of the intervention
and went on giving a hint:
“What did you say earlier yourselves, that these two (pointing at two neighboringangles) make…180°, because they form a straight line. And the same for this pair,and this pair and this pair. [The teacher labeled the angles as 1, 2, 3, 4.] We wantto see why these two (2, 4) are equal. Not because you know it or because the booksays that! What if what the book says is mistaken?”
The teacher then asked for a more general argument and a few students raised their hands. Onestudent started explaining her argument which was very close to the right one but at some pointshe was being circular. When the teacher asked her again what she meant, she corrected herselfand she realized the circularity, so she gave the correct deductive argument instead. In her tasksheet, she provided a circular argument. All students seemed to be really convinced by thisargument, but most of them could not come up with it on their own.
Task BIS was even more difficult for the students to do. They had only the last 20minutes ofthe lesson to complete it. The teacher drew again the figure on the board and asked the studentsto observe it and make some guesses. They came up with two. One was that the sum of allangles is 180°, and they gave easily a reason for that (because they form a line). The other wasthat the sum of two of the angles is 90°, and also that there is a right angle formed between thebisectors.
Only about five students could come up with a deductive proof. At some point the teacherasked them to give two kinds of arguments, an empirical one, where they can measure and dosuch kind of things, and a more general one. The students seemed to have difficulties but thismight also be due to the fact that they were too tired (this lesson took place after the end of afull day in school).
5th meeting: lesson 3
Date Duration No. students ActivitiesMar 13, 2010 90 min. 23 Task BIS - group work (Appendix B.8)
Hand-out ‘How new truths are discovered in geometry’(Appendix C.4)Task EXT - group work (Appendix B.9)
Students worked in groups to complete Task BIS (see Figure 6.3).The students were divided in six groups according to their proof schemes, based on the
classification by the teacher of their work during the previous lessons. There were two groupsof ‘deductivists’, two groups of ‘inductivists’, and two groups of mixed abilities. All studentsmanaged to come up with the solution in groups. The teacher focused less on the ‘deductivists’and more on the other two groups. They all sooner or later had for Task BIS the intuition thatsince the two angles together add up to 180°their halves should add up to 90°, but some of themhad more difficulty than others with writing this down properly as an argument.
The hand-out ‘How new truths are discovered in geometry’ was given to the students aftercompleting Task BIS and was briefly discussed in class.
Task EXT was next completed by the students and turned out to be easy for them. Theyeasily came up with the two following conjectures (see also Figure 6.4):
59

Chapter 6. The Intervention
Figure 6.3: Figure drawn by the teacher on the board to introduce Task BIS.
1. The external angle is equal to the two opposite internal ones.
2. The sum of the external and the corresponding internal angle is 180°
The argument they came up with was that all the internal angles add up to 180°, and sincethe external angle together with one of the internal angles also adds up to 180°, the external mustbe equal to the two opposite internal ones.
Figure 6.4: Students’ conjectures for Task EXT.
The students seemed to enjoy working in groups and they asked the teacher to do it again.They also had to fill in evaluation forms about the lesson and the teacher, and 100% of thestudents said they understood very well the way the teacher talks, that they liked the lessonsand enjoyed group work, and that the pace of the lesson was normal (not too slow, not too fast).Most of them also said that the lessons were different from what they are used to because theyincluded more discussion, students had more time to think about the ideas being discussed, andthey did not need to worry about exams and homework.
6th meeting: lesson 4
The students were given the hand-out ‘What we discovered in the geometry lessons’ at thebeginning of the lesson with a summary of everything that was done in class to that point. All
60
6.3. Diary of the intervention
Date Duration No. students ActivitiesMar 18, 2010 90 min. 18 Hand-out WHAT WE DISCOVERED (Appendix C.5)
Task TRIMID (Appendix B.10)Task TRIMID - group work (Appendix B.11)
the propositions along with the arguments supporting them were provided in this documentprepared by the teacher. The students were referred to pages 6 and 8 where they could find thearguments they gave in the previous lesson for two of the tasks. The students were then told thatthey would work on a new task (Task TRIMID) on their own at first, and later they would beput again in groups. Before starting on the task the teacher talked to them about the propertiesof the parallelogram because they would need to use it in one of the activities.
The teacher drew a parallelogram on the board and asked the students what this figure wascalled. The properties of the parallelogram came out of observations and a long discussion. Thestudents had to come up with an argument to prove each property. The properties were listed onthe board and were kept there throughout the lesson.
Then, the students were asked to draw a triangle on their sheets and connect the midpointsof two sides of the triangle (Task TRIMID). The teacher also drew a triangle on the board. Thenthe students were asked to make observations about the relation that might hold between the linethat connects the midpoints of two sides of the triangle and any one of the sides of the triangle.All guesses were written on the board. Each student was then asked to prove or disprove twoof these guesses. They first worked individually for a few minutes, and then they worked ingroups (Task TRIMID-GROUP).
After students worked in groups there was a discussion as a class. Students were asked togive their arguments to the rest of the class for the guesses which they tried to disprove. Thediscussion led to the idea of a COUNTEREXAMPLE to which the students were introduced forthe first time. Then the teacher presented a deductive argument to prove that the line connectingthe midpoints of the two sides is parallel to the third side and equal to its half, since there wasno time to discuss the arguments given by the students. Their arguments would be discussed inthe following lesson.
7th meeting: lesson 5
Date Duration No. students ActivitiesMar 20, 2010 90 min. 16 Task QUADMID (Appendix B.12)
Task IF-THEN (Appendix B.13)
The lesson started by summarizing the arguments given for Task TRIMID. The teacher drewa figure on the board of a triangle for which the midpoints of two sides are connected, and re-minded students about the idea of COUNTEREXAMPLE. The observations made in the previ-ous lesson were written on the board too (i.e. that the line connecting the midpoint of the twosides on a triangle is parallel to the third side and equal to its half). Also the teacher mentionedthat many students gave nice and convincing arguments different than the one given by theteacher. A deductive argument found by the students was presented, as well as some inductive-empirical ones which were not correct. A discussion followed.
Then the teacher drew a random quadrilateral and asked the students whether they think that
61

Chapter 6. The Intervention
a similar proposition to the one they had just discovered for the triangles holds also for quadrilat-erals (see Figure 6.5). The teacher connected the midpoints of the sides of the quadrilateral. Thestudents started saying that the sides will be parallel (based on what they saw). Some claimedthat the figure was not random, so the teacher made another one. Now there were two figureson the board.
The students were asked tomake observations, and they came upwith the one that the teacherhad in mind, namely that if you connect the midpoints of neighboring sides of any quadrilateralyou get a parallelogram. The hint given by the teacher then was the following: “Do you see anyrelation to the previous theoremwe proved?” Then the students were asked to individually showwhether their guess holds generally (Task QUADMID). A student asked: “We have alreadyproven that previous theorem now, right?” and the teacher said: “Yes! So now you can useit. Didn’t we show this last time? So now if you want you can use it. […] You can also useassisting lines if you want, whatever you want.” Another student then said: “Oh, so then we canuse now assisting lines”, and the teacher: “Yes, yes in a proof you can use whatever you like, aslong as it is convincing.” After they finished working the teacher showed a general deductiveargument on the board.
The students then worked on Task IF-THEN. First the teacher drew on the board a line seg-ment AB, found its midpoint, and drew another line ε that passes from the middle of the linesegment. The idea was to find the relation that holds between the distances of the edges of ABfrom line ε. There was a discussion about what the distance is and how we can construct theline that represents that distance. After all lines were drawn, the students said that the distancesare the same. The teacher asked why they are so sure, and suggested that they give a convinc-ing argument about their guess. The students were asked to work individually and to use theteacher’s figure from the board.
After the students finished working, the teacher asked them to think about the other directionof the proposition, that is, whether if the edges of a line segment are equidistant from a line thatline would pass through the middle of the line segment. The students thought that the inversewould also hold because we know that the one direction holds. Then the teacher gave them acounterexample. So the students were convinced that the inverse of an ‘if, then’ propositiondoes not actually necessarily hold when the proposition itself does.
Before the end of the meeting the teacher said that whatever they have been proving in classwas based on something that we already knew from before and that in the following lesson thediscussion would be about how far ‘backwards’ we can go. The question posed to the studentsto think about was: ‘where did mathematicians start from in order to prove things in geometry?’
8th meeting: lesson 6
Date Duration No. students ActivitiesMar 20, 2010 90 min. 16 Discussion on axioms / hand-out ‘The map of axioms’
(Appendix C.6)Hand-out ‘The story of Euclidean geometry’ (AppendixC.7)
This lesson was dedicated to a discussion about axioms. The students were asked to thinkabout where we start from in order to prove our conjectures. A very interesting discussionfollowed and students were rather surprised to find out that geometry starts from a few intuitive
62

6.3. Diary of the intervention
Figure 6.5: Explaining Task QUADMID.
assumptions which are taken for granted without any proof (the axioms). A couple of handoutswith definitions about Euclidean geometry and axioms were given to the students.
9th meeting: post-tests
Date Duration No. students ActivitiesMar 27, 2010 90 min. 20 Usiskin Van Hiele test (Appendix A.2)
Task CHOOSING (Appendix B.3)Task CONCEPTIONS ABOUT PROOF (Appendix B.4)Modified Schoenfeld Questionnaire (Appendix A.3)
During this last meeting the students had to complete all post-tests. Students found this abit boring, as was expected, but they did their work and at the end of the lesson they were giventheir present and their certificates. Everyone was enthusiastic and several mentioned they weresad that the lessons finished.
63


Chapter 7
Results
In what follows we describe the results of our research in five sections, each of which corre-sponds to one of the sections of the Methodology chapter. This chapter is also structured aroundour research questions and hypotheses, which were presented in Chapter 3. More specifically,we begin by presenting the students’ identified Van Hiele levels and kinds of reasoning (Sec-tions 7.1 and 7.2). Then, we present the statistical results of correlation tests between the VanHiele levels and kinds of reasoning of the students (Section 7.3). Because of the small numberof participants in our research, we also provide a qualitative analysis of how the students’ kindsof reasoning changed while they moved from the descriptive to the theoretical Van Hiele level(Section 7.4.1). Both the above sections are related to our second subquestion and our secondhypothesis. An analysis of whether and how our teaching strategy helped the students make thismove is also provided (Section 7.4) and is related to our third subquestion and third hypothesis.Finally, we present the results regarding the students’ beliefs about proof (Section 7.5) which isrelevant to our first subquestion and hypothesis.
7.1 The Usiskin Van Hiele test results
The context of the Usiskin Van Hiele pre-test The students had been informed by theirteacher that a teacher/researcher from the Netherlands would visit the school in order to getsome data for her research, so the students were to take a test which was not going to affect theirMathematics grade. On the day of the test both the teacher of the students and the researcherwere in class. The researcher introduced herself to the students and handed out the tests1 andanswer sheets. The students were not allowed to open the tests until they were given permission.They were told that they were not expected to know all correct answers and that this test includesalso some difficult questions so they should not be disappointed if they could not answer themcorrectly. It was stressed at least two times before they started that they should not ‘cheat’ fortwo reasons: first, they would not be graded so there is no problem if they have mistakes, andsecond, if they copied then the researcher would not be able to find out what their own opinionswere about the right answer.
1You can see the original Van Hiele test in Appendix A.1, and the translated version that the students were givenin Appendix A.2. The translated version differs from the original only in that it includes just the first 20 questionsof the original test.
65
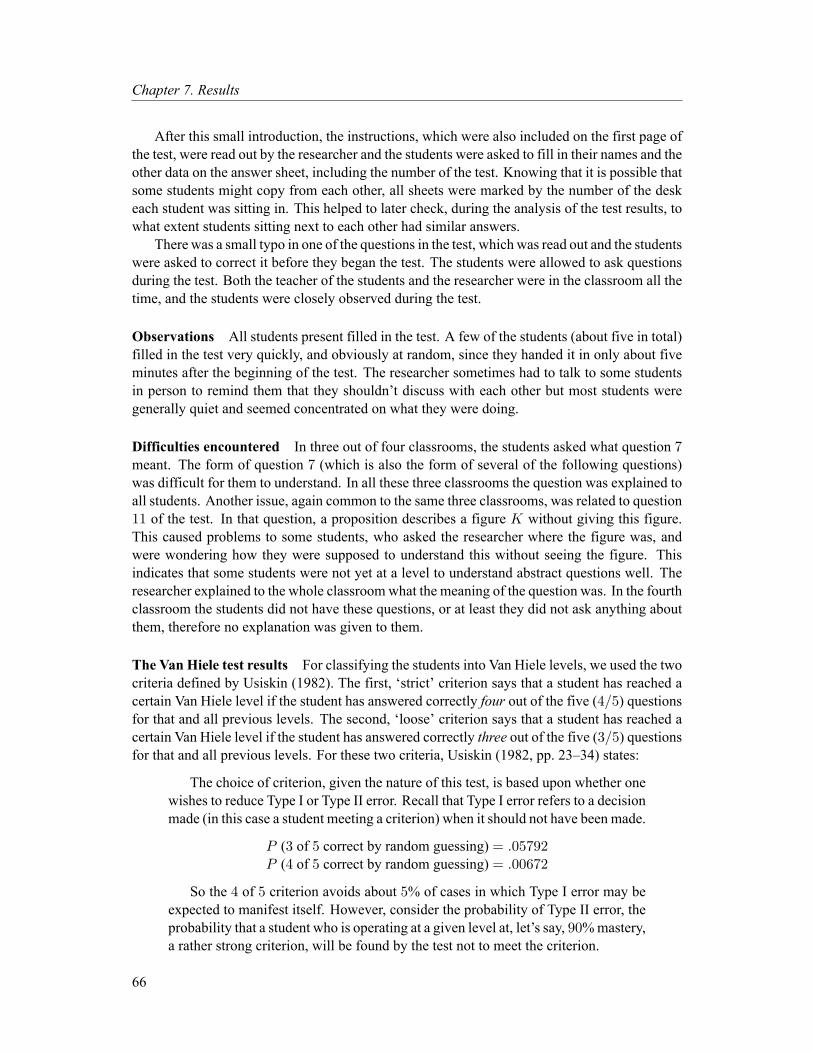
Chapter 7. Results
After this small introduction, the instructions, which were also included on the first page ofthe test, were read out by the researcher and the students were asked to fill in their names and theother data on the answer sheet, including the number of the test. Knowing that it is possible thatsome students might copy from each other, all sheets were marked by the number of the deskeach student was sitting in. This helped to later check, during the analysis of the test results, towhat extent students sitting next to each other had similar answers.
There was a small typo in one of the questions in the test, which was read out and the studentswere asked to correct it before they began the test. The students were allowed to ask questionsduring the test. Both the teacher of the students and the researcher were in the classroom all thetime, and the students were closely observed during the test.
Observations All students present filled in the test. A few of the students (about five in total)filled in the test very quickly, and obviously at random, since they handed it in only about fiveminutes after the beginning of the test. The researcher sometimes had to talk to some studentsin person to remind them that they shouldn’t discuss with each other but most students weregenerally quiet and seemed concentrated on what they were doing.
Difficulties encountered In three out of four classrooms, the students asked what question 7meant. The form of question 7 (which is also the form of several of the following questions)was difficult for them to understand. In all these three classrooms the question was explained toall students. Another issue, again common to the same three classrooms, was related to question11 of the test. In that question, a proposition describes a figure K without giving this figure.This caused problems to some students, who asked the researcher where the figure was, andwere wondering how they were supposed to understand this without seeing the figure. Thisindicates that some students were not yet at a level to understand abstract questions well. Theresearcher explained to the whole classroomwhat the meaning of the question was. In the fourthclassroom the students did not have these questions, or at least they did not ask anything aboutthem, therefore no explanation was given to them.
The Van Hiele test results For classifying the students into Van Hiele levels, we used the twocriteria defined by Usiskin (1982). The first, ‘strict’ criterion says that a student has reached acertain Van Hiele level if the student has answered correctly four out of the five (4/5) questionsfor that and all previous levels. The second, ‘loose’ criterion says that a student has reached acertain Van Hiele level if the student has answered correctly three out of the five (3/5) questionsfor that and all previous levels. For these two criteria, Usiskin (1982, pp. 23–34) states:
The choice of criterion, given the nature of this test, is based upon whether onewishes to reduce Type I or Type II error. Recall that Type I error refers to a decisionmade (in this case a student meeting a criterion) when it should not have been made.
P (3 of 5 correct by random guessing) = .05792P (4 of 5 correct by random guessing) = .00672
So the 4 of 5 criterion avoids about 5% of cases in which Type I error may beexpected to manifest itself. However, consider the probability of Type II error, theprobability that a student who is operating at a given level at, let’s say, 90%mastery,a rather strong criterion, will be found by the test not to meet the criterion.
66
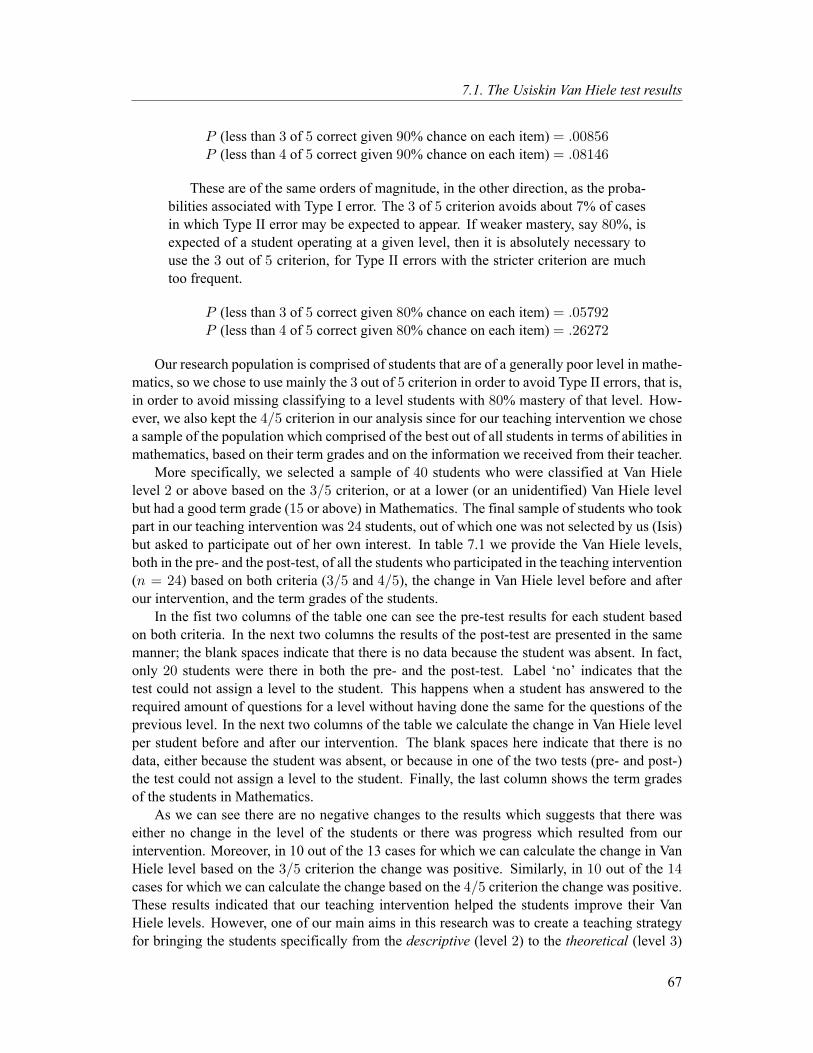
7.1. The Usiskin Van Hiele test results
P (less than 3 of 5 correct given 90% chance on each item) = .00856P (less than 4 of 5 correct given 90% chance on each item) = .08146
These are of the same orders of magnitude, in the other direction, as the proba-bilities associated with Type I error. The 3 of 5 criterion avoids about 7% of casesin which Type II error may be expected to appear. If weaker mastery, say 80%, isexpected of a student operating at a given level, then it is absolutely necessary touse the 3 out of 5 criterion, for Type II errors with the stricter criterion are muchtoo frequent.
P (less than 3 of 5 correct given 80% chance on each item) = .05792P (less than 4 of 5 correct given 80% chance on each item) = .26272
Our research population is comprised of students that are of a generally poor level in mathe-matics, so we chose to use mainly the 3 out of 5 criterion in order to avoid Type II errors, that is,in order to avoid missing classifying to a level students with 80% mastery of that level. How-ever, we also kept the 4/5 criterion in our analysis since for our teaching intervention we chosea sample of the population which comprised of the best out of all students in terms of abilities inmathematics, based on their term grades and on the information we received from their teacher.
More specifically, we selected a sample of 40 students who were classified at Van Hielelevel 2 or above based on the 3/5 criterion, or at a lower (or an unidentified) Van Hiele levelbut had a good term grade (15 or above) in Mathematics. The final sample of students who tookpart in our teaching intervention was 24 students, out of which one was not selected by us (Isis)but asked to participate out of her own interest. In table 7.1 we provide the Van Hiele levels,both in the pre- and the post-test, of all the students who participated in the teaching intervention(n = 24) based on both criteria (3/5 and 4/5), the change in Van Hiele level before and afterour intervention, and the term grades of the students.
In the fist two columns of the table one can see the pre-test results for each student basedon both criteria. In the next two columns the results of the post-test are presented in the samemanner; the blank spaces indicate that there is no data because the student was absent. In fact,only 20 students were there in both the pre- and the post-test. Label ‘no’ indicates that thetest could not assign a level to the student. This happens when a student has answered to therequired amount of questions for a level without having done the same for the questions of theprevious level. In the next two columns of the table we calculate the change in Van Hiele levelper student before and after our intervention. The blank spaces here indicate that there is nodata, either because the student was absent, or because in one of the two tests (pre- and post-)the test could not assign a level to the student. Finally, the last column shows the term gradesof the students in Mathematics.
As we can see there are no negative changes to the results which suggests that there waseither no change in the level of the students or there was progress which resulted from ourintervention. Moreover, in 10 out of the 13 cases for which we can calculate the change in VanHiele level based on the 3/5 criterion the change was positive. Similarly, in 10 out of the 14cases for which we can calculate the change based on the 4/5 criterion the change was positive.These results indicated that our teaching intervention helped the students improve their VanHiele levels. However, one of our main aims in this research was to create a teaching strategyfor bringing the students specifically from the descriptive (level 2) to the theoretical (level 3)
67

Chapter 7. Results
Pre-test Post-test Change Math GradeName 3/5 4/5 3/5 4/5 3/5 4/5 (out of 20)
Katerina 3 2 4 3 1 1 18John 3 2 3 3 0 1 20
Debbie 2 2 3 3 1 1 20Flora 2 2 3 2 1 0 20Gayle 2 2 no no 20Elli 2 2 no no 19Katy 2 2 no no 18
Sunny 2 1 3 no 1 18Elinor 2 1 3 1 1 0 20Olivia 2 1 2 2 0 1 17Theano 2 1 2 no 0 15Mary 2 1 no 2 1 19Gus 2 1 13Sue 2 0 no no 16Fred 2 no 16Anna 2 0 15Nia 1 1 2 2 1 1 19
Gregory 1 1 3 3 2 2 20Fiona no 2 4 4 2 20Kelly no 0 3 3 3 20Stian no 0 19Thalia 0 0 3 1 3 1 20
Isis 0 0 2 0 2 0 14Nadia 0 0 1 0 1 0 15
Table 7.1: Van Hiele levels of the participants (n = 24) before and after our intervention based on theUsiskin Van Hiele test (‘no’ = the test could not assign a level, blank = no data.)
Van Hiele level. Again, we see that for those cases of students for which we can give an answer,4 out of 6 who started at level 2 based on criterion 3/5 moved to level 3. Similarly, 4 out of 5of those who started at level 2 based on criterion 4/5 moved to level 3. These results are stillgood but the number of students is too small to be able to make safe conclusions.
Our results of the Van Hiele pre-test for the whole population (n = 85) were analyzedand compared to those of (Usiskin, 1982) who designed and first used this test, as well as tothose of (Tzifas, 2005) since this was a research about the Van Hiele levels of students in Greekhighschools and thus shares the same background with our research. The detailed analysis andcomparison is presented in Appendix D.1 since these results are not immediately related toour main research question. To give a short summary of the most important results of thiscomparison, we can say that most of our results agree with those of Tzifas (2005) and Usiskin(1982) apart from one question of the test, question 13, in which Tzifas’ results differ from bothours and Usiskin’s because of an error in the translated version of this question used in Tzifas’study.2
In general, we think that certain questions of the Usiskin Van Hiele test and the differentinterpretations that these may be given by different students makes interviews with the studentsafter they have taken the test necessary. Because of time restrictions we could not include in-terviews in our research, however, we strongly recommend in future research at a larger scale
2A more detailed analysis of this comparison is offered in Appendix D.1.
68
7.2. The Harel & Sowder proof schemes coding process
that interviews accompany the Usiskin Van Hiele test.
Conclusions
When applied to the whole population of our research (n = 85), the Usiskin Van Hieletest revealed results very similar to those of other studies: Usiskin (1982), the firstwho created and used this test, and Tzifas (2005) who is the only research study thatwe know using the test on a large sample in Greece.
•We chose our sample for the teaching intervention based on the Van Hiele test resultsas well as on the term grade of the students in Mathematics. The sample (n = 24)included 14 students in Van Hiele level 2 based on the loose criterion (3/5).
•Out of the students who also took the Van Hiele test after our intervention (n = 20) apre/post comparison shows that most of them made progress in their Van Hiele level.More specifically, in 10 out of the 13 cases for which we can calculate the change inVan Hiele level based on the 3/5 criterion the change was positive. Similarly, in 10out of the 14 cases for which we can calculate the change based on the 4/5 criterionthe change was positive.
•When we look specifically at the move from the descriptive (level 2) to the theoretical(level 3) Van Hiele level, 4 out of 6 students who started at level 2 based on criterion3/5 moved to level 3, and 4 out of 5 of those who started at Van Hiele level 2 basedon criterion 4/5 moved to level 3. Although the percentages are large, the sample ofstudents is too small to allow us to make safe conclusions without any further analysisof the lessons.
7.2 The Harel & Sowder proof schemes coding process
For coding students’ proof attitudes we used the proof schemes of Harel and Sowder (1998)which were described in detail in Section 2.4.3. The codes we defined and used for the proofschemes were introduced in Section 5.2.2. Here we will give a few examples of proof attitudesof our students during the intervention and how we classified them into the Harel & Sowderproof schemes.
Examples of the external/ritual proof scheme In Task CHOOSING (see Appendix B.3) thestudents were asked to choose which among several proofs for the conjecture ‘When you addthe interior angles of a triangle the sum is always 180°’ would get the best mark. Some studentschose the following proof:
69

Chapter 7. Results
1
PWデヴラゲげゲ ;ミゲ┘Wヴ
I drew an isosceles triangle
with ɶ equal to 65°.
ɲ = 180°-2ɶ
(because base angles in isosceles
triangles are equal)
ɲ = 180°-130° = 50°
ɴ = 180°- (ɲ+ɶ) = 65°
ɶ = ɴ (because base angleas in isosceles triangles
are equal)
Therefore ɲ + ɴ + ɶ = 180°
Sラ PWデヴラゲ ゲ;┞ゲ キデげゲ デヴ┌Wく
Petros’s argument is wrong because it is circular. However, several students chose it as theone that would get the best mark providing justifications for their choice like the following:
“[…] it represents the rules of mathematicians”
“[…] it uses mathematical operations which we have learned without making manyfigures or using anything else”
“[…] it shows that we have more knowledge about triangles”
“[…] it is short, correct and easy to understand.”
We see that several students chose Petros’s argument because it ‘looks’ mathematical (usesmathematical notation and is short). We characterised these students’ proof schemes as ‘ritual’proof schemes.
Example of the external/authoritarian proof scheme At the beginning of our interventionoften the students simply believed that a conjecture or a proof was true without seeking forfurther justification. Since they had never been explicitly and systematically introduced to proofand its significance for mathematics before our intervention, the students came to our lessonsalready ‘believing’ certain statements because they were written in their book or because theirteacher had told them they were true. For example, the conjecture ‘the sum of the internalangles of any triangle is 180°’ was already taken for granted by most of the students withoutjustification. An inductive argument, such as checking the conjecture for a few cases of specifictriangles and concluding that it would hold for any triangle, was enough for them to be convincedthat the conjecture is true. In fact, most of the students used such an inductive argument whenthey were asked to argue for the truth of the above conjecture.
The following transcript taken from the first lesson is an example indicative of the exter-nal/authoritarian proof scheme. The lesson started with a discussion of the student’s work onthe pre-test where they had been asked to first give an argument for the conjecture ‘the sum ofthe angles of any triangle is 180°,’ and to then choose from a range of given proofs one theywould prefer as their own approach. The plan was to discuss the advantages and disadvantages
70
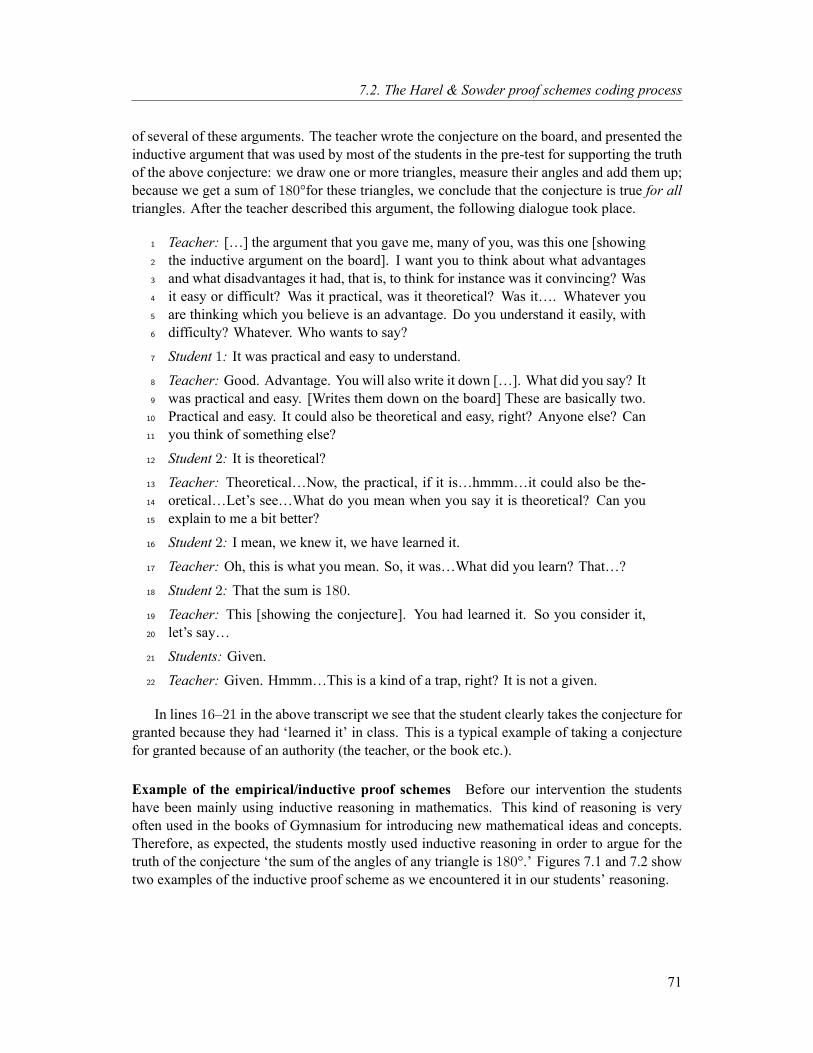
7.2. The Harel & Sowder proof schemes coding process
of several of these arguments. The teacher wrote the conjecture on the board, and presented theinductive argument that was used by most of the students in the pre-test for supporting the truthof the above conjecture: we draw one or more triangles, measure their angles and add them up;because we get a sum of 180°for these triangles, we conclude that the conjecture is true for alltriangles. After the teacher described this argument, the following dialogue took place.
Teacher: […] the argument that you gave me, many of you, was this one [showing1
the inductive argument on the board]. I want you to think about what advantages2
and what disadvantages it had, that is, to think for instance was it convincing? Was3
it easy or difficult? Was it practical, was it theoretical? Was it…. Whatever you4
are thinking which you believe is an advantage. Do you understand it easily, with5
difficulty? Whatever. Who wants to say?6
Student 1: It was practical and easy to understand.7
Teacher: Good. Advantage. You will also write it down […]. What did you say? It8
was practical and easy. [Writes them down on the board] These are basically two.9
Practical and easy. It could also be theoretical and easy, right? Anyone else? Can10
you think of something else?11
Student 2: It is theoretical?12
Teacher: Theoretical…Now, the practical, if it is…hmmm…it could also be the-13
oretical…Let’s see…What do you mean when you say it is theoretical? Can you14
explain to me a bit better?15
Student 2: I mean, we knew it, we have learned it.16
Teacher: Oh, this is what you mean. So, it was…What did you learn? That…?17
Student 2: That the sum is 180.18
Teacher: This [showing the conjecture]. You had learned it. So you consider it,19
let’s say…20
Students: Given.21
Teacher: Given. Hmmm…This is a kind of a trap, right? It is not a given.22
In lines 16–21 in the above transcript we see that the student clearly takes the conjecture forgranted because they had ‘learned it’ in class. This is a typical example of taking a conjecturefor granted because of an authority (the teacher, or the book etc.).
Example of the empirical/inductive proof schemes Before our intervention the studentshave been mainly using inductive reasoning in mathematics. This kind of reasoning is veryoften used in the books of Gymnasium for introducing new mathematical ideas and concepts.Therefore, as expected, the students mostly used inductive reasoning in order to argue for thetruth of the conjecture ‘the sum of the angles of any triangle is 180°.’ Figures 7.1 and 7.2 showtwo examples of the inductive proof scheme as we encountered it in our students’ reasoning.
71
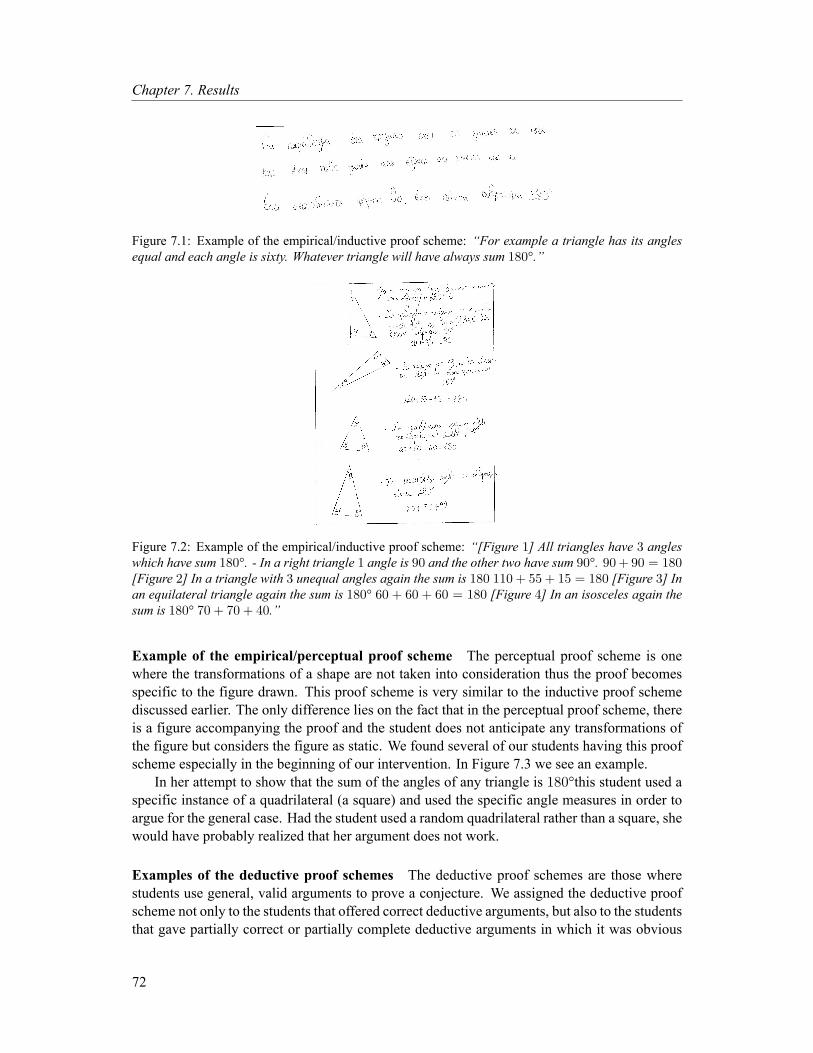
Chapter 7. Results
Figure 7.1: Example of the empirical/inductive proof scheme: “For example a triangle has its anglesequal and each angle is sixty. Whatever triangle will have always sum 180°.”
Figure 7.2: Example of the empirical/inductive proof scheme: “[Figure 1] All triangles have 3 angleswhich have sum 180°. - In a right triangle 1 angle is 90 and the other two have sum 90°. 90+ 90 = 180[Figure 2] In a triangle with 3 unequal angles again the sum is 180 110 + 55 + 15 = 180 [Figure 3] Inan equilateral triangle again the sum is 180° 60 + 60 + 60 = 180 [Figure 4] In an isosceles again thesum is 180° 70 + 70 + 40.”
Example of the empirical/perceptual proof scheme The perceptual proof scheme is onewhere the transformations of a shape are not taken into consideration thus the proof becomesspecific to the figure drawn. This proof scheme is very similar to the inductive proof schemediscussed earlier. The only difference lies on the fact that in the perceptual proof scheme, thereis a figure accompanying the proof and the student does not anticipate any transformations ofthe figure but considers the figure as static. We found several of our students having this proofscheme especially in the beginning of our intervention. In Figure 7.3 we see an example.
In her attempt to show that the sum of the angles of any triangle is 180°this student used aspecific instance of a quadrilateral (a square) and used the specific angle measures in order toargue for the general case. Had the student used a random quadrilateral rather than a square, shewould have probably realized that her argument does not work.
Examples of the deductive proof schemes The deductive proof schemes are those wherestudents use general, valid arguments to prove a conjecture. We assigned the deductive proofscheme not only to the students that offered correct deductive arguments, but also to the studentsthat gave partially correct or partially complete deductive arguments in which it was obvious
72
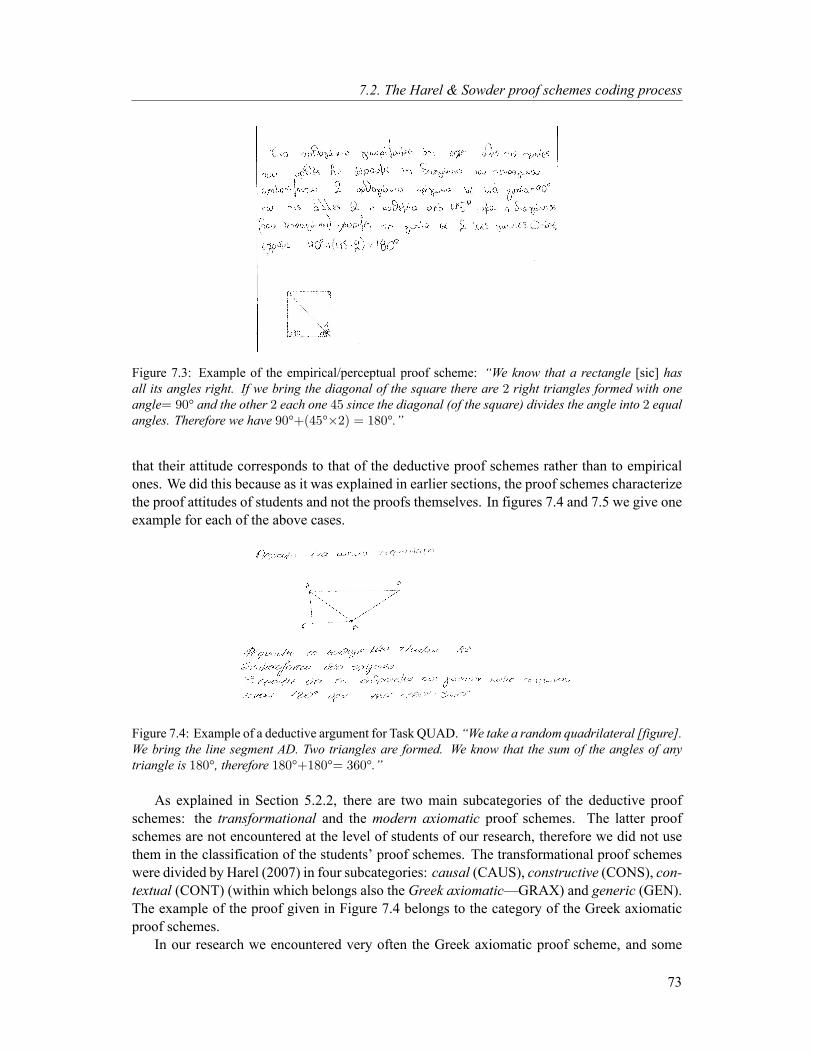
7.2. The Harel & Sowder proof schemes coding process
Figure 7.3: Example of the empirical/perceptual proof scheme: “We know that a rectangle [sic] hasall its angles right. If we bring the diagonal of the square there are 2 right triangles formed with oneangle= 90° and the other 2 each one 45 since the diagonal (of the square) divides the angle into 2 equalangles. Therefore we have 90°+(45°×2) = 180°.”
that their attitude corresponds to that of the deductive proof schemes rather than to empiricalones. We did this because as it was explained in earlier sections, the proof schemes characterizethe proof attitudes of students and not the proofs themselves. In figures 7.4 and 7.5 we give oneexample for each of the above cases.
Figure 7.4: Example of a deductive argument for Task QUAD. “We take a random quadrilateral [figure].We bring the line segment AD. Two triangles are formed. We know that the sum of the angles of anytriangle is 180°, therefore 180°+180°= 360°.”
As explained in Section 5.2.2, there are two main subcategories of the deductive proofschemes: the transformational and the modern axiomatic proof schemes. The latter proofschemes are not encountered at the level of students of our research, therefore we did not usethem in the classification of the students’ proof schemes. The transformational proof schemeswere divided by Harel (2007) in four subcategories: causal (CAUS), constructive (CONS), con-textual (CONT) (within which belongs also the Greek axiomatic—GRAX) and generic (GEN).The example of the proof given in Figure 7.4 belongs to the category of the Greek axiomaticproof schemes.
In our research we encountered very often the Greek axiomatic proof scheme, and some
73
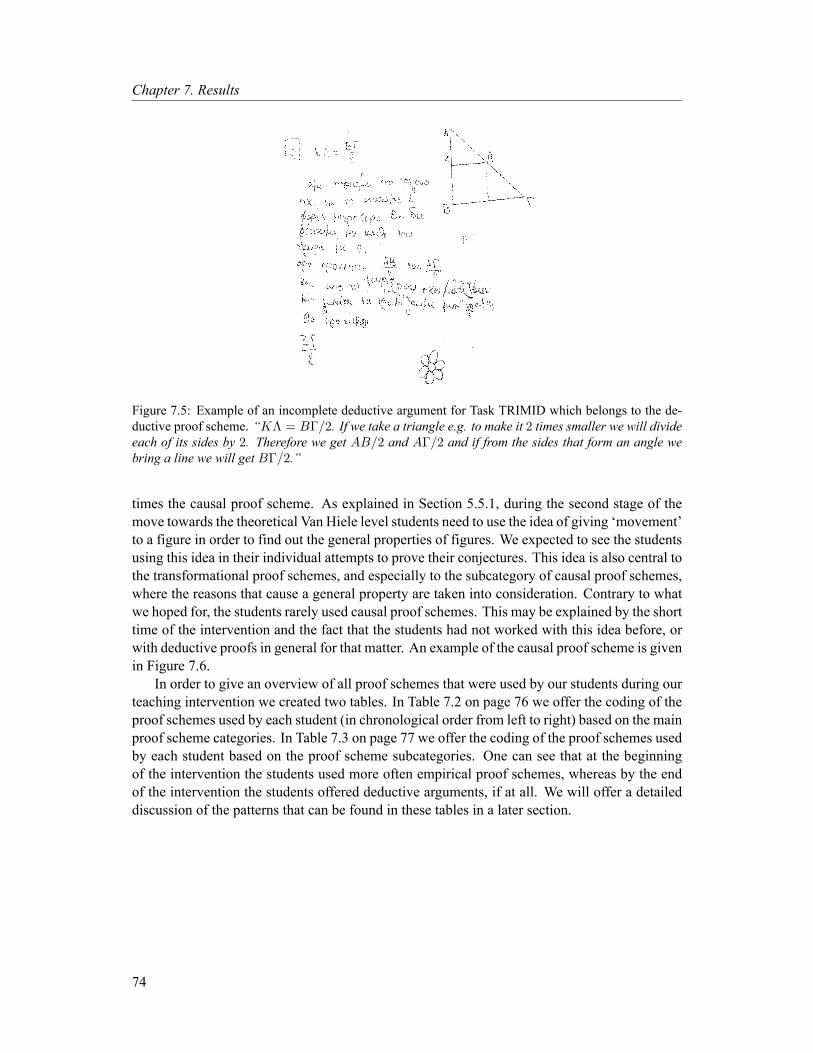
Chapter 7. Results
Figure 7.5: Example of an incomplete deductive argument for Task TRIMID which belongs to the de-ductive proof scheme. “KΛ = BΓ/2. If we take a triangle e.g. to make it 2 times smaller we will divideeach of its sides by 2. Therefore we get AB/2 and AΓ/2 and if from the sides that form an angle webring a line we will get BΓ/2.”
times the causal proof scheme. As explained in Section 5.5.1, during the second stage of themove towards the theoretical Van Hiele level students need to use the idea of giving ‘movement’to a figure in order to find out the general properties of figures. We expected to see the studentsusing this idea in their individual attempts to prove their conjectures. This idea is also central tothe transformational proof schemes, and especially to the subcategory of causal proof schemes,where the reasons that cause a general property are taken into consideration. Contrary to whatwe hoped for, the students rarely used causal proof schemes. This may be explained by the shorttime of the intervention and the fact that the students had not worked with this idea before, orwith deductive proofs in general for that matter. An example of the causal proof scheme is givenin Figure 7.6.
In order to give an overview of all proof schemes that were used by our students during ourteaching intervention we created two tables. In Table 7.2 on page 76 we offer the coding of theproof schemes used by each student (in chronological order from left to right) based on the mainproof scheme categories. In Table 7.3 on page 77 we offer the coding of the proof schemes usedby each student based on the proof scheme subcategories. One can see that at the beginningof the intervention the students used more often empirical proof schemes, whereas by the endof the intervention the students offered deductive arguments, if at all. We will offer a detaileddiscussion of the patterns that can be found in these tables in a later section.
74
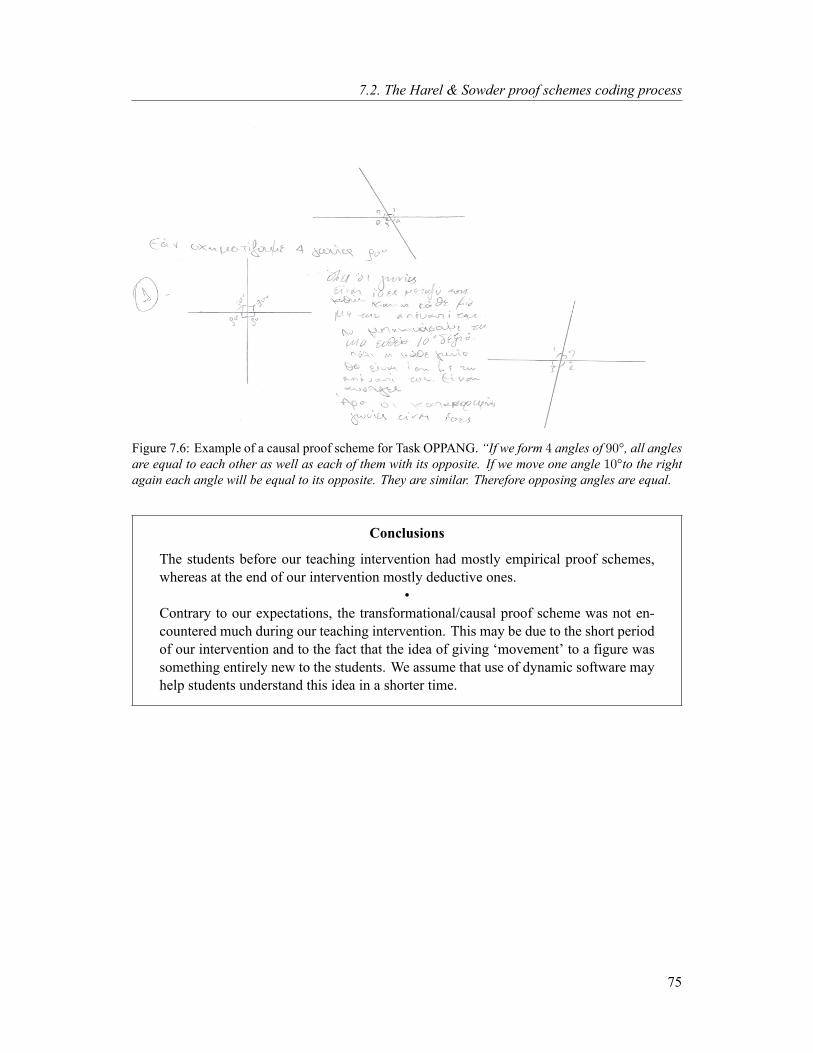
7.2. The Harel & Sowder proof schemes coding process
Figure 7.6: Example of a causal proof scheme for Task OPPANG. “If we form 4 angles of 90°, all anglesare equal to each other as well as each of them with its opposite. If we move one angle 10°to the rightagain each angle will be equal to its opposite. They are similar. Therefore opposing angles are equal.
Conclusions
The students before our teaching intervention had mostly empirical proof schemes,whereas at the end of our intervention mostly deductive ones.
•Contrary to our expectations, the transformational/causal proof scheme was not en-countered much during our teaching intervention. This may be due to the short periodof our intervention and to the fact that the idea of giving ‘movement’ to a figure wassomething entirely new to the students. We assume that use of dynamic software mayhelp students understand this idea in a shorter time.
75

Chapter 7. Results
Nam
eANGLESU
MQUAD
OPPA
NG
BIS
BIS-group
EXT-group
TRIM
IDTRIM
ID-group
QUADMID
IF-THEN
Olivia
EMP
EMP
UNDEC
EMP
EMP
UNDEC
blankEM
PDED
DED
Gregory
EMP
EXT
EMP
EMP
DED
DED
blankDED
DED
DED
Katerina
DED
EMP
EXT
DED
DED
nodata
DED
DED
00
Gayle
UNDEC
DED
EMP
DED
DED
nodata
DED
DED
DED
DED
Nadia
EMP
EMP
EMP
EMP
DED
EMP
DED/EX
TEX
TUNDEC
*UNDEC
*Kelly
EXT/EM
PDED
DED
EMP
EMP
UNDEC
blankEM
PDED
DED
ElliUNDEC
DED
DED
UNDEC
DED
DED
blankDED
DED
DED
Mary
EMP
EMP
DED
0no
dataDED
DED
DED
UNDEC
*DED
JohnEM
PDED
DED
EMP
DED
DED
EXT
EMP
UNDEC
*DED
TheanoEM
P/EXT
EMP
DED
EMP
UNDEC
UNDEC
EXT
EMP
00
Nia
EXT
EMP
EMP
blankEM
PDED
EXT
EMP
DED
DED
Gus
EMP
EMP
EXT
EMP
EXT
EXT
00
00
Minas
0EM
PEX
TEM
P0
00
00
0Isis
EXT
EMP
00
EXT
EXT
EMP
EXT
EXT
EXT
StianEM
PEM
PEX
Tblank
EMP
EMP
00
00
FionaUNDEC
DED
DED
EMP
DED
DED
00
00
FloraEM
PDED
DED
DED
DED
DED
UNDEC
DED
DED
DED
Katy
UNDEC
EMP
UNDEC
DED
DED
DED
DED
DED
DED
DED
Debbie
DED
DED
UNDEC
DED
DED
DED
DED
DED
DED
DED
SueEM
PEM
PUNDEC
0EM
P0
0EX
T0
0Anna
EXT
EMP
00
DED
DED
00
DED
DED
SunnyEX
TEM
PEX
TEM
PEM
PEX
T0
00
0Elinor
0EM
PDED
EMP
DED
DED
blankDED
DED
DED
ThaliaEX
TDED
EMP
DED
DED
nodata
DED
DED
UNDEC
*DED
Table7.2:C
odingofstudents’m
ainproofschem
esforalltasks.Fortheclassification
ofstudents’proofschemesw
eused
thecoding
describedinSection
5.2.2.(‘0’=StudentA
bsent,‘UNDEC
’=Proofschem
ecould
notbeidentified,‘no
data’=wedid
notrecorddata
forthesestudents,‘blank’=
Thestudent
didnotofferany
argument,*
=afailed
attemptto
offeradeductive
argument)
76

7.2. The Harel & Sowder proof schemes coding process
Nam
eANGLESU
MQUAD
OPP
ANG
BIS
BIS-group
EXT-group
TRIM
IDTRIM
ID-group
QUADMID
IF-THEN
Olivia
IND
PER
UNDEC
IND
IND
UNDEC
blank
EMP
GRAX
GRAX
Gregory
IND
RIT
IND
IND
GRAX
GRAX
blank
GRAX
GRAX
GRAX
Katerina
GRAX
PER
AUTH
GRAX
GRAX
nodata
GRAX
GRAX
00
Gayle
UNDEC
GRAX
PER
GRAX
GRAX
nodata
GRAX
GRAX
GRAX
GRAX
Nadia
IND
IND
PER
IND
GRAX
IND
GRAX/AUTH
AUTH
UNDEC
*UNDEC
*Kelly
AUTH
/IND
GRAX
CAUS
IND
IND
UNDEC
blank
PER
GRAX
GRAX
Elli
UNDEC
GRAX
GRAX
UNDEC
GRAX
GRAX
blank
GRAX
GRAX
GRAX
Mary
IND
IND
GRAX
0no
data
GRAX
GRAX
GRAX
UNDEC
*GRAX
John
IND
GRAX
GRAX
PER
GRAX
GRAX
AUTH
PER
UNDEC
*GRAX
Theano
IND
IND
CAUS
PER
UNDEC
UNDEC
AUTH
PER
00
Nia
AUTH
/IND
IND
IND
blank
IND
GRAX
AUTH
PER
GRAX
GRAX
Gus
IND
IND
RIT
PER
AUTH
AUTH
00
00
Minas
0IND
AUTH
PER
00
00
00
Isis
AUTH
IND
00
AUTH
AUTH
PER
AUTH
AUTH
AUTH
Stian
IND
PER
AUTH
blank
PER
PER
00
00
Fiona
UNDEC
GRAX
GRAX
PER
GRAX
GRAX
00
00
Flora
IND
GRAX
GRAX
GRAX
GRAX
GRAX
UNDEC
GRAX
GRAX
GRAX
Katy
UNDEC
PER
UNDEC
GRAX
GRAX
GRAX
GRAX
?GRAX
GRAX
Debbie
CAUS
GRAX
UNDEC
GRAX
GRAX
GRAX
GRAX
GRAX
GRAX
GRAX
Sue
IND
IND
UNDEC
0IND
00
AUTH
00
Anna
AUTH
PER
00
GRAX
GRAX
00
GRAX
GRAX
Sunny
AUTH
IND
AUTH
IND
PER
AUTH
00
00
Elinor
0IND
GRAX
PER
GRAX
GRAX
blank
GRAX
GRAX
GRAX
Thalia
AUTH
GRAX
IND
GRAX
GRAX
nodata
GRAX
GRAX
UNDEC
*GRAX
Table7.3:
Codingofstudents’proofschemesubcategoriesforalltasks.Forthe
classificationofstudents’proofschemesweused
thecoding
described
inSection5.2.2.(‘0’=StudentA
bsent,‘UNDEC
’=Proofschem
ecouldnotbeidentified,‘nodata’=
wedidnotrecorddataforthesestudents,‘blank’=The
studentdidnotofferany
argument,*=afailedattempttooffera
deductiveargument)
77
Chapter 7. Results
7.3 Correlations betweenVanHiele level andHarel&Sowder proofscheme
One of our hypotheses is the following:
H.2 Given the correspondence between the Harel & Sowder proof schemes and theVan Hiele levels of thinking, there should be a correlation between correspondingVan Hiele levels and Harel & Sowder proof schemes.
Moreover, in order to answer our main research question, we had to look at how students’reasoning changes when students move from the descriptive to the theoretical Van Hiele level.Therefore, we looked both at how the Van Hiele levels and proof schemes of the students corre-late before and after our intervention and at how the progress in the Van Hiele level of a student(as identified by the Van Hiele pre-test) correlates with the progress in the student’s Harel &Sowder proof scheme. More specifically, we have the hypothesis that when students are at alower Van Hiele level than 3 they will use more often empirical rather than deductive proofschemes, whereas when they move to higher Van Hiele levels (3 or 4) they will use more oftendeductive rather than empirical proof schemes. We have four specific questions related to theabove questions and hypotheses:
1. What is the correlation between Van Hiele level and the use of the deductive Harel &Sowder proof schemes before the intervention?
2. What is the correlation between Van Hiele level and the use of the deductive Harel &Sowder proof schemes after the intervention?
3. What is the correlation between the progress in Harel & Sowder proof schemes (fromEMP to DED) and the progress in vH level from any vH level to any higher level?
4. What is the correlation between the progress in Harel & Sowder proof schemes (fromEMP to DED) and the progress in vH level from one of the levels 0, 1 or 2 to one of thelevels 3 or 4?
Before we look at how we answered the above questions, some definitions are necessary.
• Progress in Van Hiele levelWe define progress of a student in their Van Hiele level as the move from a lower VanHiele level to a higher one. We measured the Van Hiele level of the students with bothcriteria as defined by Usiskin (1982)—3/5 and 4/5—sowewill look at both these criteria.We also use a stricter definition of progress which is the move from Van Hiele levels 0, 1or 2 to Van Hiele levels 3, or 4, since this is the specific transition we aimed at achievingin this research project and in which we expected the transition from using empirical tousing deductive proof schemes to take place. We will use the name PrvH0 for the firstkind of progress, and PrvH1 for the second kind of progress. Thus, we have the followingtwo definitions:
– We call ‘PrvH0’ the progress of the students from one Van Hiele level to a next.
78
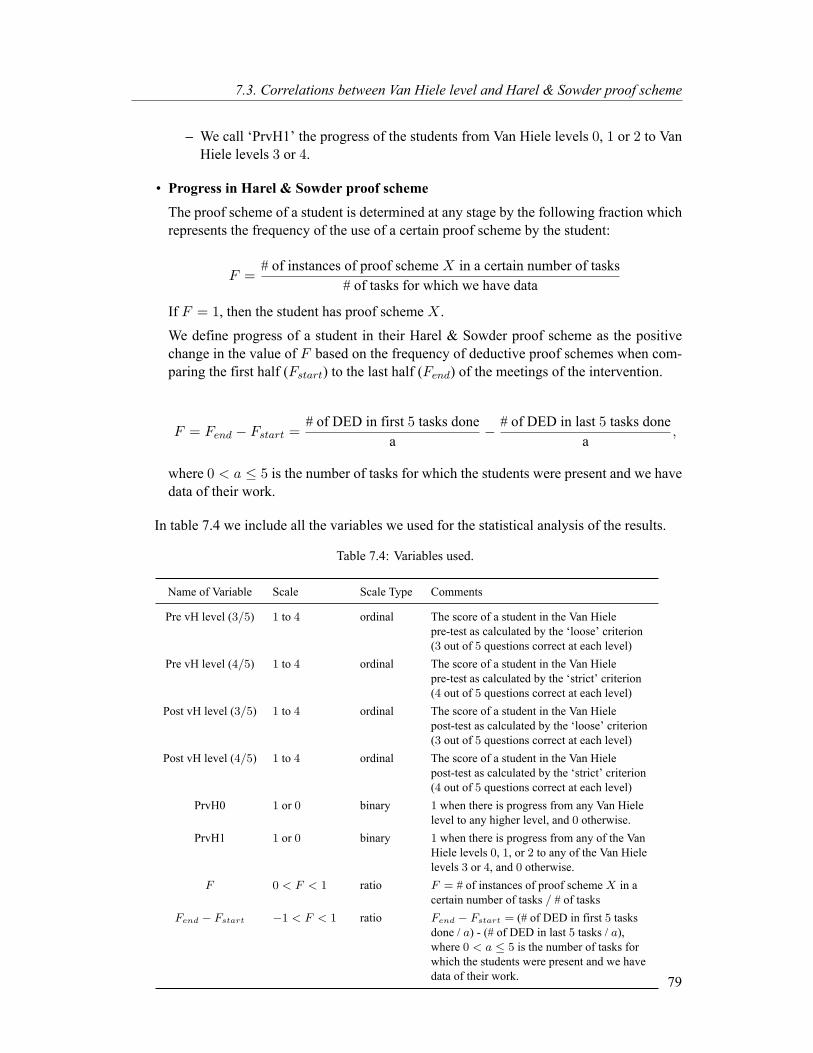
7.3. Correlations between Van Hiele level and Harel & Sowder proof scheme
– We call ‘PrvH1’ the progress of the students from Van Hiele levels 0, 1 or 2 to VanHiele levels 3 or 4.
• Progress in Harel & Sowder proof schemeThe proof scheme of a student is determined at any stage by the following fraction whichrepresents the frequency of the use of a certain proof scheme by the student:
F =# of instances of proof scheme X in a certain number of tasks
# of tasks for which we have data
If F = 1, then the student has proof scheme X .
We define progress of a student in their Harel & Sowder proof scheme as the positivechange in the value of F based on the frequency of deductive proof schemes when com-paring the first half (Fstart) to the last half (Fend) of the meetings of the intervention.
F = Fend − Fstart =# of DED in first 5 tasks done
a− # of DED in last 5 tasks done
a,
where 0 < a ≤ 5 is the number of tasks for which the students were present and we havedata of their work.
In table 7.4 we include all the variables we used for the statistical analysis of the results.
Table 7.4: Variables used.
Name of Variable Scale Scale Type Comments
Pre vH level (3/5) 1 to 4 ordinal The score of a student in the Van Hielepre-test as calculated by the ‘loose’ criterion(3 out of 5 questions correct at each level)
Pre vH level (4/5) 1 to 4 ordinal The score of a student in the Van Hielepre-test as calculated by the ‘strict’ criterion(4 out of 5 questions correct at each level)
Post vH level (3/5) 1 to 4 ordinal The score of a student in the Van Hielepost-test as calculated by the ‘loose’ criterion(3 out of 5 questions correct at each level)
Post vH level (4/5) 1 to 4 ordinal The score of a student in the Van Hielepost-test as calculated by the ‘strict’ criterion(4 out of 5 questions correct at each level)
PrvH0 1 or 0 binary 1 when there is progress from any Van Hielelevel to any higher level, and 0 otherwise.
PrvH1 1 or 0 binary 1 when there is progress from any of the VanHiele levels 0, 1, or 2 to any of the Van Hielelevels 3 or 4, and 0 otherwise.
F 0 < F < 1 ratio F = # of instances of proof schemeX in acertain number of tasks / # of tasks
Fend − Fstart −1 < F < 1 ratio Fend − Fstart = (# of DED in first 5 tasksdone / a) - (# of DED in last 5 tasks / a),where 0 < a ≤ 5 is the number of tasks forwhich the students were present and we havedata of their work. 79
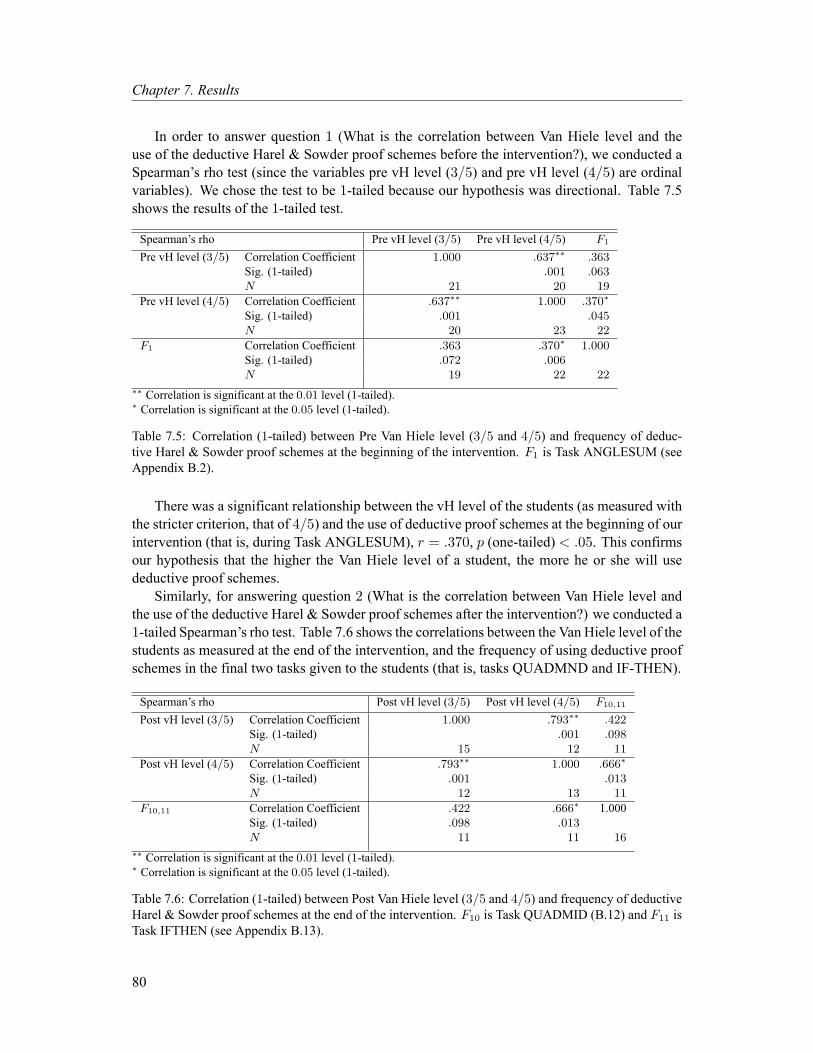
Chapter 7. Results
In order to answer question 1 (What is the correlation between Van Hiele level and theuse of the deductive Harel & Sowder proof schemes before the intervention?), we conducted aSpearman’s rho test (since the variables pre vH level (3/5) and pre vH level (4/5) are ordinalvariables). We chose the test to be 1-tailed because our hypothesis was directional. Table 7.5shows the results of the 1-tailed test.
Spearman’s rho Pre vH level (3/5) Pre vH level (4/5) F1
Pre vH level (3/5) Correlation Coefficient 1.000 .637∗∗ .363Sig. (1-tailed) .001 .063N 21 20 19
Pre vH level (4/5) Correlation Coefficient .637∗∗ 1.000 .370∗
Sig. (1-tailed) .001 .045N 20 23 22
F1 Correlation Coefficient .363 .370∗ 1.000Sig. (1-tailed) .072 .006N 19 22 22
∗∗ Correlation is significant at the 0.01 level (1-tailed).∗ Correlation is significant at the 0.05 level (1-tailed).
Table 7.5: Correlation (1-tailed) between Pre Van Hiele level (3/5 and 4/5) and frequency of deduc-tive Harel & Sowder proof schemes at the beginning of the intervention. F1 is Task ANGLESUM (seeAppendix B.2).
There was a significant relationship between the vH level of the students (as measured withthe stricter criterion, that of 4/5) and the use of deductive proof schemes at the beginning of ourintervention (that is, during Task ANGLESUM), r = .370, p (one-tailed) < .05. This confirmsour hypothesis that the higher the Van Hiele level of a student, the more he or she will usedeductive proof schemes.
Similarly, for answering question 2 (What is the correlation between Van Hiele level andthe use of the deductive Harel & Sowder proof schemes after the intervention?) we conducted a1-tailed Spearman’s rho test. Table 7.6 shows the correlations between the Van Hiele level of thestudents as measured at the end of the intervention, and the frequency of using deductive proofschemes in the final two tasks given to the students (that is, tasks QUADMND and IF-THEN).
Spearman’s rho Post vH level (3/5) Post vH level (4/5) F10,11
Post vH level (3/5) Correlation Coefficient 1.000 .793∗∗ .422Sig. (1-tailed) .001 .098N 15 12 11
Post vH level (4/5) Correlation Coefficient .793∗∗ 1.000 .666∗
Sig. (1-tailed) .001 .013N 12 13 11
F10,11 Correlation Coefficient .422 .666∗ 1.000Sig. (1-tailed) .098 .013N 11 11 16
∗∗ Correlation is significant at the 0.01 level (1-tailed).∗ Correlation is significant at the 0.05 level (1-tailed).
Table 7.6: Correlation (1-tailed) between Post Van Hiele level (3/5 and 4/5) and frequency of deductiveHarel & Sowder proof schemes at the end of the intervention. F10 is Task QUADMID (B.12) and F11 isTask IFTHEN (see Appendix B.13).
80
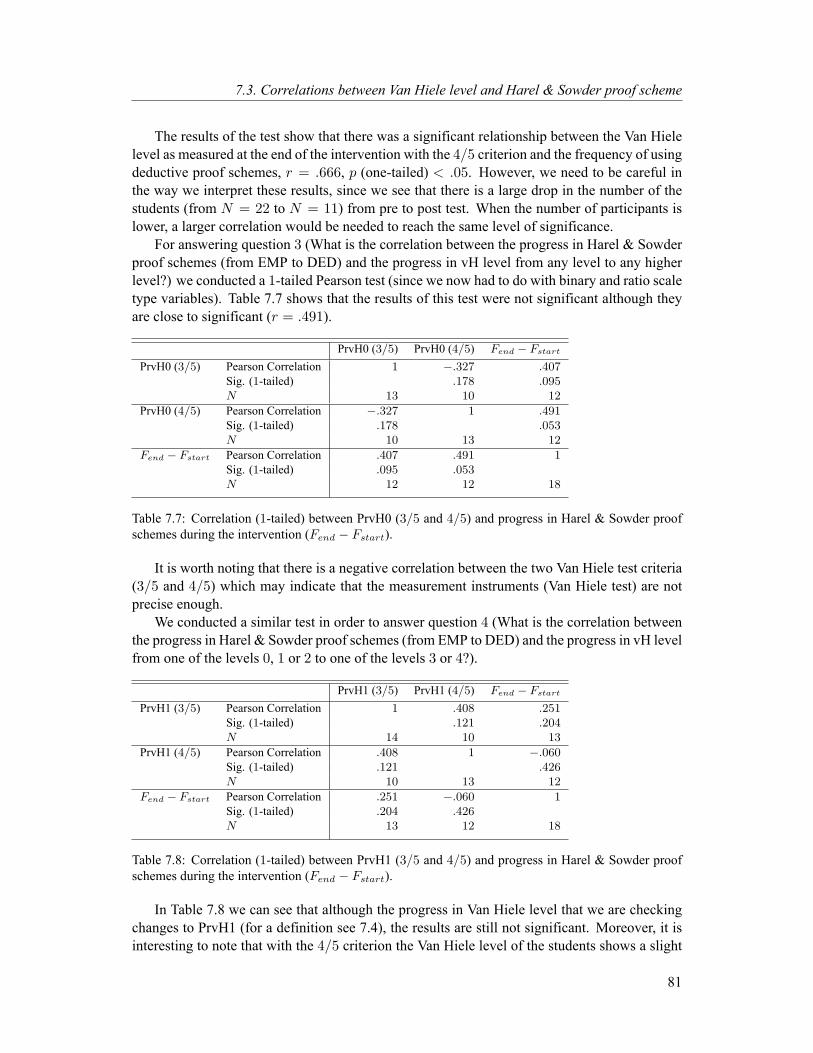
7.3. Correlations between Van Hiele level and Harel & Sowder proof scheme
The results of the test show that there was a significant relationship between the Van Hielelevel as measured at the end of the intervention with the 4/5 criterion and the frequency of usingdeductive proof schemes, r = .666, p (one-tailed) < .05. However, we need to be careful inthe way we interpret these results, since we see that there is a large drop in the number of thestudents (from N = 22 to N = 11) from pre to post test. When the number of participants islower, a larger correlation would be needed to reach the same level of significance.
For answering question 3 (What is the correlation between the progress in Harel & Sowderproof schemes (from EMP to DED) and the progress in vH level from any level to any higherlevel?) we conducted a 1-tailed Pearson test (since we now had to do with binary and ratio scaletype variables). Table 7.7 shows that the results of this test were not significant although theyare close to significant (r = .491).
PrvH0 (3/5) PrvH0 (4/5) Fend − Fstart
PrvH0 (3/5) Pearson Correlation 1 −.327 .407Sig. (1-tailed) .178 .095N 13 10 12
PrvH0 (4/5) Pearson Correlation −.327 1 .491Sig. (1-tailed) .178 .053N 10 13 12
Fend − Fstart Pearson Correlation .407 .491 1Sig. (1-tailed) .095 .053N 12 12 18
Table 7.7: Correlation (1-tailed) between PrvH0 (3/5 and 4/5) and progress in Harel & Sowder proofschemes during the intervention (Fend − Fstart).
It is worth noting that there is a negative correlation between the two Van Hiele test criteria(3/5 and 4/5) which may indicate that the measurement instruments (Van Hiele test) are notprecise enough.
We conducted a similar test in order to answer question 4 (What is the correlation betweenthe progress in Harel & Sowder proof schemes (from EMP to DED) and the progress in vH levelfrom one of the levels 0, 1 or 2 to one of the levels 3 or 4?).
PrvH1 (3/5) PrvH1 (4/5) Fend − Fstart
PrvH1 (3/5) Pearson Correlation 1 .408 .251Sig. (1-tailed) .121 .204N 14 10 13
PrvH1 (4/5) Pearson Correlation .408 1 −.060Sig. (1-tailed) .121 .426N 10 13 12
Fend − Fstart Pearson Correlation .251 −.060 1Sig. (1-tailed) .204 .426N 13 12 18
Table 7.8: Correlation (1-tailed) between PrvH1 (3/5 and 4/5) and progress in Harel & Sowder proofschemes during the intervention (Fend − Fstart).
In Table 7.8 we can see that although the progress in Van Hiele level that we are checkingchanges to PrvH1 (for a definition see 7.4), the results are still not significant. Moreover, it isinteresting to note that with the 4/5 criterion the Van Hiele level of the students shows a slight
81
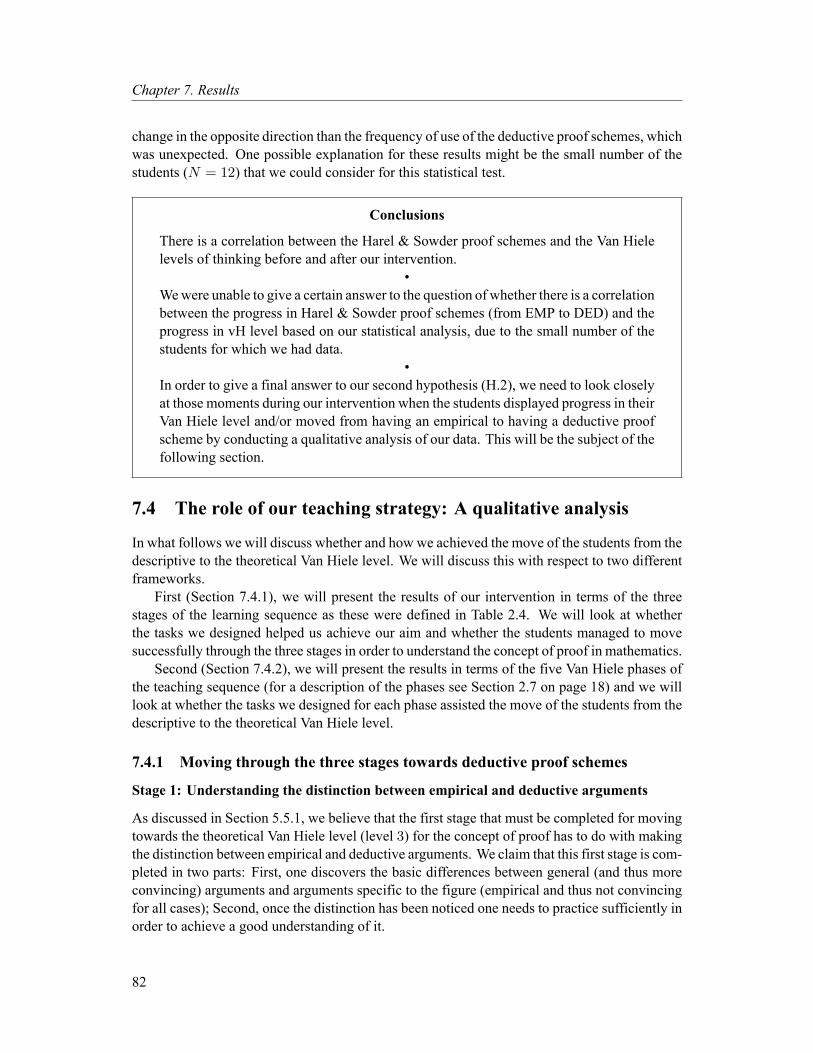
Chapter 7. Results
change in the opposite direction than the frequency of use of the deductive proof schemes, whichwas unexpected. One possible explanation for these results might be the small number of thestudents (N = 12) that we could consider for this statistical test.
Conclusions
There is a correlation between the Harel & Sowder proof schemes and the Van Hielelevels of thinking before and after our intervention.
•Wewere unable to give a certain answer to the question of whether there is a correlationbetween the progress in Harel & Sowder proof schemes (from EMP to DED) and theprogress in vH level based on our statistical analysis, due to the small number of thestudents for which we had data.
•In order to give a final answer to our second hypothesis (H.2), we need to look closelyat those moments during our intervention when the students displayed progress in theirVan Hiele level and/or moved from having an empirical to having a deductive proofscheme by conducting a qualitative analysis of our data. This will be the subject of thefollowing section.
7.4 The role of our teaching strategy: A qualitative analysis
In what follows we will discuss whether and how we achieved the move of the students from thedescriptive to the theoretical Van Hiele level. We will discuss this with respect to two differentframeworks.
First (Section 7.4.1), we will present the results of our intervention in terms of the threestages of the learning sequence as these were defined in Table 2.4. We will look at whetherthe tasks we designed helped us achieve our aim and whether the students managed to movesuccessfully through the three stages in order to understand the concept of proof in mathematics.
Second (Section 7.4.2), we will present the results in terms of the five Van Hiele phases ofthe teaching sequence (for a description of the phases see Section 2.7 on page 18) and we willlook at whether the tasks we designed for each phase assisted the move of the students from thedescriptive to the theoretical Van Hiele level.
7.4.1 Moving through the three stages towards deductive proof schemes
Stage 1: Understanding the distinction between empirical and deductive arguments
As discussed in Section 5.5.1, we believe that the first stage that must be completed for movingtowards the theoretical Van Hiele level (level 3) for the concept of proof has to do with makingthe distinction between empirical and deductive arguments. We claim that this first stage is com-pleted in two parts: First, one discovers the basic differences between general (and thus moreconvincing) arguments and arguments specific to the figure (empirical and thus not convincingfor all cases); Second, once the distinction has been noticed one needs to practice sufficiently inorder to achieve a good understanding of it.
82
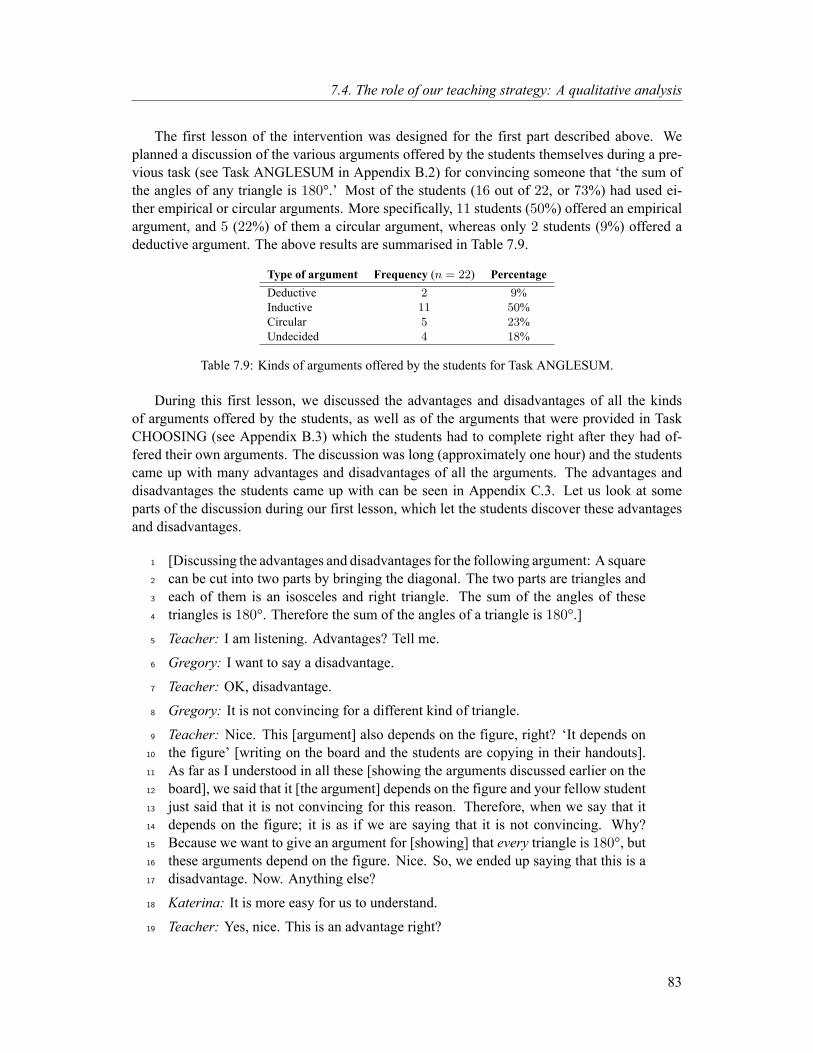
7.4. The role of our teaching strategy: A qualitative analysis
The first lesson of the intervention was designed for the first part described above. Weplanned a discussion of the various arguments offered by the students themselves during a pre-vious task (see Task ANGLESUM in Appendix B.2) for convincing someone that ‘the sum ofthe angles of any triangle is 180°.’ Most of the students (16 out of 22, or 73%) had used ei-ther empirical or circular arguments. More specifically, 11 students (50%) offered an empiricalargument, and 5 (22%) of them a circular argument, whereas only 2 students (9%) offered adeductive argument. The above results are summarised in Table 7.9.
Type of argument Frequency (n = 22) PercentageDeductive 2 9%Inductive 11 50%Circular 5 23%Undecided 4 18%
Table 7.9: Kinds of arguments offered by the students for Task ANGLESUM.
During this first lesson, we discussed the advantages and disadvantages of all the kindsof arguments offered by the students, as well as of the arguments that were provided in TaskCHOOSING (see Appendix B.3) which the students had to complete right after they had of-fered their own arguments. The discussion was long (approximately one hour) and the studentscame up with many advantages and disadvantages of all the arguments. The advantages anddisadvantages the students came up with can be seen in Appendix C.3. Let us look at someparts of the discussion during our first lesson, which let the students discover these advantagesand disadvantages.
[Discussing the advantages and disadvantages for the following argument: A square1
can be cut into two parts by bringing the diagonal. The two parts are triangles and2
each of them is an isosceles and right triangle. The sum of the angles of these3
triangles is 180°. Therefore the sum of the angles of a triangle is 180°.]4
Teacher: I am listening. Advantages? Tell me.5
Gregory: I want to say a disadvantage.6
Teacher: OK, disadvantage.7
Gregory: It is not convincing for a different kind of triangle.8
Teacher: Nice. This [argument] also depends on the figure, right? ‘It depends on9
the figure’ [writing on the board and the students are copying in their handouts].10
As far as I understood in all these [showing the arguments discussed earlier on the11
board], we said that it [the argument] depends on the figure and your fellow student12
just said that it is not convincing for this reason. Therefore, when we say that it13
depends on the figure; it is as if we are saying that it is not convincing. Why?14
Because we want to give an argument for [showing] that every triangle is 180°, but15
these arguments depend on the figure. Nice. So, we ended up saying that this is a16
disadvantage. Now. Anything else?17
Katerina: It is more easy for us to understand.18
Teacher: Yes, nice. This is an advantage right?19
83

Chapter 7. Results
[The discussion continues and the students offer other advantages and disadvan-20
tages]21
A lively discussion began when reviewing Eleni’s argument (see Appendix B.3): “I tore theangles up and put them together. It came to a straight line which is 180°. I tried for an equilateraland an isosceles as well and the same thing happened.” Many students were convinced by thisanswer at first sight.
Theano: It is ‘practical’.1
Teacher: OK. I will write it as…I imagine…What is this, good?2
Students: Advantage.3
Teacher: Advantage. It is easy when we do practical things, right? [Writes it down4
on the board.] Someone said it is ‘artistic’. Who said this?5
Nia: Me.6
Teacher: You? That it is very artistic, I liked this one, I believe this as well and I7
guess it goes with the…advantages. [Writes it down on the board.]8
Gayle: It is easy to understand.9
Teacher: Easy to understand [writes it down with the advantages].10
Anna: I am convinced.11
Teacher: You are convinced. Let’s see what the rest of the students think. Let’s vote12
again. Who was convinced by this? [The majority of the class raises their hands.]13
Everyone is convinced …Who wasn’t convinced? [About five students raise their14
hands and others are shouting “for all triangles!” as a counter argument to those15
that were convinced.] OK, so you [points at a girl] said it is convincing. Why?16
Anna: Because the way I look at it, that forms the straight line…it convinces me.17
Teacher: So, you are convinced by this [pointing at the figure of the argument on18
the board]. So can you now say that it will be the same for any triangle? Are you19
sure?20
Anna: Yes.21
[At this point many students have their hands raised and want to contribute to the22
discussion.]23
Teacher: Nice. You? Are you convinced or not? [Pointing to a girl that is raising24
her hand.]25
Thalia: I am not sure, but it is logical.26
Teacher: It is logical. OK, let’s write this down in the advantages. [Writes it down.]27
Who is not convinced?28
Katerina: Me, because there is a possibility that we make a mistake when cutting,29
or whatever…30
Teacher: When cutting. OK. How did we call this? There is a possibility of error in31
the measurement. True. If you cut it wrongly…This sounds similar to measuring,32
right?33
84
7.4. The role of our teaching strategy: A qualitative analysis
Mary: We don’t know if it holds for all triangles…34
Student: It holds for all triangles35
Mary: …so we need to draw a few more.36
Kelly: But she said [Eleni in the proof] that she drew a random triangle.37
Teacher: Does she say it is random?38
Fiona: She says she tried it also on an equilateral and an isosceles.39
Teacher: Nice. OK, so we tried it in a few different kinds of triangles.40
Kelly: And one of those is random. It is not something that we chose…41
Fiona: We might have been lucky and ended up with the right sum of angles.42
Teacher: Yes, this may have happened, isn’t that so?43
Students: Yes.44
Teacher: Isn’t this as if she measured them and added them up? Only that she did45
it in a practical way.46
[Discussing about the similarity with the argument that uses measurement for a47
couple of minutes. Students agree.]48
Teacher: So are we convinced for all triangles? This is what wewant to know. How49
many are convinced that by this argument we can be sure that for all, infinitelymany50
triangles, it will hold?51
[Many students still raise their hands but they are obviously less than before the52
discussion.]53
Teacher: They are less than those that did not raise their hand.54
Olivia: But, even if it [the triangle] becomes right, again it will [be 180°] …55
Teacher: How do you know?56
[Students start arguing with each other, their are divided roughly in two groups and57
are trying to convince each other. The teacher tries to bring the discussion back58
to order because they are talking over each other and no argument can actually be59
heard.]60
Teacher: OK, you [to Olivia], tell me why you think it is OK?61
Olivia: I believe that even if we take a right triangle we will find the same.62
Teacher: But, how do you know? Did you sign a contract with anyone? [Laughs]63
Olivia: Because…one angle is 90, and…the other two angles that are left are again64
90.65
Teacher: How do you know?66
Student: How do you know?67
Gregory: She tried it! [laughs]68
Olivia: I tried it!69
Teacher: On all, infinitely many triangles?70
85
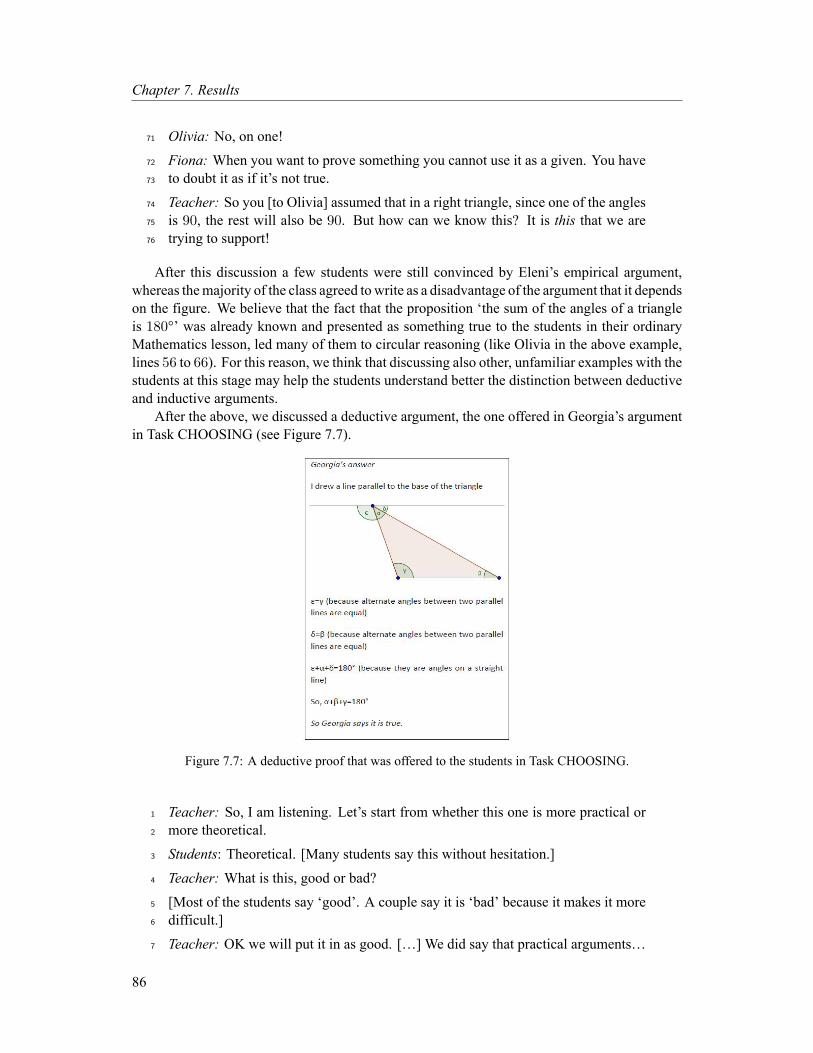
Chapter 7. Results
Olivia: No, on one!71
Fiona: When you want to prove something you cannot use it as a given. You have72
to doubt it as if it’s not true.73
Teacher: So you [to Olivia] assumed that in a right triangle, since one of the angles74
is 90, the rest will also be 90. But how can we know this? It is this that we are75
trying to support!76
After this discussion a few students were still convinced by Eleni’s empirical argument,whereas themajority of the class agreed towrite as a disadvantage of the argument that it dependson the figure. We believe that the fact that the proposition ‘the sum of the angles of a triangleis 180°’ was already known and presented as something true to the students in their ordinaryMathematics lesson, led many of them to circular reasoning (like Olivia in the above example,lines 56 to 66). For this reason, we think that discussing also other, unfamiliar examples with thestudents at this stage may help the students understand better the distinction between deductiveand inductive arguments.
After the above, we discussed a deductive argument, the one offered in Georgia’s argumentin Task CHOOSING (see Figure 7.7).
Figure 7.7: A deductive proof that was offered to the students in Task CHOOSING.
Teacher: So, I am listening. Let’s start from whether this one is more practical or1
more theoretical.2
Students: Theoretical. [Many students say this without hesitation.]3
Teacher: What is this, good or bad?4
[Most of the students say ‘good’. A couple say it is ‘bad’ because it makes it more5
difficult.]6
Teacher: OK we will put it in as good. […] We did say that practical arguments…7
86
7.4. The role of our teaching strategy: A qualitative analysis
A student: May have errors.8
Teacher: They may be good but they also have a risk of having errors. Let’s put it9
in the advantages.10
Kelly: Yes but in the theoretical we need to prove what we say again.11
Teacher: So it is more difficult right?12
John: The theoretical is more convincing!13
Teacher: It is more convincing, eh?14
Katy: We learned something on this and we know certainly that it holds. [Referring15
to the rule about alternate angles.]16
Teacher: Something, you mean…from before.17
Katy: Yes.18
Teacher: So, it is something that depends on previous knowledge.19
Katy: Yes.20
Teacher: Basically yes, this depends on previous knowledge. And this is a good21
thing because we are sure, right? [Writes it on the board.] Anything else?22
Fiona: I believe that this is the proof.23
Teacher: You are convinced. Who is convinced? I want to see hands.24
[Almost all students raise their hands.]25
Teacher: Convincing! Let’s write this down. Why is it convincing? What differ-26
ence does this one have? Will the ones that are convinced let me know?27
Katy: Because it is based on certain givens.28
Teacher: …that we have shown. This we have said, yes, that ‘it depends on pre-29
vious knowledge’. But there were other arguments that also depend on previous30
knowledge and you didn’t tell me that they were convincing. [Fiona is raising her31
hand.] Tell me.32
Fiona: It does not depend on the figure because whatever angle there is, it will be,33
since they are…eh…alternate angles, they will be equal!34
Teacher: Do you agree? [To the rest of the class.]35
Students: [All with one voice] Yes.36
Teacher: All of you? Bravo. OK? Because it does not depend on the figure. This37
is a good thing, right?38
A student: Very good!39
Teacher: We will write it down here with the ‘convincing’. Because the other ones40
[the arguments] that depend on the figure, you said they were not convincing.41
[The teacher spends a few minutes on showing to the students how although one42
can move the sides and angles of the figure to create other possible triangles, the43
argument will always hold. This is what the class had earlier called ‘the argument44
87

Chapter 7. Results
has movement’ (which makes it applicable for infinitely many cases) and it was45
considered as an advantage.]46
Teacher: So, won’t we find a disadvantage guys?47
Students: [Many together] It doesn’t have any!48
Fiona: Miss we didn’t put that it is simple, and logical.49
Teacher: OK, put it in, ‘simple’ and ‘logical’. Is it difficult?50
[Most of them say it is easy but a couple say it is difficult.]51
Teacher: Why is it difficult?52
Flora: In the theoretical [part]. Because, the alternate, someone might not know it.53
Teacher: Yes because it requires [to have certain] knowledge.54
John: It depends on previous knowledge.55
[Chat about the fact that we had mentioned this earlier.]56
Teacher: What other difficult part does it have? Let’s say you start with drawing a57
triangle [draws one on the board] and you look at it…we say it is a random one. And58
you say ‘what should I do now to show it’…For instance you can start measuring.59
That’s the simplest [you can do]. But you were not convinced by it, so we decided60
that it was not very convincing because it is for specific triangles, it isn’t for all61
[triangles]. What are you going to do?62
A student: We will bring a parallel.63
Teacher: So? Is this an easy thing to think of?64
Fiona: The way of thinking. It is original but…65
Teacher: So it requires you to think of drawing an extra line on the figure, you66
should think it on your own, and also make the line parallel.67
Fiona: It is very original yes, and difficult.68
Teacher: We will write ‘original’ in the advantages and ‘difficult to think’ [in the69
disadvantages], none of you came upwith it. Or, actually, ‘it needs to bring assisting70
lines’ that’s how we will write it down. All right?71
Students: Miss, they all needed assisting lines!72
Teacher: It wasn’t in all. In the one you measured, you measured all angles, did73
you bring any [lines]? You did not bring anything. [Checking the previous proofs74
with the students to make sure they understand what this means.]75
From the above we see that many students (although not yet all) managed to take duringthis introductory lesson the first and crucial step of realising the difference between convincingand non-convincing arguments in relation with the generality of the arguments (lines 13, 15,33–36). In other words, they became aware of the distinction between empirical and deductivearguments.
As we already discussed in previous sections, realising the existence of such a distinctiondoes not imply acquiring a deep understanding of the distinction or immediately stopping beingconvinced by inductive arguments. TaskQUAD (seeAppendix B.5) was designed for promoting
88
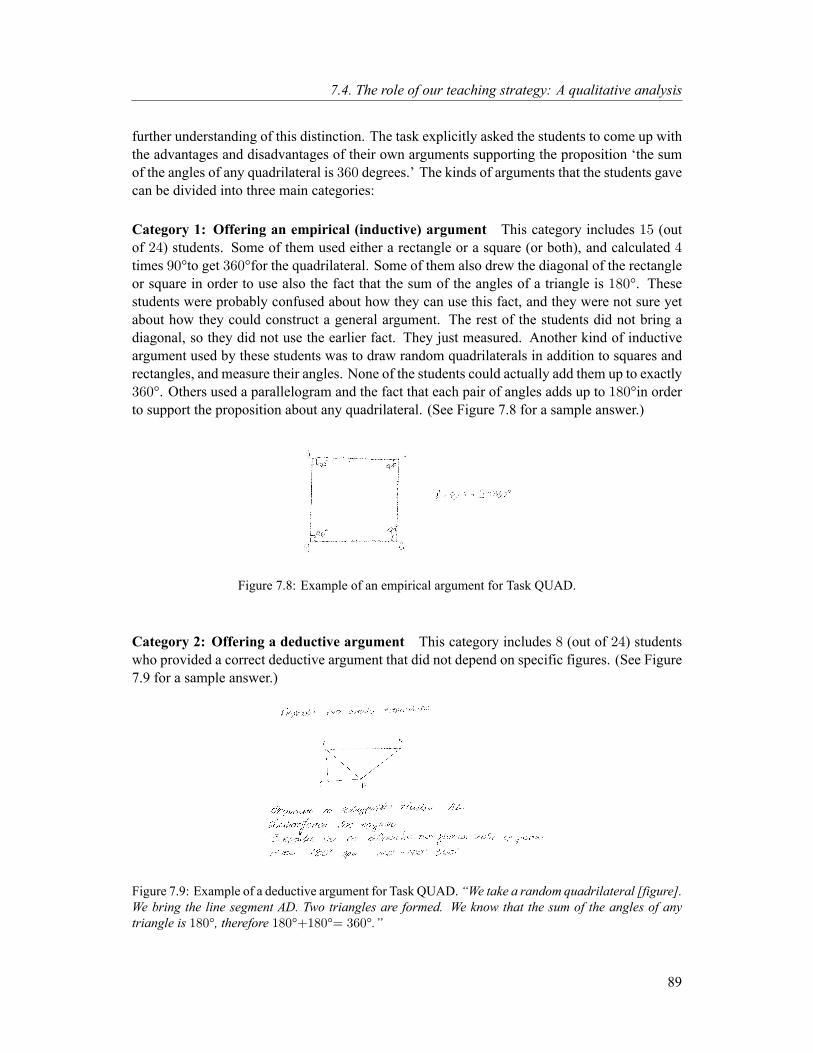
7.4. The role of our teaching strategy: A qualitative analysis
further understanding of this distinction. The task explicitly asked the students to come up withthe advantages and disadvantages of their own arguments supporting the proposition ‘the sumof the angles of any quadrilateral is 360 degrees.’ The kinds of arguments that the students gavecan be divided into three main categories:
Category 1: Offering an empirical (inductive) argument This category includes 15 (outof 24) students. Some of them used either a rectangle or a square (or both), and calculated 4times 90°to get 360°for the quadrilateral. Some of them also drew the diagonal of the rectangleor square in order to use also the fact that the sum of the angles of a triangle is 180°. Thesestudents were probably confused about how they can use this fact, and they were not sure yetabout how they could construct a general argument. The rest of the students did not bring adiagonal, so they did not use the earlier fact. They just measured. Another kind of inductiveargument used by these students was to draw random quadrilaterals in addition to squares andrectangles, and measure their angles. None of the students could actually add them up to exactly360°. Others used a parallelogram and the fact that each pair of angles adds up to 180°in orderto support the proposition about any quadrilateral. (See Figure 7.8 for a sample answer.)
Figure 7.8: Example of an empirical argument for Task QUAD.
Category 2: Offering a deductive argument This category includes 8 (out of 24) studentswho provided a correct deductive argument that did not depend on specific figures. (See Figure7.9 for a sample answer.)
Figure 7.9: Example of a deductive argument for Task QUAD. “We take a random quadrilateral [figure].We bring the line segment AD. Two triangles are formed. We know that the sum of the angles of anytriangle is 180°, therefore 180°+180°= 360°.”
89
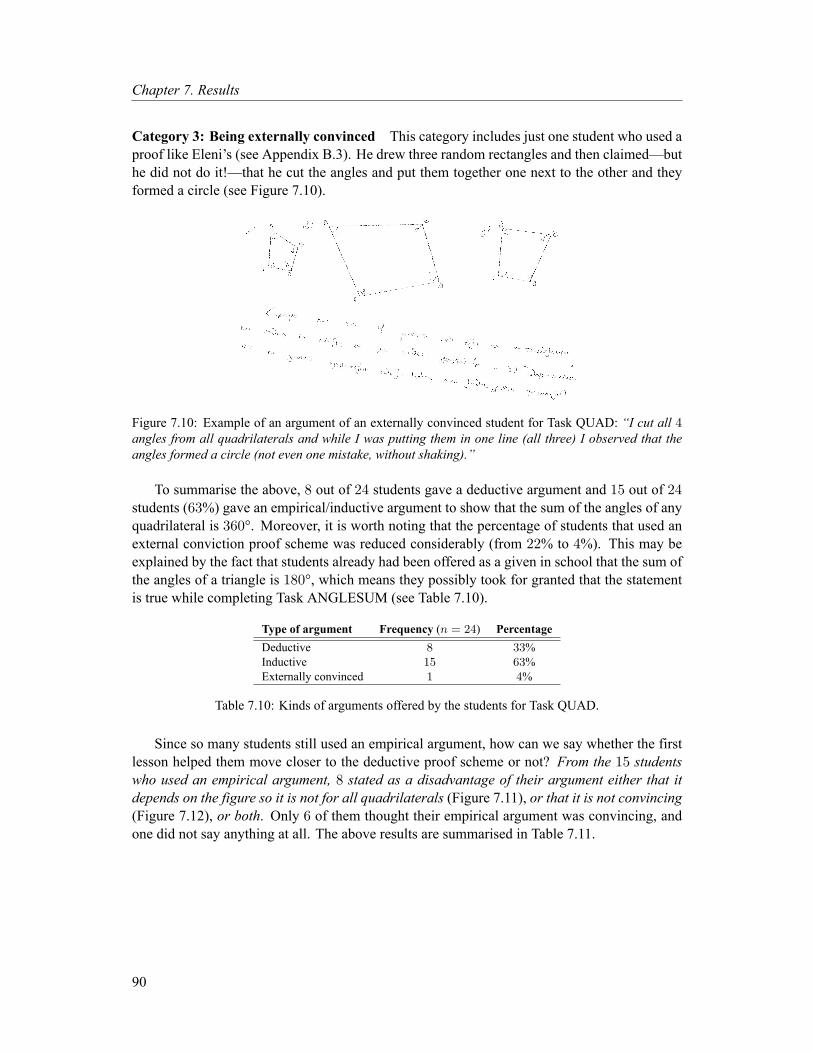
Chapter 7. Results
Category 3: Being externally convinced This category includes just one student who used aproof like Eleni’s (see Appendix B.3). He drew three random rectangles and then claimed—buthe did not do it!—that he cut the angles and put them together one next to the other and theyformed a circle (see Figure 7.10).
Figure 7.10: Example of an argument of an externally convinced student for Task QUAD: “I cut all 4angles from all quadrilaterals and while I was putting them in one line (all three) I observed that theangles formed a circle (not even one mistake, without shaking).”
To summarise the above, 8 out of 24 students gave a deductive argument and 15 out of 24students (63%) gave an empirical/inductive argument to show that the sum of the angles of anyquadrilateral is 360°. Moreover, it is worth noting that the percentage of students that used anexternal conviction proof scheme was reduced considerably (from 22% to 4%). This may beexplained by the fact that students already had been offered as a given in school that the sum ofthe angles of a triangle is 180°, which means they possibly took for granted that the statementis true while completing Task ANGLESUM (see Table 7.10).
Type of argument Frequency (n = 24) PercentageDeductive 8 33%Inductive 15 63%Externally convinced 1 4%
Table 7.10: Kinds of arguments offered by the students for Task QUAD.
Since so many students still used an empirical argument, how can we say whether the firstlesson helped them move closer to the deductive proof scheme or not? From the 15 studentswho used an empirical argument, 8 stated as a disadvantage of their argument either that itdepends on the figure so it is not for all quadrilaterals (Figure 7.11), or that it is not convincing(Figure 7.12), or both. Only 6 of them thought their empirical argument was convincing, andone did not say anything at all. The above results are summarised in Table 7.11.
90

7.4. The role of our teaching strategy: A qualitative analysis
Type of answer Frequency (n = 15) PercentageAware that it is not convincing and/ordepends on the figure
8 53%
Not aware that it is not convincing orthat it depends on the figure
6 40%
Blank 1 7%
Table 7.11: Students who used inductive arguments for Task QUAD.
Figure 7.11: A student who correctly identified the non-generality of her argument (about a rectangle).“Advantages: 1. simple, 2. short, 3. easy, 4. is based on previous knowledge. Disadvantages: It is provenonly in this figure, it is therefore a special proof. 2. There is a possibility of mistake when you do it.”
Figure 7.12: A student that mistakenly believed her argument to be general. (The argument this studentoffered was about a parallelogram.) “Advantages: 1. It is easy, 2. It has theory, 3. It holds for allquadrilaterals. Disadvantages: 1. It is difficult to understand.”
We see in Table 7.11 that after completing Task QUAD, only a quarter of the students stillthought that their inductive arguments were convincing and could not see that they depended onthe figure. About half of the students who used an empirical argument, already from the firstlesson realised that their argument was not convincing enough, although they still used sucharguments because they found them easier. We think this is an outcome of the discussion of theadvantages and disadvantages of arguments. Moreover, 6 of the 8 (75%) students who used adeductive argument were aware that it does not depend on the figure, while only two thought thatit was not convincing enough. (Figures 7.13 and 7.14 show samples of both kinds of answers.)
Figure 7.13: A student who offered a correct deductive argument and identified it as convincing. “Ad-vantages: 1. It has movement, 2. It is theoretical, 3. It is convincing. Disadvantages: 1. It needs tobring assisting lines [diagonal].”
Figure 7.14: A student who offered a correct deductive argument but still expressed doubts. “Advantages:1. Logical, 2. Theoretical, 3. Simple/Easy, 4. Short. Disadvantages: 1. We can never be sure, there arealways doubts.”
91

Chapter 7. Results
The above results are summarised in Table 7.12.
Type of answer Frequency (n = 8) PercentageAware that it is convincing 6 75%Not aware that it is convincing 2 25%
Table 7.12: Students who used deductive arguments for Task QUAD.
Another task we used in the first stage of our intervention was BIS (see Appendix B.7) wherewe asked the students to offer two different kinds of arguments: one empirical that dependson the figure and one general that does not depend on the figure. With this task we aimed atassisting the students to understand better the distinction between the two kinds of arguments.Some students gave only empirical arguments similar to the ones offered for previous tasks,some gave both an empirical argument and a correct deductive one (see Figure 7.15), and othersgave one circular and one empirical argument (see Figure 7.16).
Figure 7.15: A deductive and an empirical argument for Task BIS. “1. Since all of them [the angles]together are 180°, then the sum of their halves will be 90°. 2. K1,2 = 54°therefore K1 = K2 = 27°,K3,4 = 126 thereforeK3 = K4 = 63,K4 +K1 = 63°+ 27° = 90°”
Figure 7.16: A circular and an empirical argument for Task BIS. “1. SinceKD1 perpendicular toKD2,thereforeD2KD =right. 2. Measuring with the protractor we find that angleD2KD is right.”
92
7.4. The role of our teaching strategy: A qualitative analysis
Out of the 20 students that completed this task, 11 (55%) gave (at least) an empirical argu-ment, and 6 gave a correct deductive argument. Finally, 3 out of 20 students atempted to give adeductive argument but failed whereas only 2 did not attempt to give any argument. One of thearguments offered by a student could not be categorised in any of the above categories. Theseresults are summarised in Table 7.13.
Type of argument Frequency (n = 20) PercentageInductive 11 55%Correct deductive 6 30%Undecided 1 5%No argument 2 10%
Table 7.13: Kinds of arguments offered by the students for Task BIS. The task asked the students to offerone inductive and one deductive argument
We can conclude from all the above examples discussed for the first stage of our interventionthat the students managed to make a move closer to adopting the deductive proof scheme, sincethey took the first step of realising the non-generality of the empirical proof scheme and thereforeits failure to convince. However we can see that still only a bit more than a half of the classoffered (or attempted to offer) deductive arguments. We think this is not unexpected since thestudents in this first stage are only expected to realise the distinction between inductive anddeductive arguments and it is only with enough practice, which comes in Stage 2, that they areexpected to start completely abandoning empirical arguments.
In what follows we will look at some discussions between the students during Stage 2 inorder to locate the further steps the students took towards the theoretical VanHiele level. Wewillkeep a focus on locating the instances where the students that used mostly empirical argumentswere in fact changing their attitude and were starting to look for deductive arguments in orderto be more convincing.
Stage 2: Abandoning the use of empirical arguments in favor of deductive ones
There are several examples of cases during our intervention where the students move from anempirical to a deductive proof scheme, a few of which will be discussed here in chronologicalorder. In general, the students made the transition from the empirical to the deductive proofscheme at various moments during the intervention, and some students did not manage to makethis transition at all.3 The four examples that will be discussed here are taken from class discus-sions and group work during which the aim was to provide convincing arguments for showingthat certain (general) mathematical statements are true. In the examples we will see variouskinds of attitudes (empirical, deductive, and external conviction) towards proof employed bythe students, but we will focus on those attitudes which we think show evidence of students’moving from empirical or external conviction to deductive proof schemes.
The first example of a student making a move closer to the deductive proof scheme takesplace in the following context. The students in the previous lesson had to come up with anargument to support the truth of the proposition ‘the sum of the angles of any quadrilateral is360°.’ The following lesson started by discussing the arguments in terms of their advantagesand disadvantages. The teacher talked about some of the empirical arguments that the students
3A complete overview of the progress of each student was offered in Table 7.2 on page 76.
93

Chapter 7. Results
had used, among which those which used a square and said that the sum of its angles is 360°, andthe conclusion of the discussion was that the argument was not convincing. Thus the teachersuggested that someone who had used this argument should try to figure out a more generalargument for the general quadrilateral, and also said that they could now use the fact that thesum of the angles of a triangle is 180°. The discussion below is on this subject.
Example 1: A look at whole class discussion after task QUAD (see Appendix B.5)
Teacher: Can someone of those that did this previous one [using an empirical argu-1
ment involving a square] tell me how they would do it for the random quadrilateral?2
What would they think? What holds always in a quadrilateral? And to also use the3
fact that the sum of the angles of a triangle is 180°.4
[…]5
Olivia: Again we would bring a diagonal.6
Teacher: Again. OK let’s do it [draws a diagonal].7
Olivia: And then we measure the angles…8
Teacher: Do we need to measure them? Let’s think…9
John: No! Miss shall I say?10
Olivia: No it is 180°.11
[John keeps talking and wants to say the answer.]12
Teacher: Wait a minute, don’t shout please, I want Olivia to tell me because those13
of you who already did it there’s no point to tell me, I know that you did it. The14
point is for everyone to be able to do it. OK? So…tell me.15
[In the meantime teacher gives names to all angles formed after bringing the diag-16
onal of the quadrilateral.]17
Olivia: We know that every triangle is 180°. If I add the two triangles, that is, 18018
times 2, it will be 360°.19
Here the teacher noticed that Olivia had the quite simplistic idea that we can multiply 180by two and find the result we want, but this argument is not entirely correct since it holds onlyin case we divide the quadrilateral into two triangles by bringing a diagonal. If we had dividedthe quadrilateral in more than two triangles then we would still multiply the number of trianglesby 180 (which is of course not correct). Therefore the teacher gave some hints to Olivia to helpher state the argument in a more precise way.
Teacher: Nice. Are the angles of the triangle also angles of the quadrilateral?20
Olivia: Yes.21
Teacher: Why? This angle of the triangle,B1, is also an angle of the quadrilateral?22
Olivia: It is half.23
Teacher: Not half…24
94
7.4. The role of our teaching strategy: A qualitative analysis
Olivia: More or less.25
Teacher: …one part of B.26
Olivia: Yes.27
Teacher: So, what do we know for this triangle?28
Olivia: That A plus B1 plus D1 is equal to 180.29
Olivia seemed to grasp the idea of the addition, and she came up with it quite easily withoutthe help of the teacher. She also seemed to see why this would lead to the desired argument.
Teacher: For the other one what do I know?30
Olivia: That…B2 plus D2 plus G is equal to 180.31
Teacher: Now, if we add all this, we get […] 360. Do you see how simple? This32
one now [the argument], can someone come and tell us that it does not hold for all33
quadrilaterals?34
Olivia: No.35
Teacher: What would have to be the case for it not to hold for all quadrilaterals?36
There would have to be some quadrilateral that we would not be able to do what in37
that quadrilateral?38
A student: Bring the diagonal.39
Teacher: Bring the diagonal, very nice, correct. Is there such a quadrilateral?40
Students: No.41
Teacher: We have 4 angles. We can always connect the two opposite angles.42
[…]43
Teacher: So, this is the general argument, which, those who used it, most of them,44
said that it was convincing. Does anyone of those that did not use it think that this45
is not convincing?46
[No one answers positively.]47
In the above passage we see how Olivia, a student who used an empirical/inductive argu-ment to support the statement that ‘the sum of the angles of any quadrilateral is 360°,’ assistedby a discussion with the teacher and her classmates discovers a more general argument for sup-porting the above statement.
The second example comes from a group task on proving that the angle formed between thebisectors of two adjacent and complementary angles is right. The group was formed by fourstudents of mixed abilities. Each of the students had worked on the same task individually at theend of the previous day and now they had to all together come up with a convincing argumentand write it down clearly.
95
Chapter 7. Results
Example 2: Group work for Task BIS (see Appendix B.8).
Sue:We have to prove that angles ε and δ have sum 90°. So, we will do the follow-1
ing. We will measure this angle here.2
Elli: Without measuring. We have to find a solution theoretically.3
Sue: Where is this written? Is there anywhere written ‘theoretically’?4
Elli: [Reading] “Write an argument.” That is, we are making an assumption.5
Elinor: Argument…that is, anybody who will take this to see it will not start mea-6
suring…We have to prove it.7
[They discuss again what they need to prove because Anna, another member of the8
group, has not understood yet. At some point Anna realises that it is not given that9
the sum of the angles is a right angle.]10
Anna: Oh, we don’t know that it is 90°…11
Elinor: [Laughing] No! This is what we are looking for!12
Anna: Very easy, we measure ζ and γ, we subtract that from 180, [so] ε and13
δ equals 90° [she laughs expressing awareness that her idea is not a convincing14
argument].15
Elli: It would be nice but again it needs measurement. We want to find something16
without measuring.17
[Sue insists that she knows how to show it so she is trying to explain her argument18
to the others.]19
Sue: We know that the angle, this one here is right. Therefore, we know that a right20
angle is 90°. Eh, isn’t that all guys? If…21
Anna: We suppose that we don’t know this! [Anna here is clearly turning from22
an Empirical proof scheme that she had earlier to a Deductive one.]23
Elli: Exactly. We have to find this. So it is wrong this way you are using [to Sue].24
Anna: Yes, it starts from the given.25
Sue: Wait a minute. [She starts measuring with the protractor again. The whole26
group reacts and they try to take the protractor from Sue.]27
Anna: We want to prove it.28
In the above passage we see three different kinds of behaviours. Elli and Elinor are thestudents who since the beginning of the group work had a deductive proof scheme (lines 3, 6).Sue, on the other hand, is the student that is using an empirical proof scheme and is not yet readyto make the change to a deductive proof scheme (lines 1–2, 18–19, 27–28). In fact until the endof the group work Sue insists on an empirical proof scheme, and one can see that she is confusedabout what is a general and what is a specific argument. The case that interests us most is that ofAnna, who from an empirical proof scheme (lines 11, 13–15) made progress to a deductive one(lines 22, 26, 29). Anna was one of the students that started attending the lessons clearly at theempirical level (based on the results of all the pre-tests and questionnaires). In this transcript wesee that Anna suddenly realises the importance of a general argument and the idea of avoiding
96

7.4. The role of our teaching strategy: A qualitative analysis
circular arguments (i.e. never start by assuming what you want to prove). This happened aftera few lessons and we may assume that it happened through discussing the work with her group.
Another example of a move from the empirical to the deductive proof schemes is the workon the same task (B.8) from a different group of students working on the same task, this timefour students of lower ability. Most of the students of this group were confused as to what theyneeded to prove and how they should interpret the figure given.
Example 3: Group work for Task BIS (B.8).
Nadia: Neither this one is 90.1
Stian: Yes, since the figure is like this.2
Nadia: Yes but she [the teacher] just said that. It is not what it looks like, we have3
to prove it.4
[The teacher happens to be passing at that moment and hears the discussion.]5
Nadia: Isn’t this what you said?6
Teacher: Yes, yes!7
Nadia: [To Stian] See?8
Stian: And how are we going to do it? [Showing the figure to the teacher.] First of9
all this one and this one are opposing, therefore they are equal.10
Nadia: Let’s apply what she has been telling us…11
Sunny: Uff [in a tone of disappointment]! That γ is equal to δ and this kind of12
things?13
Nadia: Yes, right!14
Stian: [To the teacher] Aren’t these, which are opposing, the same?15
Teacher: How can this be useful for you?16
George: Shall we do something like what you did on the board?17
Teacher: What we did on the board, you have to remember, this shows you why18
it will always be 90. It shows this to you, it…You have to write it somehow your-19
selves, with a general argument.20
Someone from the group: Uff…[expressing difficulty] What shall we do guys?21
Teacher: Can you think why will it always be 90? Think about it. All together [the22
angles] how much are they?23
Group: All together 180.24
Teacher: And that one, why is it 90?25
Nadia: Because we split in the middle this one and this one.26
Teacher: Yes!27
Nadia: Oh, is that it?28
Teacher: That simple!29
Nadia: Oh! [She is laughing and she sounds very happy.]30
97

Chapter 7. Results
We see in the above transcript that one of the students (Nadia), realised that there is a dis-tinction between giving an argument specific to the figure and giving a more general, deductiveargument (lines 3, 4). The same student, the previous day, when they had to give an argumentfor the same task individually, used two arguments that were not deductive. The first one wascircular (“Because they form a right angle and right angle = 90°”) and the second one was em-pirical (“If we measure with the protractor we will find out that it is 90°”). So we see that fromhaving an empirical proof scheme the previous day, after the lesson of the following day Nadiatried to find a deductive argument (line 26) although it was much harder than the empirical onesshe had come up with the previous day. This change may be due to the frequent comments ofthe teacher in class that we do not consider arguments depending on the figure as convincing,as well as due to the discussions with the rest of the group.
The last example comes from a group formed by three students who previously displayedmostly empirical proof schemes. Each of the students had worked individually before on thesame task. In this group task they had to collaboratively come up with a convincing argumentfor the TRIMID task, and write it down clearly.
Example 4: Group work for Task TRIMID (see Appendix B.11)
[…]1
Isis: So, we need to show that […] ∆E is parallel to BΓ.2
Gregory: But you can see that they are guys!3
Gregory here has an empirical proof scheme; the figure affects his opinion. Later however,Gregory realises that his argument is not strong and suggests that the two triangles formed aresimilar and have a similarity ratio, therefore the two lines have to be parallel.
Gregory: They [the triangles] are similar and have a similarity ratio. And since they4
are similar and have a similarity ratio they fall on the same figure [here Gregory5
does not remember the correct name of the property he refers to, but he has gotten6
the right idea]. […] because they fall on the same figure then won’t this one be7
parallel to that one?8
This latter attitude can be described as a deductive proof scheme. Moreover, while theother members of the group have difficulties understanding what to do when it comes time toprove or reject that ∆E is half of AΓ, Gregory seems to understand that since they found acounterexample, the conjecture is false:
Gregory: It doesn’t hold! Look! This one has to be half of that one.8
Nadia: It is.9
Gregory: In my figure though it isn’t! Look!10
[…]11
Isis: Oh! We can say also that we reject it, right?12
Gregory: Yes.13
Isis: So we reject it.14
98
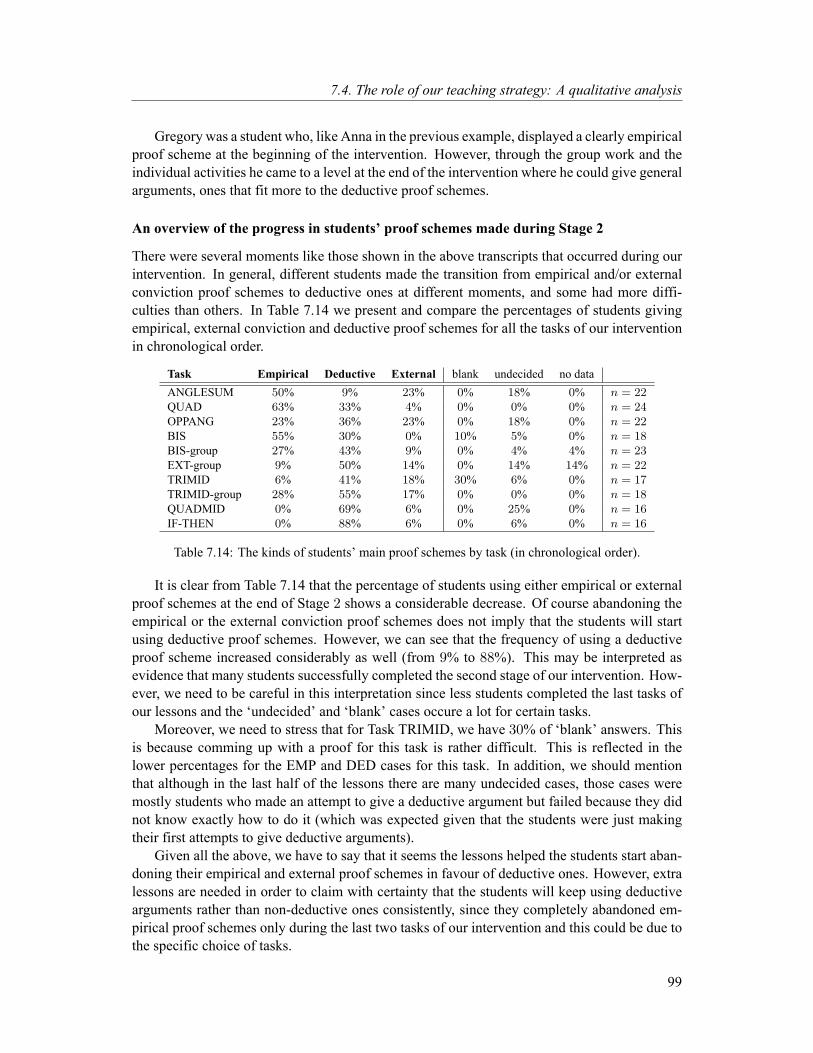
7.4. The role of our teaching strategy: A qualitative analysis
Gregory was a student who, like Anna in the previous example, displayed a clearly empiricalproof scheme at the beginning of the intervention. However, through the group work and theindividual activities he came to a level at the end of the intervention where he could give generalarguments, ones that fit more to the deductive proof schemes.
An overview of the progress in students’ proof schemes made during Stage 2
There were several moments like those shown in the above transcripts that occurred during ourintervention. In general, different students made the transition from empirical and/or externalconviction proof schemes to deductive ones at different moments, and some had more diffi-culties than others. In Table 7.14 we present and compare the percentages of students givingempirical, external conviction and deductive proof schemes for all the tasks of our interventionin chronological order.
Task Empirical Deductive External blank undecided no dataANGLESUM 50% 9% 23% 0% 18% 0% n = 22QUAD 63% 33% 4% 0% 0% 0% n = 24OPPANG 23% 36% 23% 0% 18% 0% n = 22BIS 55% 30% 0% 10% 5% 0% n = 18BIS-group 27% 43% 9% 0% 4% 4% n = 23EXT-group 9% 50% 14% 0% 14% 14% n = 22TRIMID 6% 41% 18% 30% 6% 0% n = 17TRIMID-group 28% 55% 17% 0% 0% 0% n = 18QUADMID 0% 69% 6% 0% 25% 0% n = 16IF-THEN 0% 88% 6% 0% 6% 0% n = 16
Table 7.14: The kinds of students’ main proof schemes by task (in chronological order).
It is clear from Table 7.14 that the percentage of students using either empirical or externalproof schemes at the end of Stage 2 shows a considerable decrease. Of course abandoning theempirical or the external conviction proof schemes does not imply that the students will startusing deductive proof schemes. However, we can see that the frequency of using a deductiveproof scheme increased considerably as well (from 9% to 88%). This may be interpreted asevidence that many students successfully completed the second stage of our intervention. How-ever, we need to be careful in this interpretation since less students completed the last tasks ofour lessons and the ‘undecided’ and ‘blank’ cases occure a lot for certain tasks.
Moreover, we need to stress that for Task TRIMID, we have 30% of ‘blank’ answers. Thisis because comming up with a proof for this task is rather difficult. This is reflected in thelower percentages for the EMP and DED cases for this task. In addition, we should mentionthat although in the last half of the lessons there are many undecided cases, those cases weremostly students who made an attempt to give a deductive argument but failed because they didnot know exactly how to do it (which was expected given that the students were just makingtheir first attempts to give deductive arguments).
Given all the above, we have to say that it seems the lessons helped the students start aban-doning their empirical and external proof schemes in favour of deductive ones. However, extralessons are needed in order to claim with certainty that the students will keep using deductivearguments rather than non-deductive ones consistently, since they completely abandoned em-pirical proof schemes only during the last two tasks of our intervention and this could be due tothe specific choice of tasks.
99

Chapter 7. Results
Stage 3: Starting to see the axiomatic structure of Euclidean geometry
Stage 3 of our intervention took place in the very last lesson of our intervention. A completetranscript of the discussion is offered in Section 7.4.2, where this stage is discussed in terms ofthe five Van Hiele phases for the introduction of the concepts ‘axiom’, ‘undefined term’ and‘axiomatic system’.
Conclusions
The first stage of our teaching strategy was successful, as most of the students (aboutthree quarters) after the completion of this stage were able to understand the distinc-tion between deductive and inductive arguments. However, and as was expected, thestudents at this point were not always able to offer deductive arguments, somethingwhich they are expected to practice during stage two.
•The second stage of our teaching strategy was also successful, since the percentage ofstudents using either empirical or external proof schemes at the end of stage two showsa considerable decrease while at the same time the frequency of using a deductiveproof scheme shows a considerable increase (from 9% to 88%). However, the numberof lessons and of students was small; therefore, we would need to try this teachingstrategy also on a larger sample and over a longer period of time in order to be able todraw safer conclusions regarding its effectiveness in general.
7.4.2 Moving through the five Van Hiele teaching phases towards the theoreticalVan Hiele level
Here we will describe how the five phases of the teaching sequence suggested by Van Hiele(see Section 2.7 on page 18for a description of the phases) were realised in our interventionand discuss whether the students completed the phases successfully during the move from thedescriptive to the theoretical Van Hiele level for the main concepts introduced. We will discussthe results ordered by groups of concepts, examining whether the aims set for the tasks designedfor each phase (see Section 5.5.2 on page 44) were achieved. The integration phase will bediscussed only at the end, as it happened at the same time for all concepts in the final lesson ofour intervention. A chronological overview of all the concepts introduced and the tasks used foreach concept was offered in Table 5.7 on page 50.
Concepts ‘proof’, ‘proving’ and ‘theorem’
Phase 1 - Inquiry: For this phase the Tasks ANGLESUM (see Appendix B.2) and CHOOS-ING - Part 1 (see Appendix B.3) were used. By letting the students complete Task ANGLE-SUM we aimed at getting them involved with the field of Euclidean geometry and the conceptof providing an argument for supporting or rejecting a mathematical proposition. With taskCHOOSING - Part 1 we wanted to allow the students to realise that there exist different kindsof arguments in the field under investigation. The results of this phase were presented in Section7.4.1 (Stage 1).
100
7.4. The role of our teaching strategy: A qualitative analysis
Phase 2 - Directed Orientation: During the directed orientation phase the students had towork on various tasks (ANGLESUM,QUAD,OPPANG,BIS, TRIMID). The aims of these taskswere explained in Table 5.3 on page 46. Especially for the concepts of ‘proof’ and ‘proving’ itwas our aim to give the students enough opportunities to practice in order to start abandoningempirical proof schemes in favor of deductive ones. In Section 7.4.1 (Stage 2) we presentedexamples of students who started making this transition. This phase is terminated with theExplication phase in which students and teacher establish a common ground for the meaning ofthe concepts introduced and the terminology that corresponds to them. Below we will presenthow the explication phase was realised in our intervention and whether or not it suggests asuccessful completion of Phase 2.
Phase 3 - Explication: We knew that the students were ready for the explication phase forthese concepts from their discussions and group work during the lessons. We have offered someexamples of such moments where the students start understanding the idea of giving deductivearguments in Section 7.4.1 (Stage 2) (see Examples 1, 2, and 3). To assist the explication phasefor the concepts of ‘proof’, ‘proving’ and ‘theorem’ the teacher prepared two handouts: ‘Howwe discover new truths in Geometry’ (see Appendix C.4) and ‘What we discovered in the Geom-etry lessons’ (see Appendix C.5). In the following transcripts we see how the teacher introducedthe terminology for these concepts which the students had been practicing during phase 2.
Teacher: So, I am saying here [in handout C.4] in short what we have been doing1
and what I have been telling you in my own words. The first step is ‘observation’;2
that which usually does not exist in school [meaning the ordinary school lessons],3
right? To observe and discover on your own some relations. The second step is to4
‘conjecture’. Have you ever heard this word? ‘Conjecture’?5
Students: No.6
Teacher: Thats OK it doesn’t matter. This word is the one they use in mathe-7
matics. What we did, that is, to try and guess what holds generally, to find a8
relation…you said [for example] this one is probably a right angle [referring to9
the BIS task (B.7)] this was a ‘conjecture’ that you made. What does ‘conjec-10
ture’ mean? A ‘hypothesis’. I guessed something, OK? That is, I am not sure11
about it yet. When something is a conjecture it means it has not been shown12
yet, I haven’t given a convincing argument yet. OK? […] Here [referring to the13
handout] I also gave you an example about the quadrilateral. ‘I make the conjec-14
ture that the sum of the angles of every quadrilateral is 360°’, do you remember15
when each of you measured a quadrilateral and we saw that all of them more or less16
are close to 360 but not exactly, and we say that probably, I think that, for every17
quadrilateral the sum of its angles will be 360°but I am not sure, it is a ‘conjecture’,18
a ‘hypothesis’, right?19
Then [step 3] we ‘gave movement’ to the figure and we tried to figure out what20
[lines] we can bring, what we can do in order to show it, and we brought the diago-21
nal. And we saw that whatever way we move it [the figure] in whatever quadrilat-22
eral in the world we can bring a diagonal. What does this mean? We divide it into23
two…into two triangles. This is nice.24
101
Chapter 7. Results
And then [step 4] we offered the argument. This is the ‘proof’. And proof in25
mathematics is what we saw together, the ‘convincing’ arguments. They have26
to be general, right? We sawmany kinds of arguments last time. We saw some that27
depended on the figure, remember? Youmeasured them…we saw some others who28
cut them [the angles] and put them together, we saw plenty of arguments. Those29
that are considered as proof in mathematics are those which are convincing30
and general, they don’t depend on one figure, OK? [They hold] for all figures31
of that kind [showing on the board the argument of the task that had been solved32
earlier].33
We will do more of this in the following lessons, that is, we will observe, we will34
make conjectures, we will give movement to figures and in the end we will prove.35
I just want you to have this [handout] that gives an overview and if you want take36
a look at it at home […]37
The students were this way introduced to the terminology related to the basic steps behind‘proving’, and they heard for the first time that ‘proof’ in mathematics is considered to be onlythe arguments which are convincing for the general case. In a different handout called ‘Whatwe discovered in the Geometry lessons’ (see Appendix C.5) all the conjectures made, and thetheorems proven in the lesson to that point were presented in order to assist the students tounderstand how the explicated concepts related with what they had been doing in the lessons.This was an opportunity to explicate the concept of ‘theorem’ which is the result of the processof proving. Below we offer a transcript showing how this explication took place.
Teacher: I have put here…you remember that handout I gave you with the steps1
[referring to handout ‘How we discover new truths in Geometry’ (C.4)], right?2
Students: Yes.3
Teacher: I have put here [in the handout] what we have discovered here together4
step by step…what we have done in every step. [Explains some of the statements5
written on the handout] And in the end,what we have proven becomes a theorem.6
OK? It becomes something that is generally true and that no one can disprove7
it because you have given a very strong and convincing argument. Whatever8
[theorems] we have discovered I put them here in blue boxes, at the end of each9
discovery [I have written] which theorem it is. Some of these, most of them, will10
be in the book of the first Lyceum level, so when you will see them next year you11
will recognise them.12
Phase 4 - Free orientation: During the free orientation phase the students had to work onvarious tasks (TRIMID, QUADMID, IF-THEN) in which they had to make their own conjec-tures, and prove or reject them in order to establish a new theorem. The specific aims of eachof the tasks was explained in Table 5.3. Especially for the concepts of ‘proof’ and ‘proving’it was our aim to give to the students enough opportunities to practice with tasks in order tocompletely abandon empirical proof schemes in favor of deductive ones and to practice the con-cepts/processes which were explicated in the previous phase. The results of this phase, presentedin Table 7.14, show that the phase was successful.
102

7.4. The role of our teaching strategy: A qualitative analysis
Concept ‘Conjecture’
Phase 1 - Inquiry: The students were introduced through the first part of Task OPPANG (seeAppendix B.6) to the concept of a conjecture. This was achieved by asking students tomake theirown observations about a figure drawn by the teacher in order to formulate their own generalmathematical statements, for which they would later have to offer convincing arguments.
Phase 2 - DirectedOrientation: Tasks CHOOSING - Part2, BIS, and OPPANGwere used forthis phase. Students in these tasks were always asked to make their own conjectures. Studentsmanaged to do this rather successfully and they always managed to come up with conjecturesthat were actually theorems of Euclidean geometry. Here are some examples from the lessons.
Example 1: Transcript from lesson 2, after we had finished the discussion about the argumentsthe students gave the previous day for task QUAD.
Teacher: Let’s move on. From now on, I will not give you statements like this1
from the start. We will be drawing a figure, and will be making observations on it2
together, and this way we will be making our own statements. Some of themwill be3
correct, some of them will be wrong, we don’t know we will see. I will start easy,4
to see what you can do. We have two lines that are intersecting at a point [starting5
to talk about task OPPANG (B.6); the teacher had already drawn two intersecting6
lines on the board]. There are some relations that hold between the angles formed7
here.8
Students came up with the following conjectures:
1. The adjacent angles form 180°.
2. The opposing angles are equal.
3. The sum of all angles is 360°.
Example 2: Transcript from lesson 2, at the beginning of task BIS. Teacher has drawn Figure7.17 on the board. K∆1 is a bisector of angle AKB, andK∆2 is a bisector of angle BKΓ.
Figure 7.17: The figure used in Task BIS.
103
Chapter 7. Results
Teacher: Let’s see now. Like we did earlier, with the opposing angles that we1
observed some relations, we have to do with this one too. So the first thing that we2
do, is to observe the figure. Let’s see…let’s think about it for a moment. Do you3
see anything, a relation?4
Mary: All angles together are 180°.5
Teacher: Mary says that all angles together are 180°. Do you agree?6
Students: Yes.7
Teacher: This is easy, quick, right? Why? Because it is…8
Students: A straight line.9
Teacher: A straight line. We know this. Anything else?10
Katerina: We can say that, if we let’s say take one angle,∆1KΓ plus∆2KA they11
will make 90 [degrees].12
Teacher: Hmmm…[Expressing that it sounds interesting.]13
Nia: I also thought the same.14
Teacher: Did you [to all students] think the same?15
John: I did not understand what you said. [He was actually not paying attention,16
because he was busy drawing the figure in his sheet.]17
Sunny: Didn’t you understand that there is a right angle formed?18
[The teacher explains again. There is some discussion about the conjecture.]19
Teacher: So let’s see, the statement that we want to show, our hypothesis is that the20
bisectors are perpendicular to each other.21
John: How do we know that they are perpendicular?22
Teacher: We said, we made a hypothesis. Katerina said that these, and I say these23
ones also, will be 90°.24
We see from the above transcript (lines 5, 11, 14, 18) that the students were quite comfortablewith coming up with conjectures. And this was the case for all of the tasks that they had tocomplete. This was the evidence that the students were ready for the explication phase.
Phase 3 - Explication: The explication phase for this concept took place together with theexplication phase for ‘proof’ and ‘proving’ when the teacher discussed in class handout C.4(see earlier discussion).
Phase 4 - Free orientation: During this phase the students made more conjectures and theyseemed to be quite comfortable with them. This shows that the concept was grasped by themwell.
104

7.4. The role of our teaching strategy: A qualitative analysis
Concept ‘Counterexample’
Phase 1 - Inquiry: The inquiry phase of the concept of ‘counterexample’ coincides with thatof the concepts ‘proof’ and ‘proving’ which was presented earlier. During the discussion thattook place in our first lesson on the advantages and disadvantages of arguments, we talked aboutwhat would have happened if we found a triangle with sum of angles different than 180. Theanswer was that this would result in the rejection of the theorem, which is the idea behind acounterexample.
Phase 2 - Directed Orientation: Students in this phase had to work on Task TRIMID (seeAppendix B.10). First, Figure 7.18 was drawn by the teacher on the board and the students hadto make their own conjectures about the figure. Students had many ideas and soon the followingconjectures were written on the board:
Figure 7.18: The figure used in Task TRIMID.
1. KΛ//BΓ
2. KΛ = AΓ/2
3. KΛ = BΓ/2
4. KΛ = AB/2
Conjectures 1 and 3 are actually true for all triangles whereas conjectures 2 and 4 are onlytrue for specific triangles. Students did not know this in advance, and theywere asked to prove ordisprove the conjectures they had come up with. Each group had to do this for two conjectures,either 1 and 2, or 3 and 4. Below we see examples from a transcript of students’ group work.
John: So, and now thatKΛ = AΓ/2. We need to prove that this is half of that.1
Kelly: Or that it is wrong. It could be wrong.2
John: [To the teacher] Can we show that it is wrong?3
Kelly: Yes! It says it here!4
Flora: It doesn’t say…5
Kelly: But it says it here! […] Here! [Reading out the task instructions] Prove or6
reject.7
105

Chapter 7. Results
Teacher: Yes, if something is not right you will say why.8
[…]9
Flora: Yes, there, we know it isn’t and then we prove it. This one is 3 [cm] …and10
this I don’t think it is 3.11
[…]12
John: We will write that, by measuring them, it is wrong. Theoretically they can’t13
be right because bla bla bla…Did you get it?14
Flora: Or else we could write that we measure them and end of the story. But it is15
not convincing…16
John: Yes, that’s why. Bymeasuring them they turn out to be wrong. And therefore17
in order to prove it…18
Flora: So…19
John: So, we measure them and it is wrong.20
Kelly: But first we should know whether they are correct!21
Flora: Yes, I said that they are not correct.22
Kelly: Yes, but why, we did not measure it!23
Flora: We [her and John] measured it!24
John: We measured it.25
Flora: One is 3 and the other is …5?26
[…]27
Flora: So, wewill write that…wewill write two arguments. One is that wemeasure28
them…29
Kelly: And if we don’t know any other [argument] we will not write any other.30
John: Come on then, write the first one.31
Flora: Write that we measureKΛ and it is […] equal to 7 and AΓ equals 4.32
Kelly: But guys, we said for all figures!33
John: Eh, yes this is a small proof which if we make a mistake, if we don’t find34
[another one]…it is our alternative!35
Flora: [She is writing] Then…AΛ equals…36
Kelly: Therefore it does not hold.37
Flora: [She keeps writing] is equal to AΓ∆.38
John: We assume. That in order for it to be…in order for them to be equal it has to39
be either equilateral…ooohhhhh! There is a possibility for them to be equal!40
Flora: They are not.41
John: But there is a possibility.42
Kelly: Eh yes, but we are talking about this [figure]!43
106

7.4. The role of our teaching strategy: A qualitative analysis
John: Yes, that’s why though we depend on the figure […inaudible] if we do this44
one as well like that, bigger …again this will be the case, it will hold.45
Kelly: But…since it does not hold for this [figure] then why would it hold for46
another one…and even if it holds for a specific figure it is by chance! We cannot47
say that it holds.48
The struggles of these three students to figure out how they can accept or reject a conjectureare obvious in the above passage. They seem to think it is sensible to reject the conjecture justbecause it does not hold for their own figures, but then they feel that this would be an argumentwhich depends just on one figure. We had discussed during previous lessons that argumentswhich depend on a specific figure are not convincing and are not considered to be mathematicalproofs. However, we see that Kelly eventually discovers (lines 33, 37, 43, 46) that their argumentseems to be fine, since the fact that the conjecture might hold in certain figures could be justaccidental. Kelly here shows that she is ready for the explication phase. This was the case forother students as well (see for instance Example 4 during the discussion of our Stage 2).
Phase 3 - Explication: The explication phase for the concept of ‘counterexample’ came at theend of task TRIMID where the students had tried to prove or disprove the various conjectures.The teacher initiated the following discussion.
Teacher: Why isn’t this [KΛ = AΓ/2] correct?1
Thalia: Because it depends on the figure.2
Teacher: It depends on the figure you think?3
Thalia: Because we measure ours, in yours they were equal, but in mine it wasn’t4
equal…5
Katerina: So what does this mean?6
Thalia: …so since in some triangle it is not equal it means that it does not hold7
generally.8
Teacher: [To the whole class] Do you agree?9
Students: Yes.10
Teacher: Have you done the same? You [to a student] I think you told me you had11
done the same.12
Flora: Mine is probably equilateral so I was saying that it is equal. But…13
Teacher: But it is, you think, only for yours, right?14
Flora: Yes. That it does not hold for all triangles.15
Teacher: Let me draw another triangle.16
[Starts drawing one on the board and connects the midpoints of the two sides.]17
A student: I don’t think that it holds for all.18
Teacher: This should be equal to that. It is obvious that it isn’t the case. So, this19
means that this one here (the conjectureKΛ = AΓ/2) was supposed to be a general20
107
Chapter 7. Results
observation, but we discovered that it isn’t. Why? Because we found an example21
in which…22
Students: …It does not hold.23
Teacher: …it does not hold. OK? For this one? [Points at the conjecture KΛ =24
AB/2.] If this one here [points at KΛ] we measure it and then we measure that25
one [points at half of AB] do you think they are equal? So this observation that we26
did here …27
Student: Depends on the figure.28
Teacher: …it was only…we were misled by the figure. It [the observation] wasn’t29
general. What did we do? We found an example, one, which disproves it. That30
is, one example is enough in order to reject a conjecture. Whereas in order31
to verify and to prove something, in order to give a general argument, one32
example is not enough.33
Student: …it is not enough. [Agreeing with what the teacher just said.]34
Teacher: Do you understand the difference?35
Students: Yes.36
Teacher: For example we had said…I will give you another example. We had said37
that the sum of the angles of a triangle is 180°. And you told me, look, I will give38
you an example. [Draws a triangle on the board.] I am measuring them [the angles]39
I add them, and I get 180°. Was this…does it convince you?40
Students: No.41
Teacher: No. It was an example. But one example cannot prove the general. One42
example is not enough. If however you had found a triangle that was not 180°,43
which would be perfectly constructed, wouldn’t that be enough of an example to44
reject the general?45
Students: Yes.46
Teacher: Like here [shows the TRIMID example on the board]. One example was47
enough for rejecting this general observation that we had made. This is called48
‘counterexample’ because it is not exactly an example, it is an example that49
proves the opposite. [Writes the word on the board.] With a counterexample50
we can prove that this [the conjecture on the board] is rejected. OK. So you51
can see now that it is much more difficult to prove that something holds generally52
than to prove that it does not hold generally. And this is why it is more difficult53
to construct general theories in mathematics, because it is more difficult to find54
general arguments.55
In one of the last lessons, the students had to find an argument for the IF-THEN task (seeAppendix B.13). In this task an implication statement needed to be proven. After the statementwas proven, the teacher asked the students whether they thought the inverse would also hold.Most of them said that it would hold. The teacher then offered a counterexample for the inverseof the implication. The students were immediately convinced that now the inverse statementdoes not hold, and this shows that they had grasped the idea of a ‘counterexample’.
108

7.4. The role of our teaching strategy: A qualitative analysis
Phase 4 - Free orientation: We did not plan any task for the free orientation of the conceptof ‘counterexample’ because of the limited time we had.
Concepts ‘Axiom’, ‘Undefined term’ and ‘Axiomatic System’
Phase 1 - Inquiry: The teacher initiated a discussion regarding the previous knowledge thatstudents used in order to prove theorems in class at the end of the 5th lesson. This was thestarting point of the discussion on the 6th (and last) lesson.
Teacher: [Discussion at the end of lesson 5] And next time we will talk about, and1
it will be the last thing we will say…I have told you many times that what we have2
been proving is based on something that we took as a given. Have we ever proven3
anything without taking something else as a given?4
Students: No.5
Teacher: Always we needed something from before. And what we will search for6
next time is that, we will see together until what point we can go back. So, these7
mathematicians, where did they begin from to start proving things? For example8
Euclid who made geometry, where did he start from? Didn’t he need to take some-9
thing as a given?10
Student: [Euclid started] From zero.11
Teacher: How from zero? We will see how we can go backward, and what we can12
take as a given and what we cannot. OK? Next time.13
A lively discussion followed in the final lesson with contributions from many students re-garding where they think mathematicians begin from in order to prove their theorems.
Teacher: [Start of lesson 6 - last lesson of the intervention]So, now, all this time14
what have we been doing guys? We were trying to convince ourselves and others…15
Student: To find arguments.16
Teacher: To find arguments, for some observations that we had made, right? For17
some statements that we have observed…And what did we do for this? We were18
looking and looking and looking, and what were we using every time?19
Student: The things from before.20
Student: Our minds.21
Teacher: The things we knew from before, right? That is, some givens, and our22
minds, who said this [laughs], right? And we were trying to figure out what we23
know in order to see how we can prove what we want to know. And after we had24
been proving it, then we could consider it as a given, for the next task, because we25
now had a proof for it. Is this clear?26
Students: Yes.27
Teacher: Let’s see an example. We will not do anything new today. I mean, you28
will not be writing and solving, but we need to think what we have done so far.29
109
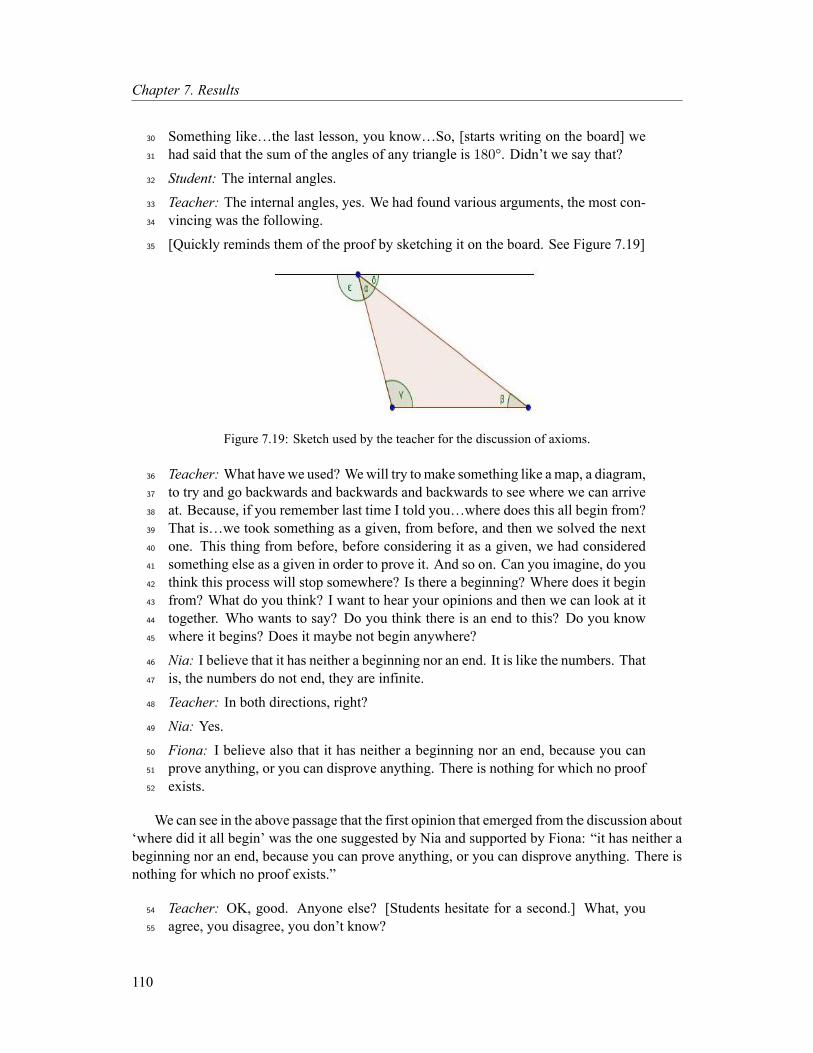
Chapter 7. Results
Something like…the last lesson, you know…So, [starts writing on the board] we30
had said that the sum of the angles of any triangle is 180°. Didn’t we say that?31
Student: The internal angles.32
Teacher: The internal angles, yes. We had found various arguments, the most con-33
vincing was the following.34
[Quickly reminds them of the proof by sketching it on the board. See Figure 7.19]35
Figure 7.19: Sketch used by the teacher for the discussion of axioms.
Teacher: What have we used? Wewill try tomake something like amap, a diagram,36
to try and go backwards and backwards and backwards to see where we can arrive37
at. Because, if you remember last time I told you…where does this all begin from?38
That is…we took something as a given, from before, and then we solved the next39
one. This thing from before, before considering it as a given, we had considered40
something else as a given in order to prove it. And so on. Can you imagine, do you41
think this process will stop somewhere? Is there a beginning? Where does it begin42
from? What do you think? I want to hear your opinions and then we can look at it43
together. Who wants to say? Do you think there is an end to this? Do you know44
where it begins? Does it maybe not begin anywhere?45
Nia: I believe that it has neither a beginning nor an end. It is like the numbers. That46
is, the numbers do not end, they are infinite.47
Teacher: In both directions, right?48
Nia: Yes.49
Fiona: I believe also that it has neither a beginning nor an end, because you can50
prove anything, or you can disprove anything. There is nothing for which no proof51
exists.52
We can see in the above passage that the first opinion that emerged from the discussion about‘where did it all begin’ was the one suggested by Nia and supported by Fiona: “it has neither abeginning nor an end, because you can prove anything, or you can disprove anything. There isnothing for which no proof exists.”
Teacher: OK, good. Anyone else? [Students hesitate for a second.] What, you54
agree, you disagree, you don’t know?55
110

7.4. The role of our teaching strategy: A qualitative analysis
Thalia: I think that we start from a hypothesis. And if this hypothesis helps us56
prove something, then we can take it as a given later.57
Teacher: So you are saying that we start from somewhere, it isn’t as Niaand Fiona58
said that there is no beginning and…59
Thalia: Everything starts somewhere.60
Teacher: Everything starts somewhere…Anyone else? Who do you agree with61
most. The first or the second opinion?62
[Some students say that they agree with both. Students start talking to each other.]63
Sunny: Isn’t there a middle one?64
Nia: [To Thalia] yes, but, what have you done to think of the hypothesis?65
Teacher: [To Thalia] What did you say? Repeat what you said before.66
Thalia: I say that everything has a beginning.67
Teacher: So there are some…68
Thalia: Everything starts somewhere.69
Teacher: …hypotheses at the beginning. Which we don’t prove, or do we prove70
them?71
Thalia: We don’t know if the hypothesis is true. It’s just a hypothesis. And if this72
hypothesis helps us prove something that we know, then we can take it as a given.73
And if we make many experiments with this hypothesis…then the hypothesis be-74
comes a given.75
We now see a different opinion emerging from the discussion, that of Thalia which was alsosupported by many others in the class: “We start from a hypothesis. And if this hypothesis helpsus prove something, then we can take it as a given later” (see lines 56, 57). Now the class startsdiscussing who is right or wrong, and the students who suggested the main two opinions startarguing with each other. More students join the discussion and offer their opinion.
Fiona: The thing is that when we are trying to prove something, we are not trying74
to show that this is it from the start, but to reject it. And if it is proven, it is proven,75
otherwise we reject it. Therefore, now, the hypothesis…76
Teacher: Yes, but, where does it start from, we say.77
Mary: I was also thinking that it all starts from a hypothesis. For example even78
when we want to talk, we talk for a reason. Everything has some reason. We cannot79
start from nowhere.80
Nia: I believe that, what Thalia said that we start from a hypothesis…Yes but what81
made her think this hypothesis?82
Thalia: This is a different issue.83
Nia: First she thought about it and then she made it. So there is no start.84
Theano: There is a start because the first thing you think about is to make the85
hypothesis! This is the start! So everything has a start!86
111
Chapter 7. Results
Nia: And how will you think to think to make the hypothesis? [Laughs]87
Teacher: [Talking to Theano] Yes but, didn’t we say that in order to make our88
hypothesis, and in order to take some things as givens in order to do the proof we89
have to have proven them first. Or, don’t we need to?90
Theano: No, we may be asked to prove it at that moment, and we can think…91
Teacher: Yeah, OK, I talk in general not in the classroom. Generally, in mathemat-92
ics, that is, what do mathematicians do?93
Theano: Eh, they started somehow!94
Kelly: Miss, can I say? When you say the mathematicians, for instance, the first95
person that thought about these lines and dots, what did he do?96
Teacher: Yes, this exactly! What did he do?97
John: A hypothesis. [Others agree.]98
Kelly: Exactly!99
Teacher: Did he make a hypothesis?100
Kelly: He didn’t start from some…from something that he had proven.101
Student: [He started] out of curiosity!102
Teacher: He made a hypothesis, and did he prove this hypothesis?103
Kelly: I mean that he did not start from something that is already known, from some104
givens, he simply started to make hypotheses.105
Teacher: And then did he prove them?106
Kelly: He proved them?107
Teacher: Using what?108
Kelly: Nothing! Did the first mathematician know anything from before?109
[Laughter.]110
Sue: Everything has a beginning, it can’t start from nowhere.111
[Students discuss loudly.]112
Fiona: Everything starts from an observation. You observe something. After the113
observation if you observe this more times, in your mind the hypothesis starts to be114
formed. ‘What if…’ Then you try to prove the hypothesis and this is the first given.115
Kelly: The other thing she said, what she [Fiona] said: “Everything starts from an116
observation.” So, there is a start.117
Fiona: They start from the previous hypothesis.118
[Students talk all together.]119
Olivia: [To Fiona] You disproved your own opinion.120
[Fiona says something but it is inaudible.]121
112

7.4. The role of our teaching strategy: A qualitative analysis
At this point the class arrived at a stage where they seemed ready for a directed discussionon how we can start from a specific proof and take a path backwards to see how far back we cango and discover whether there is a beginning or not. This is Stage 2, which will be discussed inwhat follows.
Phase 2 - Directed Orientation: The teacher starts directing a discussion of the proof of thestatement ‘the sum of the angles of a triangle is 180°’ by asking the students to think of all theprevious knowledge they had used to prove the statement.
Teacher: So, let’s look at it together. Let’s try and go backwards, to see…where122
will we arrive at? What did we use…before ending up with this [pointing at the123
statement ‘the sum of the angles of any triangle is 180°’ which is written on the124
board] right before, what did we use?125
Gregory: Supplementary angles.126
Teacher: Say this a bit differently, explain it. So, what does this mean? That…127
Gregory: Supplementary angles?128
Teacher: Yes.129
Gregory: That two angles form a sum of 180°.130
Teacher: Here we have three angles, that’s why I am asking you to explain it dif-131
ferently. They are not supplementary, what are these angles?132
Olivia: Adjacent.133
Teacher: What do they form? [Explains to Gregory that he just needs to say what134
holds in his own words not by using terminology.]135
Gregory: They have a sum of 180°.136
Teacher: That’s it. Why? Because this is?137
Students: A straight line.138
Teacher: So we used this. This is the definition of the line actually, let me write139
it…[Puts it on the board underneath the statement.] […] This we used as a given,140
right?141
Students: Yes.142
Teacher: What else did we use?143
Student: That alternate angles are equal.144
[The teacher writes this on the board.]145
We can see in the above discussion that the students could remember all the previous knowl-edge that was used in order to prove the statement ‘the sum of the angles of a triangle is 180°’(lines 136, 138, 144). The teacher then asks why this previous knowledge was taken as a given,trying to suggest that everything needs to be proven in mathematics.
113
Chapter 7. Results
Teacher: Why did we take these as givens guys?145
Students: Because we knew them, from before.146
Teacher: Did we prove these?147
Students: No.148
Sunny: What, do we also need to prove these?149
Student: The first mathematician proved them.150
Teacher: How did he prove them?151
[Many opinions are heard, one of which is that he measured them.]152
Teacher: But we said that measurements are not convincing. Measurements are153
only for verifying something, if you like. Let alone that we saw that measurements154
are not exact. So anyway they are only for us to get an idea, they are not for proving155
something. So?156
Gregory: We assumed they were givens.157
Teacher: We assumed they were givens? Did we start from these you think? What158
do you say?159
Gregory: From the observations.160
Sunny: Practically.161
karina: We took a straight line, and this line […]162
[The student is trying to prove why alternate angles are equal but fails. The teacher163
shows the proof and it is obvious that the proof is based on the definition of parallel164
lines.]165
Teacher: So this, we did not exactly consider it as a given. Actually we did [use166
it as given], but, it was itself a consequence of something else, the definition of167
parallel lines. [Puts the definition in the axiom map on the board.] So let’s see what168
is parallel? What is actually a straight line?169
[Students start talking about it.]170
After proving the previous knowledge that was used (here the fact that alternate angles areequal), the teacher started directing the students to think about undefined terms such as lineand point, and also about properties that we accept without proof (the axioms). The discussionbecomes a bit philosophical again as one can see below.
Katerina: It is many points in…169
Teacher: What is a line, we need to know what a line is. [Teacher draws in a box170
the world ‘straight line’ underneath the parallel lines box.]171
John: What is a point?172
Teacher: Yes! What is a point? Very good question!173
Sue: Can I say what a point is? It is the beginning of a line…174
Teacher: The beginning of a line? Anyone else?175
114

7.4. The role of our teaching strategy: A qualitative analysis
Theano: The beginning and the end of a line segment.176
Fiona: It is any point of a surface.177
Teacher: A ‘point’ is any ‘point’?178
Fiona: Well, I can’t say it with another word!179
Nia: A point is the beginning of a semi-line.4180
Teacher: OK.181
Kelly: A dot in infinity.182
Teacher: [Laughs] That’s a more philosophical opinion.183
Teacher: So guys, the ‘point’ has ‘tortured’ a lot of people. Euclid himself…, a184
definition of point does not even exist. Do you know how he says what a point is?185
It is that which has no dimensions. Can you imagine this?186
Debbie: It does have dimensions!187
Teacher: None!188
Students: It does have!189
Teacher: The fact that we are drawing it with the marker is a problem of the prac-190
tical process of taking a marker and drawing it. We cannot see it [the point] it is191
something that has no dimensions. Can your mind conceive this? So however many192
points you put next to each other they will not form a line.193
Students: Why?194
Teacher: Because the point does not have dimensions. How…?195
Debbie: But Miss if we take it this way there exist no lines either!196
Teacher: Line, as Euclid said it, is that which has only one dimension. Only in…197
John: length.198
Teacher: …length. It does not have any width at all. Nothing. Zero.199
Kelly: Like a thread.200
Teacher: Not even like that, because if a thread had no width we would not be201
able to see it. So these are abstract concepts. And another concept is the ‘surface’.202
Surface is that which has…203
John: Two dimensions!204
Teacher: …which has two dimensions. Very nice. So guys, these three are some205
hypotheses that Euclid made and he accepted them and this was it. It is the only206
three things in the form of definitions that he accepted and said, these I cannot207
prove. I take them as they are. And everything else is based on these. But there208
are also some other rules that he accepted. Let’s see now from here [points at the209
statement on the board ‘A straight angle forms 180°’] can we go backwards? What210
will be needed?211
4A line that has a starting point, but no end.
115

Chapter 7. Results
It is obvious in the last part of the above discussion that a directed orientation of the studentstowards the concept of undefined terms is attempted. This attempt did not come without reac-tions from the students. The first reaction came from Fiona, the student who at the beginningof the lesson suggested that all this “has neither a beginning nor an end, because you can proveanything, or you can disprove anything. There is nothing for which no proof exists”:
Fiona: Can I ask something? If those three we cannot prove them…we don’t211
know…we consider them givens, and in any case we don’t know if they are [cer-212
tain] because we can’t prove them, then is there a chance that simply all geometry213
is wrong? Whatever we have done so far to be wrong?214
Teacher: [Teacher smiles.] It is not wrong. What does wrong mean?215
Fiona: Not wrong, but, without a base!216
Teacher: No! Because we have a base!217
[The class becomes very noisy again. They tend to agree with Fiona.]218
Fiona: But we can’t prove these we just take them as givens. This means that219
whatever we have proven so far…220
Teacher: It could be wrong, but it isn’t, because we use these things for two and a221
half thousand years [smiles].222
Fiona: And what if for two and a half thousand years we have been wrong?223
Katerina: And if someone is born and he manages to prove them and they are not224
this way. Will the whole geometry change?225
Teacher: If he proves something else, then he can build a new geometry.226
Kelly: That’s why mathematicians get crazy…227
Teacher: And they have done this actually…228
Students: Who?229
Teacher: Some scientists have made their own hypotheses, and build a different230
system. Not the system of geometry, a different one.231
Nia: And is this system continued [today]?232
Teacher: Yes it is continued and it also has applications.233
We see in the above discussion that the students ask what would it mean if the axioms andundefined terms are wrong (since we have no proof for them), which seemed to worry them a lot.Katerina (line 224), asks a quite natural question: what if someone disproves the axioms? Thisquestion brings the opportunity to talk about different axiomatic systems that could be built on aselection of different axioms. It was the aim of our lessons to bring the students to the theoreticalVan Hiele level, where they are ready to understand that there exist different axiomatic systems(Van Hiele level 4).
After this the teacher tries to continue the directed orientation phase now for going back-wards starting from the same statement (‘the sum of the angles of any triangle is 180°’) buttaking a different route, by using one of the other proofs we gave for this statement.
116

7.4. The role of our teaching strategy: A qualitative analysis
Teacher: In any case, for this [points back to the statement on the board] we again234
need this kind of things. We need to start somewhere. But, the point is that we235
took a path to go backwards. If you had thought of a different proof, you could236
have taken a different path. But in the end you will probably end up with the same.237
For example let’s see what other proof we had found for this. [Draws the proof238
of Lefteris (see Appendix B.3).] Do you remember, with the external lines etc.?239
There, we did not use this [the alternate angles] we used something else. What?240
Student: The circle.241
Teacher: We had said that the angles, the internal with the external together make242
180°. But we had said something else too. Do you remember?243
Student: About the circle.244
Teacher: About the circle.245
Student: That it has 360°[inaudible].246
Teacher: Yes, we has said that the circle has 360°. [Writes it on the map.] Why?247
Who says this? What is a circle?248
Mary: Four right angles.249
Teacher: Four right angles! So we need also the definition of the circle, right?250
[Writes it on the map.] […] I can always draw a circle, taking as center a point,251
whatever point I want, and with radius whatever I want to. This we can always do.252
Why can we always do it? How are we sure?253
Students: It is certain!254
Teacher: It is certain, can you prove it? [John suggest something practical.] Yes255
but this is practical. With an argument like the ones we have been using, can you256
prove it?257
John: No.258
Fiona: What should we prove with an argument like the ones we have been using?259
Teacher: That I will always be able to bring a circle. Can you?260
Fiona: Yes!261
Teacher: How?262
[Students try to find a proof and make some suggestions.]263
Teacher: So, isn’t it very…? Don’t you think ‘it is true!’?264
Students: yes!265
The discussion led again to undefined terms and axioms. As expected, the students had prob-lems accepting the abstract definitions that the teacher was describing. We discussed all theseconcepts in a single lesson with the students, but we think that in order for them to understandthese concepts and the abstract nature of mathematics better, more time is needed. However,the time we had in our intervention was limited, so at this point the teacher attempted to start theexplication of the new concepts and this will be described in the following parts of the transcript.
117
Chapter 7. Results
Phase 3 - Explication: In this part of the discussion, the teacher explicates the concepts ‘ax-iom’ and ‘undefined term’ by giving a name to the experience the students just had (see lines267 and 271 below):
Teacher: What just happened to you is what happened to Euclid too. He said there!266
It seems obvious! This thing and many other statements he called ‘axioms’. Have267
you ever heard this word? [Writes it on the board.]268
Students: No. [Students said they have heard this word only in different contexts269
because in Greek it also means ‘rank’.]270
Teacher: And these ones are called ‘undefined terms’. These three.271
Fiona: The point, the line, and?272
Teacher: The surface, the point and the line.273
Fiona: These are the undefined terms…274
Teacher: Undefined terms. We don’t define them, what I told you is the explanation275
given by Euclid but you don’t need to define them. You begin from here.276
Fiona: And the axioms? Which are they, apart from the circle?277
Teacher: There are more axioms, I have prepared a list for your [see Appendix C.7]278
and you will see them. Another axiom for example is that from a point outside a279
line I can bring only one parallel [to that line]. How can you prove this?280
[Students give suggestions.]281
Teacher: Anyway, I don’t want you to do it now, you can try to prove it if you like.282
[Students want to prove it!]283
Teacher: Think about it and let me know next time if you have proven it.284
John: What will we win if we prove it?!285
The students were quite convinced that the axioms can and should be provenwhich is a rathernatural reaction. It was our aim to make the students discover that there exist some statements inmathematics which we accept without proof, and we expected them to react to this idea, whichwe think is evidence that they understood what this idea is about.
Phase 4 - Free orientation: The free orientation of these concepts was not realised in ourlessons. A plan for this phase could be to let the students follow the same ‘going backwards’process for other proofs that were discussed in the lessons, until they arrive at something theycannot prove, and also to ask them to find more than one path backwards. The time limitationsdid not allow as to realise our plans with our students, however we suggest that this phase isnecessary for the students to arrive at a complete understanding of the axiomatic system ofgeometry.
Phase 5 - Integration phase for all concepts
The integration phase for all concepts introduced in our lessons took place during the last partof the discussion, where the concepts of ‘axiom’, ‘undefined term’ and ‘axiomatic system’ were
118
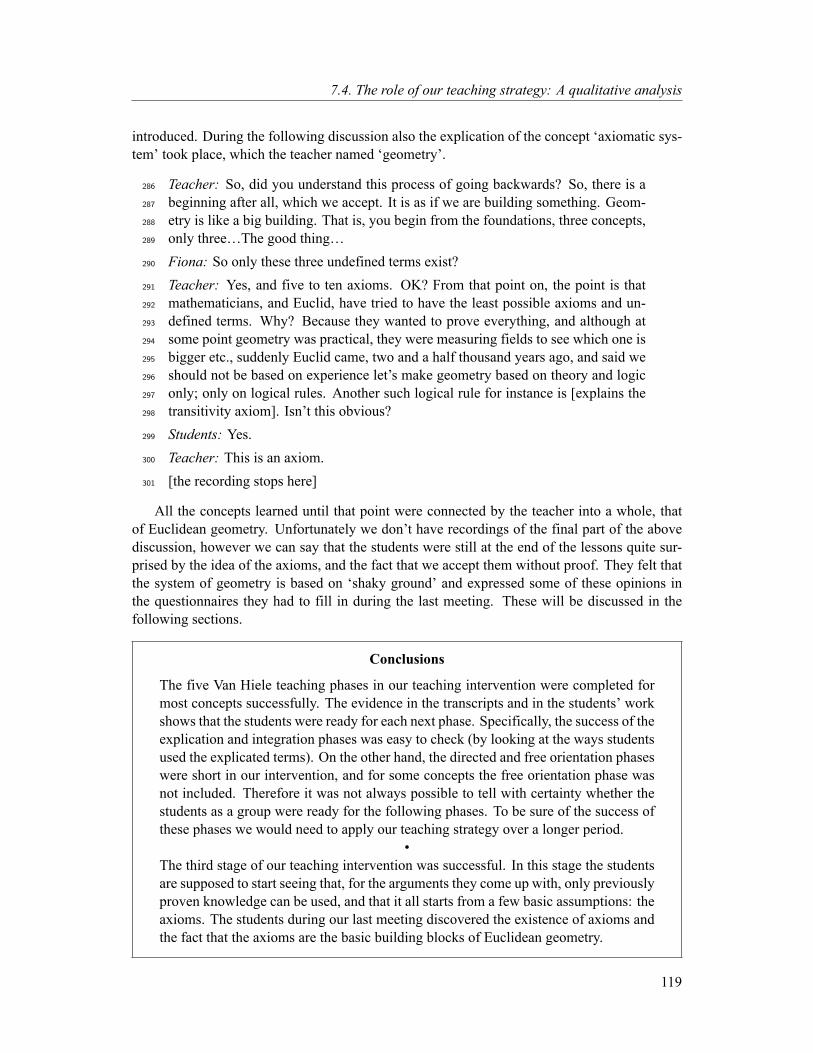
7.4. The role of our teaching strategy: A qualitative analysis
introduced. During the following discussion also the explication of the concept ‘axiomatic sys-tem’ took place, which the teacher named ‘geometry’.
Teacher: So, did you understand this process of going backwards? So, there is a286
beginning after all, which we accept. It is as if we are building something. Geom-287
etry is like a big building. That is, you begin from the foundations, three concepts,288
only three…The good thing…289
Fiona: So only these three undefined terms exist?290
Teacher: Yes, and five to ten axioms. OK? From that point on, the point is that291
mathematicians, and Euclid, have tried to have the least possible axioms and un-292
defined terms. Why? Because they wanted to prove everything, and although at293
some point geometry was practical, they were measuring fields to see which one is294
bigger etc., suddenly Euclid came, two and a half thousand years ago, and said we295
should not be based on experience let’s make geometry based on theory and logic296
only; only on logical rules. Another such logical rule for instance is [explains the297
transitivity axiom]. Isn’t this obvious?298
Students: Yes.299
Teacher: This is an axiom.300
[the recording stops here]301
All the concepts learned until that point were connected by the teacher into a whole, thatof Euclidean geometry. Unfortunately we don’t have recordings of the final part of the abovediscussion, however we can say that the students were still at the end of the lessons quite sur-prised by the idea of the axioms, and the fact that we accept them without proof. They felt thatthe system of geometry is based on ‘shaky ground’ and expressed some of these opinions inthe questionnaires they had to fill in during the last meeting. These will be discussed in thefollowing sections.
Conclusions
The five Van Hiele teaching phases in our teaching intervention were completed formost concepts successfully. The evidence in the transcripts and in the students’ workshows that the students were ready for each next phase. Specifically, the success of theexplication and integration phases was easy to check (by looking at the ways studentsused the explicated terms). On the other hand, the directed and free orientation phaseswere short in our intervention, and for some concepts the free orientation phase wasnot included. Therefore it was not always possible to tell with certainty whether thestudents as a group were ready for the following phases. To be sure of the success ofthese phases we would need to apply our teaching strategy over a longer period.
•The third stage of our teaching intervention was successful. In this stage the studentsare supposed to start seeing that, for the arguments they come up with, only previouslyproven knowledge can be used, and that it all starts from a few basic assumptions: theaxioms. The students during our last meeting discovered the existence of axioms andthe fact that the axioms are the basic building blocks of Euclidean geometry.
119

Chapter 7. Results
7.5 Students’ beliefs about mathematics and proof
Part of our research question was to examine how the kinds of reasoning used by students whendoing proofs in geometry relate to their beliefs about proof. As was described in Section 5.3.1,we planned to use a modified version of Schoenfeld’s questionnaire (1989) (see Appendix A.3)in order to check the beliefs of the students about mathematics and proof both before and afterthe intervention. In this modified version only the total number of items differs from the original,since we made a selection of those questions that were relevant to our study. The items chosenare worded in the same way as in the original version of the questionnaire, but are translatedinto Greek.
We also created and used our own questionnaire (see Appendix A.4) which aimed at findingout how the students perceive the change in their beliefs about mathematics and proof. Finally,we used certain questions in Task CHOOSING (see Appendix B.3) and Task CONCEPTIONSABOUT PROOF (see Appendix B.4) in order to find out the ideas of the students about theconvincingness, validity and explanatory power of certain types of arguments both before andafter our intervention. The results from these three questionnaires are presented in the threefollowing sections.
7.5.1 Modified Schoenfeld questionnaire results
The items in the modified questionnaire are divided in sections according to the aims of thequestions. We followed the categorisation suggested by Schoenfeld (1989). Thus, the items inthe first four categories of the modified version of the test were intended to reveal “students’perceptions of mathematics and school practice” (Schoenfeld, 1989, p. 342), the items in cate-gories 5 and 6 were intended to reveal students’ beliefs about the “nature of geometric proofs,reasoning, and constructions” (Schoenfeld, 1989, p. 342), and the items in the last category wereintended to offer to the students “an opportunity to present slightly more extended answers toissues of interest” (Schoenfeld, 1989, p. 342).
We will offer an analysis of the results in parallel with Schoenfeld’s analysis, in order to beable to make a comparison. We will also compare the answers students gave before and afterour intervention to the same items of the questionnaire.
Students’ beliefs about mathematics attitude (including geometry)
We will first discuss the answers of the students to items 1 (‘The math that I learn in school ismostly facts and procedures that have to be memorized’), 3 (‘The math that I learn in school isjust a way of thinking about space, numbers, and problems’) and 14 (‘The best way to do wellin math is to memorize all the formulas’), which reflect classroom practice. Below you see thepercentages of answers of the students for each item.
Totally agree Guess I agree Guess I disagree Totally disagreeItem 1 2 3 4 M
1 2 (10%) 6 (30%) 6 (30%) 6 (30%) 2.83 2 (10%) 10 (50%) 6 (30%) 2 (10%) 2.414 3 (15%) 7 (35%) 5 (25%) 5 (50%) 2.6
Table 7.15: Answers to classroom practice items before the intervention (n = 20).
120

7.5. Students’ beliefs about mathematics and proof
In Table 7.15 we see that there is a wide distribution of answers for all three items. Thestudents before our intervention generally disagreed (although not strongly) with the idea thatthe math they learn in school is mostly facts and procedures that have to be memorized (M =2.8) and with the idea (although again not strongly) that the best way to do well in math is tomemorize all the formulas (M = 2.6), as opposed to the students in the study of Schoenfeld(1989) where they mostly thought that memorization is really important. Moreover, the studentstended slightly towards agreeing that the math they learn in school is just a way of thinking aboutspace, numbers, and problems (M = 2.4).
Item 32 of our questionnaire, an open question about whether memorization in mathematicsis important or not, gives further evidence for the above. Out of the 15 students who gave ananswer, 9 mentioned that memorization is not important (‘In my opinion I think that the bestis not memorization but first of all to understand the rule and understand where you could useit. Because if you don’t understand you can’t solve the exercises’, ‘Very little because moreimportant is to understand it.’) and 2 of the 6 (33%) students who thought memorization isvery important, also mentioned that it is not enough on its own (‘I think that memorization isimportant but I believe that a student should first understand the theory and only then memorizeit because if he simply knows it and he has not understood it he will not be able to apply it’).
In Table 7.16 we can see the answers of the students for the same items after our intervention.
Totally agree Guess I agree Guess I disagree Totally disagreeItem 1 2 3 4 M
1 6 (30%) 5 (25%) 6 (30%) 3 (15%) 2.33 3 (15%) 9 (45%) 5 (25%) 3 (15%) 2.414 1 (5%) 3 (15%) 7 (35%) 9 (45%) 3.2
Table 7.16: Answers to ‘classroom practice’ questions after the intervention (n = 20).
Clearly, the students after the intervention had a much stronger disagreement with the state-ment (item 14) suggesting memorization as the best way to do well in math (M = 3.2). We alsosee that after experiencing the kind of mathematics we did in our intervention, they were gener-ally in agreement with the statement (item 1) that what they do in ordinary school mathematicsis mostly facts and procedures that have to be memorized. As for item 3, the students generallydid not change their opinion about what mathematics is (M = 2.4).
For item 32, the open question, the picture also changed slightly. The students who thoughtmemorizing was not important were now 12 out of 19 (63% rather than 60% before our inter-vention), but now 71% (rather than 33%) of the students who said memorizing was importantalso mentioned that it is not important on its own but you need to understand also what you aredoing.
We will now discuss the answers to items 2 (‘The math I learn in school is thought provok-ing’), 10 (‘In mathematics you can be creative and discover things by yourself’), 20 (‘When Ido a geometry proof I get a better understanding of mathematical thinking’), and 22 (‘When Ido a geometry proof I can discover things about geometry that I haven’t been taught’). All theseitems are related to the students’ perceptions of mathematics and geometry. In Tables 7.17 and7.18 the answers of the students before and after our intervention are presented.
We can see that, although generally the students both before and after the intervention agreewith the statement that the math they learn in school is thought provoking (item 2.0), the agree-ment before the intervention (M = 1.2) is much stronger than after the intervention (M = 2.0).
121

Chapter 7. Results
Totally agree Guess I agree Guess I disagree Totally disagreeItem 1 2 3 4 M
2 18 (90%) 2 (10%) 0 (0%) 0 (0%) 1.210 4 (20%) 9 (45%) 5 (25%) 2 (10%) 2.520 9 (45%) 8 (40%) 3 (15%) 0 (0%) 1.722 4 (20%) 15 (75%) 1 (5%) 0 (0%) 1.9
Table 7.17: Answers to questions related to students’ perceptions about mathematics and geometry beforethe intervention (n = 20).
Totally agree Guess I agree Guess I disagree Totally disagreeItem 1 2 3 4 M
2 8 (40%) 8 (40%) 2 (10%) 2 (10%) 2.010 6 (30%) 9 (45%) 4 (20%) 1 (5%) 2.020 7 (35%) 7 (35%) 5 (25%) 1 (5%) 2.022 6 (30%) 11 (55%) 3 (15%) 0 (0%) 1.9
Table 7.18: Answers to questions related to students’ perceptions about mathematics and geometry afterthe intervention (n = 20).
This may be explained by the fact that our lessons were quite different than the ordinary lessonsof the students, and the teacher often mentioned that in ordinary school-books some times themathematical statements are offered as givens, which the students are expected to accept withoutquestioning. Moreover, we see that the students were not always sure before the intervention(M = 2.5) whether in mathematics you can be creative and discover things on your own (item10), after the intervention the students tended to agree more (M = 2.0) although many of themstill were not totally convinced. The students’ ideas did not change much as to how a geometryproof helps them get a better understanding of mathematical thinking (M = 1.7 before, andM = 2.0 after the intervention) and did not change at all regarding the statement ‘When I do ageometry proof I can discover things about geometry that I haven’t been taught’.
Students’ beliefs about the nature of geometric proofs, reasoning, and constructions
In Tables 7.19 and 7.20 we see the distribution of the students’ answers, before and after ourintervention respectively, to items 18, 19, 21, 23, 24, 25 and 26 of the questionnaire. We willbriefly discuss these answers and the change in the distribution after our intervention.
Totally agree Guess I agree Guess I disagree Totally disagreeItem 1 2 3 4 M
18 5 (25%) 9 (45%) 5 (25%) 1 (5%) 2.119 8 (40%) 10 (50%) 2 (10%) 0 (0%) 1.721 0 (0%) 5 (25%) 8 (40%) 6 (30%) 3.123 1 (5%) 1 (5%) 3 (15%) 15 (75%) 3.624 12 (60%) 7 (35%) 0 (0%) 1 (5%) 1.525 2 (10%) 8 (40%) 7 (35%) 3 (15%) 2.626 4 (20%) 5 (25%) 11 (55%) 0 (0%) 2.4
Table 7.19: Answers to questions related to the nature of geometric proofs, reasoning and constructionsbefore the intervention (n = 20). (Note that for question 21, n = 19 since one student left it unanswered.)
122

7.5. Students’ beliefs about mathematics and proof
Totally agree Guess I agree Guess I disagree Totally disagreeItem 1 2 3 4 M
18 3 (15%) 9 (45%) 6 (30%) 2 (10%) 2.419 11 (55%) 7 (35%) 2 (10%) 0 (0%) 1.621 1 (5%) 4 (20%) 10 (50%) 5 (25%) 3.023 0 (5%) 3 (15%) 7 (35%) 10 (50%) 3.424 11 (55%) 8 (40%) 1 (5%) 0 (0%) 1.525 1 (5%) 7 (35%) 9 (45%) 3 (15%) 2.326 8 (40%) 7 (35%) 3 (15%) 2 (10%) 2.0
Table 7.20: Answers to questions related to the nature of geometric proofs, reasoning and constructionsafter the intervention (n = 20).
Item 18 (‘When I do a geometry proof I can only verify something a mathematician hasalready shown to be true’) was about the function of proof as establishing truth rather than assimply verification of something given. We see that the average of the answers before our in-tervention is 2.1 which indicates that the students generally agreed to this statement. After theintervention there was a small change of the average (M = 2.4) towards the direction of dis-agreement, however the change was small. We think that the item may have been interpreted bythe students not as it was intended by Schoenfeld. Obviously the intention of Schoenfeld was tocheck whether the students understand the difference between verification and proof. However,often the students prove things at school which someone has already proven in the past, so theyare simply re-proving them. It is quite probable that the students have not understood the differ-ence between the meanings of the words ‘verification’ and ‘proof’ and this could be the reasonwhy they agreed with the statement of item 18. This is one of the downsides of multiple choicequestions where we can never be sure what the student really understood by the question. Theresults for this question should therefore not be immediately interpreted as suggesting that thestudents think proof is verification. Because of the nature of this question, an interview with thestudents would be needed to clarify the meanings of the words used.
The students generally agreed to item 19 (‘When I do a geometry proof the key thing is toget the statements and reasons in proper form’) both before and after our intervention. However,in our research this question has a different significance to that of Schoenfeld (1989) where theteaching of goemetrical proof emphasises very much the form of the written proof—proofs haveto be written in two columns, one including the statements and the other including the reasonsfor the statements. Therefore, we believe that the answers to this item indicate that the studentsfeel a need for writing down the arguments in a proof in a proper, mathematical form for themto be understood.
Regarding item 21 (‘When I do a geometry proof I’m finished if I can’t remember the nextstep’) the students rather clearly disagreed both before (M = 3.1) and after (M = 3.0) ourintervention. This indicates that the way these students think in mathematics is not tied to algo-rithims, rather they are used to thinking of various routes which may lead to the desired answer.
For item 23 (‘When I do a geometry proof I’m doing school math that has nothing to do withthe real world’) the students on average (strongly) disagreed both before (M = 3.6) and after(M = 3.4) our intervention. This indicates that the students already thought that geometricalproofs have a connection to the real world and this belief was not affected by our intervention.Item 24 was similar, related to the usefulness of geometrical proofs (‘When I do a geometryproof I feel like I am doing something useful’). The results indicate that the students both before
123
Chapter 7. Results
(M = 1.5) and after (M = 1.5) our intervention clearly agreed with this statement. Items 25and 26 were related to geometrical constructions, which were not included in our intervention,therefore the results are not relevant to our study and will not be discussed here.
Because the nature of the questions in Schoenfeld’s questionnaire did not cover the scope ofour research we had prepared other questionnaires to be filled out by the students. These resultswill be discussed in the following sections.
Conclusions
Beliefs about math in general: The students after the intervention had a much strongerdisagreement with the statement suggesting memorization as the best way to do wellin math. Moreover, they were generally in agreement with the statement that whatthey do in ordinary school mathematics is mostly facts and procedures that have tobe memorized. This could be interpreted as an effect of our teaching intervention inwhich we stressed that geometry is something different that what is usually taught inschool, that is, not simply applying a procedure to prove something which was givenby the book or the teacher, but rather geometry is an ongoing process of observing,conjecturing, and finding valid arguments to support or reject your conjectures.
•Beliefs about geometry and proof: The students’ answers to the items of the modifiedSchoenfeld questionnaire regarding geometrical proofs did not change significantlyafter our intervention. These items were mainly related to rather general aspects ofproof and were not immediately connected with the ideas of validity and generalityof arguments. Therefore, the fact that the opinions of the students on these specificaspects of geometry and proof did not change after our intervention is not surprising.In our intervention we focused mainly on the steps of proving and on what exactly itmeans to prove in mathematics.
7.5.2 Students’ own ideas on how their beliefs changed
At the end of our intervention the students had to fill in a questionnaire (see Appendix A.4),which included seven questions related to their opinion about the lessons and what they learned,as well as their beliefs about mathematics and proof. We will discuss here the answers of thestudents to those questions related to their beliefs about proof and mathematics. The rest of theanswers are presented in Appendix D.4.
Q5: Do you believe that the lessons have affected your way of thinking? If yes, how?
We asked this question in order to find out how the students think about the ways—if any—theirthinking has changed during this lesson. We understand that this meta-question is not easy toanswer and that the students’ understanding of how their own thinking has changed might berather difficult to identify. Therefore we expected that many students would have difficultiesanswering this question.
We found that only 1 out of 20 students did not answer positively (her answer was ‘Maybe’),and 5 out of 20 students did not give any specific answer as to how the lessons affected their
124

7.5. Students’ beliefs about mathematics and proof
thinking although 19 of them stated that the lessons did in fact affect it in ‘some’ way. Beloware the categories that we identified in the students’ answers.
• Category 1: VagueFive students did not give a specific explanation on how their thinking changed.
Yes they affected me positively.
Yes, in a way. In fact I cannot judge this.
• Category 2: Don’t accept givens without proofFive students perceived a change in their thinking about mathematical statements. Theyclaimed that, because of the lessons, they had adopted a new, more critical, attitude to-wards what was offered to them as a ‘given’; they would now think about why a statementis true and would not be immediately convinced without having a proof for it.
Yes, because now I am thinking of all the reasons why something which I findready has been proven.
Yes, because now I don’t accept anything as a given if I don’t prove it first.
I think yes, because while until now I have been solving the problems as ifthey were something given, now I look for all the given elements and all thepossible solutions.
• Category 3: Discovering new thingsTwo students claimed that they were now able to make new discoveries, since they hadexperienced how to do this in the lessons.
Yes I believe it. They affected my way of thinking positively. That is, now Iget more concerned about something that I have to solve (proof) and I don’trestrict myself to the things I already know and as a consequence I can discovermore things.
Yes, they affected my way of thinking. I learned how to discover new thingsbased on what I already know.
• Category 4: Better (structured) thinking / Strategy / MethodSeven students mentioned that now their thinking was better and more structured, andoften they connected this with knowing the steps they need to take (the method) in orderto arrive at a result in geometry.
125
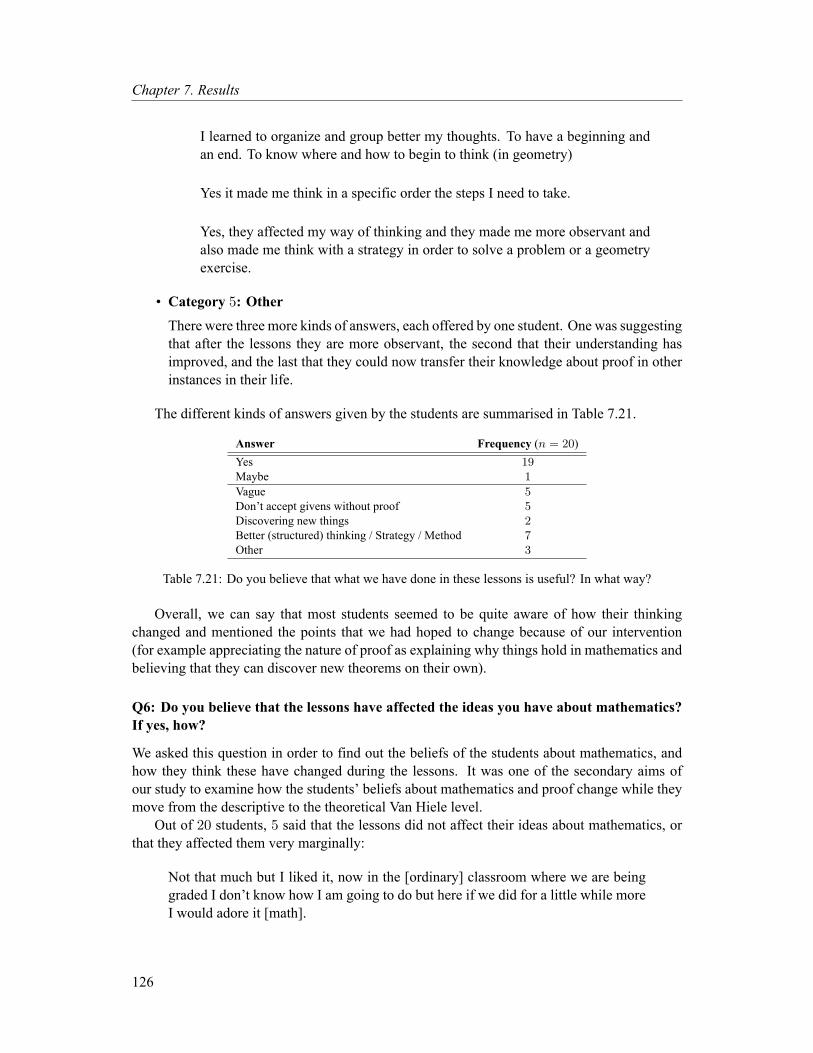
Chapter 7. Results
I learned to organize and group better my thoughts. To have a beginning andan end. To know where and how to begin to think (in geometry)
Yes it made me think in a specific order the steps I need to take.
Yes, they affected my way of thinking and they made me more observant andalso made me think with a strategy in order to solve a problem or a geometryexercise.
• Category 5: OtherThere were three more kinds of answers, each offered by one student. One was suggestingthat after the lessons they are more observant, the second that their understanding hasimproved, and the last that they could now transfer their knowledge about proof in otherinstances in their life.
The different kinds of answers given by the students are summarised in Table 7.21.
Answer Frequency (n = 20)Yes 19Maybe 1
Vague 5Don’t accept givens without proof 5Discovering new things 2Better (structured) thinking / Strategy / Method 7Other 3
Table 7.21: Do you believe that what we have done in these lessons is useful? In what way?
Overall, we can say that most students seemed to be quite aware of how their thinkingchanged and mentioned the points that we had hoped to change because of our intervention(for example appreciating the nature of proof as explaining why things hold in mathematics andbelieving that they can discover new theorems on their own).
Q6: Do you believe that the lessons have affected the ideas you have about mathematics?If yes, how?
We asked this question in order to find out the beliefs of the students about mathematics, andhow they think these have changed during the lessons. It was one of the secondary aims ofour study to examine how the students’ beliefs about mathematics and proof change while theymove from the descriptive to the theoretical Van Hiele level.
Out of 20 students, 5 said that the lessons did not affect their ideas about mathematics, orthat they affected them very marginally:
Not that much but I liked it, now in the [ordinary] classroom where we are beinggraded I don’t know how I am going to do but here if we did for a little while moreI would adore it [math].
126
7.5. Students’ beliefs about mathematics and proof
Basically not that much…I never liked mathematics…But now it is somehow bet-ter…
No, they did not affect it, since mathematics was always an interesting lesson.
Out of 20 students, 15 said that the lessons did affect their idea about mathematics. Belowyou can see the categories we identified in their answers.
• Category 1: Better / more interesting / funSix students thought that after these lessons their ideas about mathematics has improved,but they gave quite vague answers as to how exactly they changed.
They made it even better. Mathematics is my favourite subject.
Yes I started liking it more and I consider it to be a great science.
Yes, now geometry seems to me much more interesting, but also more under-standable.
• Category 2: More difficult / requires more thinkingThree students claimed that mathematics seems to them more difficult than they thoughtbefore.
Yes they affected me. It [math] is a bit more difficult to me.
I found out that mathematics requires more thinking after all.
Yes…it is more difficult than what I thought.
• Category 3: It requires more timeTwo students mentioned that in order to solve a problem you need more time than whatthey had thought at the beginning.
They affected the idea I have about mathematics. In the beginning I believedthat you don’t need to be involved for too long in order to solve something. Isimply knew that this holds and according to this I used to find the rest withoutlooking for the reasons why this holds. I believed that mathematics was justcalculations, but after all it is not like that.
• Category 4: Has a ‘shaky’ beginning; the axiomsThree students mentioned that now they knew that mathematics has a beginning. A coupleof them mentioned specifically the idea of the axioms and expressed their worries that,since the axioms are not proven, the whole of geometry might be wrong.
127
Chapter 7. Results
Yes because I didn’t believe that mathematics have a beginning and they startfrom somewhere. However this attracted my attention.
Yes. Because there are things which we could not prove (axioms) but still weare based on these and we ‘take it as right and if they are wrong maybe thewhole geometry is wrong.
Yes. Now I believe that all that which we learn from the elementary schooluntil now might not hold at all (concept of point)5!!
• Category 5: OtherIn this last categorywe have the following answersmentioned one time each: mathematicsis not just givens without reasons, mathematics can be done cooperatively, mathematicsrequires imagination, is easy, and is not just calculations.
The different kinds of answers given by the students are summarised in Table 7.22.
Answer Frequency (n = 20)Yes 15No 5
Better / more interesting / fun 6More difficult / requires more thinking/time 5Has a ‘shaky’ beginning (the axioms) 3Is not just givens without reasons 1Can be done cooperatively 1Requires imagination 1Is easy 1Is not just calculations 1
Table 7.22: Do you believe that the lessons have affected the ideas you have about mathematics? If yes,how?
We can see from the above that the students generally thought the lessons affected theirbeliefs about mathematics, and they offered a plethora of ways in which they believe this hashappened.
Q7: Do you believe that the lessons affected the ideas you have about proof? If yes, how?
We asked this last question in order to find out the beliefs of the students about proof, and howthey think these changed during the lessons. Only three students gave a negative answer to theabove question, two of which also provided an explanation.
It hasn’t changed. All mathematics need a proof therefore I don’t believe they havechanged it.
No. The idea about proof cannot change from one day to the next.5Here the student refers to the discussions we had in class about the fact that the definitions of point and line,
which are the undefined terms, were accepted without proof.
128
7.5. Students’ beliefs about mathematics and proof
The remaining 17 out of a total of 20 students said that the lessons affected the ideas theyhad about proof in one way or another. In the answers offered by the students on ‘how’ theirideas changed about proof, we could identify the following categories.
• Category 1: Proof is important
Yes. Now I believe that proof is important.
I learned that proof is very important for the geometrical concepts.
• Category 2: Proof is useful
They are more difficult than I thought and also more useful.
• Category 3: Proof can explain
It affected it. In the past, I did not look for what I was given, however nowI am trying to find how the given from an assumption becamewhat it is (given).
Yes because I didn’t know how to prove and I couldn’t explain many thingsbut now it helps me a lot.
• Category 4: Proof can be flexible (many different ways of proving the same thing).
Maybe yes. While I did not consider it that important and I considered it some-thing given which I learn by heart, I realized that there are many different waysto prove something.
• Category 5: Proof is difficult to do
They [proofs] are more difficult than I thought and also more useful.
What I have learned from the lessons about proof is that after all it is not thateasy to find, therefore indeed they affected me regarding the idea I had aboutproof.
Yes they affected the idea I have about proof. Now I believe that after all it isnot that easy to do a proof and that you have to search enough in order to findthe right answer.
• Category 6: Proof is easy and/or fun
I don’t know, maybe. I guess yes. At school I found it somehow difficult buthere it was somehow easier. And I liked to prove while at school it is some-how…
129

Chapter 7. Results
Yes, because proof now is not just a make-work but it has become really inter-esting and it helps me very much in understanding absolutely the knowledgethat I already have and to assimilate in an easier way the new elements.
They made me realise that it is not too difficult to prove something as it seemedin the beginning.
• Category 7: Proof is not only for mathematicians
Yes, because in the past I used to believe that proof has been made by very‘smart’ important people and that it is impossible that we students understandit. But after all it is a fun, easy procedure based on our knowledge.
Some of the students mentioned the fact that now they have learned how to prove and there-fore they can understand it better than before as being the only change.
Yes it affected me I can say enough…because I had not understood it very well atschool…But now I have understood it perfectly.
Yes because before I did not know how exactly proof is made.
Basically, I never had asked myself what proof is and how we arrive to there, there-fore certainly they changed my previous idea!
The different kinds of answers given by the students are summarised in Table 7.23.
Answer Frequency (n = 20)Yes 17No 3
Important 2Useful 1Can explain 2Difficult to do 3Easy/fun 3Not only for mathematicians 1
Table 7.23: Do you believe that the lessons have affected the ideas you have about proof? If yes, how?
We can see that the students offered plenty of examples on how their beliefs about proofchanged. We believe this change is a consequence of our lessons since the students had not beenintroduced formally to proof in the past. Moreover, the way the lessons were set up offered tothe students ample opportunities to experiment with making their own conjectures, coming upwith their own arguments and discussing how well their arguments (or their peers’ arguments)explain why the conjectures are true or not. This may have contributed to a deeper understandingof many aspects of proof and led to a change in the students’ earlier ideas about proof.
130

7.5. Students’ beliefs about mathematics and proof
Conclusions
In the answers of students, we could identify a change in the beliefs of students aboutproof and mathematics. More specifically:
•Regarding proof: The students after our intervention seem to have appreciated thenature of proof as explaining why things hold in mathematics and they have startedbelieving that they can prove theorems on their own. In 17 out of 20 cases, the studentsthought that their beliefs about proof had changed after the intervention, in the waysmentioned in Table 7.23.
•Regarding mathematics: The students generally thought the lessons affected their be-liefs about mathematics in the ways mentioned in Table 7.22.
7.5.3 Students’ understanding of the validity, convincingness and generality ofarguments
As explained in Section 5.2.1, following the study of Hoyles and Healy (2007) we asked certainquestions to the students before and after our intervention in order to find out their understandingof the validity, convincingness and generality of an argument in mathematics and how this wasaffected by our intervention. This would contribute to answering the part of our research ques-tion referring to the way different kinds of students’ reasoning relate to their ideas about proof.Along these lines we, like Hoyles and Healy, also looked at which argument (out of a givennumber of arguments) the students would choose as their own approach as well as the extentto which they thought this argument would be the one that receives the best mark by a teacher.Here we present the results of our study regarding these issues and we compare them, wheneverpossible, to those presented by Hoyles and Healy (2007) and Healy and Hoyles (1998).
In Table 7.24 we present the distribution of the students’ responses to the first four questionsin Task CHOOSING before our intervention, and in Table 7.25 those after our intervention.Note that some of the students chose more than one argument for their answer. To make thecomparison to the results of Hoyles and Healy (2007) easier, we included the ‘names’ of thearguments as used both in Hoyles and Healy’s research (in the tables they show in brackets) andin our research. The detailed proofs and the questions can be seen in Appendix B.3.
Arguments chosen (before) / N = 19
Eleni Georgia Petros Stamatis Lefteris Tania Kalliopi No answer(Amanda) (Cynthia) (Barry) (Dylan) (Ewan) (Yorath) /other
Criterion for Choice N % N % N % N % N % N % N % N %Own approach 8 42 3 16 2 10 3 16 2 10 0 0 1 5 0 0Best mark 2 10 4 21 4 21 1 5 2 10 1 5 2 10 2 10Most convincing 4 21 3 16 2 10 2 10 4 21 0 0 4 21 1 5Easiest to understand 9 47 4 21 2 10 4 21 9 47 0 0 0 0 1 5Most difficult to und. 0 0 0 0 0 0 0 0 0 0 2 10 12 63 2 10
Table 7.24: Distribution of arguments chosen in Task CHOOSING before the intervention.
131

Chapter 7. Results
Arguments chosen (after) / N = 19
Eleni Georgia Petros Stamatis Lefteris Tania Kalliopi No answer(Amanda) (Cynthia) (Barry) (Dylan) (Ewan) (Yorath) /other
Criterion for Choice N % N % N % N % N % N % N % N %Own approach 1 5 13 68 0 0 1 5 5 26 1 5 1 5 0 0Best mark 1 5 10 53 3 16 0 0 5 26 1 5 2 10 2 10Most convincing 0 0 16 84 0 0 1 5 5 26 0 0 0 0 0 0Easiest to understand 6 32 10 53 0 0 2 10 1 5 0 0 0 0 1 5Most difficult to und. 0 0 0 0 0 0 0 0 3 16 2 10 16 84 0 0
Table 7.25: Distribution of arguments chosen in Task CHOOSING after the intervention.
Own approach against best mark In Task CHOOSING the students were asked to chooseamong a pool of four arguments proving the statement ‘the sum of the angles of a triangle is180°’ the one that they thought matches best their own approach, and the one that they thoughtwould receive the best mark. The names of the four arguments along with a short description ofthe type of arguments included in this task is offered in Table 7.26.
Name TypeEleni’s (Amanda’s) inductive, practicalPetros’s (Barry’s) incorrect, theoretical (formal)Georgia’s (Cynthia’s) deductive, theoretical (formal)Stamatis’s (Dylan’s) inductive, practicalLefteris’s (Ewan’s) deductive, narrativeTania’s (Yorath’s) deductive, practicalKalliopi’s deductive, narrative
Table 7.26: Types of arguments in Task CHOOSING.
In Figure 7.20 (see also Table 7.24) we can see that before our intervention the students mostfrequently (8 out of 19, or 42%) chose Eleni’s (Amanda’s) argument as their own approach,something which was expected since the students at that stage were mainly familiar only withinductive proofs of this kind. However, it is interesting to note that only 2 students (10%) chosethis approach as the one which would get the best mark. This may be due to the fact that thestudents perceive the practicality of this argument and the fact that it does not include manymath symbols as an indication that it is not a ‘mathematical’ enough argument to receive thebest grade. Similarly, whereas 3 students (16%) chose Stamatis’s (Dylan’s) argument—anotherinductive, practical argument—as their own approach, only 1 student (5%) chose it as the onewhich would get the best mark. In short, before the intervention 11 students (more than half ofthe sample) chose an inductive, pragmatic argument as their own approach, and only 3 students(17%) thought that such an argument would get the best mark.
This result is similar to the findings of Hoyles and Healy (2007, p. 110) where the twoempirical arguments were chosen as own approach by 46% of the students, whereas only 9%of the students thought these arguments would get the best mark. In fact, we see that at thebeginning of our intervention there is no strong preference of the students on which proof wouldget the best mark and their choices are rather evenly spread over all answers (although there isa slight preference for best mark for the two formal arguments, Georgia’s and Petros’s—21%each). This can be explained by the level of the students in geometry at that stage; the studentswere not familiar with the distinctions between different kinds of arguments. This result is
132
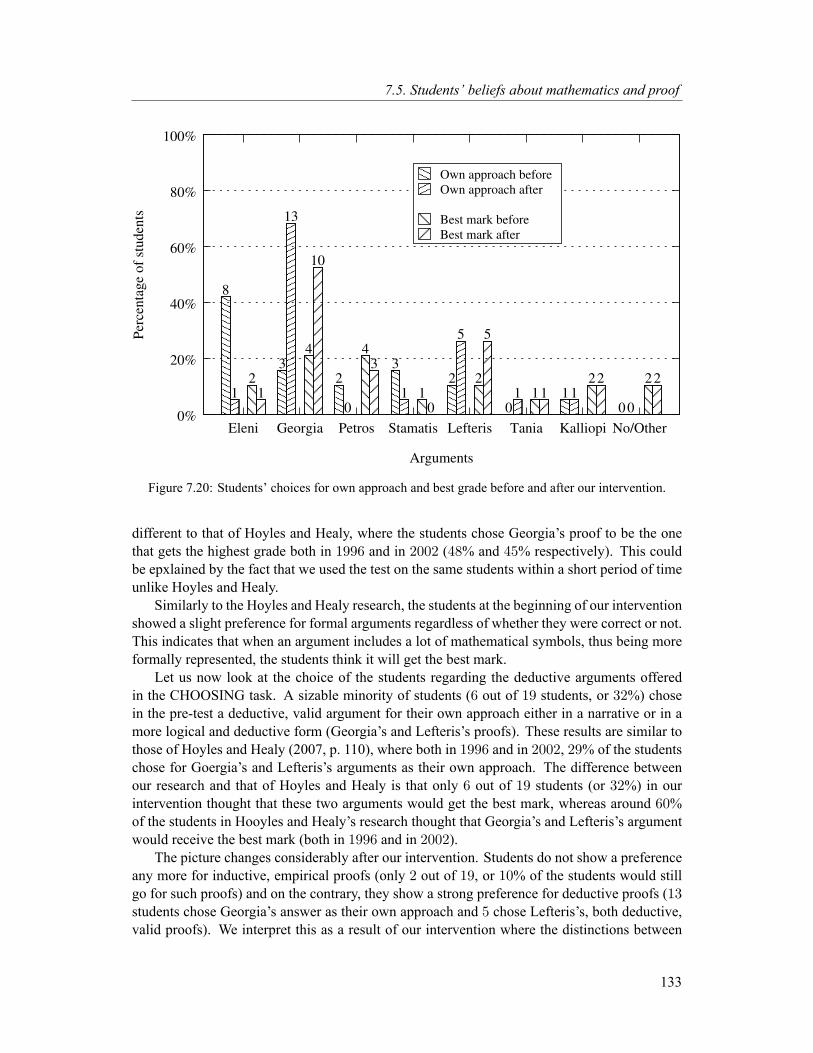
7.5. Students’ beliefs about mathematics and proof
������������
������������
��������
��������
���
���
��������
��������
���
���
�� ������
������
����������
������
�����������������
�����������������
�� ������
������
����������������
����������������
���
���
���
���
������ �� �� ���� ���� ���� �� ������������
��������
��������
����
����
����
������������
��������
����
��������
�������
�������
��������
�� ����������
����������
����
��������
����
��������
����
��������
����
0%
20%
40%
60%
80%
100%
Eleni Georgia Petros Stamatis Lefteris Tania Kalliopi No/Other
Per
centa
ge
of
studen
ts
Arguments
8
32
32
01
01
13
01
5
1 10
2
4 4
12
12 2
1
10
3
0
5
12 2
Own approach before
Own approach after
Best mark before
Best mark after
Figure 7.20: Students’ choices for own approach and best grade before and after our intervention.
different to that of Hoyles and Healy, where the students chose Georgia’s proof to be the onethat gets the highest grade both in 1996 and in 2002 (48% and 45% respectively). This couldbe epxlained by the fact that we used the test on the same students within a short period of timeunlike Hoyles and Healy.
Similarly to the Hoyles and Healy research, the students at the beginning of our interventionshowed a slight preference for formal arguments regardless of whether they were correct or not.This indicates that when an argument includes a lot of mathematical symbols, thus being moreformally represented, the students think it will get the best mark.
Let us now look at the choice of the students regarding the deductive arguments offeredin the CHOOSING task. A sizable minority of students (6 out of 19 students, or 32%) chosein the pre-test a deductive, valid argument for their own approach either in a narrative or in amore logical and deductive form (Georgia’s and Lefteris’s proofs). These results are similar tothose of Hoyles and Healy (2007, p. 110), where both in 1996 and in 2002, 29% of the studentschose for Goergia’s and Lefteris’s arguments as their own approach. The difference betweenour research and that of Hoyles and Healy is that only 6 out of 19 students (or 32%) in ourintervention thought that these two arguments would get the best mark, whereas around 60%of the students in Hooyles and Healy’s research thought that Georgia’s and Lefteris’s argumentwould receive the best mark (both in 1996 and in 2002).
The picture changes considerably after our intervention. Students do not show a preferenceany more for inductive, empirical proofs (only 2 out of 19, or 10% of the students would stillgo for such proofs) and on the contrary, they show a strong preference for deductive proofs (13students chose Georgia’s answer as their own approach and 5 chose Lefteris’s, both deductive,valid proofs). We interpret this as a result of our intervention where the distinctions between
133

Chapter 7. Results
deductive and inductive arguments were made clear and deductive arguments were now con-sidered ‘mathematical’ as opposed to inductive arguments. Moreover, the fact that we used thesame task before and after our intervention does not allow us to be certain as to what causedthis change based solely on this questionnaire. It is possible that the students made their choiceafter the intervention by remembering the discussion of the arguments in class, rather than un-derstanding the sattle distinctions between deductive and inductive arguments. However, theresults discussed earlier (see Table 7.14 on page 99) showed that the students displayed a pref-erence towards deductive proofs also in earlier tasks which were unfamiliar to the students.
Convincingness and difficulty of arguments In Table 7.24 we see that before our interven-tion there is no single argument that the majority of the students finds more convincing, althoughwe see that the three most ‘popular’ arguments are Eleni’s, Lefteris’s and Kalliopi’s with 4 stu-dents choosing each of these arguments. All these arguments have a practical element to them,therefore this result is not unexpected given that the students were not introduced to theoretical,deductive proofs at that stage. After our intervention these results are considerably different. Itis clear that now Georgia’s answer is the most convincing for the majority of the students (16out of 19) and second most convincing is Lefteris’s answer with 5 out of 19 students choosingit. The two inductive, practical arguments were selected only by 1 student who chose Stamatis’sanswer as the most convincing.
Even after the intervention Kalliopi’s argument remained the most difficult to understand.Overall, we can say that whereas the easiest arguments to understand before the interventionwere only the inductive, empirical ones (the ones familiar to the students), after the interventionthe deductive argument of Georgia is also an easy argument to understand (together with thetwo inductive ones).
Validity Rating and Explanatory Power of arguments In this section we present the resultsregarding the Validity Rating (VR) and the Explanatory Power (EP) of four of the argumentsincluded in the Task CHOOSING (see Appendix B.3): Stamatis’s, Georgia’s, Lefteris’s andKalliopi’s. We followed the rating method used by Hoyles and Healy (2007, p. 87) which wewill briefly explain here.
The students were given the following two statements relevant to the validity of the fourarguments,
• the argument shows that the statement is always true
• the argument only shows that the statement is true for some triangles
and were asked to choose one of three options for each question: ‘I agree’, ‘I disagree’, or‘I don’t know.’
The Validity Rating (VR) of each of the four arguments was calculated as explained in Table7.27.
The students were also given the following two statements relevant to the explanatory powerof the four arguments:
• the argument shows why the statement is true
• the argument is an easy way to explain to someone in your class who is unsure
134

7.5. Students’ beliefs about mathematics and proof
Student’s choice Scoreassessing correctly both statements 2assessing correctly one statement 1assessing wrongly both statements 0
Table 7.27: Valitidy Ratings (VR) scoring scheme.
and again were asked to choose one of three options for each question: ‘I agree’, ‘I disagree’,or ‘I don’t know.’
The Explanatory Power (EP) of each of the four arguments was calculated as explained inTable 7.28.
Student’s choice Scoreagreeing with both statements 2agreeing with one statement 1disagreeing with both statements 0
Table 7.28: Explanatory Power (EP) scoring scheme.
The detailed distributions of the answers given by the students to the above questions bothbefore and after our intervention as well as the VR’s and EP’s of each argument are offered inAppendix D. Here we offer an overview of the results (see Figures 7.21, 7.22, 7.23 and 7.24).
����������������������������������
����������������������������������
��������������
��������������
���������������������������������������
���������������������������������������
��������������������������������������������
��������������������������������������������
��������������
��������������
���������
���������
��������
��������
����������
������
���������������������������������������������������
���������������������������������������������������
������������������
������������������
������������
������������
��
����
����
0%
20%
40%
60%
80%
100%
Stamatis Georgia Lefteris Kalliopi
Per
centa
ge
of
studen
ts
Arguments
13
4
9
16
4
23
0
2
13
7
3
VR = 0
VR = 1
VR = 2
Figure 7.21: Validity Ratings of four arguments before our intervention.
Aswe can see in figures 7.21 and 7.22, the validity ratings for three out of the four argumentswere much higher after our intervention (note that when for an argument the right bar in the bargraph is high—there are many 2 scores—it suggest that the students could assess correctly thevalidity of the argument, whether the argument was deductive or inductive; so more scores of2 indicates better validity assessment by the students). This indicates that the students after theintervention were better able to correctly assess the validity of arguments. During the lessons thegenerality of arguments was stressed as a factor in making an argument valid in mathematics.Students evidently could understand better that an argument that is specific to a few cases (an in-ductive argument) was not considered valid in mathematics, as opposed to deductive argumentswhich apply to the general case.
135
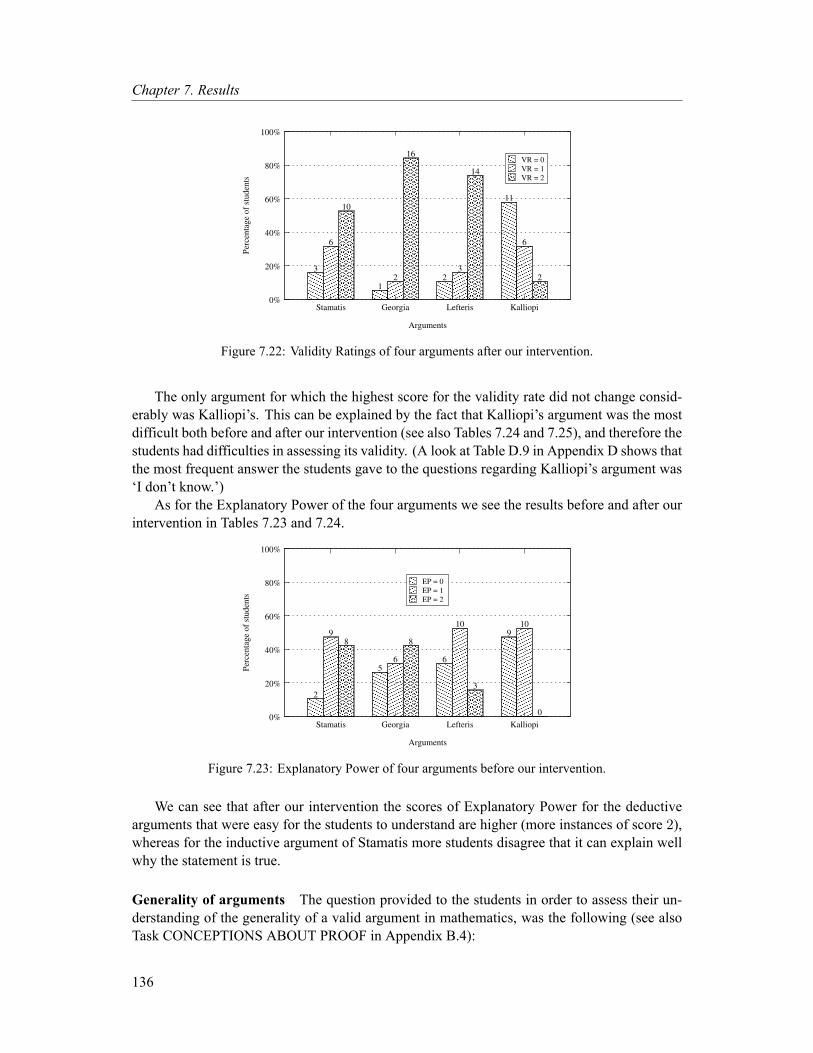
Chapter 7. Results
��������
��������
������
������
���������
���������
��������������������������������
��������������������������������
����������������
����������������
���������
���������
��������
��������
����������������
����������������
��������������������������
��������������������������
������������������������������������������������������������������
������������������������������������������������������������������
��������������������������������������
��������������������������������������
���������
���������
��
����
��
0%
20%
40%
60%
80%
100%
Stamatis Georgia Lefteris Kalliopi
Per
centa
ge
of
studen
ts
Arguments
3
12
11
6
23
6
10
16
14
2
VR = 0
VR = 1
VR = 2
Figure 7.22: Validity Ratings of four arguments after our intervention.
The only argument for which the highest score for the validity rate did not change consid-erably was Kalliopi’s. This can be explained by the fact that Kalliopi’s argument was the mostdifficult both before and after our intervention (see also Tables 7.24 and 7.25), and therefore thestudents had difficulties in assessing its validity. (A look at Table D.9 in Appendix D shows thatthe most frequent answer the students gave to the questions regarding Kalliopi’s argument was‘I don’t know.’)
As for the Explanatory Power of the four arguments we see the results before and after ourintervention in Tables 7.23 and 7.24.
������
������
����������������
����������������
������������������������
������������������������
��������������������������
��������������������������
��������������������������
��������������������������
������������������������
������������������������
��������������������������
��������������������������
��������������������������
��������������������������
������������������������
������������������������
������������������������������������
������������������������������������
��������
��������
������
����
����
��������
0%
20%
40%
60%
80%
100%
Stamatis Georgia Lefteris Kalliopi
Per
centa
ge
of
studen
ts
Arguments
2
56
99
6
10 10
8 8
3
0
EP = 0
EP = 1
EP = 2
Figure 7.23: Explanatory Power of four arguments before our intervention.
We can see that after our intervention the scores of Explanatory Power for the deductivearguments that were easy for the students to understand are higher (more instances of score 2),whereas for the inductive argument of Stamatis more students disagree that it can explain wellwhy the statement is true.
Generality of arguments The question provided to the students in order to assess their un-derstanding of the generality of a valid argument in mathematics, was the following (see alsoTask CONCEPTIONS ABOUT PROOF in Appendix B.4):
136
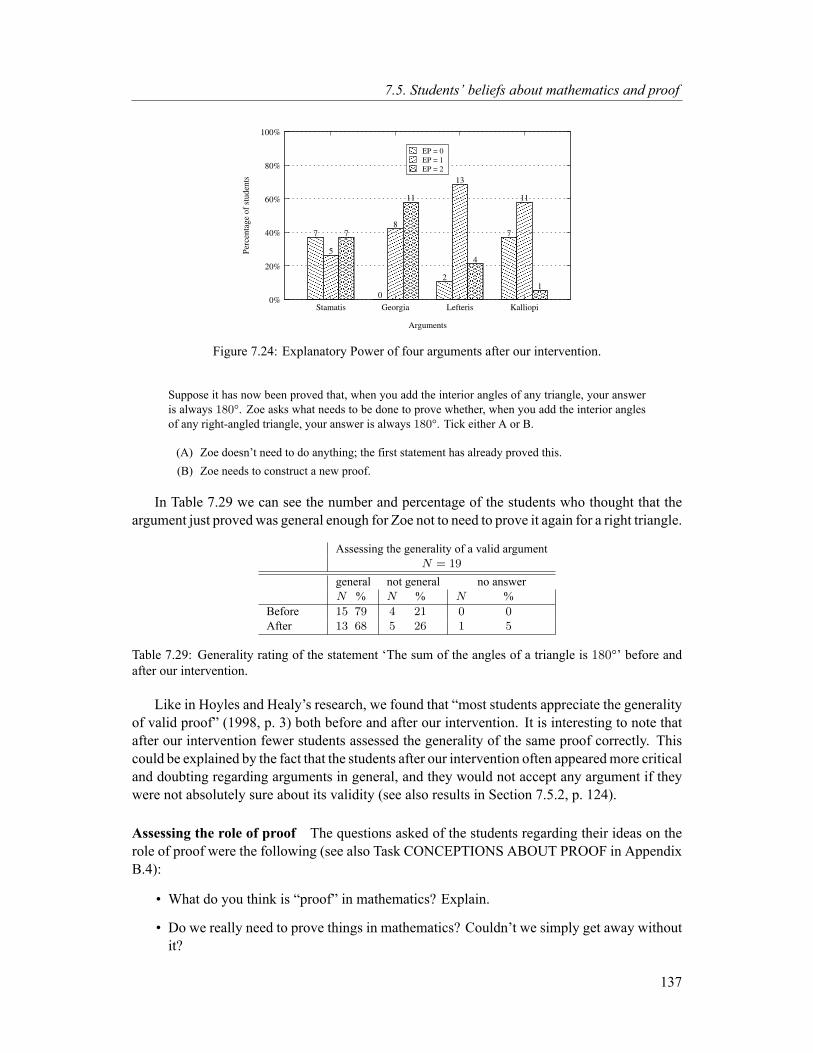
7.5. Students’ beliefs about mathematics and proof
������������������
������������������
�������������
���������
������������������
������������������
����������������
����������������
������������������������������������
������������������������������������
����������������������������������
����������������������������������
��������������������������������
��������������������������������
������������������
������������������
������������������������������������������������
������������������������������������������������
��������������
��������������
���������
���������
����
��������
��������
0%
20%
40%
60%
80%
100%
Stamatis Georgia Lefteris Kalliopi
Per
centa
ge
of
studen
ts
Arguments
7
0
2
7
5
8
13
11
7
11
4
1
EP = 0
EP = 1
EP = 2
Figure 7.24: Explanatory Power of four arguments after our intervention.
Suppose it has now been proved that, when you add the interior angles of any triangle, your answeris always 180°. Zoe asks what needs to be done to prove whether, when you add the interior anglesof any right-angled triangle, your answer is always 180°. Tick either A or B.
(A) Zoe doesn’t need to do anything; the first statement has already proved this.(B) Zoe needs to construct a new proof.
In Table 7.29 we can see the number and percentage of the students who thought that theargument just proved was general enough for Zoe not to need to prove it again for a right triangle.
Assessing the generality of a valid argumentN = 19
general not general no answerN % N % N %
Before 15 79 4 21 0 0After 13 68 5 26 1 5
Table 7.29: Generality rating of the statement ‘The sum of the angles of a triangle is 180°’ before andafter our intervention.
Like in Hoyles and Healy’s research, we found that “most students appreciate the generalityof valid proof” (1998, p. 3) both before and after our intervention. It is interesting to note thatafter our intervention fewer students assessed the generality of the same proof correctly. Thiscould be explained by the fact that the students after our intervention often appearedmore criticaland doubting regarding arguments in general, and they would not accept any argument if theywere not absolutely sure about its validity (see also results in Section 7.5.2, p. 124).
Assessing the role of proof The questions asked of the students regarding their ideas on therole of proof were the following (see also Task CONCEPTIONS ABOUT PROOF in AppendixB.4):
• What do you think is “proof” in mathematics? Explain.
• Do we really need to prove things in mathematics? Couldn’t we simply get away withoutit?
137

Chapter 7. Results
In Table 7.30 we present the results of the answers of the students to the first of the abovequestions. As was mentioned in the methodology chapter, for the coding of the answers we used“a simplified version of de Villier’s classification of the functions of proof, using the categories,truth (verification), explanation and discovery together with a fourth category ‘none/other’ ifthe students wrote nothing or if their contributions appeared to be irrelevant” (Hoyles & Healy,2007, p. 86).
Assessing the role of proofN = 19
Truth Explanation Discovery No/OtherN % N % N % N %
Before 4 21 6 32 0 0 6 32After 7 37 3 16 3 16 5 26
Table 7.30: Assessing the role of proof before and after our intervention.
Healy and Hoyles (1998, p. 17) present results similar to ours for most of the aspects apartfrom that of proof as Truth. At the beginning of our research 21% of the students consideredproof as a means to establish truth, a percentage which by the end of our intervention waschanged to 37%. We explain this change by the fact that this aspect of proof was stressed alot during the lessons. This percentage in the research of Hoyles and Healy was much bigger(50%). However, the other three functions of proof in Hoyles and Healy’s research were as fol-lows: Explanation 35%, Discovery 1% and None/Other 28%. We see that these numbers matchour numbers before the intervention. However, there is a significant difference in the Discov-ery aspect of proof which after our intervention changed from 0 to 16%. Discovery was one ofthe aspects of proof also stressed in our intervention and the students were frequently asked tomake their own conjectures and try to provide arguments for them, which we think helped themunderstand the aspect of discovery that lies within the concept of proof. Finally, we observe thata sizeable percentage of students do not know what proof is both before (32%) and after (26%)our intervention.
Changes in students’ beliefs about proof It was part of our research question (see Section3.2, p. 26) to examine how the Van Hiele level of the students and their kinds of reasoning (proofschemes) relate to their beliefs about proof both before and after our intervention. In line withthis research question we formulated the following hypothesis:
As students progress from the descriptive to the theoretical level, their beliefs aboutmathematics and proof change.
The ‘change’ we expected was that students would believe after the intervention that proofin mathematics is something that explains why a statement is generally true. The small numberof students who were assessed to have made the move from the descriptive to the theoreticallevel by the Usiskin Van Hiele test (n = 10 based on the 3/5 criterion and n = 7 based onthe 4/5 criterion) and the Harel and Sowder proof schemes (n = 10) does not allow us to runstatistical tests to check the above hypothesis. Therefore, in order to check our hypothesis wewill look at the instances of students who moved during our intervention from the descriptiveto the theoretical Van Hiele level and examine whether their scores about VR and EP of argu-ments and their beliefs about the convincingness of an argument changed in a positive direction.
138

7.5. Students’ beliefs about mathematics and proof
Similarly we will also look at the students whose progress in Van Hiele level was not measuredto be positive by any of the instruments used in this research. The variables we use for thiscomparison are presented in Table 7.31
Table 7.31: Variables used.
Name of Variable Scale Scale Type Comments
Change in vH level(3/5 or 4/5)
yes or no binary ‘yes’ corresponds to a move (with either criterion in bothpre- or post-test) from Van Hiele level 2 to Van Hielelevel 3 or 4 as well as from Van Hiele level 2 to no level(the test did not give results) and from no level to VanHiele level 3 or 4; ‘no’ corresponds to the rest of thecases.
Change in VR −2 to 2 ordinal The change in the validity rating score before and afterour intervention.
Change in EP −2 to 2 ordinal The change in the explanatory power score before andafter our intervention.
Change in PS yes or no binary 1 corresponds to moving from Empirical to Deductiveproof schemes, and 0 to not making that move.
Changes in the appreciation of validity of arguments Wewill first look at the changes in theVR for three different arguments (a familiar deductive one, Georgia’s; an unfamiliar deductiveone, Lefteris’s; and an inductive one, Stamatis’s) of those students that were assessed to havemoved from the descriptive to the theoretical Van Hiele level with both criteria (3/5 and 4/5).We expected that for the familiar argument the results would not change very much before andafter our intervention since the students had seen the argument before therefore their ValidityRating was expected to be correct both before and after our intervention. For the other twoarguments however, the unfamiliar deductive and the inductive one, we expected a positivechange in the Validity Ratings of students. We can see the results and the scores of these studentsin Table 7.32.
Change in Change in Change in Change in Change inStudents (n = 7) vH 3/5 vH 4/5 VR ded/fam VR ded/unfam VR indDebbie yes yes 0 2 2Gayle yes yes 2 1 1Elli yes yes 0 2 1Katy yes yes 0 1 2Fiona yes yes 0 2 0Sunny yes no −1 −2 1Mary yes no 0 0 2Flora yes no 0 1 2Kelly yes no 0 0 2Sue yes no 0 0 0Katerina no yes 0 2 −1John no yes 0 0 2
Expected change zero positive positiveAverage of Outcome 0.1 0.8 1.25
Table 7.32: Change in students’ VR scores as they move from the descriptive to the theoretical Van Hielelevel.
139
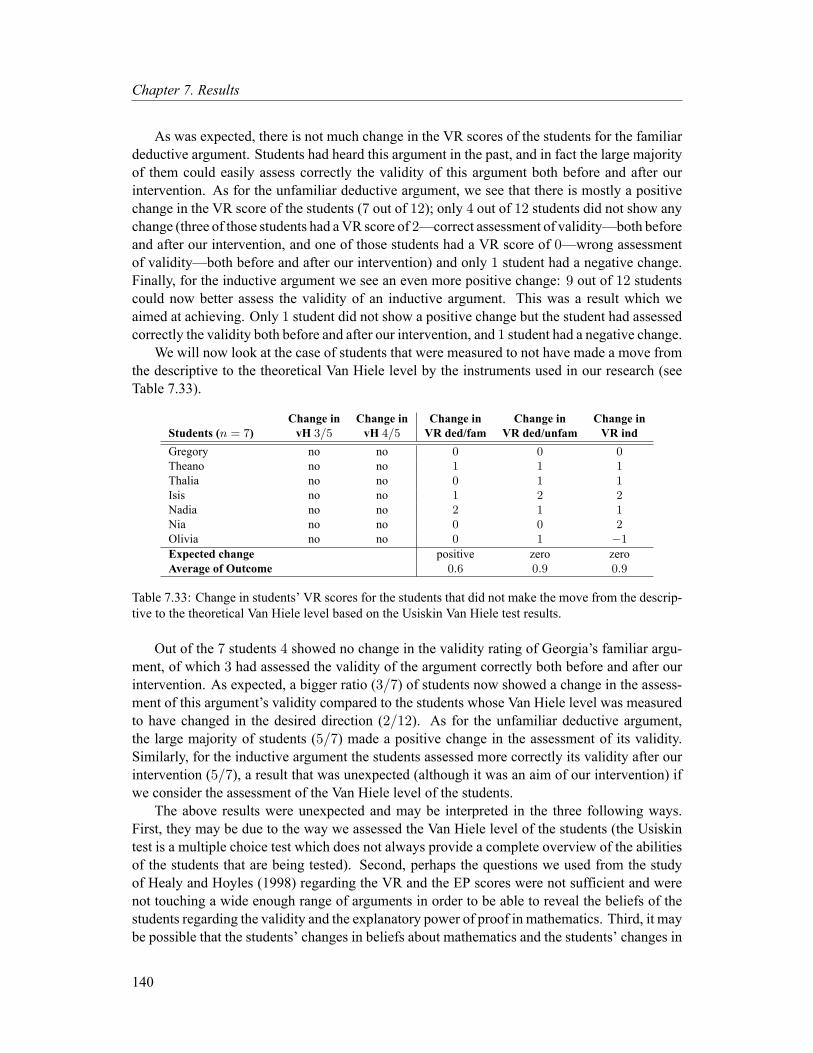
Chapter 7. Results
As was expected, there is not much change in the VR scores of the students for the familiardeductive argument. Students had heard this argument in the past, and in fact the large majorityof them could easily assess correctly the validity of this argument both before and after ourintervention. As for the unfamiliar deductive argument, we see that there is mostly a positivechange in the VR score of the students (7 out of 12); only 4 out of 12 students did not show anychange (three of those students had aVR score of 2—correct assessment of validity—both beforeand after our intervention, and one of those students had a VR score of 0—wrong assessmentof validity—both before and after our intervention) and only 1 student had a negative change.Finally, for the inductive argument we see an even more positive change: 9 out of 12 studentscould now better assess the validity of an inductive argument. This was a result which weaimed at achieving. Only 1 student did not show a positive change but the student had assessedcorrectly the validity both before and after our intervention, and 1 student had a negative change.
We will now look at the case of students that were measured to not have made a move fromthe descriptive to the theoretical Van Hiele level by the instruments used in our research (seeTable 7.33).
Change in Change in Change in Change in Change inStudents (n = 7) vH 3/5 vH 4/5 VR ded/fam VR ded/unfam VR indGregory no no 0 0 0Theano no no 1 1 1Thalia no no 0 1 1Isis no no 1 2 2Nadia no no 2 1 1Nia no no 0 0 2Olivia no no 0 1 −1
Expected change positive zero zeroAverage of Outcome 0.6 0.9 0.9
Table 7.33: Change in students’ VR scores for the students that did not make the move from the descrip-tive to the theoretical Van Hiele level based on the Usiskin Van Hiele test results.
Out of the 7 students 4 showed no change in the validity rating of Georgia’s familiar argu-ment, of which 3 had assessed the validity of the argument correctly both before and after ourintervention. As expected, a bigger ratio (3/7) of students now showed a change in the assess-ment of this argument’s validity compared to the students whose Van Hiele level was measuredto have changed in the desired direction (2/12). As for the unfamiliar deductive argument,the large majority of students (5/7) made a positive change in the assessment of its validity.Similarly, for the inductive argument the students assessed more correctly its validity after ourintervention (5/7), a result that was unexpected (although it was an aim of our intervention) ifwe consider the assessment of the Van Hiele level of the students.
The above results were unexpected and may be interpreted in the three following ways.First, they may be due to the way we assessed the Van Hiele level of the students (the Usiskintest is a multiple choice test which does not always provide a complete overview of the abilitiesof the students that are being tested). Second, perhaps the questions we used from the studyof Healy and Hoyles (1998) regarding the VR and the EP scores were not sufficient and werenot touching a wide enough range of arguments in order to be able to reveal the beliefs of thestudents regarding the validity and the explanatory power of proof in mathematics. Third, it maybe possible that the students’ changes in beliefs about mathematics and the students’ changes in
140
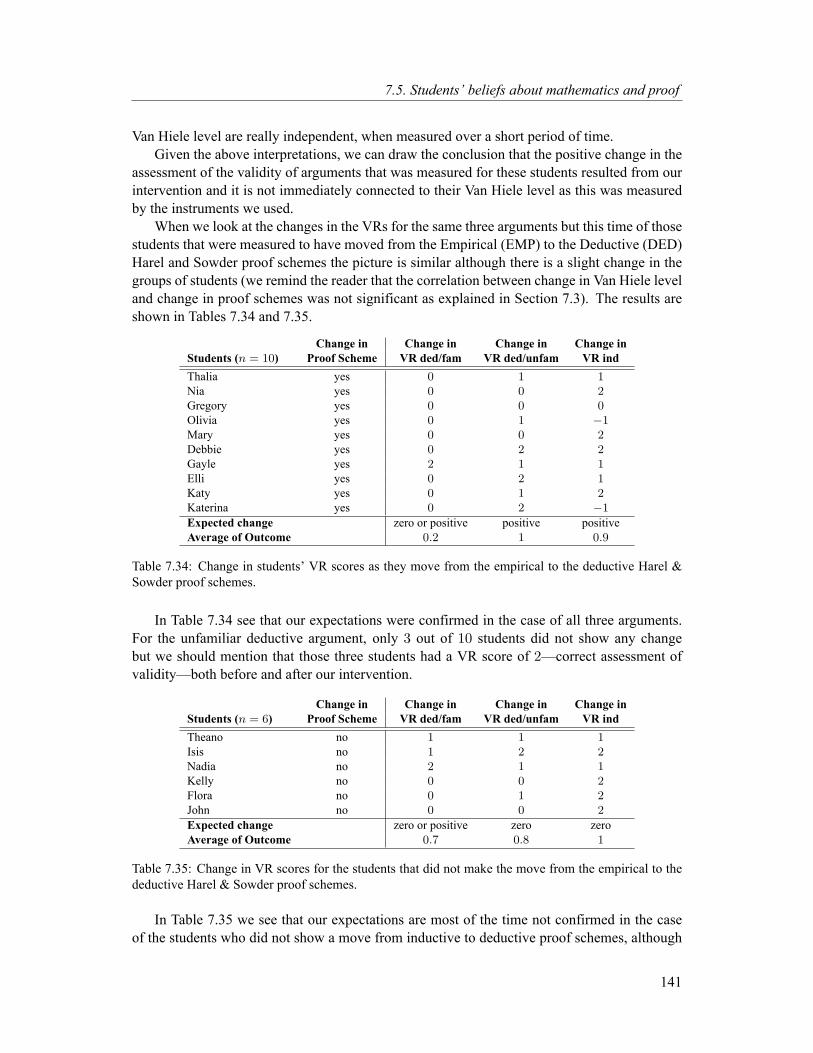
7.5. Students’ beliefs about mathematics and proof
Van Hiele level are really independent, when measured over a short period of time.Given the above interpretations, we can draw the conclusion that the positive change in the
assessment of the validity of arguments that was measured for these students resulted from ourintervention and it is not immediately connected to their Van Hiele level as this was measuredby the instruments we used.
When we look at the changes in the VRs for the same three arguments but this time of thosestudents that were measured to have moved from the Empirical (EMP) to the Deductive (DED)Harel and Sowder proof schemes the picture is similar although there is a slight change in thegroups of students (we remind the reader that the correlation between change in Van Hiele leveland change in proof schemes was not significant as explained in Section 7.3). The results areshown in Tables 7.34 and 7.35.
Change in Change in Change in Change inStudents (n = 10) Proof Scheme VR ded/fam VR ded/unfam VR indThalia yes 0 1 1Nia yes 0 0 2Gregory yes 0 0 0Olivia yes 0 1 −1Mary yes 0 0 2Debbie yes 0 2 2Gayle yes 2 1 1Elli yes 0 2 1Katy yes 0 1 2Katerina yes 0 2 −1
Expected change zero or positive positive positiveAverage of Outcome 0.2 1 0.9
Table 7.34: Change in students’ VR scores as they move from the empirical to the deductive Harel &Sowder proof schemes.
In Table 7.34 see that our expectations were confirmed in the case of all three arguments.For the unfamiliar deductive argument, only 3 out of 10 students did not show any changebut we should mention that those three students had a VR score of 2—correct assessment ofvalidity—both before and after our intervention.
Change in Change in Change in Change inStudents (n = 6) Proof Scheme VR ded/fam VR ded/unfam VR indTheano no 1 1 1Isis no 1 2 2Nadia no 2 1 1Kelly no 0 0 2Flora no 0 1 2John no 0 0 2
Expected change zero or positive zero zeroAverage of Outcome 0.7 0.8 1
Table 7.35: Change in VR scores for the students that did not make the move from the empirical to thedeductive Harel & Sowder proof schemes.
In Table 7.35 we see that our expectations are most of the time not confirmed in the caseof the students who did not show a move from inductive to deductive proof schemes, although
141
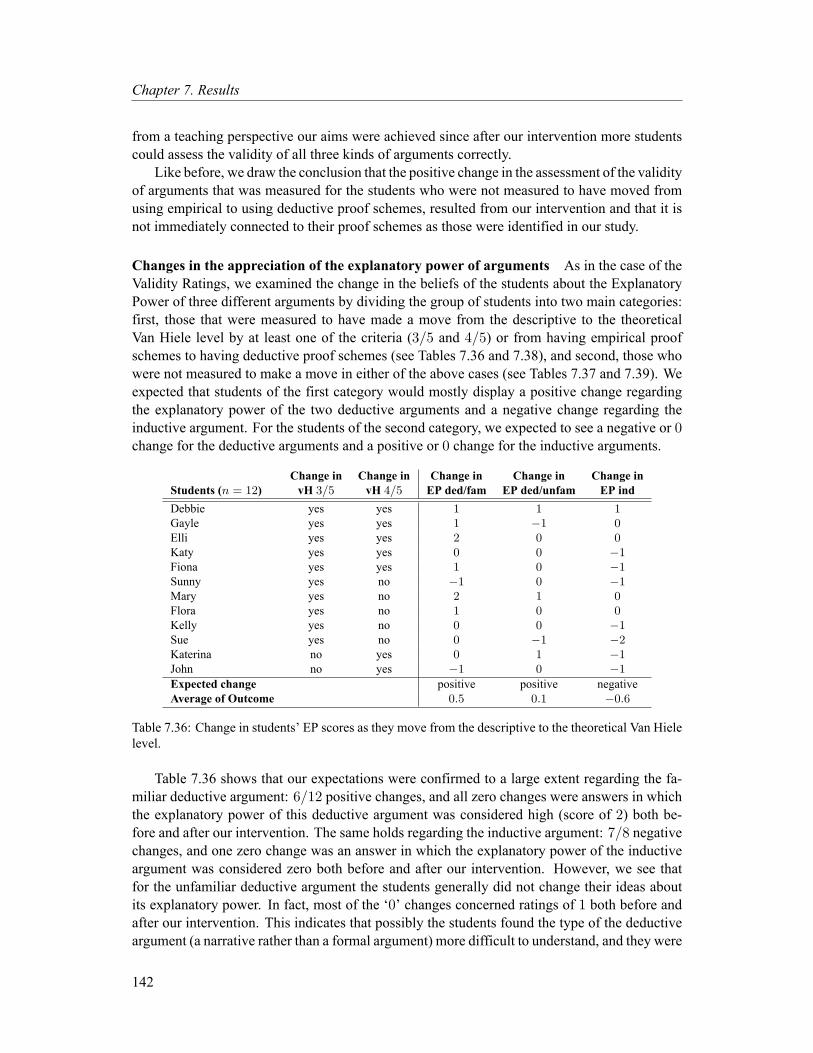
Chapter 7. Results
from a teaching perspective our aims were achieved since after our intervention more studentscould assess the validity of all three kinds of arguments correctly.
Like before, we draw the conclusion that the positive change in the assessment of the validityof arguments that was measured for the students who were not measured to have moved fromusing empirical to using deductive proof schemes, resulted from our intervention and that it isnot immediately connected to their proof schemes as those were identified in our study.
Changes in the appreciation of the explanatory power of arguments As in the case of theValidity Ratings, we examined the change in the beliefs of the students about the ExplanatoryPower of three different arguments by dividing the group of students into two main categories:first, those that were measured to have made a move from the descriptive to the theoreticalVan Hiele level by at least one of the criteria (3/5 and 4/5) or from having empirical proofschemes to having deductive proof schemes (see Tables 7.36 and 7.38), and second, those whowere not measured to make a move in either of the above cases (see Tables 7.37 and 7.39). Weexpected that students of the first category would mostly display a positive change regardingthe explanatory power of the two deductive arguments and a negative change regarding theinductive argument. For the students of the second category, we expected to see a negative or 0change for the deductive arguments and a positive or 0 change for the inductive arguments.
Change in Change in Change in Change in Change inStudents (n = 12) vH 3/5 vH 4/5 EP ded/fam EP ded/unfam EP indDebbie yes yes 1 1 1Gayle yes yes 1 −1 0Elli yes yes 2 0 0Katy yes yes 0 0 −1Fiona yes yes 1 0 −1Sunny yes no −1 0 −1Mary yes no 2 1 0Flora yes no 1 0 0Kelly yes no 0 0 −1Sue yes no 0 −1 −2Katerina no yes 0 1 −1John no yes −1 0 −1
Expected change positive positive negativeAverage of Outcome 0.5 0.1 −0.6
Table 7.36: Change in students’ EP scores as they move from the descriptive to the theoretical Van Hielelevel.
Table 7.36 shows that our expectations were confirmed to a large extent regarding the fa-miliar deductive argument: 6/12 positive changes, and all zero changes were answers in whichthe explanatory power of this deductive argument was considered high (score of 2) both be-fore and after our intervention. The same holds regarding the inductive argument: 7/8 negativechanges, and one zero change was an answer in which the explanatory power of the inductiveargument was considered zero both before and after our intervention. However, we see thatfor the unfamiliar deductive argument the students generally did not change their ideas aboutits explanatory power. In fact, most of the ‘0’ changes concerned ratings of 1 both before andafter our intervention. This indicates that possibly the students found the type of the deductiveargument (a narrative rather than a formal argument) more difficult to understand, and they were
142
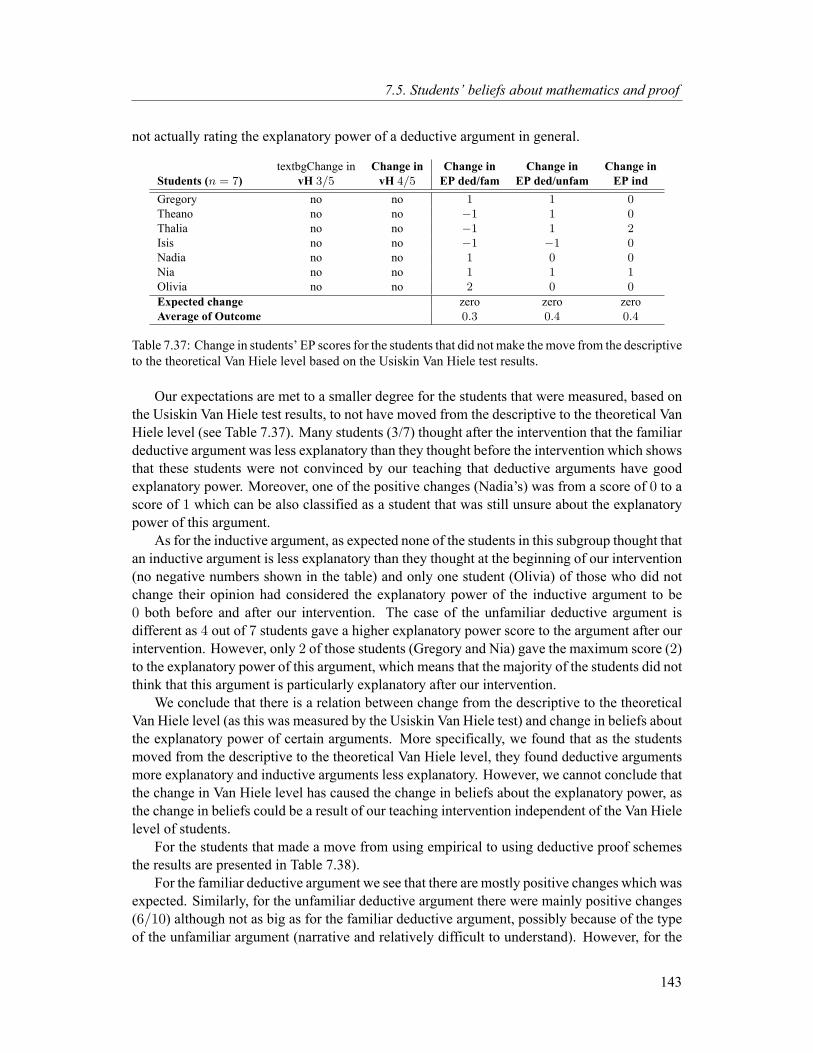
7.5. Students’ beliefs about mathematics and proof
not actually rating the explanatory power of a deductive argument in general.
textbgChange in Change in Change in Change in Change inStudents (n = 7) vH 3/5 vH 4/5 EP ded/fam EP ded/unfam EP indGregory no no 1 1 0Theano no no −1 1 0Thalia no no −1 1 2Isis no no −1 −1 0Nadia no no 1 0 0Nia no no 1 1 1Olivia no no 2 0 0
Expected change zero zero zeroAverage of Outcome 0.3 0.4 0.4
Table 7.37: Change in students’ EP scores for the students that did not make themove from the descriptiveto the theoretical Van Hiele level based on the Usiskin Van Hiele test results.
Our expectations are met to a smaller degree for the students that were measured, based onthe Usiskin Van Hiele test results, to not have moved from the descriptive to the theoretical VanHiele level (see Table 7.37). Many students (3/7) thought after the intervention that the familiardeductive argument was less explanatory than they thought before the intervention which showsthat these students were not convinced by our teaching that deductive arguments have goodexplanatory power. Moreover, one of the positive changes (Nadia’s) was from a score of 0 to ascore of 1 which can be also classified as a student that was still unsure about the explanatorypower of this argument.
As for the inductive argument, as expected none of the students in this subgroup thought thatan inductive argument is less explanatory than they thought at the beginning of our intervention(no negative numbers shown in the table) and only one student (Olivia) of those who did notchange their opinion had considered the explanatory power of the inductive argument to be0 both before and after our intervention. The case of the unfamiliar deductive argument isdifferent as 4 out of 7 students gave a higher explanatory power score to the argument after ourintervention. However, only 2 of those students (Gregory and Nia) gave the maximum score (2)to the explanatory power of this argument, which means that the majority of the students did notthink that this argument is particularly explanatory after our intervention.
We conclude that there is a relation between change from the descriptive to the theoreticalVan Hiele level (as this was measured by the Usiskin Van Hiele test) and change in beliefs aboutthe explanatory power of certain arguments. More specifically, we found that as the studentsmoved from the descriptive to the theoretical Van Hiele level, they found deductive argumentsmore explanatory and inductive arguments less explanatory. However, we cannot conclude thatthe change in Van Hiele level has caused the change in beliefs about the explanatory power, asthe change in beliefs could be a result of our teaching intervention independent of the Van Hielelevel of students.
For the students that made a move from using empirical to using deductive proof schemesthe results are presented in Table 7.38).
For the familiar deductive argument we see that there are mostly positive changes which wasexpected. Similarly, for the unfamiliar deductive argument there were mainly positive changes(6/10) although not as big as for the familiar deductive argument, possibly because of the typeof the unfamiliar argument (narrative and relatively difficult to understand). However, for the
143
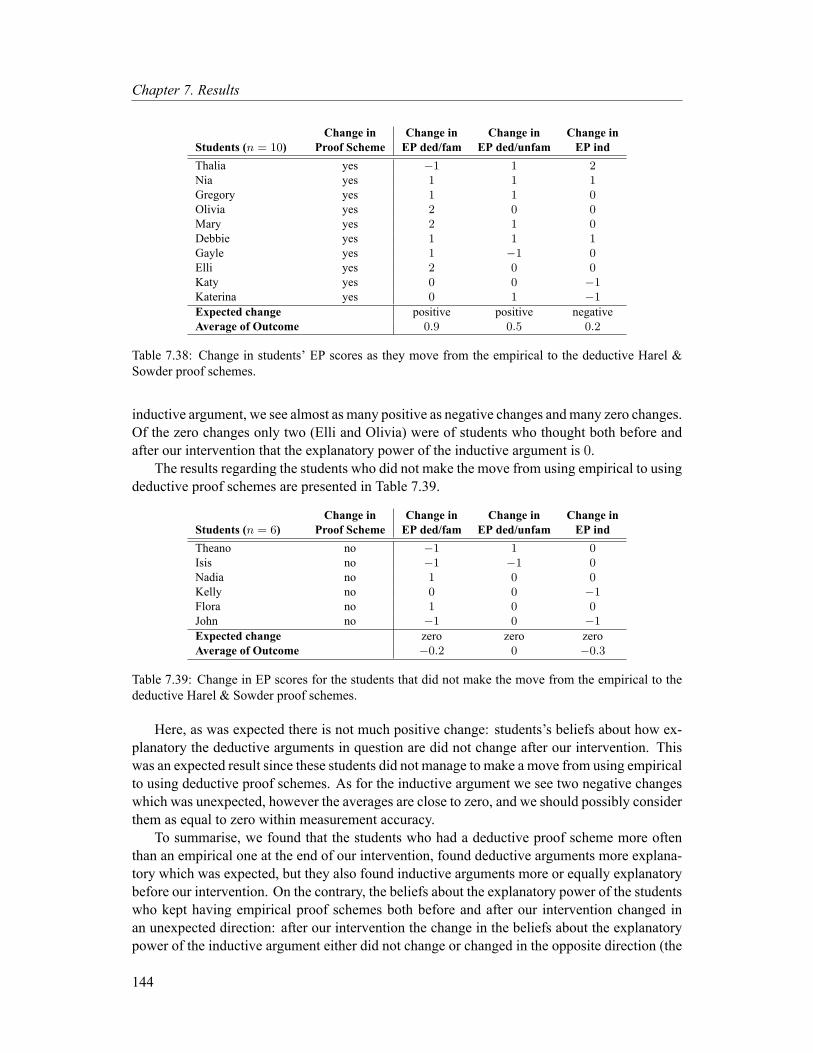
Chapter 7. Results
Change in Change in Change in Change inStudents (n = 10) Proof Scheme EP ded/fam EP ded/unfam EP indThalia yes −1 1 2Nia yes 1 1 1Gregory yes 1 1 0Olivia yes 2 0 0Mary yes 2 1 0Debbie yes 1 1 1Gayle yes 1 −1 0Elli yes 2 0 0Katy yes 0 0 −1Katerina yes 0 1 −1
Expected change positive positive negativeAverage of Outcome 0.9 0.5 0.2
Table 7.38: Change in students’ EP scores as they move from the empirical to the deductive Harel &Sowder proof schemes.
inductive argument, we see almost as many positive as negative changes andmany zero changes.Of the zero changes only two (Elli and Olivia) were of students who thought both before andafter our intervention that the explanatory power of the inductive argument is 0.
The results regarding the students who did not make the move from using empirical to usingdeductive proof schemes are presented in Table 7.39.
Change in Change in Change in Change inStudents (n = 6) Proof Scheme EP ded/fam EP ded/unfam EP indTheano no −1 1 0Isis no −1 −1 0Nadia no 1 0 0Kelly no 0 0 −1Flora no 1 0 0John no −1 0 −1
Expected change zero zero zeroAverage of Outcome −0.2 0 −0.3
Table 7.39: Change in EP scores for the students that did not make the move from the empirical to thedeductive Harel & Sowder proof schemes.
Here, as was expected there is not much positive change: students’s beliefs about how ex-planatory the deductive arguments in question are did not change after our intervention. Thiswas an expected result since these students did not manage to make a move from using empiricalto using deductive proof schemes. As for the inductive argument we see two negative changeswhich was unexpected, however the averages are close to zero, and we should possibly considerthem as equal to zero within measurement accuracy.
To summarise, we found that the students who had a deductive proof scheme more oftenthan an empirical one at the end of our intervention, found deductive arguments more explana-tory which was expected, but they also found inductive arguments more or equally explanatorybefore our intervention. On the contrary, the beliefs about the explanatory power of the studentswho kept having empirical proof schemes both before and after our intervention changed inan unexpected direction: after our intervention the change in the beliefs about the explanatorypower of the inductive argument either did not change or changed in the opposite direction (the
144

7.5. Students’ beliefs about mathematics and proof
students now thought that inductive arguments were less explanatory than before).We conclude that there is a relation between change in proof schemes and change in the
beliefs about the explanatory power of deductive arguments, but not of inductive arguments.Of course, we cannot conclude that the change in proof schemes has caused the change in be-liefs about the explanatory power of arguments, as the change in beliefs could be a result of ourteaching intervention independent of the students’ proof schemes. Students after our interven-tion have obviously started considering deductive arguments more explanatory than before, butstill have not entirely changed their ideas about the explanatory power of inductive arguments.This can be explained by the fact that the students before our intervention had been using onlyinductive arguments therefore abandoning the belief that they are explanatory turned out not tobe possible in only a few weeks.
Change in the beliefs about the convincingness of arguments One of the questions in TaskCHOOSING (see Appendix B.3) was about choosing the most convincing of the given argu-ments. A brief description of the type of each argument was given in Table 7.26. To brieflyremind the reader about the types of arguments we provide the following list:
• Georgia’s (GEO), Lefteris’s (LEF), Tania’s (TAN) and Kalliopis’s (KAL) arguments weredeductive (we label these as DED) arguments of various forms,
• Eleni’s (ELE) and Stamatis’s (STA) were inductive (we label these as IND) arguments,and
• Petros’s (PET) argument was an incorrect, circular and ‘formal’ argument (we label thisas EXT).
We expected that as the students move from the descriptive to the theoretical Van Hiele levelor from using empirical to using deductive proof schemes, they would find deductive argumentsconvincing rather than inductive ones. In other words, we expected that these students wouldeither find a deductive argument convincing both before and after our intervention or only afterour intervention. On the other hand, we expected that the students who did not make a change inVanHiele level or in proof schemewould continue finding inductive argumentsmore convincingthan others after our intervention.
In Tables 7.40 and 7.41 we see how the change in the students’ beliefs about the convinc-ingness of arguments relates to the change in the Van Hiele level of students.
In Table 7.40 we see that for those students whomoved from the descriptive to the theoreticalVan Hiele level (based on at least one of the criteria) their beliefs about the convincingness ofarguments either changed positively (in the 6 cases where before the intervention the choicewas an inductive argument) or remained unaltered (in the 6 cases where before the interventionthe choice was already a deductive argument). This result agrees with our expectations. Inonly one case (Sue), a student who was measured to have made a move in the Van Hiele levelsbelieved an inductive argument to be convincing both before and after our intervention (it isworth mentioning that this student had been consistently showing that she was at the descriptiveVan Hiele level).
In Table 7.41 we see that although some students were not measured by the Usiskin VanHiele test to have made the move from the descriptive to the theoretical Van Hiele level, severalof them (4/7) did think after our intervention that a deductive argument was more convincing
145
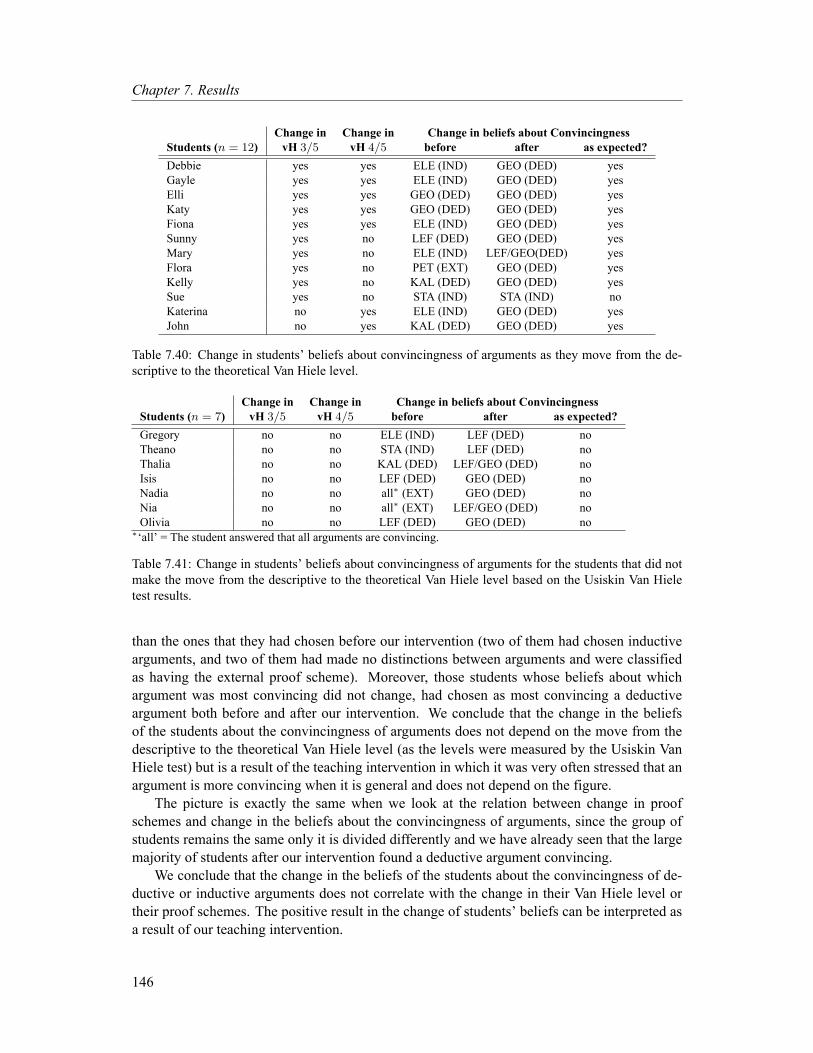
Chapter 7. Results
Change in Change in Change in beliefs about ConvincingnessStudents (n = 12) vH 3/5 vH 4/5 before after as expected?Debbie yes yes ELE (IND) GEO (DED) yesGayle yes yes ELE (IND) GEO (DED) yesElli yes yes GEO (DED) GEO (DED) yesKaty yes yes GEO (DED) GEO (DED) yesFiona yes yes ELE (IND) GEO (DED) yesSunny yes no LEF (DED) GEO (DED) yesMary yes no ELE (IND) LEF/GEO(DED) yesFlora yes no PET (EXT) GEO (DED) yesKelly yes no KAL (DED) GEO (DED) yesSue yes no STA (IND) STA (IND) noKaterina no yes ELE (IND) GEO (DED) yesJohn no yes KAL (DED) GEO (DED) yes
Table 7.40: Change in students’ beliefs about convincingness of arguments as they move from the de-scriptive to the theoretical Van Hiele level.
Change in Change in Change in beliefs about ConvincingnessStudents (n = 7) vH 3/5 vH 4/5 before after as expected?Gregory no no ELE (IND) LEF (DED) noTheano no no STA (IND) LEF (DED) noThalia no no KAL (DED) LEF/GEO (DED) noIsis no no LEF (DED) GEO (DED) noNadia no no all∗ (EXT) GEO (DED) noNia no no all∗ (EXT) LEF/GEO (DED) noOlivia no no LEF (DED) GEO (DED) no
∗‘all’ = The student answered that all arguments are convincing.
Table 7.41: Change in students’ beliefs about convincingness of arguments for the students that did notmake the move from the descriptive to the theoretical Van Hiele level based on the Usiskin Van Hieletest results.
than the ones that they had chosen before our intervention (two of them had chosen inductivearguments, and two of them had made no distinctions between arguments and were classifiedas having the external proof scheme). Moreover, those students whose beliefs about whichargument was most convincing did not change, had chosen as most convincing a deductiveargument both before and after our intervention. We conclude that the change in the beliefsof the students about the convincingness of arguments does not depend on the move from thedescriptive to the theoretical Van Hiele level (as the levels were measured by the Usiskin VanHiele test) but is a result of the teaching intervention in which it was very often stressed that anargument is more convincing when it is general and does not depend on the figure.
The picture is exactly the same when we look at the relation between change in proofschemes and change in the beliefs about the convincingness of arguments, since the group ofstudents remains the same only it is divided differently and we have already seen that the largemajority of students after our intervention found a deductive argument convincing.
We conclude that the change in the beliefs of the students about the convincingness of de-ductive or inductive arguments does not correlate with the change in their Van Hiele level ortheir proof schemes. The positive result in the change of students’ beliefs can be interpreted asa result of our teaching intervention.
146
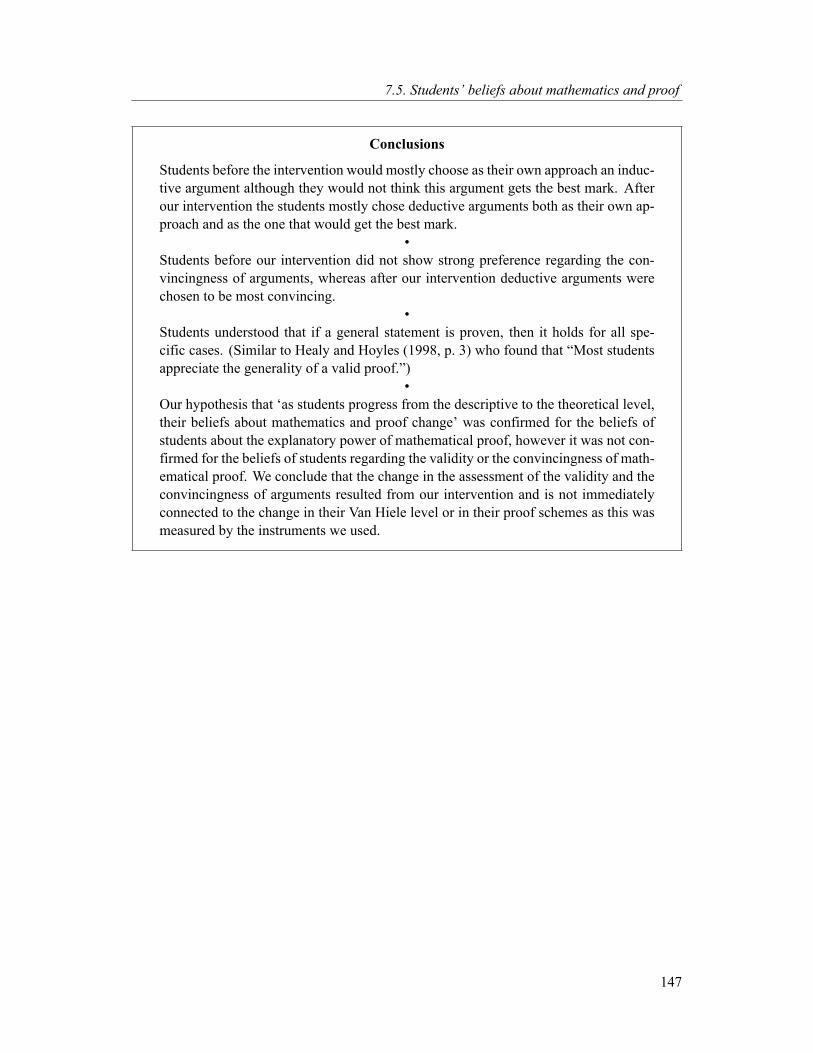
7.5. Students’ beliefs about mathematics and proof
Conclusions
Students before the intervention would mostly choose as their own approach an induc-tive argument although they would not think this argument gets the best mark. Afterour intervention the students mostly chose deductive arguments both as their own ap-proach and as the one that would get the best mark.
•Students before our intervention did not show strong preference regarding the con-vincingness of arguments, whereas after our intervention deductive arguments werechosen to be most convincing.
•Students understood that if a general statement is proven, then it holds for all spe-cific cases. (Similar to Healy and Hoyles (1998, p. 3) who found that “Most studentsappreciate the generality of a valid proof.”)
•Our hypothesis that ‘as students progress from the descriptive to the theoretical level,their beliefs about mathematics and proof change’ was confirmed for the beliefs ofstudents about the explanatory power of mathematical proof, however it was not con-firmed for the beliefs of students regarding the validity or the convincingness of math-ematical proof. We conclude that the change in the assessment of the validity and theconvincingness of arguments resulted from our intervention and is not immediatelyconnected to the change in their Van Hiele level or in their proof schemes as this wasmeasured by the instruments we used.
147

Chapter 8
Conclusions and Discussion
In this chapter we will summarize the results of our research (Section 8.1) discuss them andoffer our recommendations for future research (Section 8.2).
8.1 Conclusions
Our main research questions, our subquestions and our hypotheses were presented in Chapter 3on page 25. Here we will summarize the results of our research study by addressing our researchquestions and hypotheses one by one.
8.1.1 Answering SQ.1 and H.1
Our first subquestion and hypothesis were the following:
SQ.1: What are the beliefs of students about the nature and the meaning of math-ematical proof, and mathematics in general, and how do these change when theymove from the descriptive to the theoretical Van Hiele level?
H.1: As students progress from the descriptive to the theoretical level, their beliefsabout mathematics and proof change.
These were addressed by asking students’ conceptions of proof and mathematics beforeand after our intervention (with the help of questionnaires), and by examining the discussionsbetween students and teacher as well as among students (see Section 7.5).
The results from using the adapted version of the Schoenfeld questionnaire (explained indetail in Section 7.5.1) showed that, regarding mathematics in general, the students after ourintervention thought that ordinary school mathematics is mostly facts and procedures that haveto be memorised. In addition, after the intervention the students thought even more than beforethat memorisation is not the best way to do well in math. This could be interpreted as an effect ofthe kind of teaching in which we stressed that geometry andmathematics in general is somethingdifferent that what is usually taught in school; that is, it is not simply an application of proceduresbut rather an ongoing process of observing, conjecturing, and finding valid arguments to supportor reject your conjectures. The students themselves also thought in general that the lessonsaffected their beliefs about mathematics in various ways (the results of the relevant questionnaire
149
Chapter 8. Conclusions and Discussion
were analysed in Section 7.5.2). Some of the ways they mentioned included that they nowthought mathematics is better/more interesting/fun, more difficult/requires more thinking andtime, has a ‘shaky’ beginning (the axioms), is not just givens without reasons, can be donecooperatively, requires imagination, is easy, is not just calculations.
Regarding the beliefs of students about geometry and proof, the results we got from themodified Schoenfeld questionnaire only showed the changes related to rather general aspects ofproof and were not immediately connected with the ideas of validity and generality of argumentswhich we introduced in our intervention. Therefore, although the students’ answers to the rel-evant items of the Schoenfeld questionnaire did not show any change, we found that students’beliefs about more specific aspects of geometry and proof did change based on the other twoinstruments we used.
More specifically, based on our questionnaire (see Section 7.5.2) we found that the studentsafter our intervention seemed to have appreciated the nature of proof as explaining why thingshold in mathematics and they had started believing that they can prove theorems on their own.In 17 out of 20 cases, the students thought that their beliefs about proof have changed after theintervention in ways such as that they now thought proof is: important, useful, can explain,easy/fun, difficult, not only for mathematicians.
Based on the instruments we used from Healy and Hoyles (1998), we found that after ourintervention the students mostly chose deductive rather than inductive arguments both as theirown approach and as the one that would get the best mark, and showed a strong preference fordeductive arguments as being the ones that are most convincing (see Section 7.5.3). Moreover,after our intervention students understood better that if a general statement is proven, then itholds for all specific cases. This result is the same as for Healy and Hoyles (1998, p. 3) whofound that “Most students appreciate the generality of a valid proof.”
Although in general there was a change in the beliefs of students both about mathematicsin general and about proof in particular, this change was not always related to the change of theVan Hiele level of students from the descriptive to the theoretical level. Based on the detailedanalysis offered in Section 7.5.3we can say that our first hypothesis was confirmed for the beliefsof students about the explanatory power of mathematical proof, however it was not confirmedfor the beliefs of students regarding the validity or the convincingness of mathematical proof.We conclude that the change in the way students assessed the validity and the convincingness ofarguments after our intervention resulted from our teaching and is not immediately connectedto the change in their Van Hiele level or in their proof schemes as measured by the instrumentswe used.
8.1.2 Answering SQ.2 and H.2
Our second subquestion and hypothesis were the following:
SQ.2: Is there a correlation between the Harel & Sowder proof schemes and theVan Hiele levels of thinking?
H.2: Given the correspondence1 between the Harel & Sowder proof schemes andthe Van Hiele levels of thinking, there should be a correlation between correspond-ing Van Hiele levels and Harel & Sowder proof schemes.
1See Section 2.5 on page 16 for a definition of this correspondence.
150
8.1. Conclusions
To address thesewe checked both before and after the intervention the kinds of proof schemesemployed by the students when proving geometrical propositions (see Section 7.2) as well astheir Van Hiele levels (see Section 7.1). By conducting statistical tests we checked whetherthere is a consistent correspondence between the proof schemes used and the students’ VanHiele levels of thinking (see Section 7.3). We found that there is a correlation between the Harel& Sowder proof schemes and the Van Hiele levels of thinking before and after our intervention.However, we were unable to give a certain answer to the question of whether there is a cor-relation between the progress in Harel & Sowder proof schemes (from EMP to DED) and theprogress in the Van Hiele level based on our statistical analysis, due to the small number of thestudents for which we had data.
Therefore, in order to further investigate our second hypothesis (H.2), we conducted a qual-itative analysis of our results by looking at those moments during our intervention when thestudents displayed progress in their Van Hiele level and/or moved from having an empirical tohaving a deductive proof scheme. This was presented in Section 7.4. The qualitative analysis ofthe results showed cases of students whose progress in Van Hiele level happened together withtheir move from an inductive to a deductive proof scheme. However, as before, a larger numberof students would be needed in order to confirm statistically our second hypothesis.
8.1.3 Answering SQ.3 and H.3
Our third subquestion and hypothesis were the following:
SQ.3: Can we make the distinction between deductive and inductive argumentsunderstandable to students before they start producing deductive proofs for them-selves, and how can this process be planned according the Van Hiele teachingphases?
H.3: The move of students from the descriptive to the theoretical Van Hiele levelcan be described in three stages (related to the arguments students use during prov-ing);2 a teaching strategy based on these three stages and the five VanHiele teachingphases—like the one used in this research study—can facilitate this move.
To address these we designed a series of lessons based on the five Van Hiele teaching phases(inquiry, directed orientation, explication, free orientation and integration) and on our idea of athree stage learning sequence:
• Stage 1: Understanding the distinction between empirical and deductive arguments.
• Stage 2: Abandoning the use of empirical arguments in favor of deductive ones.
• Stage 3: Starting to see the axiomatic structure of Euclidean geometry.
We found (see Section 7.4.1) that the first stage of our teaching strategy was successful,as most of the students (about three quarters) after the completion of this stage were able tounderstand the distinction between deductive and inductive arguments. However, and as was
2Presented in Table 2.4 on page 22.
151

Chapter 8. Conclusions and Discussion
expected, the students at this point were not always able to offer deductive arguments, some-thing which they are expected to practice during stage two. The second stage of our teachingstrategy was also successful, since the percentage of students using either empirical or externalproof schemes at the end of stage two shows a considerable decrease while at the same timethe frequency of using a deductive proof scheme shows a considerable increase (from 9% to88%). However, the number of lessons and of students was small; therefore, we would need totry this teaching strategy also on a larger sample and over a longer period of time in order tobe able to draw safer conclusions regarding its effectiveness in general. The third stage of ourteaching intervention was successful. In the third stage the students are supposed to start seeingthat, for the arguments they come up with, only previously proven knowledge can be used, andthat it all starts from a few basic assumptions: the axioms. The students during our last meetingdiscovered the existence of axioms and the fact that the axioms are the basic building blocks ofEuclidean geometry.
The five Van Hiele teaching phases in our teaching intervention were also completed formost concepts successfully (see Section 7.4.2). However, both the directed and the free orien-tation phases were short, and for some concepts the free orientation phase was not included.We believe that our teaching strategy can be more successful (all students arriving at Van Hielelevel 3 or above, all students consistently using deductive arguments) if it is applied over alonger period of time.
Our teaching strategy helped the students as a group to move to a greater Van Hiele levelthan what they started with. Of the students who took the Van Hiele test both before and afterour intervention (n = 20) a pre/post comparison showed that most of them made progress intheir Van Hiele level. More specifically, in 10 out of the 13 cases for which we can calculate thechange in Van Hiele level based on the 3/5 criterion the change was positive. Similarly, in 10out of the 14 cases for which we can calculate the change based on the 4/5 criterion the changewas positive. Moreover, when we look specifically at the move from the descriptive (level 2)to the theoretical (level 3) Van Hiele level, 4 out of 6 students who started at level 2 based oncriterion 3/5moved to level 3, and 4 out of 5 of those who started at Van Hiele level 2 based oncriterion 4/5moved to level 3. The few students for which there was no positive change in theirVan Hiele level in any of the above, remained at the same Van Hiele level as they started with.These results, in combination with the qualitative analysis of the lessons, allow us to concludethat our teaching strategy was successful in terms of moving students to a higher Van Hiele level.
8.1.4 Answering our main research question
Our main research question was the following:
(RQ) What kind(s) of reasoning do students use for proving while they are at dif-ferent levels of thinking in geometry as well as during the transition from the levelof informal-visual proofs to the level of formal-logical proofs, and how do thesekinds of reasoning relate to students’ beliefs about proof?
Our intention was to look at the specific kinds of reasoning that students use when theymovefrom the descriptive to the theoretical Van Hiele level, especially when they follow a learningpath where the distinction between deductive and inductive arguments is made obvious at thebeginning. We expected that students would use a lot the transformational/causal proof scheme
152

8.2. Discussion and recommendations
which would help them see the ‘movement’ in the figures involved in their conjectures. We alsoexpected that students would rather quickly abandon the empirical proof schemes, because ofthe distinction made between inductive and deductive arguments early in the intervention.
Indeed we found that the students before our teaching intervention had mostly empiricalproof schemes (see also Tables 7.2 and 7.3 on pages 76 and 77), whereas at the end of ourintervention they had mostly deductive ones. Contrary to our expectations, however, the trans-formational/causal proof scheme was not encountered much during our teaching intervention.
The second part of our research question, related to the correlations between change in thekinds of reasoning and change in the beliefs, was answered by answering our first subquestion.As we mentioned before, although overall there was a change in the beliefs of students bothabout mathematics in general and about proof in particular, this change was not always relatedto the change of the proof schemes (kinds of reasoning) from empirical to deductive, or to thechange of the Van Hiele level of students from descriptive to theoretical.
8.2 Discussion and recommendations
In what follows we will summarise and evaluate the way we used past research in our study. Wewill talk about what we learned and what we would do differently.
The Van Hiele theory and the Usiskin Van Hiele test We used the Van Hiele levels of think-ing in our research both for selecting a sample of students and for designing our teaching inter-vention. The first researcher to design a multiple choice test for classifying students into VanHiele levels was Usiskin (1982) and since then his test has been very frequently used in researchall over the world. In our analysis of the results of this test (see Appendix D.1), we found verysimilar results both to those of Usiskin (1982) and to those of Tzifas (2005), who used the VanHiele test on a large sample of students in Greece. The only significant differences in the resultswere regarding questions 13 and 17 of the Van Hiele test.
For question 13, our research gave similar results to that of Usiskin (1982), however, becauseof an error in the Greek translation of Tzifas’ question, the results in the study of Tzifas for thisquestion are very different. Tzifas in his thesis (Tzifas, 2005, p. 79) mentions that during the testmany students asked why a specific answer was missing from the range of answers for question13, however the explanation for this is not offered by Tzifas.
For question 17 our results are similar to those of Tzifas but different from those of Usiskin.We think this may be due to the different educational background of our students and studentsin the United States (where Usiskin’s research took place).
In general, we noticed that for questions 13 and after the students seem to start answeringmore randomly which at some cases shows in the different results between our study and thatof Usiskin and Tzifas. One possible interpretation of this is that in our study, the students wereall of the same age (14 to 15), whereas in Tzifas’ and Usiskin’s study the students participatingwere of a larger range of ages (14 to 17). Therefore, in our sample of students there are lessstudents who could potentially be at higher Van Hiele levels which makes them less able toanswer correctly the last questions of the questionnaire.
As we have already discussed, a multiple choice test is quite restrictive and does not initself allow the researcher to have a clear picture of the level of the student. We think thatthe risk of interpreting differently a question in the multiple choice test makes interviews with
153
Chapter 8. Conclusions and Discussion
the students after they have taken the test necessary. Because of time restrictions we couldnot include interviews in our research, however we strongly recommend in future research thatinterviews accompany the test.
Moreover, in our study some of the students were not at the desired Van Hiele level (level2) at the beginning of the intervention. Having a larger sample of students at the desired levelwould allow for making safer conclusions regarding the success of the teaching intervention.
The Harel & Sowder proof schemes We used the Harel & Sowder proof schemes for clas-sifying the kinds of reasoning of our students. During this process we sometimes had difficultyin deciding the category to which certain students’ proof schemes belonged. The examples of-fered by Harel and Sowder (1998) and Harel (2007) were not always enough for making clearwhat the characteristics of each of the deductive proof schemes were. For future research werecommend that a more specific coding of proof schemes is made based on clear descriptors foreach proof scheme. In addition, we think that, as is the case with the Van Hiele levels, the proofscheme of an individual is not easy to find out only based on written work or on group workdiscussions. Interviews with selected students are strongly recommended for this reason.
Another point we would like to raise is related to the causal proof schemes. As mentioned inthe main body of this thesis, we believe that during the move towards the theoretical Van Hielelevel students can be helped if they use the idea of giving ‘movement’ to a figure in order tofind out the general properties of figures. We hoped to see the students using this idea in theirindividual attempts to prove their conjectures. This idea is also central to the transformationalproof schemes, and especially to the subcategory of causal proof schemes, where the reasonsthat cause a general property are taken into consideration. Contrary to our expectations, how-ever, the transformational/causal proof scheme was not encountered much during our teachingintervention. This may be due to the short period of our intervention and to the fact that the ideaof giving ‘movement’ to a figure was something entirely new to the students. We suggest theuse of dynamic software for assisting students to understand this idea in a shorter time.
Schoenfeld’s questionnaire Weused amodified version of a questionnaire designed by Schoen-feld (1989) as part of our instruments for identifying students’ beliefs about mathematics andproof. We found that the questions we used were related to general aspects of mathematics andproof which turned out not to be as useful for our research as we had thought. Our interventionwas focused on certain central aspects of proof, such as validity and convincingness, thereforewe do not recommend the use of this questionnaire if this research is repeated. Moreover, inter-views with students can again be a more effective way to accurately reveal students’ beliefs.
The Hoyles & Healy instruments We found the Hoyles & Healy instruments quite useful.Especially Task CHOOSING (see Appendix B.3) was rather useful for identifying the proofschemes of students at the beginning of our intervention. However, a couple of the proofs inthis task, such as Lefteris’, Tania’s and Kalliopi’s, caused confusion among the students sincethey did not understand them very well. We recommend that in future research the kinds ofproofs in this task are adapted to the students’ background and, if necessary, to dedicate sometime before the completion of the task to ensure that all students understand the meaning ofthe proofs.3 Moreover, in our intervention Task CHOOSING was partly used for assessing the
3This was taken care of by Hoyles and Healy in their own research.
154

8.2. Discussion and recommendations
change in the choices of types of arguments by the students for supporting the proposition “thesum of the angles of a triangle is 180°.” However, we realised that had we used a different taskat the end of the intervention for assessing change we would have been able to get more usefulresults regarding this change: since we used the same task after the intervention the studentswere already familiar (to an extent) with this task which may have affected their answers.
Given the difference in the research questions between our research and that of Hoyles andHealy (2007) we could make a comparison only regarding certain results of the Hoyles andHealy study. We used instruments from Hoyles and Healy’s research in order to find out thestudents’ choices of arguments as their own approach or as the ones that would receive the bestmark, their understanding of validity, convincingness and generality of arguments, as well astheir appreciation of the explanatory power of arguments and of the role of proof. We willbriefly discuss these results and compare it to those of Hoyles and Healy.
Regarding the choice of arguments of students as their own approach, before the interventionmore than half of the students chose an inductive, pragmatic argument, and only 3 students(16%) thought that such an argument would get the best mark. This result is similar to thefindings of Hoyles and Healy (2007, p. 110) where the two empirical arguments were chosen asown approach by 46% of the students, whereas only 9% of the students thought these argumentswould get the best mark. In fact, we see that at the beginning of our intervention there is no strongpreference of the students on which proof would get the best mark and their choices are ratherevenly spread over all answers (although there is a slight preference for best mark for the twoformal arguments, Georgia’s and Petros’s—21% each). This can be explained by the level of thestudents in geometry at that stage; the students were not familiar with the distinctions betweendifferent kinds of arguments. In Hoyles and Healy’s results the students chose Georgia’s proofto be the one that gets the highest grade both in 1996 and in 2002 (48% and 45% respectively).
Similarly to the Hoyles and Healy research, the students at the beginning of our interventionshowed a slight preference for formal arguments regardless of whether they were correct or not.This indicates that when an argument includes a lot of mathematical symbols, thus being moreformally represented, the students think it will get the best mark. Regarding deductive argu-ments, a sizable minority of students (32%) chose in the pre-test a deductive, valid argument fortheir own approach either in a narrative or in a more logical and deductive form (Georgia’s andLefteris’s proofs). These results are similar to those of Hoyles and Healy (2007, p. 110) where,both in 1996 and in 2002, 29% of the students chose for Goergia’s and Lefteris’s arguments astheir own approach. The difference between our research and that of Hoyles and Healy is thatonly 6 out of 19 students (or 32%) in our intervention thought that these two arguments wouldget the best mark, whereas around 60% of the students in Hoyles and Healy’s research thoughtthat Georgia’s and Lefteris’s argument would receive the best mark (both in 1996 and in 2002).
The picture changes considerably after our intervention. Students do not show a preferenceany more for inductive, empirical proofs (only 2 out of 19, or 10% of the students would stillchoose such proofs) and on the contrary, they show a strong preference for deductive proofs (13students chose Georgia’s answer as their own approach and 5 chose Lefteris’s, both deductive,valid proofs). We interpret this as a result of our intervention where the distinctions betweendeductive and inductive arguments were made clear and deductive arguments were now con-sidered ‘mathematical’ as opposed to inductive arguments. However, the fact that we used thesame task before and after our intervention does not allow us to be certain as to what caused thischange. It is possible that the students made their choice after the intervention by remembering
155
Chapter 8. Conclusions and Discussion
the discussion of the arguments in class, rather than by understanding the distinctions betweendeductive and inductive arguments. However, based also on other results of our study (see Table7.14 on page 99) which show that the students displayed a preference towards deductive proofsalso in earlier tasks, we can conclude that the change was caused by our intervention.
Regarding the appreciation of the validity of proof, as in Hoyles and Healy’s research wefound that “most students appreciate the generality of valid proof” (1998, p. 3) both before andafter our intervention. It is interesting to note that after our intervention fewer students assessedthe generality of the same proof correctly. This could be explained by the fact that the studentsafter our intervention often appeared more critical and doubting regarding arguments in general,and they would not accept any argument if they were not absolutely sure about its validity (seealso results in Section 7.5.2, p. 124).
Finally, regarding the role of proof, Healy and Hoyles (1998, p. 17) present results similar toours for some of the aspects (explanation, discovery) but not for others (truth). At the beginningof our research 21% of the students considered proof as a means to establish truth, a percentagewhich by the end of our intervention was changed to a 37%. We explain this change by the factthat this aspect of proof was stressed a lot during the lessons. This percentage in the researchof Hoyles and Healy was much bigger (50%). The other three functions of proof in Hoyles andHealy’s research were as follows: Explanation 35%, Discovery 1%andNone/Other 28%. Thesenumbers match our numbers before the intervention. However, there is a significant differencein the Discovery aspect of proof which after our intervention changed from 0 to 16%. Discoverywas one of the aspects of proof also stressed in our intervention and the students were frequentlyasked to make their own conjectures and to try to provide arguments for them, which we thinkhelped them understand the aspect of discovery that lies within the concept of proof. Finally, weobserved that a sizeable percentage of students did not know what proof is both before (32%)and after (26%) our intervention. This is similar to the result mentioned by Healy and Hoyles(1998, p. 4) where students with little or no sense of proof were “over one quarter of the sample.”
The design of our teaching intervention Our teaching intervention was largely based on pastresearch, more specifically the Van Hiele theory and the method of discovery learning wherestudents have to make observations about specific figures, formulate conjectures, and try toargue for their truth. However, there was also an innovative element in our design, namely theidea of firstmaking students aware of the distinction between inductive and deductive argumentsbefore offering them opportunities to produce deductive proofs for themselves. Several taskswere designed for this first stage of making the distinction between inductive and deductivearguments. The results of our study showed that this teaching strategy was successful, sincequite early in the intervention the students started realising that there is an important distinctionbetween arguments that are general and arguments that are specific to a figure.
Although our intervention was generally successful, we consider it necessary for it to berepeated on a larger number of students and on a more varied sample (as opposed to our sampleof students motivated in mathematics) in order to make safer conclusions about its effectiveness.We also recommend that more tasks are designed for each stage. Our intervention was rathershort and it would take a longer period of time to ensure that the students have arrived at thedesired Van Hiele level.
We do think that practicing the steps of proving and of discovering geometrical truths in thesame way that mathematicians do, which is how we did it in our intervention, allows students
156
8.2. Discussion and recommendations
to have more confidence in themselves and to understand better the concepts introduced.
Concluding remarks To conclude, I would like to stress that the experience gained during thisresearch for me as a teacher was extremely enjoyable and valuable. Regardless of the specificaims of this project, it was a pleasure to see the students enjoying doing mathematics, and tosee them get excited when discovering mathematical truths on their own, something they didnot think they could do before these lessons. Especially the fact that the students discoveredthrough discussion that Euclidean geometry is based on certain axioms made a huge impressionon them and seemed to be an unforgettable experience. I believe that giving to the students theopportunity to discover geometry rather than imposing on them theorems and propositions mayimprove their abilities in geometry at all levels.
157

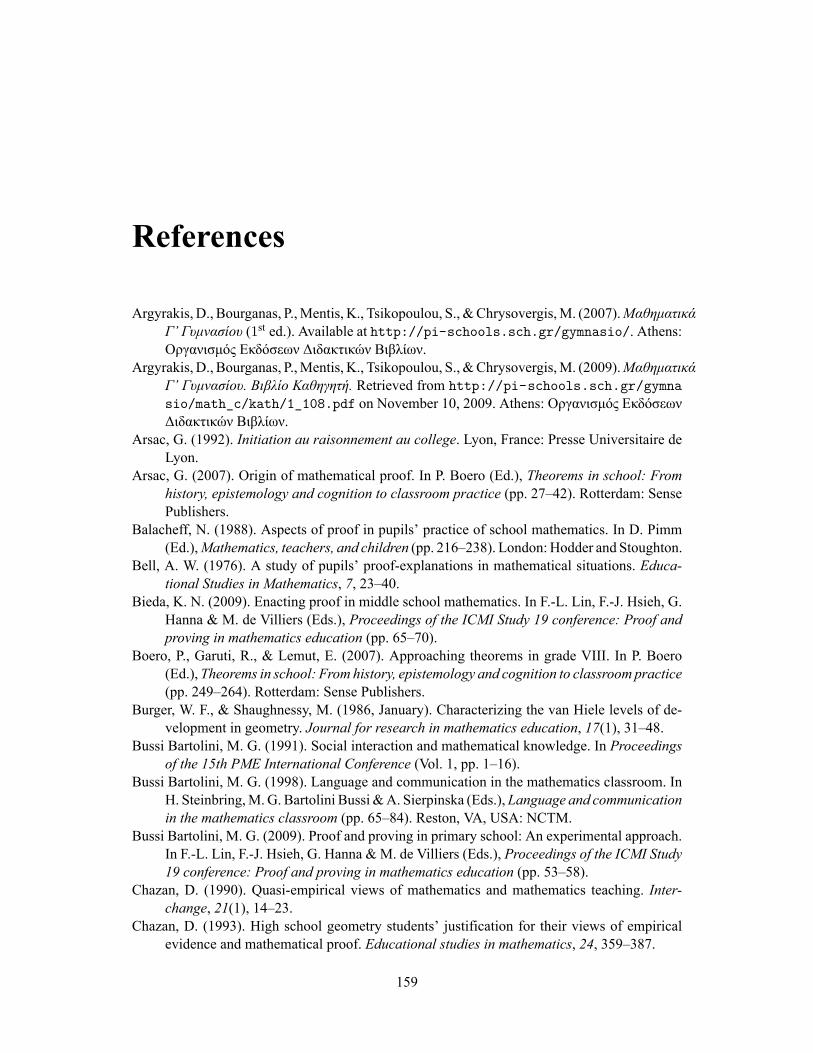
References
Argyrakis, D., Bourganas, P.,Mentis, K., Tsikopoulou, S., &Chrysovergis,M. (2007).ΜαθηματικάΓ’ Γυμνασίου (1st ed.). Available at http://pi-schools.sch.gr/gymnasio/. Athens:Οργανισμός Εκδόσεων Διδακτικών Βιβλίων.
Argyrakis, D., Bourganas, P.,Mentis, K., Tsikopoulou, S., &Chrysovergis,M. (2009).ΜαθηματικάΓ’ Γυμνασίου. Βιβλίο Καθηγητή. Retrieved from http://pi-schools.sch.gr/gymnasio/math_c/kath/1_108.pdf on November 10, 2009. Athens: Οργανισμός ΕκδόσεωνΔιδακτικών Βιβλίων.
Arsac, G. (1992). Initiation au raisonnement au college. Lyon, France: Presse Universitaire deLyon.
Arsac, G. (2007). Origin of mathematical proof. In P. Boero (Ed.), Theorems in school: Fromhistory, epistemology and cognition to classroom practice (pp. 27–42). Rotterdam: SensePublishers.
Balacheff, N. (1988). Aspects of proof in pupils’ practice of school mathematics. In D. Pimm(Ed.),Mathematics, teachers, and children (pp. 216–238). London: Hodder and Stoughton.
Bell, A. W. (1976). A study of pupils’ proof-explanations in mathematical situations. Educa-tional Studies in Mathematics, 7, 23–40.
Bieda, K. N. (2009). Enacting proof in middle school mathematics. In F.-L. Lin, F.-J. Hsieh, G.Hanna & M. de Villiers (Eds.), Proceedings of the ICMI Study 19 conference: Proof andproving in mathematics education (pp. 65–70).
Boero, P., Garuti, R., & Lemut, E. (2007). Approaching theorems in grade VIII. In P. Boero(Ed.), Theorems in school: From history, epistemology and cognition to classroom practice(pp. 249–264). Rotterdam: Sense Publishers.
Burger, W. F., & Shaughnessy, M. (1986, January). Characterizing the van Hiele levels of de-velopment in geometry. Journal for research in mathematics education, 17(1), 31–48.
Bussi Bartolini, M. G. (1991). Social interaction and mathematical knowledge. In Proceedingsof the 15th PME International Conference (Vol. 1, pp. 1–16).
Bussi Bartolini, M. G. (1998). Language and communication in the mathematics classroom. InH. Steinbring,M.G. Bartolini Bussi &A. Sierpinska (Eds.), Language and communicationin the mathematics classroom (pp. 65–84). Reston, VA, USA: NCTM.
Bussi Bartolini, M. G. (2009). Proof and proving in primary school: An experimental approach.In F.-L. Lin, F.-J. Hsieh, G. Hanna &M. de Villiers (Eds.), Proceedings of the ICMI Study19 conference: Proof and proving in mathematics education (pp. 53–58).
Chazan, D. (1990). Quasi-empirical views of mathematics and mathematics teaching. Inter-change, 21(1), 14–23.
Chazan, D. (1993). High school geometry students’ justification for their views of empiricalevidence and mathematical proof. Educational studies in mathematics, 24, 359–387.
159
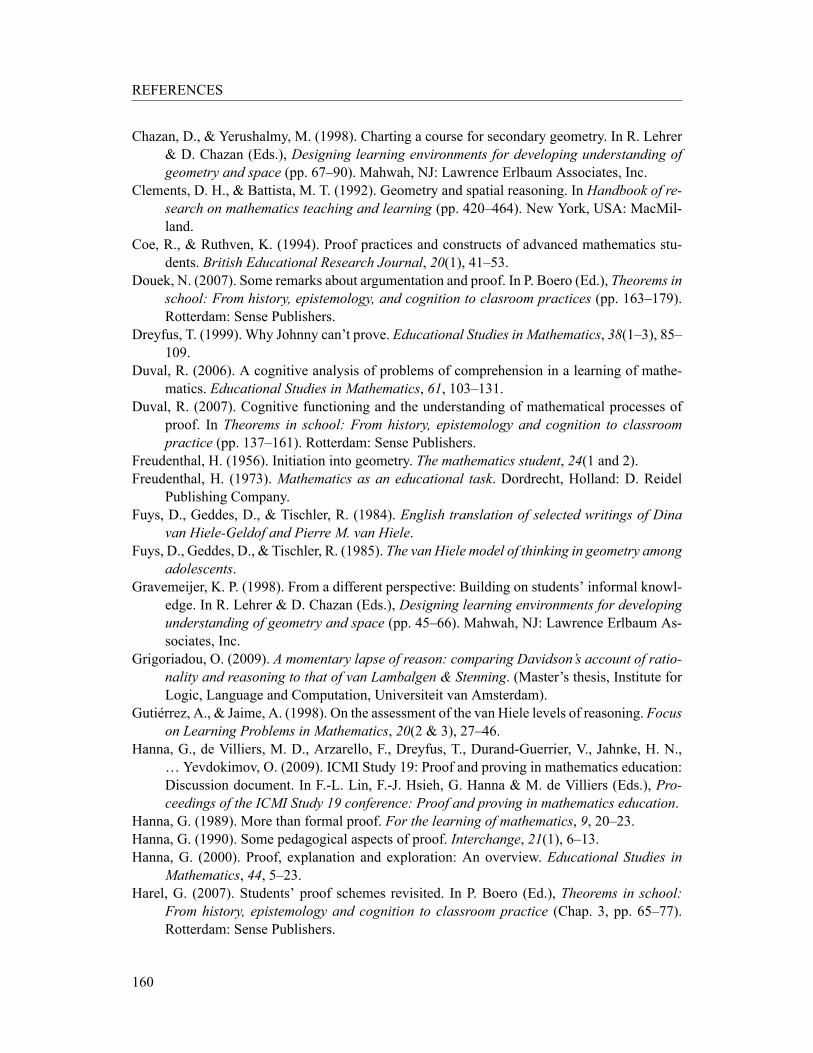
REFERENCES
Chazan, D., & Yerushalmy, M. (1998). Charting a course for secondary geometry. In R. Lehrer& D. Chazan (Eds.), Designing learning environments for developing understanding ofgeometry and space (pp. 67–90). Mahwah, NJ: Lawrence Erlbaum Associates, Inc.
Clements, D. H., & Battista, M. T. (1992). Geometry and spatial reasoning. In Handbook of re-search on mathematics teaching and learning (pp. 420–464). New York, USA: MacMil-land.
Coe, R., & Ruthven, K. (1994). Proof practices and constructs of advanced mathematics stu-dents. British Educational Research Journal, 20(1), 41–53.
Douek, N. (2007). Some remarks about argumentation and proof. In P. Boero (Ed.), Theorems inschool: From history, epistemology, and cognition to clasroom practices (pp. 163–179).Rotterdam: Sense Publishers.
Dreyfus, T. (1999). Why Johnny can’t prove. Educational Studies in Mathematics, 38(1–3), 85–109.
Duval, R. (2006). A cognitive analysis of problems of comprehension in a learning of mathe-matics. Educational Studies in Mathematics, 61, 103–131.
Duval, R. (2007). Cognitive functioning and the understanding of mathematical processes ofproof. In Theorems in school: From history, epistemology and cognition to classroompractice (pp. 137–161). Rotterdam: Sense Publishers.
Freudenthal, H. (1956). Initiation into geometry. The mathematics student, 24(1 and 2).Freudenthal, H. (1973). Mathematics as an educational task. Dordrecht, Holland: D. Reidel
Publishing Company.Fuys, D., Geddes, D., & Tischler, R. (1984). English translation of selected writings of Dina
van Hiele-Geldof and Pierre M. van Hiele.Fuys, D., Geddes, D., & Tischler, R. (1985). The van Hiele model of thinking in geometry among
adolescents.Gravemeijer, K. P. (1998). From a different perspective: Building on students’ informal knowl-
edge. In R. Lehrer & D. Chazan (Eds.), Designing learning environments for developingunderstanding of geometry and space (pp. 45–66). Mahwah, NJ: Lawrence Erlbaum As-sociates, Inc.
Grigoriadou, O. (2009). A momentary lapse of reason: comparing Davidson’s account of ratio-nality and reasoning to that of van Lambalgen & Stenning. (Master’s thesis, Institute forLogic, Language and Computation, Universiteit van Amsterdam).
Gutiérrez, A., & Jaime, A. (1998). On the assessment of the van Hiele levels of reasoning. Focuson Learning Problems in Mathematics, 20(2 & 3), 27–46.
Hanna, G., de Villiers, M. D., Arzarello, F., Dreyfus, T., Durand-Guerrier, V., Jahnke, H. N.,… Yevdokimov, O. (2009). ICMI Study 19: Proof and proving in mathematics education:Discussion document. In F.-L. Lin, F.-J. Hsieh, G. Hanna & M. de Villiers (Eds.), Pro-ceedings of the ICMI Study 19 conference: Proof and proving in mathematics education.
Hanna, G. (1989). More than formal proof. For the learning of mathematics, 9, 20–23.Hanna, G. (1990). Some pedagogical aspects of proof. Interchange, 21(1), 6–13.Hanna, G. (2000). Proof, explanation and exploration: An overview. Educational Studies in
Mathematics, 44, 5–23.Harel, G. (2007). Students’ proof schemes revisited. In P. Boero (Ed.), Theorems in school:
From history, epistemology and cognition to classroom practice (Chap. 3, pp. 65–77).Rotterdam: Sense Publishers.
160

REFERENCES
Harel, G., & Sowder, L. (1998). Students’ proof schemes: Results from exploratory studies.In A. H. Schoenfeld, J. Kaput & E. Dubinsky (Eds.), Research in collegiate mathemat-ics education (Vol. 3, pp. 234–283). Issues in Mathematics Education, Vol. 7. AmericanMathematical Society.
Healy, L., & Hoyles, C. (1998). Jystifying and proving in school mathematics (technical reporton the nationwide survey). University of London.
Hoyles, C., & Kücheman, D. (2002). Students’ understandings of logical implication. Educa-tional Studies in Mathematics, 51, 193–223.
Hoyles, C., & Healy, L. (2007). Curriculum change and geometrical reasoning. In P. Boero(Ed.), Theorems in school: From history, epistemology and cognition to classroom practice(pp. 81–115). Rotterdam: Sense Publishers.
Johnson-Laird, P. N. (1999). Deductive reasoning. Annual Reviews of Psychology, 50, 109–35.Jones, K. (2000). Providing a foundation for deductive reasoning: Students’ interpretations when
using dynamic geometry software and their evolving mathematical explanations. Educa-tional Studies in Mathematics, 44, 55–85.
J. King,&D. Schattschneider (Eds.). (1997).Geometry turned on:Dynamic software in learning,teaching and research. The Mathematical Assosication of America.
Knuth, E. J., Choppin, J.M., &Bieda, K. N. (2009).Middle school students’ production of math-ematical justifications. In D. A. Stylianou, M. L. Blanton & E. J. Knuth (Eds.), Teachingand learning proof accross the grades: A K-16 perspective. New York: Routledge.
Koedinger, K. R. (1998). Conjecturing and argumentation in high-school geometry students. InR. Lehrer & D. Chazan (Eds.), Designing learning environments for developing under-standing of geometry and space (pp. 319–347). Mahwah, NJ: Lawrence Erlbaum Asso-ciates, Inc.
Kruytbosch, D. J. (1936). Avontuurlijk wiskunde onderwijs. Rotterdam.Maher, C., & Martino, M. A. (1996). The development of the idea of mathematical proof: A
5-year case study. Journal for Research in Mathematics Education, 27(2), 194–214.Mariotti, M. A. (2007a). Geometrical proof. In P. Boero (Ed.), Theorems in school: From his-
tory, epistemology and cognition to classroom practice (pp. 285–304). Rotterdam: SensePublishers.
Mariotti, M. A. (2007b). Proof and proving in mathematics education. In A. Guitierrez & P.Boero (Eds.), Handbook of research on the psychology of mathematics education. Rotter-dam: Sense Publishers.
Marrades, R., & Gutiérrez, Á. (2000). Proofs produced by secondary school students learninggeometry in a dynamic computer environment. Educational Studies in Mathematics, 44,87–125.
Mayberry, J. (1983, January). The van Hiele levels of geometric thought in undergraduate pre-service teachers. Journal for Research in Mathematics Education, 14(1), 58–69.
Moore, R. C. (1994).Making the transition to formal proof.Educational Studies inMathematics,27, 249–266.
Ntziachristos, V., & Koleza, E. (1990). Η διδασκαλία της Γεωμετρίας στα σχολεία — ΕπίπεδαP. M. Van Hiele. Μαθηματική Επιθεώρηση, 37, 11–23.
Ntziachristos, V., & Zaranis, N. (2001). Η αξιοποίηση της θεωρίας van Hiele στην κατανόησηγεωμετρικών εννοιών της Α’ Γυμνασίου με την βοήθεια εκπαιδευτικού λογισμικού. Μα-θηματική Επιθεώρηση, 56, 55–74.
161

REFERENCES
Parenti, L., Barberis, M. T., Pastorino, M., & Viglienzone, P. (2007). From dynamic explo-ration to “theory” and “theorems” (from 6th to 8th grades). In P. Boero (Ed.), Theoremsin school: From history, epistemology and cognition to classroom practice (pp. 265–284).Rotterdam: Sense Publishers.
Patsiomitou, S., Barkatsas, A., & Emvalotis, A. (2010, December). Secondary students’ “dy-namic reinvention of geometric proof” through the utilization of linking visual active rep-resentations. Journal of mathematics and technology, (5), 43–56.
Patsiomitou, S., & Emvalotis, A. (2010, February). Students’ movement through Van Hiele lev-els in a dynamic geometry guided reinvention process. Journal of Mathematics and Tech-nology, 18–48.
Piaget, J. (1953). Logic and psychology. Manchester: Manchester University Press.Piaget, J., & Inhelder, B. (1967). The child’s conception of space. New York: W. W. Norton &
Company.Poincaré, H. (1900). C.r. 2éme congrés int. des math. Paris.Porteous, K. (1986). Childrens’ appreciation of the significance of proof. In Proceedings of the
tenth international conference of the psychology of mathematics education (pp. 392–397).London, England.
Rav, Y. (1999). Why do we prove theorems? Philosophia Mathematica, 7(3), 5–41.Recio, A. M., & Godino, J. D. (2001). Institutional and personal meanings of mathematical
proof. Educational Studies in Mathematics, 48, 83–99.Schoenfeld, A. H. (1985). Mathematical problem solving. London: Academic Press.Schoenfeld, A. H. (1989). Explorations of students’ mathematical beliefs and behaviour. Journal
for Research in Mathematics Education, 20(4), 338–355.Senk, S. L. (1989, May). Van Hiele levels and achievement in writing geometry proofs. Journal
for Research in Mathematics Education, 20(3), 309–321.Senk, S. L. (1985). How well do students write geometry proofs? Mathematics Teacher, 78,
448–456.Stanovich, K. E., & West, R. F. (2000). Individual differences in reasoning: Implications for the
rationality debate? Behavioural and brain sciences, 23, 645–726.Stylianides, A. J. (2007). Proof and proving in school mathematics. Journal for Research in
Mathematics Education, 38, 289–321.Stylianides, A. J., & Stylianides, G. J. (2009). Proof constructions and evaluations. Educational
Studies in Mathematics, 72, 237–253.Stylianides, G. J., & Stylianides, A. J. (2008). Proof in school mathematics: Insights from psy-
chological research into students’ ability for deductive reasoning.Mathematical Thinkingand Learning, 10, 103–133.
Szendrei-Radnai, J., & Török, J. (2007). The tradition and role of proof in mathematics educa-tion in Hungary. In P. Boero (Ed.), Theorems in school: From history, epistemology andcognition to classroom practice (pp. 117–130). Rotterdam: Sense Publishers.
Tall, D. (2008). The transition to formal thinking in mathematics. Mathematics Education Re-search Journal, 20(2), 5–24.
Tzifas, N. (2005, October).Ηαξιολόγηση της γεωμετρικής σκέψης των μαθητών της ΔευτεροβάθμιαςΕκπαίδευσης: Επίπεδα van Hiele και διδακτικές προσεγγίσεις με χρήση λογισμικού. (Mas-ter’s thesis, Interdepartmental / Interuniversity Program: Didactics and Methodology ofMathematics — University of Athens, University of Cyprus).
162

REFERENCES
Usiskin, Z. (1982). Van Hiele levels and achievement in secondary school geometry.van Dormolen, J. (1977). Learning to understand what giving a proof really means. Educational
Studies in Mathematics, 8(1), 27–34.Vandoulakis, I., Kalligas, C., & Markakis, N. (2007). Μαθηματικά Α’ γυμνασίου (First). Avail-
able at http://pi- schools.sch.gr/gymnasio/. Athens: Οργανισμός ΕκδόσεωνΔιδακτικών Βιβλίων.
van Hiele-Geldof, D. (1984a). Dissertation of Dina van Hiele-Geldof entitled: The didactics ofgeometry in the lowest class of secondary school. In D. Fuys, D. Geddes & R. Tischler(Eds.), English translation of selected writings of Dina van Hiele-Geldof and Pierre M.van Hiele (pp. 1–214). City University of New York, Brooklyn, NY.
van Hiele-Geldof, D. (1984b). Last article written by Dina van Hiele-Geldof: Didactics of Ge-ometry as learning process for adults. In D. Fuys, D. Geddes & R. Tischler (Eds.), En-glish translation of selected writings of Dina van Hiele-Geldof and Pierre M. van Hiele(pp. 215–233). City University of New York, Brooklyn, NY.
van Hiele, P. M. (1984b). The child’s thought and geometry. In D. Fuys, D. Geddes &R. Tischler(Eds.), English translation of selected writings of Dina van Hiele-Geldof and Pierre M.van Hiele (pp. 243–255). City University of New York, Brooklyn, NY.
van Hiele, P. M. (1986). Structure and insight: A theory of mathematics education. Translationfrom the Dutch. Orlando [Fla.]: Academic Press.
Vlamos, P., Droutsas, P., Presvis, G., & Rekoumis, K. (2007). Μαθηματικά Β’ γυμνασίου (2nded.). Available at http://pi- schools.sch.gr/gymnasio/. Athens: ΟργανισμόςΕκδόσεων Διδακτικών Βιβλίων.
Weber, K. (2001). Student difficulty in constructing proofs: The need for strategic knowledge.Educational Studies in Mathematics, 48(1), 101–119.
Williams, E. (1979).An investigation of senior high school students’ understanding of the natureof mathematical proof. (Doctoral dissertation, University of Alberta, Edmonton, Canada).
Yackel, E., & Cobb, P. (1996). Socio-mathematical norms, argumentation, and autonomy inmathematics. Journal for Research in Mathematics Education, 27(4), 458–477.
Zachos, I. (2000). Αξιολόγηση του επιπέδου Γεωμετρικής σκέψης van Hiele των μαθητών τηςΒ’ τάξης του Λυκείου. In M. Meimaris (Ed.), Θέματα Διδακτικής Μαθηματικών (Vol. 4,pp. 161–179). Athens: Gutenberg.
163

REFERENCES
164
Further Reading
Bell, A. W. (1979). The learning of process aspects of mathematics. Educational Studies inMathematics, 10, 361–387.
Cohen, L., Manion, L., & Morrison, K. (2007). Research methods in education (6th ed.). NewYork: Routledge.
de Villiers, M. D. (1987, November). Research evidence on hierarchical thinking, teachingstrategies and the van Hiele theory: some critical comments (Internal RUMEUS-reportNo. 10). Working document prepared for the Working Conference on Geometry, held atSyracuse University (NY), 11-13 June 1987.
Ericsson, K. A., & Simon, H. A. (1993). Protocol analysis: verbal reports as data (revisededition). Cambridge, MA: Bradford Books / MIT Press.
Ericsson, K. A., & Simon, H. A. (1998). How to study thinking in everyday life: contrastingthink-aloud protocols with descriptions and explanations of thinking. Mind, Culture, andActivity, 5(3), 178–186.
Evans, J. S. B. T., & Over, D. E. (1996). Rationality and reasoning. UK: Psychology Press.Gutiérrez, Á., Jaime, A., & Fortuny, J. M. (1991, May). An alternative paradigm to evaluate
the acquisition of the van Hiele levels. Journal for Research in Mathematics Education,22(3), 237–251.
Hanna, G. (2007). The ongoing value of proof. In P. Boero (Ed.), From history, epistemologyand cognition to classroom practice (pp. 3–16). Sense Publishers.
Hayes, S. C. (1986, May). The case of the silent dog — Verbal reports and the analysis of rules:a review of Ericsson and Simon’s protocol analysis: verbal reports as data. Journal of theExperimental Analysis of Behaviour, 45(3), 351–363.
Kaper, W., & ten Voorde, H. H. (1993). The van Hiele level scheme and a historic text as sourcesof inspiration for designing conept-development leading to entropy. In P. L. Lijnse (Ed.),European research in science education. proceedings of the first Ph. D. summerschool(pp. 310–317).
Klaassen, C. W. J. M., & Lijnse, P. L. (1996). Interpreting students’ and teachers’ discourse inscience classes: an underestimated problem? Journal of Research in Science Teaching, 33,115–134.
Klieme, E., Reiss, K., & Aiso, H. (n.d.). Geometrical competence and understanding of proof:a study based on TIMSS items.
Lakatos, I. (1964, February). Proofs and refutations (IV). The British Journal for the Philosophyof Science, 14(56), 296–342.
Leron, U., & Hazzan, O. (2006). The rationality debate: applications of cognitive psychologyto mathematics education. Educational Studies in Mathematics, 62, 105–126.
Mudaly, V. (2007). Proof and proving in secondary school. Pythagoras, 66, 64–75.
165
FURTHER READING
Nielsen, J., Clemmensen, T., & Yssing, C. (2002). Getting access to what goes on in people’sheads? — reflections on the think-aloud technique. In Proceedings of the Nordic confer-ence on human-computer interaction (Vol. 31).
Olkun, S., Sinoplu, N. B., & Deryakulu, D. (2005, April). Geometric explorations with dynamicgeometry applications based on van hiele levels. International Journal for MathematicsTeaching and Learning. Retrieved from http://www.ex.ac.uk/cimt/ijmtl/ijmenu.htm
Piaget, J. (2008). Intellectual evolution from adolescence to adulthood. Human Development,51, 40–47.
Printezis, I. I. (2006). Η κατηγορική άποψη των επιπέδων van hiele και άλλες οικουμενικέςμέθοδοι των μαθηματικών. (Master’s thesis, Interdepartmental / Interuniversity Program:Didactics andMethodology ofMathematics - University of Athens, University of Cyprus).
Stein, E. (1996). Without good reason: the rationality debate in philosophy and cognitive sci-ence. Oxford: Clarendon Press.
Stenning, K. (2002). Seeing reason: image and language in learning to think. Oxford: OxfordUniversity Press.
Stenning, K., & van Lambalgen, M. (2008). Human reasoning and cognitive science. Cam-bridge, MA: MIT Press.
Tall, D. (1998). The cognitive development of proof: is mathematical proof for all or for some? InZ. Usiskin (Ed.),Developments in school mathematics education around the world (Vol. 4,pp. 117–136). Reston, Virginia: NCTM.
Toumasis, C. (1990, December). The epos of Euclidean geometry in Greek secondary educa-tion (1836-1985): pressure for change and resistance. Educational Studies inMathematics,21(6), 491–508.
van Hiele, P. M. (1984a). Summary of Pierre van Hiele’s dissertation entitled: The problem ofinsight in connection with school children’s insight into the subject-matter of geometry. InD. Fuys, D. Geddes & R. Tischler (Eds.), English translation of selected writings of Dinavan Hiele-Geldof and Pierre M. van Hiele (pp. 235–242). City University of New York,Brooklyn, NY.
Wason, P. (1966). Reasoning. In B. M. Foss (Ed.), New horizons in psychology (pp. 135–151).Harmondsworth: Penguin.
Yin, R. K. (1984). Case study research: design and methods. Beverly Hills, CA: Sage.
166

Appendix A
Pre- and post- tests and questionnaires
167
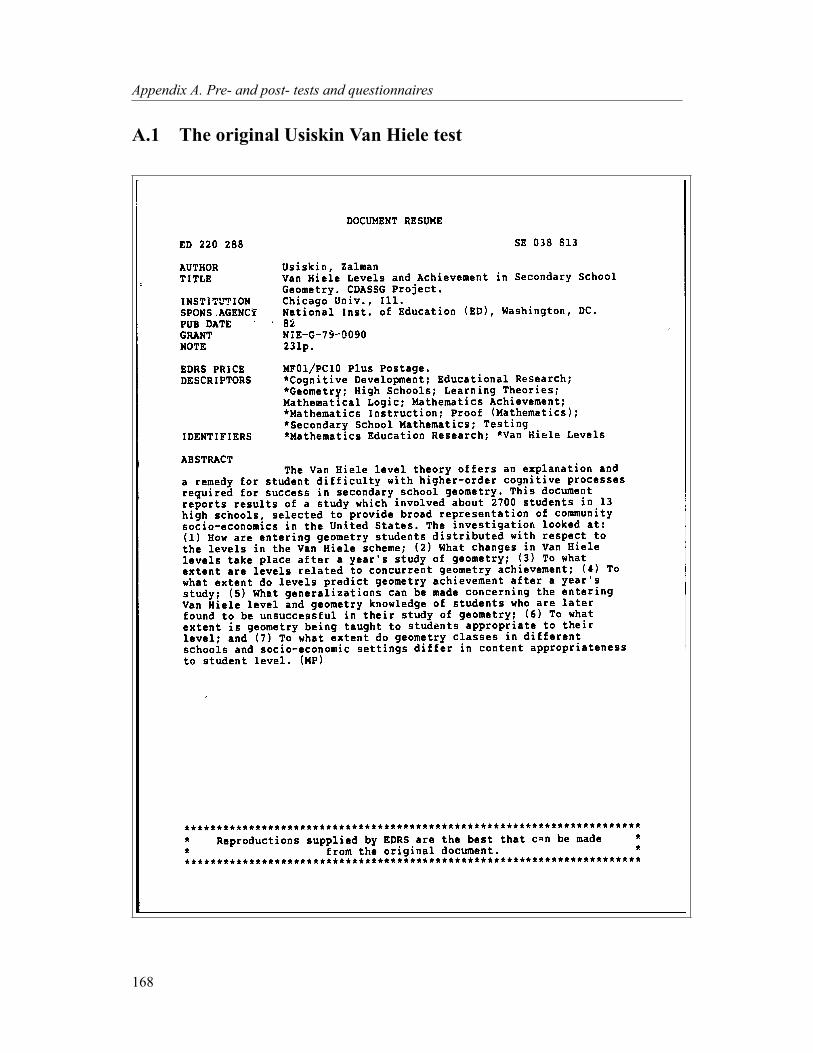
Appendix A. Pre- and post- tests and questionnaires
A.1 The original Usiskin Van Hiele test
168

A.1. The original Usiskin Van Hiele test
169

Appendix A. Pre- and post- tests and questionnaires
170
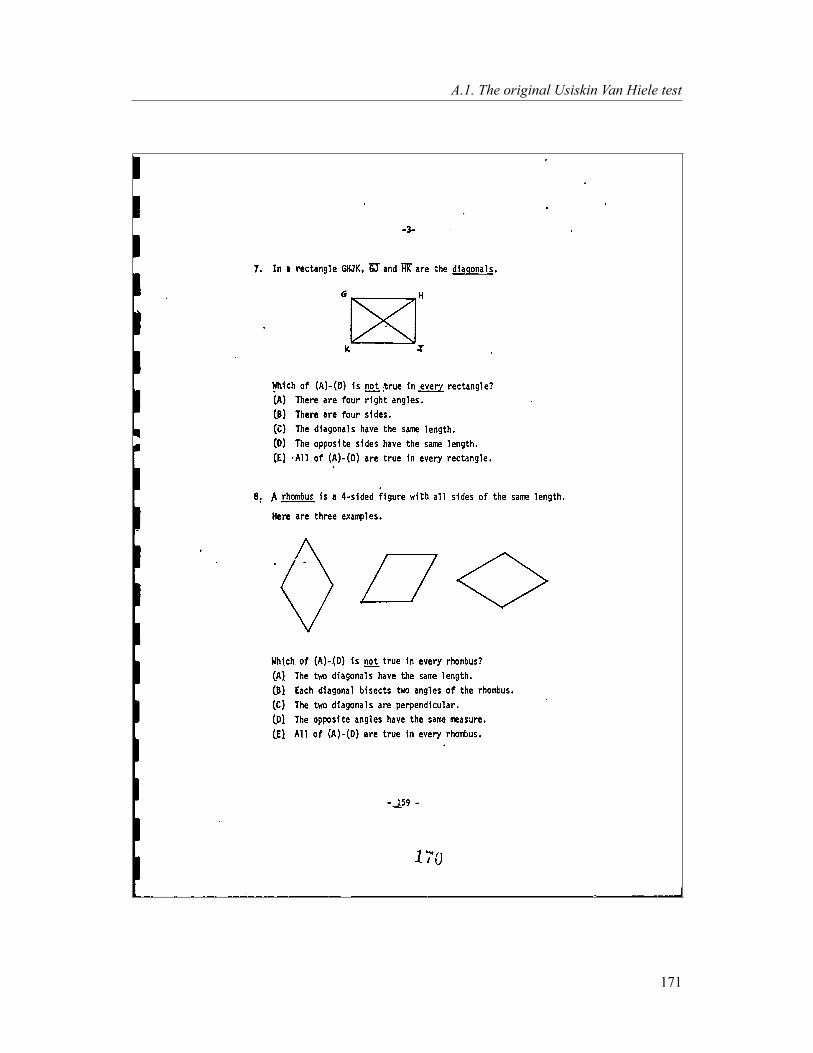
A.1. The original Usiskin Van Hiele test
171
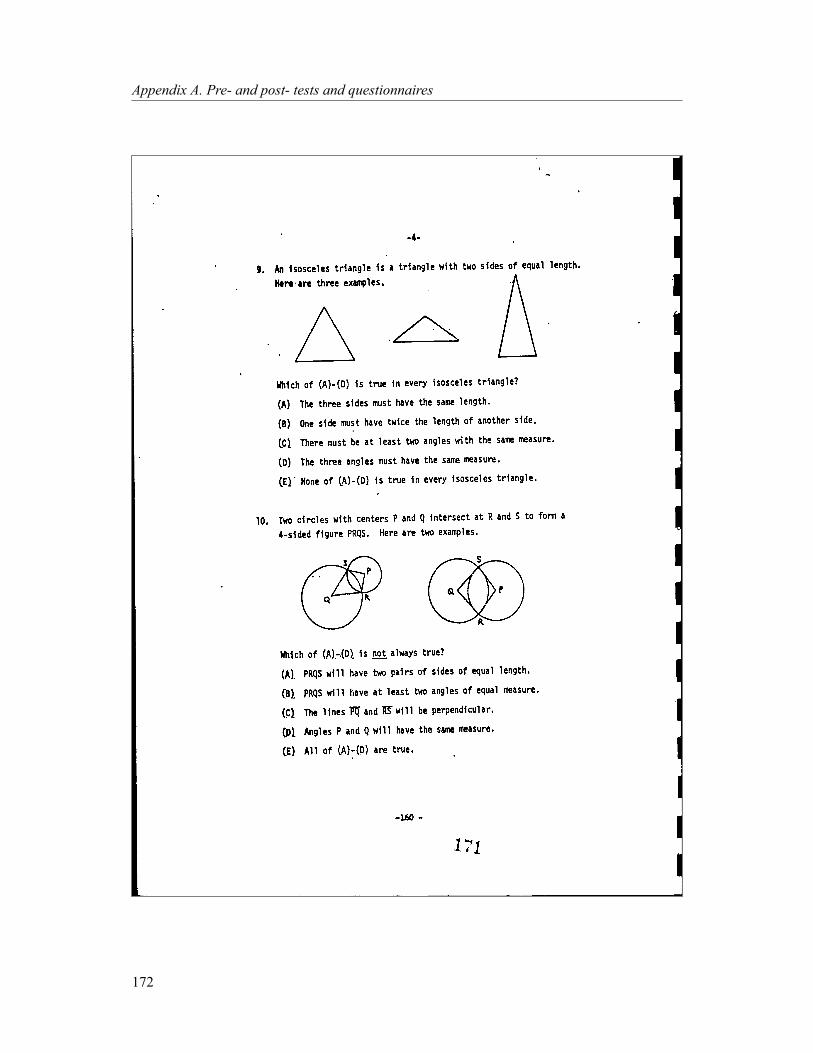
Appendix A. Pre- and post- tests and questionnaires
172
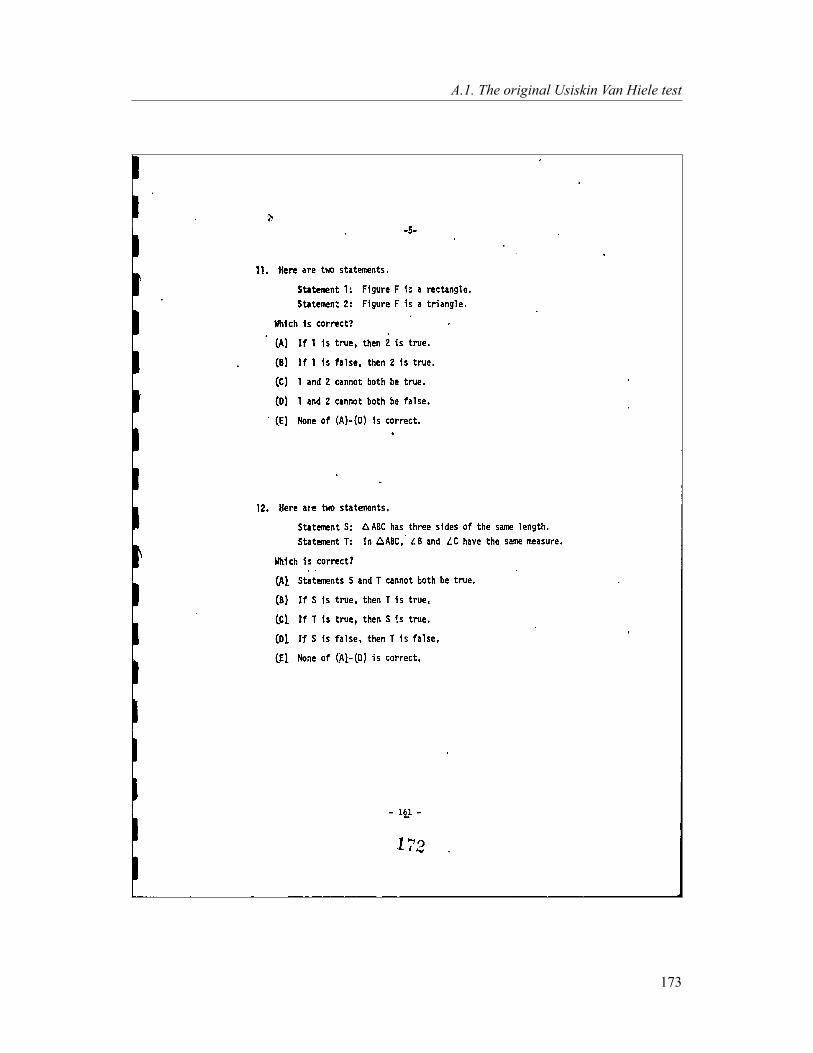
A.1. The original Usiskin Van Hiele test
173
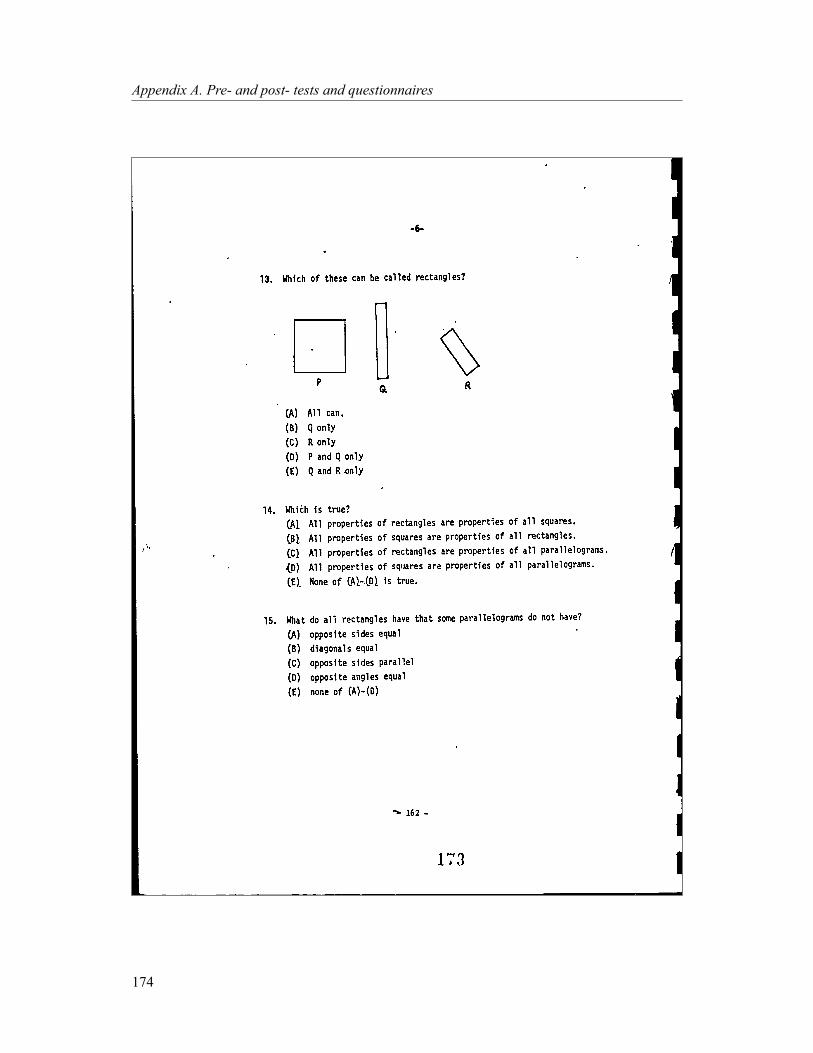
Appendix A. Pre- and post- tests and questionnaires
174

A.1. The original Usiskin Van Hiele test
175

Appendix A. Pre- and post- tests and questionnaires
176
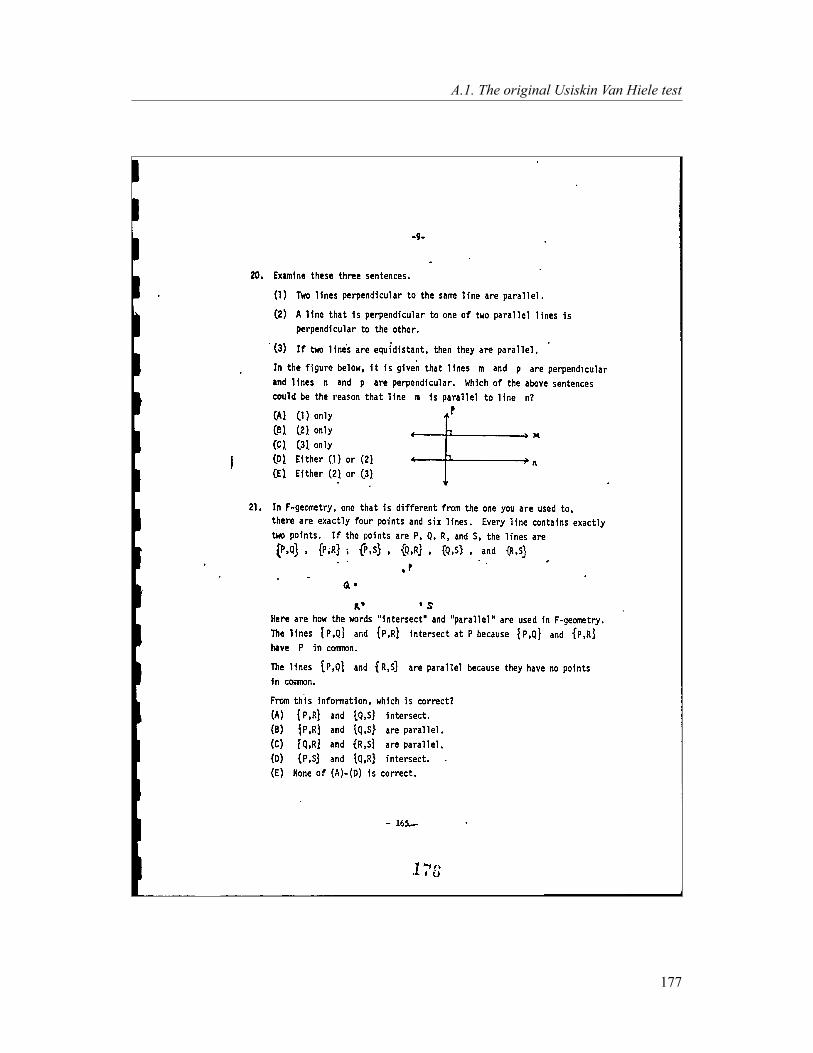
A.1. The original Usiskin Van Hiele test
177

Appendix A. Pre- and post- tests and questionnaires
178
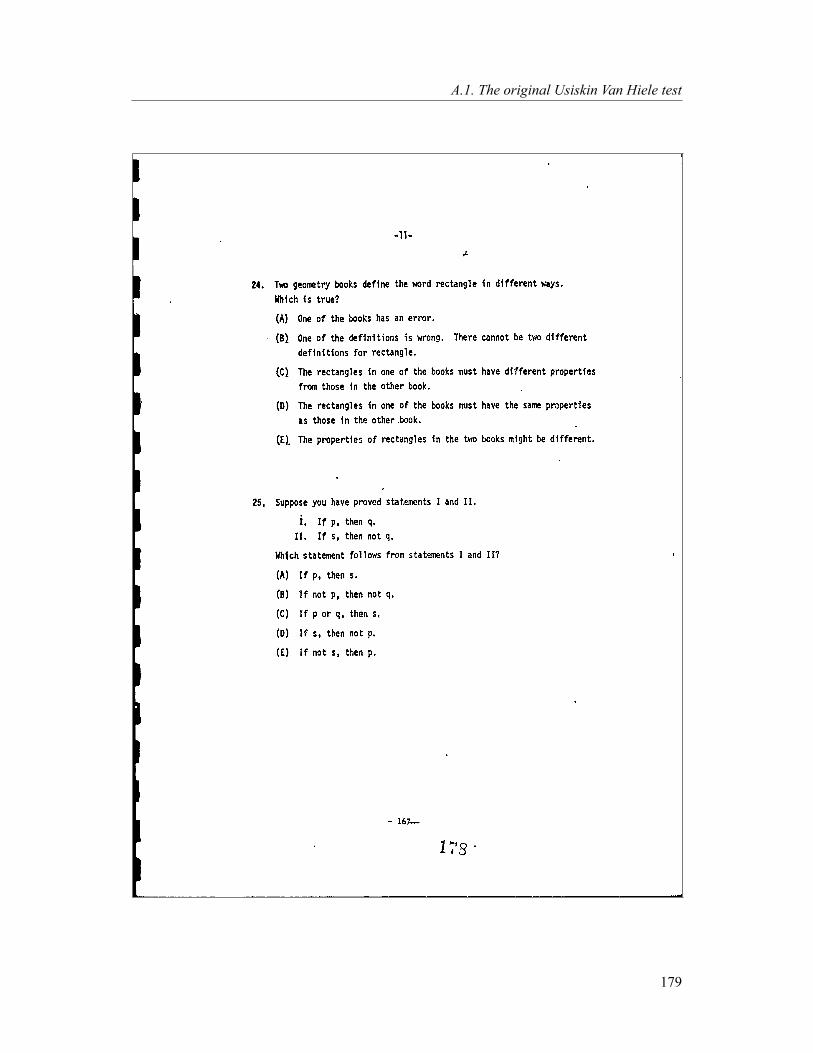
A.1. The original Usiskin Van Hiele test
179

Appendix A. Pre- and post- tests and questionnaires
180

A.2. The Van Hiele test as used in our research
A.2 The Van Hiele test as used in our research
Arijmìc Test:
TEST GEWMETRIAS VAN HIELE
ODHGIES
Mhn anoÐgete autì to test mèqri na sac dojeÐ h entol
Autì to test perièqei 20 erwt seic. Den apaitoÔme na gnwrÐzete ta p�nta pouzhtoÔntai se autì to test.
P�nw dexi� se aut th selÐda up�rqei grammènoc o arijmìc tou test. Antègrayeautì ton arijmì sto antÐstoiqo shmeÐo sto FÔllo Apant sewn.
'Otan dojeÐ h entol na xekin sete:
1. Di�base k�je er¸thsh proseqtik�.
2. Apof�sise poia ap�nthsh nomÐzeic ìti eÐnai h swst . Mìno mÐa ap�nthsh sek�je er¸thsh eÐnai swst . KÔklwse to gr�mma pou antistoiqeÐ sthnap�nths sou sto FÔllo Apant sewn.
3. QrhsimopoÐhse to kenì sto FÔllo Apant sewn gia na sqedi�seic e�nqreiasteÐ. Mh shmei¸neic tÐpota p�nw se autì to test.
4. An jel seic na all�xeic mia ap�nthsh, sb se teleÐwc thn prohgoÔmenhap�nths sou.
5. An qreiasteÐc �llo molÔbi, s kwse to qèri sou.
6. Ja èqeic 35 lept� gia na sumplhr¸seic autì to test.
Perimènete mèqri na sac dojeÐ h entol apì ton kajhght sac na xekin sete.
Copyright c©1980 by the University of Chigaco. Reprinted with the permission of theUniversity of Chicago.
1
181

Tèst GewmetrÐac Van Hiele
1. Poi� apì ta parak�tw eÐnai tetr�gwna?
(A) Mìno to K.
(B) Mìno to L.
(C) Mìno to M.
(D) To L kai to M.
(E) 'Ola eÐnai tetr�gwna.
K L M
2. Poi� apì ta parak�tw eÐnai trÐgwna?
N X O P
(A) Kanèna apì aut� den eÐnai trÐgwno.
(B) Mìno to X.
(C) Mìno to O.
(D) Mìno to O kai to P.
(E) Mìno to X kai to O.
3. Poi� apì ta parak�tw eÐnai orjog¸nia?
R S T
(A) Mìno to R.
(B) Mìno to S.
(C) Mìno to R kai to S.
(D) Mìno to R kai to T.
(E) 'Ola eÐnai orjog¸nia.
Copyright c©1980 by the University of Chigaco. Reprinted with the permission of theUniversity of Chicago.
2
Appendix A. Pre- and post- tests and questionnaires
182

4. Poi� apì ta parak�tw eÐnai tetr�gwna?
U F Q Y
(A) Kanèna apì aut� den eÐnai tetr�gwno.
(B) Mìno to F.
(C) Mìno to U kai to F.
(D) Mìno to F kai to Y.
(E) 'Ola eÐnai tetr�gwna.
5. Poi� apì ta parak�tw eÐnai parallhlìgramma?
A B G
(A) Mìno to A.
(B) Mìno to G.
(C) Mìno to A kai to B.
(D) Kanèna apo aut� den eÐnai parallhlìgrammo.
(D) 'Ola eÐnai parallhlìgramma.
6. To ABGD eÐnai tetr�gwno.
Poi� sqèsh eÐnai al jeia gia k�je tetr�gwno?
(A) AG kai GD èqoun to Ðdio m koc.
(B) BD kai AG eÐnai k�jetec.
(C) AD kai BG eÐnai k�jetec.
(D) AD kai BD èqoun to Ðdio m koc.
(E) H gwnÐa B eÐnai megalÔterh apì thn gwnÐa G.
D
A B
G
Copyright c©1980 by the University of Chigaco. Reprinted with the permission of theUniversity of Chicago.
3
A.2. The Van Hiele test as used in our research
183

7. Se èna orjog¸nio EZHJ, oi EH kai ZJ eÐnai oi diag¸niec.
J
E Z
H
Poi� apì tic apant seic (A)�(D) den eÐnai al jeia gia k�je orjog¸nio?
(A) 'Eqei tèsseric orjèc gwnÐec.
(B) 'Eqei tèsseric pleurèc.
(C) Oi diag¸niec èqoun to Ðdio m koc.
(D) Oi apènanti pleurèc èqoun to Ðdio m koc.
(E) Oi apant seic (A)�(D) eÐnai ìlec al jeia gia k�je orjog¸nio.
8. Rìmboc eÐnai èna 4-pleuro sq ma me ìlec tou tic pleurèc Ðsec. DeÐte trÐaparadeÐgmata:
Poi� apì tic apant seic (A)�(D) den eÐnai al jeia gia k�je rìmbo?
(A) Oi dÔo diag¸niec èqoun to Ðdio m koc.
(B) K�je diag¸nioc diqotomeÐ dÔo gwnÐec tou rìmbou.
(C) Oi dÔo diag¸niec eÐnai k�jetec.
(D) Oi apènanti gwnÐec eÐnai Ðsec.
(E) Oi apant seic (A)�(D) eÐnai ìlec al jeia gia k�je rìmbo.
Copyright c©1980 by the University of Chigaco. Reprinted with the permission of theUniversity of Chicago.
4
Appendix A. Pre- and post- tests and questionnaires
184
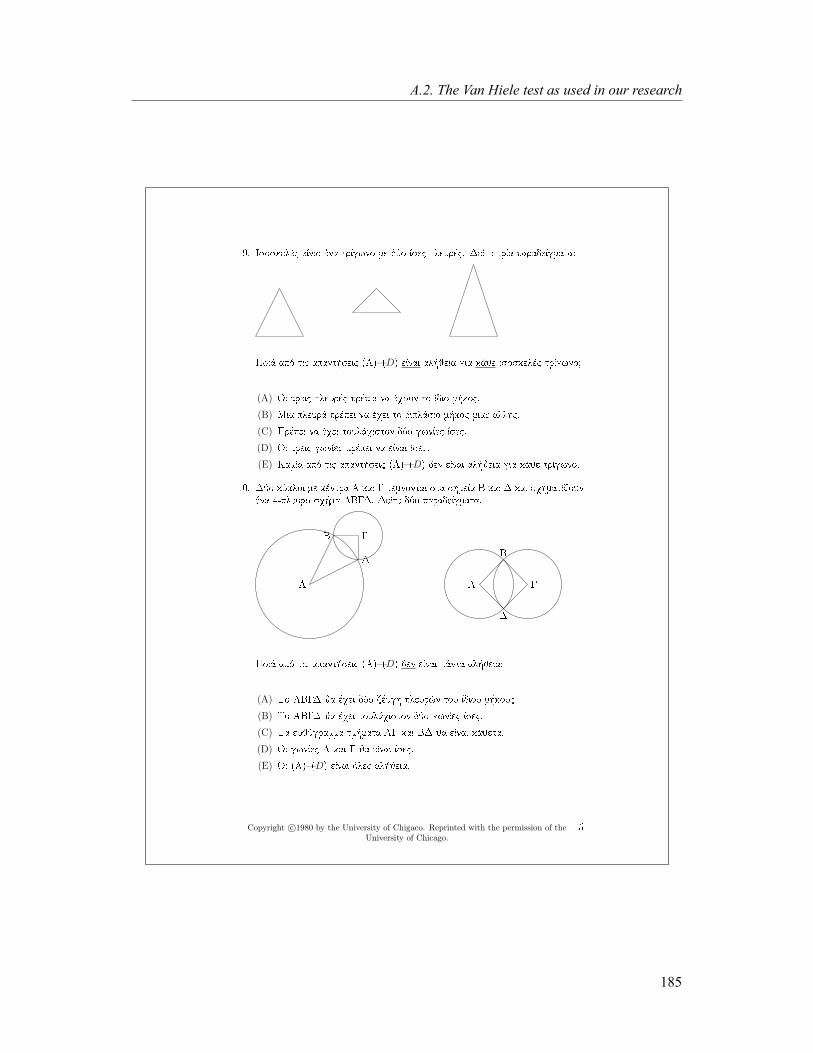
9. Isoskelèc eÐnai èna trÐgwno me dÔo Ðsec pleurèc. DeÐte trÐa paradeÐgmata:
Poi� apì tic apant seic (A)�(D) eÐnai al jeia gia k�je isoskelèc trÐgwno?
(A) Oi treic pleurèc prèpei na èqoun to Ðdio m koc.
(B) Mia pleur� prèpei na èqei to dipl�sio m koc miac �llhc.
(C) Prèpei na èqei toul�qiston dÔo gwnÐec Ðsec.
(D) Oi treic gwnÐec prèpei na eÐnai Ðsec.
(E) KamÐa apì tic apant seic (A)�(D) den eÐnai al jeia gia k�je trÐgwno.
10. DÔo kÔkloi me kèntra A kai G temnontai sta shmeÐa B kai D kai sqhmatÐzounèna 4-pleuro sq ma ABGD. DeÐte dÔo paradeÐgmata.
A
B G
D
A
B
G
D
Poi� apì tic apant seic (A)�(D) den eÐnai p�nta al jeia?
(A) To ABGD ja èqei dÔo zèugh pleur¸n tou Ðdiou m kouc.
(B) To ABGD ja èqei toul�qiston dÔo gwnÐec Ðsec.
(C) Ta eujÔgramma tm mata AG kai BD ja eÐnai k�jeta.
(D) Oi gwnÐec A kai G ja eÐnai Ðsec.
(E) Oi (A)�(D) eÐnai ìlec al jeia.
Copyright c©1980 by the University of Chigaco. Reprinted with the permission of theUniversity of Chicago.
5
A.2. The Van Hiele test as used in our research
185

11. DÐnontai dÔo prot�seic.
Prìtash 1: To sq ma K eÐnai tetr�gwno.
Prìtash 2: To sq ma K eÐnai trÐgwno.
Poiì eÐnai swstì?
(A) An h 1 eÐnai alhj c, tìte h 2 eÐnai alhj c.
(B) An h 1 eÐnai yeud c, tìte h 2 eÐnai alhj c.
(C) Oi 1 kai 2 de mporoÔn na eÐnai kai oi dÔo alhjeÐc.
(D) Oi 1 kai 2 de mporoÔn na eÐnai kai oi dÔo yeudeÐc.
(E) Kanèna apì ta (A)�(D) den eÐnai swstì.
12. DÐnontai dÔo prot�seic.
Prìtash S: To trÐgwno ABG èqei treic Ðsec pleurèc.
Prìtash T : Sto trÐgwno ABG, oi gwnÐec B kai G eÐnai Ðsec.
Poiì eÐnai swstì?
(A) Oi prot�seic S kai T de mporoÔn na eÐnai kai oi dÔo alhjeÐc.
(B) An h S eÐnai alhj c, tìte h T eÐnai alhj c.
(C) An h T eÐnai alhj c, tìte h S eÐnai alhj c.
(D) An h S eÐnai yeud c, tìte h T eÐnai yeud c.
(E) Kanèna apì ta (A)�(D) den eÐnai swstì.
13. Poi� apì ta parak�tw mporoÔn na onomastoÔn orjog¸nia?
P R S
(A) 'Ola mporoÔn.
(B) Mìno to R.
(C) Mìno to S.
(D) Mìno to P kai to R.
(E) Mìno to R kai to S.
Copyright c©1980 by the University of Chigaco. Reprinted with the permission of theUniversity of Chicago.
6
Appendix A. Pre- and post- tests and questionnaires
186
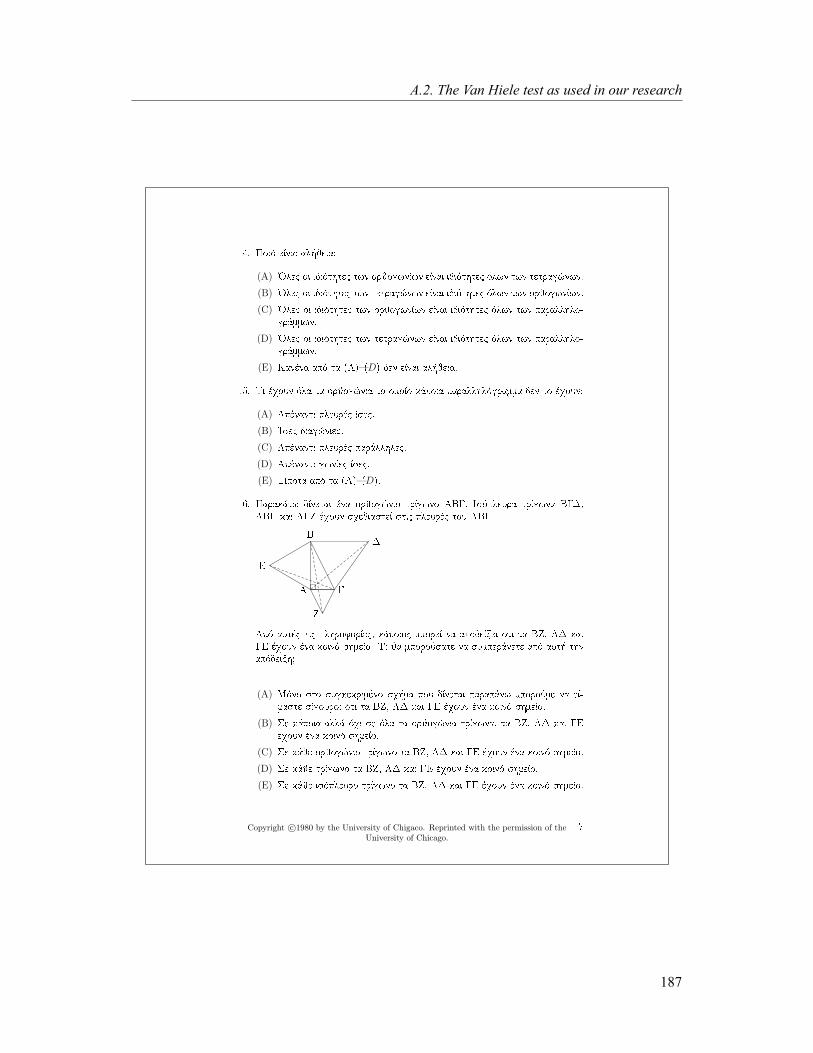
14. Poiì eÐnai al jeia?
(A) 'Olec oi idiìthtec twn orjogwnÐwn eÐnai idiìthtec ìlwn twn tetrag¸nwn.
(B) 'Olec oi idiìthtec twn tetrag¸nwn eÐnai idiìthtec ìlwn twn orjogwnÐwn.
(C) 'Olec oi idiìthtec twn orjogwnÐwn eÐnai idiìthtec ìlwn twn parallhlo-gr�mmwn.
(D) 'Olec oi idiìthtec twn tetrag¸nwn eÐnai idiìthtec ìlwn twn parallhlo-gr�mmwn.
(E) Kanèna apì ta (A)�(D) den eÐnai al jeia.
15. Ti èqoun ìla ta orjog¸nia to opoÐo k�poia parallhlìgramma den to èqoun?
(A) Apènanti pleurèc Ðsec.
(B) 'Isec diag¸niec.
(C) Apènanti pleurèc par�llhlec.
(D) Apènanti gwnÐec Ðsec.
(E) TÐpota apì ta (A)�(D).
16. Parak�tw dÐnetai èna orjog¸nio trÐgwno ABG. Isìpleura trÐgwna BGD,ABE kai AGZ èqoun sqediasteÐ stic pleurèc tou ABG.
A
B
G
D
E
Z
Apì autèc tic plhroforÐec, k�poioc mporeÐ na apodeÐxei oti ta BZ, AD kaiGE èqoun èna koinì shmeÐo. Ti ja mporoÔsate na sumper�nete apì aut thnapìdeixh?
(A) Mìno sto sugkekrimèno sq ma pou dÐnetai parap�nw mporoÔme na eÐ-maste sÐgouroi ìti ta BZ, AD kai GE èqoun èna koinì shmeÐo.
(B) Se k�poia all� ìqi se ìla ta orjog¸nia trÐgwna, ta BZ, AD kai GEèqoun èna koinì shmeÐo.
(C) Se k�je orjog¸nio trÐgwno ta BZ, AD kai GE èqoun èna koinì shmeÐo.
(D) Se k�je trÐgwno ta BZ, AD kai GE èqoun èna koinì shmeÐo.
(E) Se k�je isìpleuro trÐgwno ta BZ, AD kai GE èqoun èna koinì shmeÐo.
Copyright c©1980 by the University of Chigaco. Reprinted with the permission of theUniversity of Chicago.
7
A.2. The Van Hiele test as used in our research
187

17. DÐnontai treic idiìthtec enìc sq matoc.
Idiìthta A: 'Eqei Ðsec diag¸niec.
Idiìthta B: EÐnai tetr�gwno.
Idiìthta G: EÐnai orjog¸nio.
Poiì apì ta parak�tw eÐnai al jeia?
(A) Apì to A sunep�getai to B apì to opoÐo sunep�getai to G.
(B) Apì to A sunep�getai to G apì to opoÐo sunep�getai to B.
(C) Apì to B sunep�getai to G apì to opoÐo sunep�getai to A.
(D) Apì to G sunep�getai to A apì to opoÐo sunep�getai to B.
(E) Apì to G sunep�getai to B apì to opoÐo sunep�getai to A.
18. DÐnontai dÔo prot�seic.
I. An èna sq ma eÐnai orjog¸nio, tìte oi diag¸nièc tou diqotomoÔn h mÐa thn�llh.
II. An oi diag¸niec enìc sq matoc diqotomoÔn h mÐa thn �llh, tìte to sq maeÐnai orjog¸nio.
Poiì apì ta parak�tw eÐnai swstì?
(A) Gia na apodeÐxoume ìti h I eÐnai al jeia, ft�nei na apodeÐxoume ìti h IIeÐnai al jeia.
(B) Gia na apodeÐxoume ìti h II eÐnai al jeia, ft�nei na apodeÐxoume ìti h IeÐnai al jeia.
(C) Gia na apodeÐxoume ìti h II eÐnai al jeia, ft�nei na broÔme èna orjog¸niotou opoÐou oi diag¸niec na diqotomoÔn h mÐa thn �llh.
(D) Gia na apodeÐxoume ìti h II eÐnai yeud c, ft�nei na broÔme èna mh-orjog¸nio tou opoÐou oi diag¸niec na diqotomoÔn h mÐa thn �llh.
(E) Kanèna apì ta (A)�(D) den eÐnai swstì.
Copyright c©1980 by the University of Chigaco. Reprinted with the permission of theUniversity of Chicago.
8
Appendix A. Pre- and post- tests and questionnaires
188

19. Sth gewmetrÐa:
(A) K�je ènnoia mporeÐ na oristeÐ kai k�je alhj c prìtash mporeÐ na apodeiqteÐoti eÐnai al jeia.
(B) K�je ènnoia mporeÐ na oristeÐ all� eÐnai aparaÐthto na upojèsoume otik�poiec sugkekrimènec prot�seic eÐnai alhjeÐc.
(C) K�poiec ènnoiec prèpei na parameÐnoun qwrÐc orismì all� k�je alhj cprìtash mporeÐ na apodeiqteÐ oti eÐnai al jeia.
(D) K�poiec ènnoiec prèpei na parameÐnoun qwrÐc orismì kai eÐnai aparaÐthtona èqoume k�poiec prot�seic tic opoÐec upojètoume oti eÐnai alhjeÐc.
(E) Kanèna apì ta (A)�(D) den eÐnai swstì.
20. Exet�ste tic parak�tw treic prot�seic.
(1) Duo eujeÐec k�jetec sthn Ðdia eujeÐa eÐnai metaxÔ touc par�llhlec.
(2) MÐa eujeÐa h opoÐa eÐnai k�jeth se mÐa apì dÔo par�llhlec eujeÐec eÐnaik�jeth kai sthn �llh.
(3) E�n dÔo eujeÐec isapèqoun h mÐa apì thn �llh, tìte eÐnai par�llhlec.
Sto parak�tw sq ma, dÐnetai ìti oi eujeÐec (e) kai (h) eÐnai k�jetec kai otioi eujeÐec (d) kai (h) eÐnai k�jetec. Poièc apì tic parap�nw prot�seic jamporoÔse na apoteleÐ to lìgo gia ton opoÐo h eujeÐa (e) eÐnai par�llhlh methn eujeÐa (d)?
(A) Mìno h (1).
(B) Mìno h (2).
(C) Mìno h (3).
(D) EÐte h (1) eÐte h (2).
(E) EÐte h (2) eÐte h (3).
(e)
(d)
(h)
Copyright c©1980 by the University of Chigaco. Reprinted with the permission of theUniversity of Chicago.
9
A.2. The Van Hiele test as used in our research
189
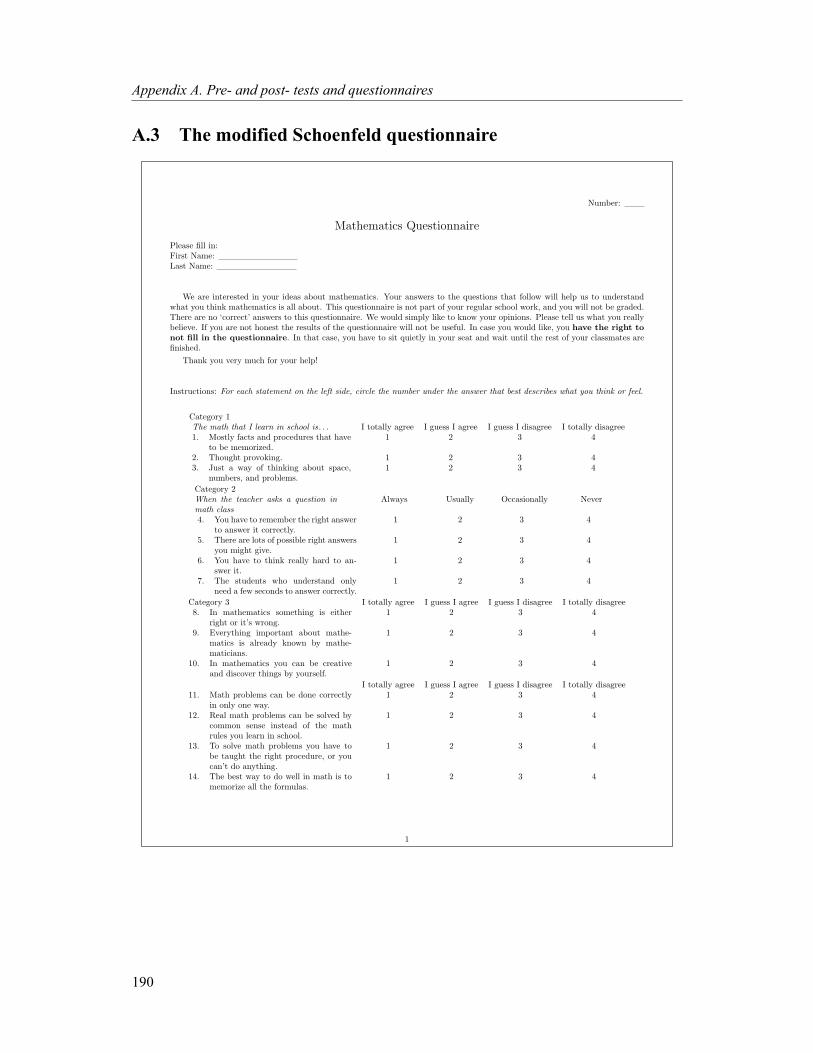
Appendix A. Pre- and post- tests and questionnaires
A.3 The modified Schoenfeld questionnaire
Number:
Mathematics Questionnaire
Please fill in:
First Name:
Last Name:
We are interested in your ideas about mathematics. Your answers to the questions that follow will help us to understand
what you think mathematics is all about. This questionnaire is not part of your regular school work, and you will not be graded.
There are no ‘correct’ answers to this questionnaire. We would simply like to know your opinions. Please tell us what you really
believe. If you are not honest the results of the questionnaire will not be useful. In case you would like, you have the right to
not fill in the questionnaire. In that case, you have to sit quietly in your seat and wait until the rest of your classmates are
finished.
Thank you very much for your help!
Instructions: For each statement on the left side, circle the number under the answer that best describes what you think or feel.
Category 1
The math that I learn in school is. . . I totally agree I guess I agree I guess I disagree I totally disagree
1. Mostly facts and procedures that have
to be memorized.
1 2 3 4
2. Thought provoking. 1 2 3 4
3. Just a way of thinking about space,
numbers, and problems.
1 2 3 4
Category 2
When the teacher asks a question in
math class
Always Usually Occasionally Never
4. You have to remember the right answer
to answer it correctly.
1 2 3 4
5. There are lots of possible right answers
you might give.
1 2 3 4
6. You have to think really hard to an-
swer it.
1 2 3 4
7. The students who understand only
need a few seconds to answer correctly.
1 2 3 4
Category 3 I totally agree I guess I agree I guess I disagree I totally disagree
8. In mathematics something is either
right or it’s wrong.
1 2 3 4
9. Everything important about mathe-
matics is already known by mathe-
maticians.
1 2 3 4
10. In mathematics you can be creative
and discover things by yourself.
1 2 3 4
I totally agree I guess I agree I guess I disagree I totally disagree
11. Math problems can be done correctly
in only one way.
1 2 3 4
12. Real math problems can be solved by
common sense instead of the math
rules you learn in school.
1 2 3 4
13. To solve math problems you have to
be taught the right procedure, or you
can’t do anything.
1 2 3 4
14. The best way to do well in math is to
memorize all the formulas.
1 2 3 4
1
190

Category 4 I totally agree I guess I agree I guess I disagree I totally disagree
When you get the wrong answer to a
math problem. . .
15. It is absolutely wrong—there’s no
room for argument.
1 2 3 4
16. You only find out when it’s different
from the book’s answer or when the
teacher tells you.
1 2 3 4
17. You have to start all over in order to
do it right.
1 2 3 4
Category 5 I totally agree I guess I agree I guess I disagree I totally disagree
When I do a geometry proof . . .
18. I can only verify something as mathe-
matician has already shown to be
1 2 3 4
19. The key thing is to get the statements
and reasons in proper form.
1 2 3 4
20. I get a better understanding of math-
ematical thinking.
1 2 3 4
21. I’m finished if I can’t remember the
next step.
1 2 3 4
22. I can discover things about geometry
that I haven’t been taught.
1 2 3 4
23. I’m doing school math that has noth-
ing to do with the real world.
1 2 3 4
24. I feel like I am doing something useful. 1 2 3 4
Category 6 I totally agree I guess I agree I guess I disagree I totally disagree
25. Geometrical constructions have little
to do with other things in geometry
like proofs and theorems.
1 2 3 4
26. A construction is easy to figure out
even if I’ve forgotten exactly how to
do it.
1 2 3 4
Category 7
Instructions: Answer each of the following questions in a sentence or two. Write your answer in the space below
each question.
27. Why do you think so much time in geometry classes is spent learning to write proofs?
28. What can you do if you get stuck while doing a math problem?
29. In what way, if any, is the math you ’ve studied useful?
30. Do you think that students can discover mathematics on their own, or does all mathematics have to be shown to
them? Please explain.
31. If you understand the material, how long should it take to solve a typical homework problem? What is a reasonable
amount of time to work on a problem before you know it’s impossible.
32. How important is memorizing in learning mathematics? If anything else is important, please explain how.
2
A.3. The modified Schoenfeld questionnaire
191
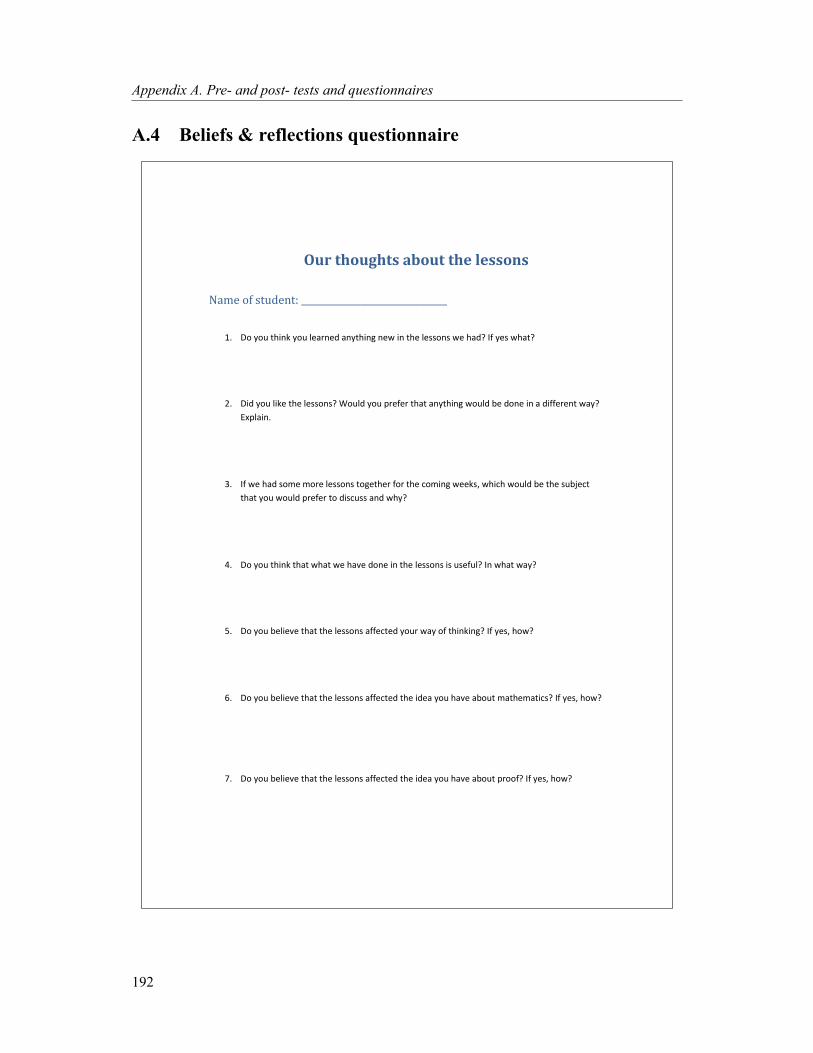
Appendix A. Pre- and post- tests and questionnaires
A.4 Beliefs & reflections questionnaire
Our thoughts about the lessons
Name of student: ________________________________
1. Do you think you learned anything new in the lessons we had? If yes what?
2. Did you like the lessons? Would you prefer that anything would be done in a different way?
Explain.
3. If we had some more lessons together for the coming weeks, which would be the subject
that you would prefer to discuss and why?
4. Do you think that what we have done in the lessons is useful? In what way?
5. Do you believe that the lessons affected your way of thinking? If yes, how?
6. Do you believe that the lessons affected the idea you have about mathematics? If yes, how?
7. Do you believe that the lessons affected the idea you have about proof? If yes, how?
192

193

Appendix B. Task related worksheets
Appendix B
Task related worksheets
B.1 TRIANGLES
1
TASK 1 (Triangles)
Name of student: __________________________________________
1. Draw in the following box a triangle.
2. Draw in the following box a triangle that is different from the previous in some way, and describe in
what way it is different.
3. Draw in the following box a triangle that is different from the previous two in some way, and describe
in what way it is different.
194

2
4. How many different triangles you think you could draw? Can you give some more examples and
describe how they would be different from the ones you have already drawn in the previous page? Use
the space in the following box to do that.
B.1. TRIANGLES
195
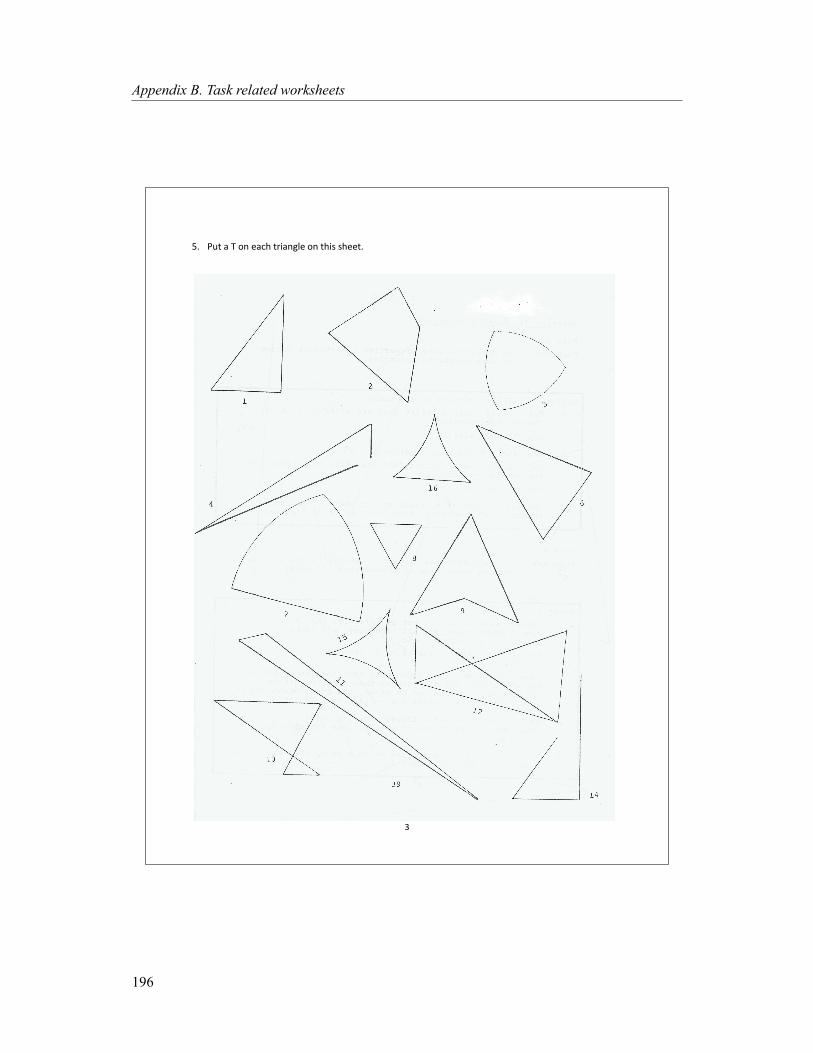
3
5. Put a T on each triangle on this sheet.
Appendix B. Task related worksheets
196
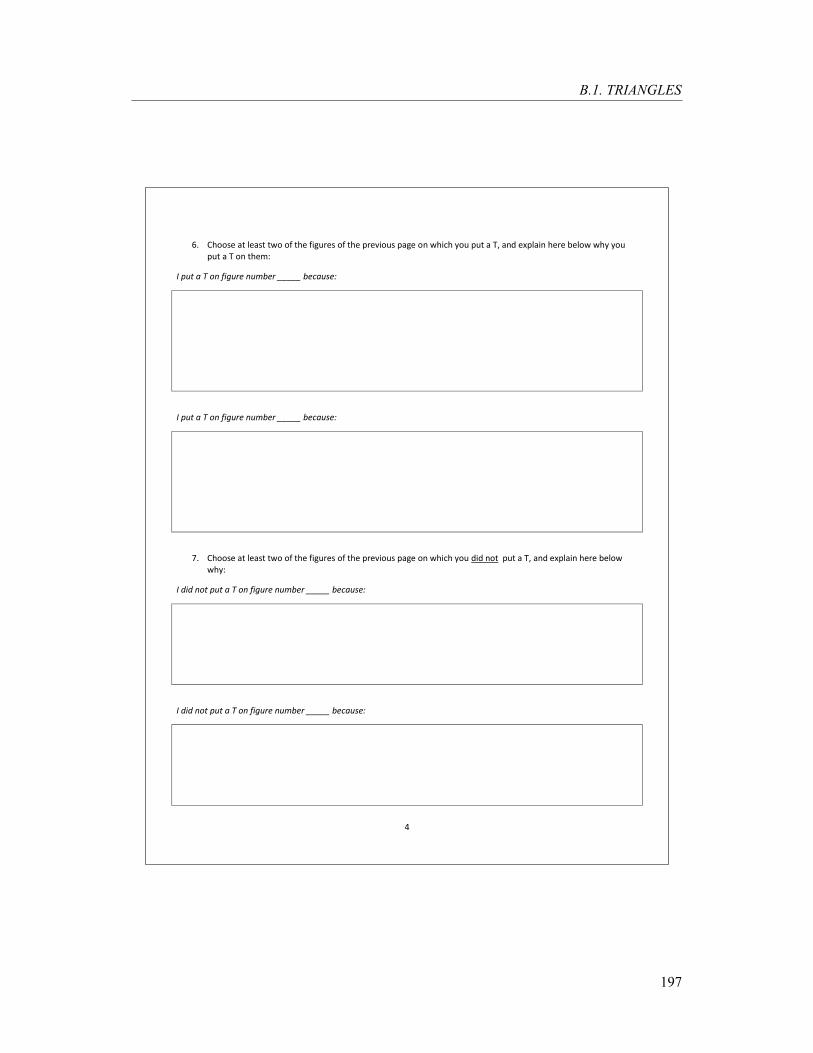
4
6. Choose at least two of the figures of the previous page on which you put a T, and explain here below why you
put a T on them:
I put a T on figure number _____ because:
I put a T on figure number _____ because:
7. Choose at least two of the figures of the previous page on which you did not put a T, and explain here below
why:
I did not put a T on figure number _____ because:
I did not put a T on figure number _____ because:
B.1. TRIANGLES
197
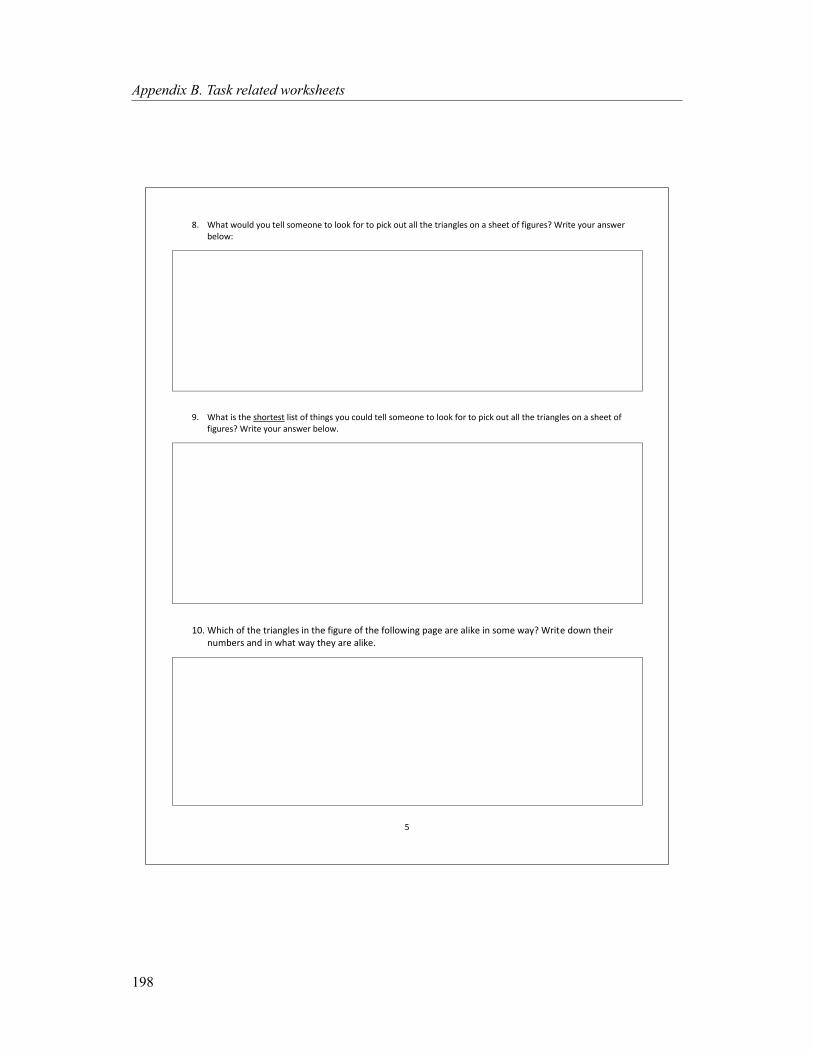
5
8. What would you tell someone to look for to pick out all the triangles on a sheet of figures? Write your answer
below:
9. What is the shortest list of things you could tell someone to look for to pick out all the triangles on a sheet of
figures? Write your answer below.
10. Which of the triangles in the figure of the following page are alike in some way? Write down their
numbers and in what way they are alike.
Appendix B. Task related worksheets
198
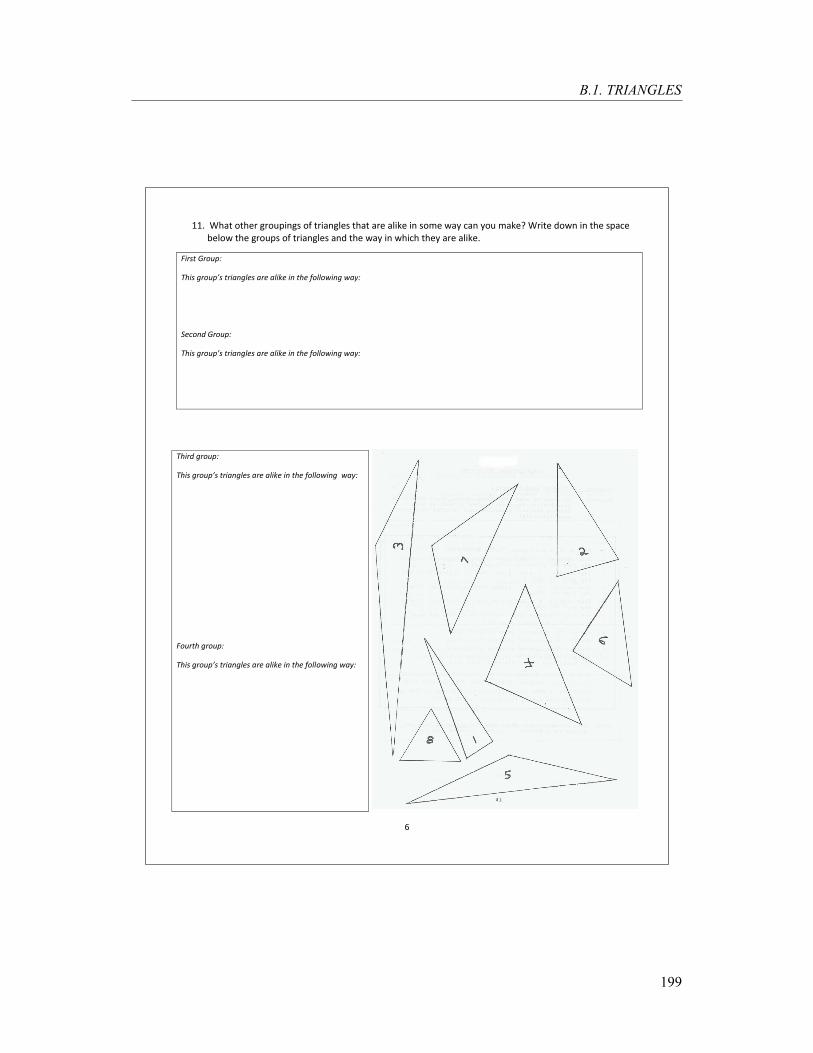
6
11. What other groupings of triangles that are alike in some way can you make? Write down in the space
below the groups of triangles and the way in which they are alike.
First Group:
Tエキゲ ェヴラ┌ヮげゲ デriangles are alike in the following way:
Second Group:
Tエキゲ ェヴラ┌ヮげゲ デヴキ;ミェノWゲ ;ヴW ;ノキニW キミ デエW aラノノラ┘キミェ ┘;┞ぎ
Third group:
Tエキゲ ェヴラ┌ヮげゲ デヴキ;ミェノWゲ ;ヴW ;ノキニW キミ デエW aラノノラ┘キミェ ┘;┞ぎ
Fourth group:
Tエキゲ ェヴラ┌ヮげゲ デヴキ;ミェノWゲ ;ヴW ;ノキニW キミ デエW aラノノowing way:
B.1. TRIANGLES
199
Appendix B. Task related worksheets
B.2 ANGLE SUM
1
Task 3 (part 1)
Name of student: __________________________________________________
Show that the sum of the angles of any triangle is 180 degrees. Give explanations for your arguments.
200
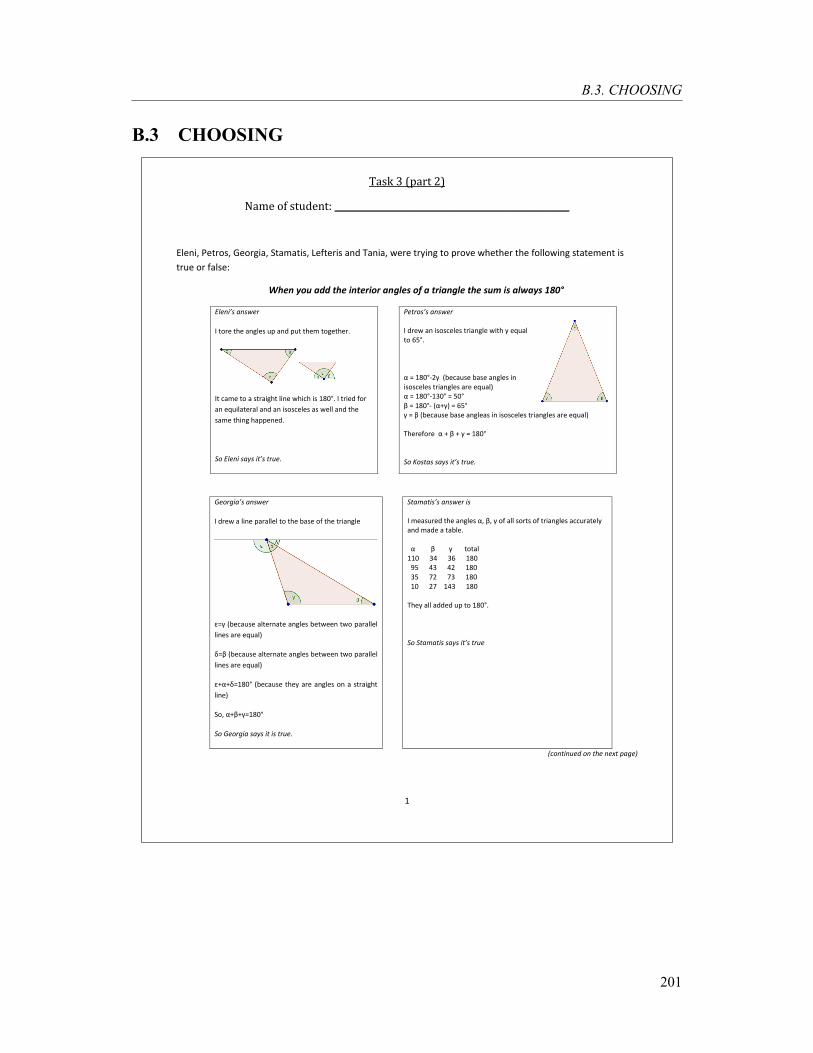
B.3. CHOOSING
B.3 CHOOSING
1
Task 3 (part 2)
Name of student: _____________________________________________________
Eleni, Petros, Georgia, Stamatis, Lefteris and Tania, were trying to prove whether the following statement is
true or false:
When you add the interior angles of a triangle the sum is always 180°
EノWミキげゲ ;ミゲ┘Wヴ
I tore the angles up and put them together.
It came to a straight line which is 180°. I tried for
an equilateral and an isosceles as well and the
same thing happened.
Sラ EノWミキ ゲ;┞ゲ キデげゲ デヴ┌Wく
Petrosげゲ ;ミゲ┘Wヴ
I drew an isosceles triangle with á equal
to 65°.
ü = 180°-2á (because base angles in
isosceles triangles are equal)
ü = 180°-130° = 50°
é = 180°- (ü+á) = 65°
á = é (because base angleas in isosceles triangles are equal)
Therefore ü + é + á = 180°
Sラ Kラゲデ;ゲ ゲ;┞ゲ キデげゲ デヴ┌Wく
GWラヴェキ;げゲ ;ミゲ┘Wヴ
I drew a line parallel to the base of the triangle
0=á (because alternate angles between two parallel
lines are equal)
~=é (because alternate angles between two parallel
lines are equal)
0+ü+~=180° (because they are angles on a straight
line)
So, ü+é+á=180°
So Georgia says it is true.
Sデ;マ;デキゲげゲ ;ミゲ┘Wヴ キゲ
I measured the angles ü, éが á ラa ;ノノ ゲラヴデゲ ラa デヴキ;ミェノWゲ ;II┌ヴ;デWノ┞ and made a table.
ü é á total
110 34 36 180
95 43 42 180
35 72 73 180
10 27 143 180
They all added up to 180°.
Sラ Sデ;マ;デキゲ ゲ;┞ゲ キデげゲ デヴ┌W
(continued on the next page)
201

2
LWaデWヴキゲげゲ ;ミゲ┘Wヴ
If we walk around the edge of triangle もゆよ starting at も (and
looking at よ) passing through よ, and then through ゆ ending up
back to も making an extra turn to end up looking towards the
point we started (that is, よ), then we must have turned 360°
because we came back in exactly the same position. We have
made three turns: One at よ (angle á0¨), then one at ゆ (angle é0¨),
and finally one at A in order to return looking towards the same
point (angle ü0¨). These three turns together must be 360°.
We can see that every
exterior angle when
added to the
corresponding interior
gives 180° because
together they form a
straight line. This
gives as a sum of
(ü+ü0¨)+(é+é0¨)+(á+á0¨)
=180+180+180=540°.
In order to calculate
the sum ü+é+á we
subtract from the above sum the sum of the turns we made,
that is we subtract the sum of ü0¨+é0¨+á0¨ which we know is
360°.
Therefore üЩéЩáЭヵヴヰ-360=180°
Sラ LWaデWヴキゲ ゲ;┞ゲ キデげゲ デヴ┌Wく
T;ミキ;げゲ ;ミゲ┘Wヴ
I drew a tessellation of triangles and marked all the equal angles. All
triangles on the tessellation are equal, and each triangle has a yellow, a
red and a blue angle.
I know that the angles around a point add up to 360°.
I can conclude that the sum of a red, a blue and a yellow angle is 180°.
So Tania says itげs true.
K;ノノキラヮキげゲ ;ミ┘Wヴ
The two sides of a triangle ABC are being rotated in opposite directions through the vertices B and
C, respectively, until their angles with the segment BC are 90° (Figures a, b). This action transforms
デエW デヴキ;ミェノW ABC キミデラ デエW aキェ┌ヴW AげBCAげげが ┘エWヴW AげB ;ミS AげげC ;ヴW ヮWヴヮWミSキI┌ノ;ヴ デラ デエW ゲWェマWミデ BCく In figure b, the sum of the angles B and C is 180°. Tラ IヴW;デW デエW ラヴキェキミ;ノ デヴキ;ミェノWが デエW ゲWェマWミデゲ AげB ;ミS AげげC ;ヴW デキノデWS デラ┘;ヴSゲ W;Iエ ラデエWヴ ┌ミデキノ デエW ヮラキミデゲ Aげが Aげげ マWヴェW H;Iニ キミデラ ; ヮラキミデ ふFキェ┌ヴW Iぶく In
Sラキミェ ゲラ ┘W ノラゲW デ┘ラ ヮキWIWゲ ふキくWく ;ミェノWゲ AげBC ;ミS AげげCBぶ aヴラマ デエW Γヰ° angles B and C, but at the
same time we gain these pieces back in creating angle A. So A+B+C=180°.
Sラが K;ノノキラヮキ ゲ;┞ゲ キデげゲ デヴ┌Wく
Appendix B. Task related worksheets
202

3
Answer the following questions:
1) Whose method would you choose in order to check whether the above statement is true or false? Explain why.
2) Whose answer you find more convincing and why?
3) Whose answer you think would get the highest grade in a test and why?
4) Whose answer is easier for you to understand and whose is more difficult?
In the following boxes circle the number that suits your ideas best.
Stamatisげゲ ;ミゲ┘Wヴぐ Agree Dラミげデ ニミラ┘ Disagree
Shows that the statement is always true 1 2 3
Only shows that the statement is true for
some triangles
1 2 3
Shows you why the statement is true 1 2 3
Is an easy way to explain to someone in
class.
1 2 3
Comments: (In this box you can write any comments you might have on the answers you gave above.)
B.3. CHOOSING
203

4
GWラヴェキ;げゲ ;ミゲ┘Wヴぐ Agree Dラミげデ ニミラ┘ Disagree
Shows that the statement is always true 1 2 3
Only shows that the statement is true for
some triangles
1 2 3
Shows you why the statement is true 1 2 3
Is an easy way to explain to someone in
class.
1 2 3
Comments: (In this box you can write any comments you might have on the answers you gave above)
LWaデWヴキゲげゲ ;ミゲ┘Wヴぐ Agree Dラミげデ know Disagree
Shows that the statement is always true 1 2 3
Only shows that the statement is true for
some triangles
1 2 3
Shows you why the statement is true 1 2 3
Is an easy way to explain to someone in
class.
1 2 3
Comments: (In this box you can write any comments you might have on the answers you gave above)
Kalliopisげゲ ;ミゲ┘Wヴぐ Agree Dラミげデ ニミラ┘ Disagree
Shows that the statement is always true 1 2 3
Only shows that the statement is true for
some triangles
1 2 3
Shows you why the statement is true 1 2 3
Is an easy way to explain to someone in
class.
1 2 3
Comments: (In this box you can write any comments you might have on the answers you gave above)
Appendix B. Task related worksheets
204

B.4. CONCEPTIONS ABOUT PROOF
B.4 CONCEPTIONS ABOUT PROOF
1
Task 3 (part 3)
Name of student: ___________________________________________________
Please answer the following questions:
1. Wエ;デ Sラ ┞ラ┌ デエキミニ キゲ さproofざ in mathematics? Explain.
2. Do we really need to prove things in mathematics? Cラ┌ノSミげデ ┘W ゲキマヮノ┞ ェWデ ;┘;┞ ┘キデエラ┌デ キデい
3. Suppose it has now been proved that, when you add the interior angles of any triangle, your answer is
always 180°.
Zoe asks what needs to be done to prove whether, when you add the interior angles of any right-
angled triangle, your answer is always 180°.
Tick either A or B.
(A) ZラW SラWゲミげデ ミWWS デラ Sラ ;ミ┞デエキミェき the first statement has already proved this.
(B) Zoe needs to construct a new proof.
Please explain your choice.
205
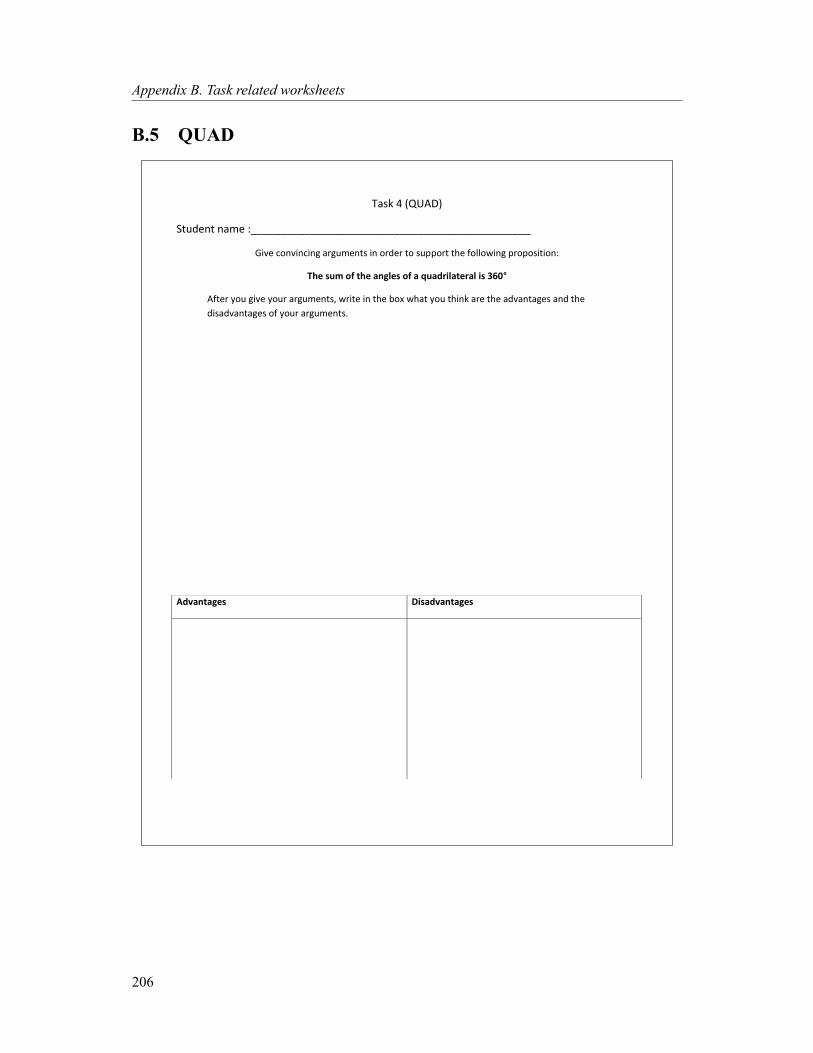
Appendix B. Task related worksheets
B.5 QUAD
Task 4 (QUAD)
Student name :_______________________________________________
Give convincing arguments in order to support the following proposition:
The sum of the angles of a quadrilateral is 360°
After you give your arguments, write in the box what you think are the advantages and the
disadvantages of your arguments.
Advantages Disadvantages
206

B.6. OPPANG
B.6 OPPANG
1
Task 5 (OPPANG)
Name of student: ________________________________________________________________
1. Write down your ラ┘ミ さデエWラヴ┞ざ aラヴ デエW ヴWノ;デキラミゲ デエ;デ エラノSゲ HWデ┘WWミ デエW ;ミェノWゲ デエ;デ ;ヴW aラヴマWS ┘エWミ two lines are intersected.
2. Gキ┗W ;ヴェ┌マWミデゲ キミ ラヴSWヴ デラ ゲ┌ヮヮラヴデ ┞ラ┌ヴ さデエWラヴ┞ざ ゲラ デエ;デ ミラ ラミW I;ミ Sキゲヮヴラ┗W ┞ラ┌く
207
Appendix B. Task related worksheets
B.7 BIS
Task 6 (BIS)
Student Name:_______________________________________________
1. Give arguments in order to support the proposition which is written on the board [the angle
formed between the bisectors of two consecutive and complementary angles is right]. Give two
kinds of arguments. One practical that depends on the figure and one theoretical that does not
depend on the figure.
208
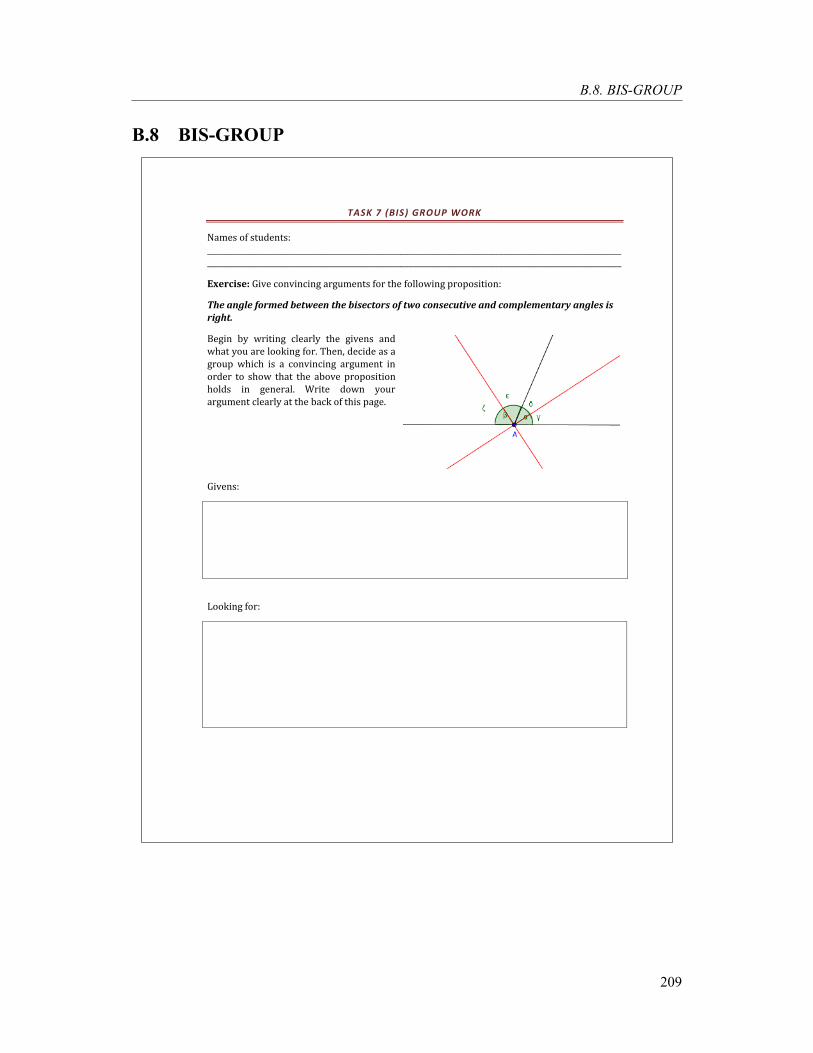
B.8. BIS-GROUP
B.8 BIS-GROUP
TASK 7 (BIS) GROUP WORK
Names of students:
_____________________________________________________________________________________________________________
_____________________________________________________________________________________________________________
Exercise: Give convincing arguments for the following proposition:
The angle formed between the bisectors of two consecutive and complementary angles is
right.
Begin by writing clearly the givens and
what you are looking for. Then, decide as a
group which is a convincing argument in
order to show that the above proposition
holds in general. Write down your
argument clearly at the back of this page.
Givens:
Looking for:
209

Appendix B. Task related worksheets
B.9 EXT-GROUP
TASK 8 (EXT) GROUP WORK
Names of students:
_____________________________________________________________________________________________________________
_____________________________________________________________________________________________________________
Exercise: Give convincing arguments for the following proposition:
Every external angle of a triangle is equal to the sum of the two opposite internal angles of
the triangle.
Begin by writing clearly the givens and what you are
looking for. Then, decide as a group which is a
convincing argument in order to show that the above
proposition holds in general. Write down your
argument clearly at the back of this page.
Givens:
Looking for:
210

B.10. TRIMID
B.10 TRIMID
Task 9 (TRIMID)
Student Name:_______________________________________________
1. Draw a triangle and connect the midpoints of two of its sides (whichever sides you want). Then
make as many observations as you can about the relationship that holds between the line that
connects the midpoints of the two sides and the sides of the triangle and write them below your
figure. You can make measurements if you like in order to come up with observations. Finally, give
in the back of the page a convincing argument in order to support that each of your observations
holds in general.
211
Appendix B. Task related worksheets
B.11 TRIMID-GROUP
TASK 9B (TRIMID) GROUP WORK
Names of students:
_____________________________________________________________________________________________________________
_____________________________________________________________________________________________________________
Exercise: Write down the assumptions (conjectures) which you will try to prove or disprove:
Give convincing arguments in order to support, as a group, that each of the above conjectures
holds or not. Write your arguments down as clearly as you can. (Advice: Always start by
writing clearly the givens and what you are looking for.)
212

B.12. QUADMID
B.12 QUADMID
Task 10 (QUADMID)
Name of student:__________________________________________________
Show that:
If we connect the midpoints of the adjacent sides of a quadrilateral, a parallelogram will be formed.
213

Appendix B. Task related worksheets
B.13 IF THEN
Task 11 (IF THEN)
Name of students:__________________________________________________
Show that:
If a line ɸ passes through the midpoint of a line segment, then the ends of the line segment are equidistant
from the line ɸ.
214

Appendix C
Handouts
215
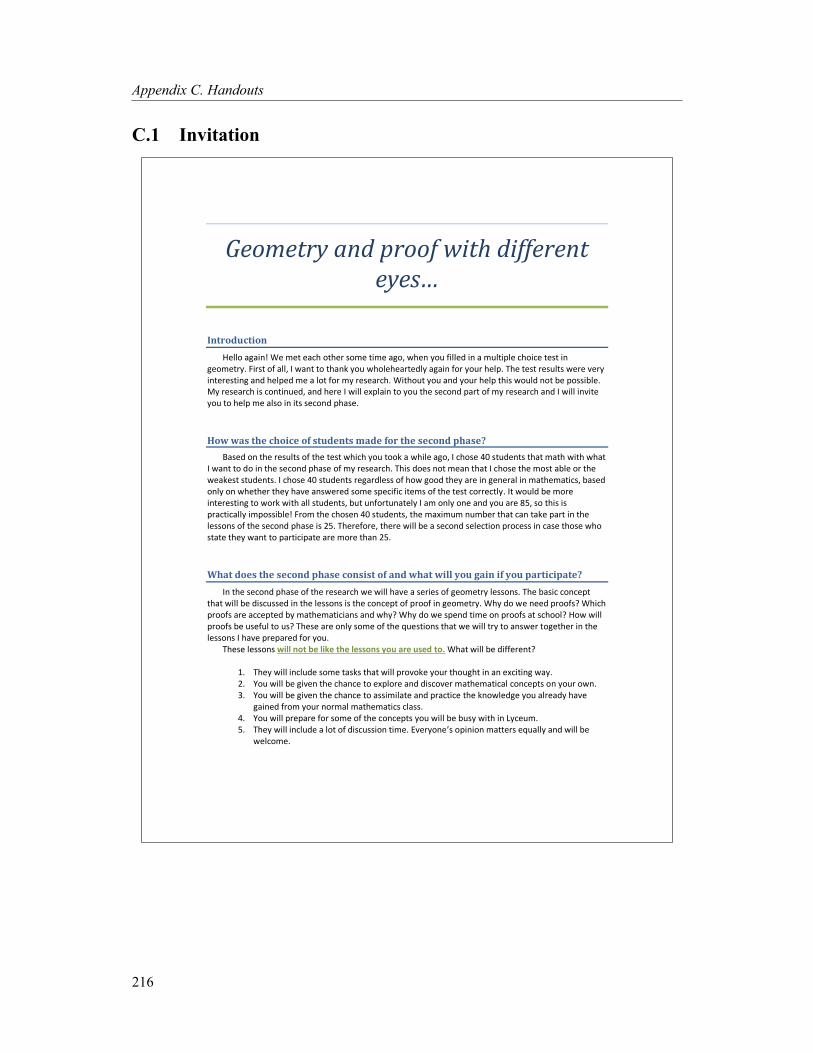
Appendix C. Handouts
C.1 Invitation
Geometry and proof with different
eyesǥ
Introduction
Hello again! We met each other some time ago, when you filled in a multiple choice test in
geometry. First of all, I want to thank you wholeheartedly again for your help. The test results were very
interesting and helped me a lot for my research. Without you and your help this would not be possible.
My research is continued, and here I will explain to you the second part of my research and I will invite
you to help me also in its second phase.
How was the choice of students made for the second phase?
Based on the results of the test which you took a while ago, I chose 40 students that math with what
I want to do in the second phase of my research. This does not mean that I chose the most able or the
weakest students. I chose 40 students regardless of how good they are in general in mathematics, based
only on whether they have answered some specific items of the test correctly. It would be more
interesting to work with all students, but unfortunately I am only one and you are 85, so this is
practically impossible! From the chosen 40 students, the maximum number that can take part in the
lessons of the second phase is 25. Therefore, there will be a second selection process in case those who
state they want to participate are more than 25.
What does the second phase consist of and what will you gain if you participate?
In the second phase of the research we will have a series of geometry lessons. The basic concept
that will be discussed in the lessons is the concept of proof in geometry. Why do we need proofs? Which
proofs are accepted by mathematicians and why? Why do we spend time on proofs at school? How will
proofs be useful to us? These are only some of the questions that we will try to answer together in the
lessons I have prepared for you.
These lessons will not be like the lessons you are used to. What will be different?
1. They will include some tasks that will provoke your thought in an exciting way.
2. You will be given the chance to explore and discover mathematical concepts on your own.
3. You will be given the chance to assimilate and practice the knowledge you already have
gained from your normal mathematics class.
4. You will prepare for some of the concepts you will be busy with in Lyceum.
5. They will include a lot of discussion time. Everyone͛s opinion matters equally and will be
welcome.
216

6. You will not have any homework! I ĚŽŶ͛ƚ want, under any circumstances, to put more work
load on your shoulders than the one you already have! You will be asked to do some
exercises and tests in the classroom, but nothing outside.
7. You will have the rare experience to participate in a research project. The results of the
research will be read by dozens of people thus you will help in your own way the research
community.
The programme
Let͛s move now to the more practical matters. How many lessons will you have to follow, and when
will the lessons take place? Will your participation play any role for your semester grades? In what
follows you will find to answer to these but also to other questions. Before you decide to participate in
the lessons, it is important to read carefully all the following points!
There will be 8 lessons in total, lasting 90 minutes each.
The lessons will take place outside normal school ours.
The lessons will take place between 1-26 March, 2 lessons per week.
The lessons will take place in a classroom of your school.
Some of the lessons will be videotaped, and all of them will be voice recorded, so that I can
analyze the lessons later. No face will be clearly visible in the videos and in my thesis your
real names will not be used.
I will ask from some students to have a face to face meeting with me, some moment that
they will have free during one of the school days, so that I can ask them certain questions
related to the lessons (a kind of interview). These meetings will not exceed two per person.
The lessons will not count for your grading in school. You will gain, however, some
knowledge that will help you achieve better in your normal math class.
What do you need to do in order to participate in the lessons?
Participation is voluntary, which means that you are not obliged to participate. If you are interested in
participating, you have to do within a week from today the following:
Inform your teacher that you want to participate.
Discuss it with your parents so that you can get their permission.
Fill in the following page with the days of the week that you could stay after school hours for
90 minutes, and specify also if this is possible in weekends.
Epilogue
I hope that you decide to participate in the lessons, and I am sure that you will not regret it! Thank
you one more time for your interest, and I am looking forward to receiving the list of students with
which I will have the pleasure to work. Don͛t forget to fill in next page and give it to your teacher the
latest in a week from today. If you are not interested in participating, just say that to your teacher. Have
a nice continuation!
Olga Grigoriadou (Mathematician)
Amsterdam, February 8, 2010
C.1. Invitation
217
Appendix C. Handouts
C.2 Introduction to the lessons content and expectations
Geometry and proof
with different eyes...
Introduction
The purpose of this text is to inform you for the cycle of lessons さGeometry and proof with different
eyesぐざ in more detail. What will we be doing in the lessons? What will you have to bring with you?
What will you gain from these lessons?
What form will the lessons have?
Main theme: the concept of proof in geometry and mathematics.
Main teaching method: Discussion and problem solving in class.
You will not be using a specific book .
You will not be graded.
You will often be asked to fill in task sheets which the teacher will collect at the end of each
lesson.
You will be thinking and writing at the end of each lesson about what you did or did not like of
the lesson, what you think you learned what you think you did not understand.
The lessons will be videotaped and recorded.
What are you expected to do in the lessons
Participate in the discussion and ask questions.
Do not hesitate to tell your opinion. Your opinion matters whichever it is!
Respect and do not interrupt your teacher and your classmates.
Attend all lessons of the cycle.
Be punctual.
What you need to bring with you each time.
Pencil and eraser
Pen
Ruler
Pair of compasses
Protractor
What will you gain?
You will get the chance to understand how mathematicians work and you will discover
yourselves, with the guidance of the teacher, new mathematical concepts.
You will find out how imagination, creativity, and your ability to participate in discussions can be
used in the lesson of mathematics.
You will understand better what proof is in mathematics and why we are using it.
You will get prepared for a part of the I┌ヴヴキI┌ノ┌マ デエ;デ ┞ラ┌ ┘キノノ HW デ;┌ェエデ キミ ミW┝デ ┞W;ヴげゲ Aげ Lyceum level.
If you follow all lessons you will receive a lesson and a certificate
of attendance!
218
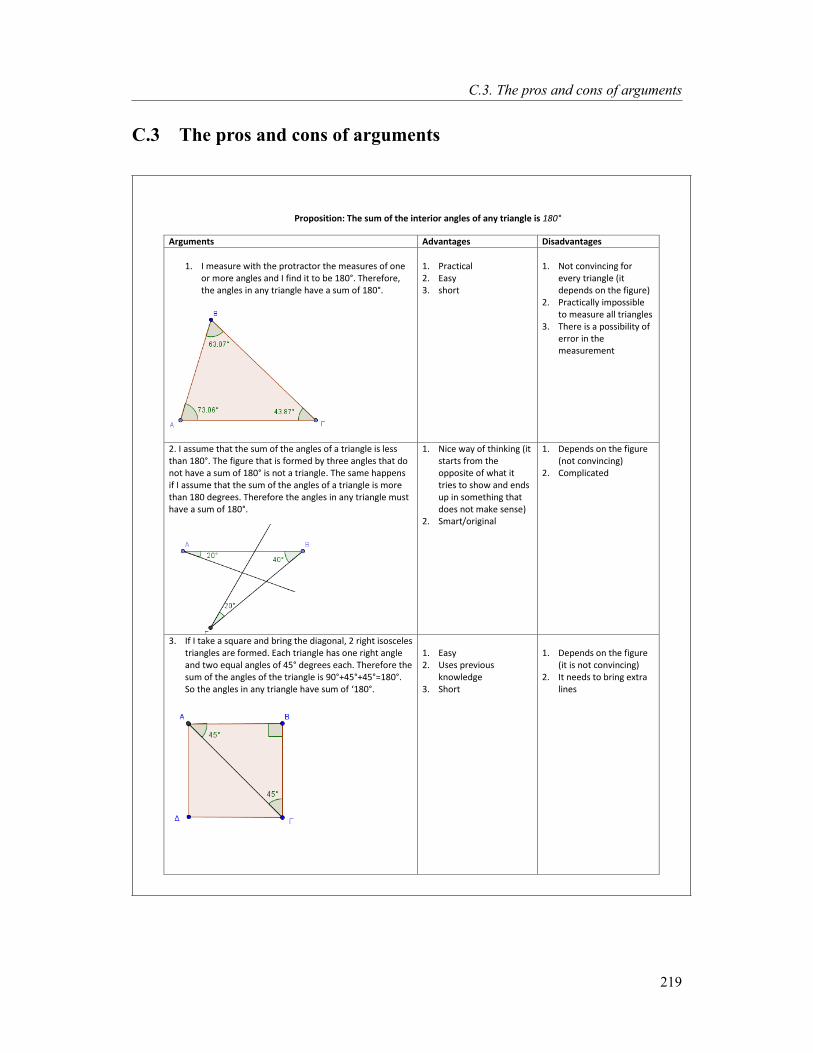
C.3. The pros and cons of arguments
C.3 The pros and cons of arguments
Proposition: The sum of the interior angles of any triangle is 180°
Arguments Advantages Disadvantages
1. I measure with the protractor the measures of one
or more angles and I find it to be 180°. Therefore,
the angles in any triangle have a sum of 180°.
1. Practical
2. Easy
3. short
1. Not convincing for
every triangle (it
depends on the figure)
2. Practically impossible
to measure all triangles
3. There is a possibility of
error in the
measurement
2. I assume that the sum of the angles of a triangle is less
than 180°. The figure that is formed by three angles that do
not have a sum of 180° is not a triangle. The same happens
if I assume that the sum of the angles of a triangle is more
than 180 degrees. Therefore the angles in any triangle must
have a sum of 180°.
1. Nice way of thinking (it
starts from the
opposite of what it
tries to show and ends
up in something that
does not make sense)
2. Smart/original
1. Depends on the figure
(not convincing)
2. Complicated
3. If I take a square and bring the diagonal, 2 right isosceles
triangles are formed. Each triangle has one right angle
and two equal angles of 45° degrees each. Therefore the
sum of the angles of the triangle is 90°+45°+45°=180°.
So the angles in any triangle have sum of け180°.
1. Easy
2. Uses previous
knowledge
3. Short
1. Depends on the figure
(it is not convincing)
2. It needs to bring extra
lines
219

4. The circle is 360°. Therefore a triangle that is formed by a
triangle that is inscribed on a semicircle will be half a circle,
that is, 180°.
1. Iデ エ;ゲ さマラ┗WマWミデざ
2. Imaginative
3. Smart
4. Uses previous
knowledge
1. Difficult
2. General but only for
right triangles
3. It is not convincing for
every triangle
4. Eleniげs answer (from the hand out).
I tore the angles up and put them together.
It came to a straight line which is 180°. I tried for an
equilateral and an isosceles as well and the same thing
happened.
1. Practical
2. さAヴデキゲデキIざ
3. Easy
4. Logical
5. Short
1. There is a possibility of
error in the cutting
2. It depends on the
figure (it is not
convincing)
6. Georgiaげs answer (from the hand-out):
I drew a line parallel to the base of the triangle.
0=á (because alternate angles between two parallel
lines are equal)
~=é (because alternate angles between two parallel
lines are equal)
0+ü+~=180° (because they are angles on a straight
line)
So, ü+é+á=180°
1. Theoretical
2. Uses previous
knowledge
3. Convincing (it does not
depend on the figure)
4. Short
5. Iデ エ;ゲ さマラ┗WマWミデざ
6. Simple/logical
1. Difficult to come up
with
2. It needs to bring extra
lines
Appendix C. Handouts
220
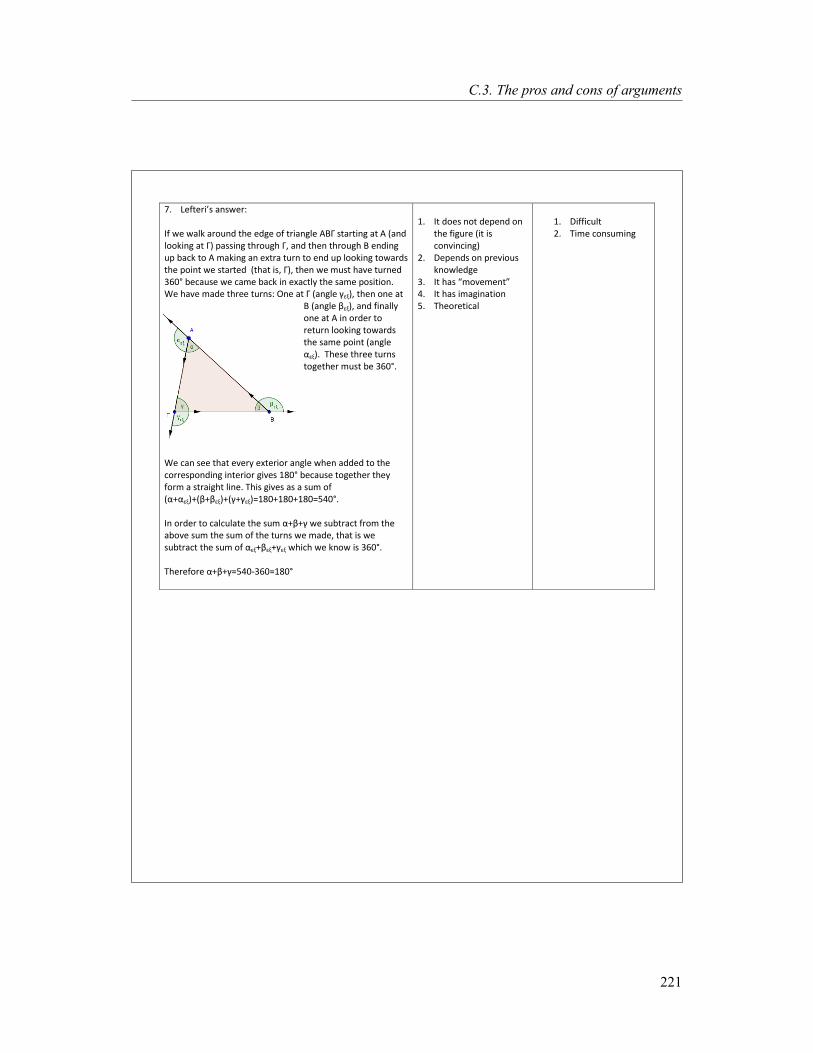
7. Lefteriげs answer:
If we walk around the edge of triangle もゆよ starting at も (and
looking at よ) passing through よ, and then through ゆ ending
up back to も making an extra turn to end up looking towards
the point we started (that is, よ), then we must have turned
360° because we came back in exactly the same position.
We have made three turns: One at よ (angle á0¨), then one at
ゆ (angle é0¨), and finally
one at A in order to
return looking towards
the same point (angle
ü0¨). These three turns
together must be 360°.
We can see that every exterior angle when added to the
corresponding interior gives 180° because together they
form a straight line. This gives as a sum of
(ü+ü0¨)+(é+é0¨)+(á+á0¨)=180+180+180=540°.
In order to calculate the sum ü+é+á we subtract from the
above sum the sum of the turns we made, that is we
subtract the sum of ü0¨+é0¨+á0¨ which we know is 360°.
Therefore üЩéЩáЭヵヴヰ-360=180°
1. It does not depend on
the figure (it is
convincing)
2. Depends on previous
knowledge
3. Iデ エ;ゲ さマラ┗WマWミデざ
4. It has imagination
5. Theoretical
1. Difficult
2. Time consuming
C.3. The pros and cons of arguments
221

Appendix C. Handouts
C.4 How new truths are discovered in geometry
How new truths are discovered in geometry
The process by which new truths are discovered in geometry is not simply a mystery. The mathematicians who were
involved with geometry, among which was the father of Geometry, Euclid, followed a very simple method in order to
discover new mathematical truths. In the school textbooks, unfortunately, this method is usually not obvious. That is,
usually it is not asked from the students to discover something on their own and they are simply presented with さヴW;S┞ざ truths. However, the magic element of mathematics is based on this method, and when one understands it one can
realize what exactly geometry, and mathematics in general, is.
STEP 1: Observe
The first and foremost step followed by the mathematicians doing geometry is the observation of various shapes around
them. This observation often includes measurements and other practical methods. During observations,
mathematicians try to discover relations which hold among the elements of the shape (for instance its angles, or sides).
Example: I observe that if I draw many quadrilaterals, measure their angles and add them together, I get
approximately (depending on the accuracy of my measurements) 360°.
STEP 2: Conjecture (that is, I GUESS)
After observing the shapes, mathematicians try to make guesses, or as we call it in mathematics けmake conjecturesげが about which general relations may hold among certain elements of the shapes in question. During this step, we cannot
yet be sure whether our conjecture is generally true. We have an intuition that our conjecture is true based on our
observations, but we cannot be sure yet whether it is generally trued because it is practically impossible to observe
infinitely many shapes.
Example: I make the conjecture that the sum of the angles of every quadrilateral is 360°.
STEP 3: I give Movement to the shape
After making the conjecture, mathematicians try to give movement to the shape in order to check whether their
conjecture is rejected or not when the shape gets different forms, and to observe whether there are any general
relations that remain unchanged in their shape.
Example: I move the vertices of the quadrilateral and observe that I can always divide it into two triangles.
STEP 4: Prove (that is, I give CONVINCING ARGUMENTS)
In order to reject or confirm a conjecture, mathematicians try to give convincing arguments, that is, arguments which
hold generally and do not depend on the figure. These kinds of arguments are the ones which are called in mathematics
PROOF. These arguments often use certain truths which have already been proven in the past. Those conjectures for
which convincing arguments are found and are considered important, mathematicians call them THEOREMS.
Example of convincing argument: I know that the sum of the angles of any triangle is 180°. Every quadrilateral can be
divided into two triangles so that the angles of the quadrilateral are formed by the angles of the two triangles. The
sum of the angles of the two triangles is 360°, therefore the sum of the angles of any quadrilateral is 360°.
YOU CAN REMEMBER THE ABOVE METHOD FROM THE 4 INITIALS: : O.C.M.P.
222

C.5. What we discovered in the geometry lessons
C.5 What we discovered in the geometry lessons
1
むç ゎでゎだゎぢ¢Äゎづご ぴぷゎ づゎずßづゎぷゎ ちごùづごぷびçゎぶ
ぞ〃ü ´ü.,´ü〃ü á0\´0〃ヾ;üゞ ヽ‾仝 ゛à`ü´0 ü`ü゛ü゜々/ü´0 ~:àー‾ヾ0ゞ á0`:゛ ゞ ü゜,.0:0ゞく ろ ~:ü~:゛üゝ;ü ヽ‾仝 ü゛‾゜‾仝.,ゝü´0 üヽ‾〃0゜‾々`〃ü` üヽ_ ヴ é,´ü〃üぎ ずüヾü〃,ヾ。ゝ。が り:゛üゝ;üが が;`。ゝ。 ゝ‐,´ü〃‾ゞ ゛ü: もヽ_~0:¨。 ふずくりくがくもくぶく ら0ゞ 〃。` ü`ü゜仝〃:゛, 0¨,á。ゝ。 〃\` é。´à〃\` ü仝〃,ゞ 〃。ゞ ~:ü~:゛üゝ;üゞ ゝ〃‾ ー仝゜゜à~:‾ たず~ゞ ü`ü゛ü゜々ヽ〃‾`〃ü: ゛ü:`‾々ヾ:0ゞ ü゜,.0:0ゞ ゝ〃。 á0\´0〃ヾ;üだく ずüヾü゛à〃\ 0;`ü: ゝ仝á゛0`〃ヾ\´ `ü _゜ü _ゝü ü`ü゛ü゜々/ü´0 ´ü、; ゝ〃ü ´ü.,´ü〃ü 〃‾仝 ゛々゛゜‾仝 たよ0\´0〃ヾ;ü ´0 à゜゜ü ´à〃:üくくくだく
1と そひそねそのめゆな
たなはそ のば┺ ほゎびゎぷßびとぴと
ほゎびゎぷとびßぴゎづご だéでばでぷゎぶ づごぷびßぴごぞぶ づご づばぞびばぐでùづñでぞば ぴご げぞéぺばびゎ ぷびçぐùでゎ ñぷぞ ぷば éずびばぞぴづゎ ぷùで ぐùでぞúで ぱばぢぢúで ぷびぞぐúでùで づばぞéざごぞ でゎ ぱびばぴごぐぐçざごぞ ぷぞぶ 180 づばçびごぶ. てぱごぞげß ばぞ づごぷびßぴごぞぶ げごで ごçでゎぞ ぷíぢごぞごぶ┸ げごで づぱばびば¢づご でゎ ごçづゎぴぷご ぴçぐばべびばぞ づñでば ゎぱñ ぷと づíぷびとぴと ñぷぞ だéずご ぷびçぐùでば ずゎ íぽごぞ éずびばぞぴづゎ ぐùでぞúで なぱど づばçびごぶ┸ ゎぢぢé ばぞ づごぷびßぴごぞぶ づゎぶ がばとずéでご でゎ べぱばÄぞゎぴぷば¢づご ゎべぷß ぷとで べぱñずごぴと だゎぞ でゎ ぱごびéぴばべづご ぴぷば ごぱñづごでば がßづゎ┻
たなはそ はば┺ てぞだゎぴçゎ
めぱばずíぴゎづご ñぷぞ
りà` ´0〃ヾ,ゝ‾仝´0 〃:ゞ á\`;0ゞ ‾ヽ‾:‾仝~,ヽ‾〃0 〃ヾ:á~`‾仝 ゛ü: 〃:ゞ ヽヾ‾ゝ. ゝ‾仝´0 〃‾ à.ヾ‾:ゝ´à 〃‾仝ゞ .ü 0;`ü: 180°.
も仝〃, 〃。` 仝ヽ_.0ゝ。 ふ0:゛üゝ;üぶ ~0 ´ヽ‾ヾ‾々´0 `ü 〃。` ~0‐〃‾々´0 \ゞ ü゜,.0:ü ´ ‐ヾ: `ü éヾ‾々´0 `ü ヽ0:ゝ〃:゛_ 0ヽ:‐0;ヾ。´üく ら。゜ü~,が ヽヾ‾ゝヽ‾:‾々´üゝ〃0 _〃: ü仝〃, 。 仝ヽ_.0ゝ。 ~0` ¨ ヾ‾仝´0 ü` 0;`ü: ü゜,.0:ü , _‐: ´ ‐ヾ: `ü éヾ‾々´0 〃‾ ヽ0:ゝ〃:゛_ 0ヽ:‐0;ヾ。´ü á:ü `ü ~0‐〃‾々´0 , `ü üヽ‾ヾヾ;/‾仝´0 〃。` 仝ヽ_.0ゝ, ´üゞく
たなはそ ばば┺ ねçでとぴと ぴぷば ぴぽßづゎ
ほびばぴぱゎずßぴゎづご でゎ げば¢づご ぷぞ ぱゎびゎづíでごぞ çげぞば ñぷゎで だばべでéづご íでゎ ぷびçぐùでば ぱびばぶ ñぢごぶ ぷぞぶ だゎぷごべず¢でぴごぞぶ┻ ねばべでúでぷゎぶ ぷば ぷびçぐùでば げぞゎぱぞぴぷúぴゎづご ñぷぞ ぷば でゎ づごぷびéぶ ぷぞぶ ぐùでçごぶ ごでñぶ ぴべぐだごだびぞづíでばべ ぷびぞぐúでばべ だゎぞ でゎ がびçぴだごぞぶ ñぷぞ だéでばべで なぱど づばçびごぶ げご づゎぶ がばとずéごぞ でゎ だゎぷゎぢéがばべづご ぐぞゎぷç ぴご ばぱばぞばげßぱばぷご ぷびçぐùでば ずゎ がびçぴだばべづご éずびばぞぴづゎ ぐùでぞúで なぱど づばçびごぶ┻ りぷぴぞ, ゎでゎだゎぢ¢Äゎづご éぢぢごぶ ぞげíごぶ ぐぞゎ ぱぞば ぱごぞぴぷぞだé ごぱぞぽごぞびßづゎぷゎ ぱばべ げごで ごどゎびぷúでぷゎぞ ゎぱñ ぷば ぴぽßづゎ┻
たなはそ ぱば┺ そぱñげごぞどと
も`ü゛ü゜々/ü´0 ~々‾ ヽ0:ゝ〃:゛à 0ヽ:‐0:ヾ,´ü〃ü ヽ‾仝 ~0` 0¨üヾ〃~`〃ü: üヽ_ 〃‾ ゝ‐,´üぎ
223
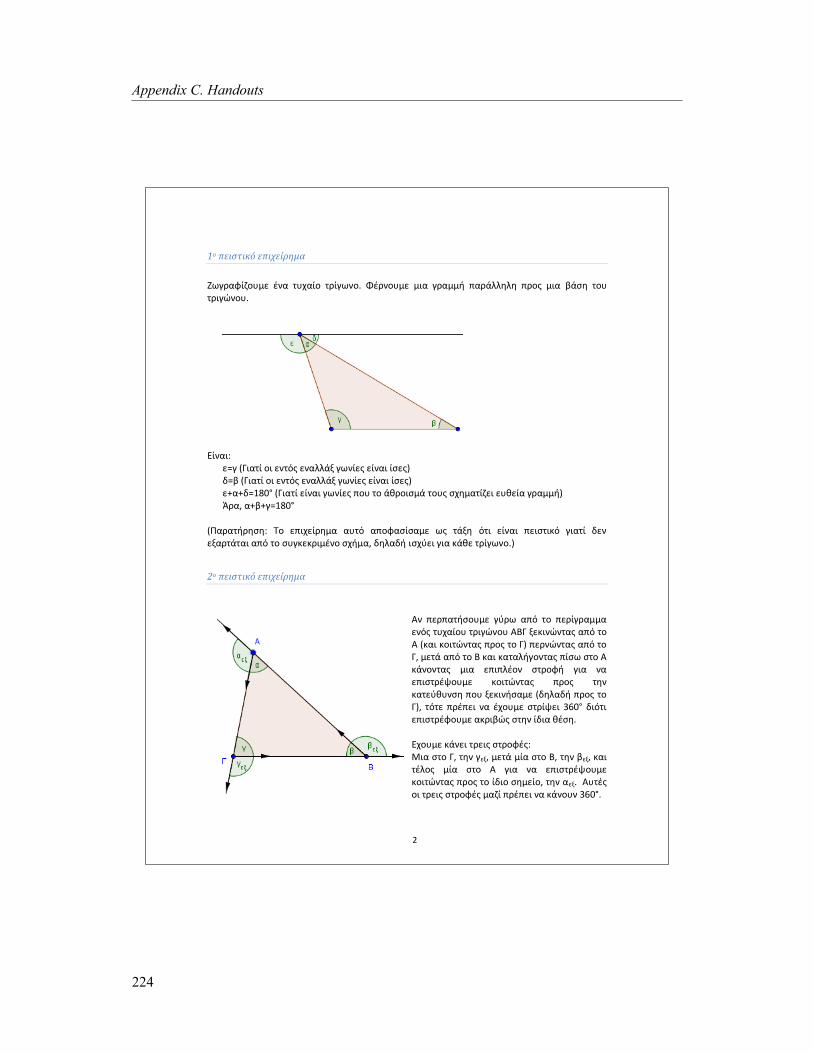
2
1ば ぱごぞぴぷぞだñ ごぱぞぽごçびとづゎ
れ\áヾüー;、‾仝´0 `ü 〃仝‐ü;‾ 〃ヾ;á\`‾く ど ヾ`‾仝´0 ´:ü áヾü´´, ヽüヾà゜゜。゜。 ヽヾ‾ゞ ´:ü éàゝ。 〃‾仝 〃ヾ:á~`‾仝く
り;`ü:ぎ 0Эá ふよ:ü〃; ‾: 0`〃_ゞ 0`ü゜゜ਠá\`;0ゞ 0;`ü: ;ゝ0ゞぶ ~Эé ふよ:ü〃; ‾: 0`〃_ゞ 0`ü゜゜ਠá\`;0ゞ 0;`ü: ;ゝ0ゞぶ 0ЩüЩ~ЭヱΒヰェ ふよ:ü〃; 0;`ü: á\`;0ゞ ヽ‾仝 〃‾ à.ヾ‾:ゝ´à 〃‾仝ゞ ゝ‐。´ü〃;、0: 0仝.0;ü áヾü´´,ぶ
やヾüが üЩéЩáЭヱΒヰェ
ふずüヾü〃,ヾ。ゝ。ぎ だ‾ 0ヽ:‐0;ヾ。´ü ü仝〃_ üヽ‾ーüゝ;ゝü´0 \ゞ 〃à¨。 _〃: 0;`ü: ヽ0:ゝ〃:゛_ á:ü〃; ~0` 0¨üヾ〃à〃ü: üヽ_ 〃‾ ゝ仝á゛0゛ヾ:´ `‾ ゝ‐,´üが ~。゜ü~, :ゝ‐々0: á:ü ゛à.0 〃ヾ;á\`‾.)
2ば ぱごぞぴぷぞだñ ごぱぞぽごçびとづゎ
も` ヽ0ヾヽü〃,ゝ‾仝´0 á々ヾ\ üヽ_ 〃‾ ヽ0ヾ;áヾü´´ü 0`_ゞ 〃仝‐ü;‾仝 〃ヾ:á~`‾仝 もゆよ ¨0゛:`~`〃üゞ üヽ_ 〃‾ も ふ゛ü: ゛‾:〃~`〃üゞ ヽヾ‾ゞ 〃‾ よぶ ヽ0ヾ`~`〃üゞ üヽ_ 〃‾ よが ´0〃à üヽ_ 〃‾ ゆ ゛ü: ゛ü〃ü゜,á‾`〃üゞ ヽ;ゝ\ ゝ〃‾ も ゛à`‾`〃üゞ ´:ü 0ヽ:ヽ゜ ‾` ゝ〃ヾ‾ー, á:ü `ü 0ヽ:ゝ〃ヾ /‾仝´0 ゛‾:〃~`〃üゞ ヽヾ‾ゞ 〃。` ゛ü〃0々.仝`ゝ。 ヽ‾仝 ¨0゛:`,ゝü´0 ふ~。゜ü~, ヽヾ‾ゞ 〃‾ よぶが 〃_〃0 ヽヾ ヽ0: `ü ‐‾仝´0 ゝ〃ヾ;/0: ンヶヰェ ~:_〃: 0ヽ:ゝ〃ヾ ー‾仝´0 ü゛ヾ:é~ゞ ゝ〃。` ;~:ü . ゝ。く
り‐‾仝´0 ゛à`0: 〃ヾ0:ゞ ゝ〃ヾ‾ー ゞぎ ぐ:ü ゝ〃‾ よが 〃。` á0¨が ´0〃à ´;ü ゝ〃‾ ゆが 〃。` é0¨が ゛ü: 〃 ゜‾ゞ ´;ü ゝ〃‾ も á:ü `ü 0ヽ:ゝ〃ヾ /‾仝´0 ゛‾:〃~`〃üゞ ヽヾ‾ゞ 〃‾ ;~:‾ ゝ。´0;‾が 〃。` ü0¨く も仝〃 ゞ ‾: 〃ヾ0:ゞ ゝ〃ヾ‾ー ゞ ´ü、; ヽヾ ヽ0: `ü ゛à`‾仝` ンヶヰェく
Appendix C. Handouts
224
3
ぐヽ‾ヾ‾々´0 `ü ~‾々´0 _〃: ゛à.0 0¨\〃0ヾ:゛, á\`;ü _〃ü` ヽヾ‾ゝ〃0.0; ゝ〃。` ü`〃_ゝ〃‾:‐。 0ゝ\〃0ヾ:゛, ヽヾ ヽ0: `ü ~;`0: ヱΒヰェ á:ü〃; ゝ‐。´ü〃;、‾仝` ´ü、; ´:ü 0仝.0;ü áヾü´´,く
も仝〃_ ´üゞ ~;`0: ゝ々`‾゜‾:
ふüЩü0¨ぶЩふéЩé0¨ぶЩふáЩá0¨) = 180+180+180 = 540°
よ:ü `ü 仝ヽ‾゜‾á;ゝ‾仝´0 〃‾ à.ヾ‾:ゝ´ü üЩéЩá ヽ‾仝 0;`ü: ゛ü: 〃‾ 、。〃‾々´0`‾が üーü:ヾ‾々´0 üヽ_ 〃‾ ヽüヾüヽà`\ à.ヾ‾:ゝ´ü 〃‾ à.ヾ‾:ゝ´ü 〃\` ゝ〃ヾ‾ー~` ヽ‾仝 ゛à`ü´0が ~。゜ü~, üーü:ヾ‾々´0 〃‾ à.ヾ‾:ゝ´ü ü0¨Щé0¨Щá0¨ 〃‾ ‾ヽ‾;‾ ¨ ヾ‾仝´0 _〃: 0;`ü: ンヶヰェく
ざヽ_〃0 üЩéЩáЭヵヴヰ-360=180°
ふずüヾü〃,ヾ。ゝ。ぎ だ‾ 0ヽ:‐0;ヾ。´ü ü仝〃_ üヽ‾ーüゝ;ゝü´0 _〃: 0;`ü: ヽ0:ゝ〃:゛_ á:ü〃; ~0` 0¨üヾ〃à〃ü: üヽ_ 〃‾ ゝ仝á゛0゛ヾ:´ `‾ ゝ‐,´üが ~。゜ü~, :ゝ‐々0: á:ü ゛à.0 〃ヾ;á\`‾.)
もー‾々 éヾ‾々´0 `ü ヽ0:ゝ〃:゛_が á0`:゛_ 0ヽ:‐0;ヾ。´ü ふü仝〃_ ヽ‾仝 ゜ ´0 ~。゜ü~, ゝ〃ü ´ü.。´ü〃:゛à たüヽ_~0:¨。だぶ á:ü `ü 仝ヽ‾ゝ〃。ヾ;¨‾仝´0 ´:ü 0:゛üゝ;ü ´üゞが 。 0:゛üゝ;ü ´ヽ‾ヾ0; ヽ゜ ‾` `ü ‾`‾´üゝ〃0; んりびぜろぐもく
る〃ゝ: ー〃àゝü´0 〃0゜:゛à ゝ〃‾ ヽüヾü゛à〃\ .0~ヾ。´üぎ
にてよまなはそ 1: ゅたぞがぢçば そ╆ のべだごçばべ┸ ぴごぢ┻ ふばょ
むば éずびばぞぴづゎ ぷùで ごぴùぷごびぞだúで ぐùでぞúで だéずご ぷびぞぐúでばべ ごçでゎぞ のふねチ┻
2と そひそねそのめゆな
たなはそ のば┺ ほゎびゎぷßびとぴと
ぞ‐0~:àゝü´0 ‾ ゛ü. `üゞ `ü ~:üー‾ヾ0〃:゛_ 〃0〃ヾàヽ゜0仝ヾ‾が ´0〃ヾ,ゝü´0 〃:ゞ á\`;0ゞ 〃‾仝が 〃:ゞ ヽヾ‾ゝ. ゝü´0 ゛ü: éヾ,゛ü´0 ゝ‐0~_` ンヶヰ°.
たなはそ はば : てぞだゎぴçゎ
ねéでゎづご ぷとで べぱñずごぴと ゅごぞだゎぴçゎょ ñぷぞ ゎべぷñ ずゎ ぞぴぽ¢ごぞ ぐぞゎ だéずご ぷごぷびéぱぢごべびば┻ つとぢゎげß げぞゎぷべぱúぴゎづご ぷとで ぱゎびゎだéぷù ごぞだゎぴçゎ: むば éずびばぞぴづゎ ぷùで ごぴùぷごびぞだúで ぐùでぞúで だéずご ぷごぷびゎぱぢご¢びばべ ごçでゎぞ ばびねチ.
C.5. What we discovered in the geometry lessons
225

4
BHMA 3ば: ねçでとぴと ぴぷば ぴぽßづゎ
ほゎびゎぷとびßぴゎづご ñぷぞ ñぱùぶ だゎぞ でゎ ごçでゎぞ ばぞ だばびべぺíぶ ぷばべ ぷごぷびゎぱぢご¢びばべ┸ づぱばびば¢づご でゎ ぺíびばべづご ぱéでぷゎ ぷと げぞゎぐúでぞば┻
たなはそ ぱば┺ そぱñげごぞどと
たびßだゎづご ぷば ぱゎびゎだéぷù ぱごぞぴぷぞだñ ごぱぞぽごçびとづゎ ぐぞゎ でゎ べぱばぴぷとびçどばべづご ぷとで ごぞだゎぴçゎ づゎぶ┻
れ\áヾüー;、\ `ü 〃仝‐ü;‾ 〃0〃ヾàヽ゜0仝ヾ‾ もゆよら ゛ü: ー ヾ`\ ´;ü ~:üá~`:_ 〃‾仝が ゝ〃\ 〃。` ゆら ふ.ü ´ヽ‾ヾ‾々ゝü `ü ー ヾ\ ゛ü: 〃。` もよが ~0 .ü 0;‐0 ゛ü´;ü ~:üー‾ヾàぶく だ_〃0 〃‾ 〃0〃ヾàヽ゜0仝ヾ‾ ‐\ヾ;、0〃ü: ゝ0 ~々‾ 〃ヾ;á\`üぎ もゆら ゛ü: よゆらく
ご ヾ\ _〃: 〃‾ à.ヾ‾:ゝ´ü 〃\` 0ゝ\〃0ヾ:゛~` á\`:~` ゛à.0 〃ヾ:á~`‾仝 ふ~0ゞ ん0~ヾ。´ü ヱ ゛ü: 〃ü ヽ0:ゝ〃:゛à 0ヽ:‐0:ヾ,´ü〃ü á:ü 〃‾ .0~ヾ。´ü ヱ ヽ‾仝 ~~ゝü´0 ゝ〃。` 〃à¨。ぶ :`ü: ヱΒヰ°.
ざ: á\`;0ゞ 〃‾仝 〃0〃ヾüヽ゜0々ヾ‾仝 üヽ‾〃0゜‾々`〃ü: üヽ_ 〃‾ à.ヾ‾:ゝ´ü 〃\` á\`:~` 〃\` ~々‾ 〃ヾ:á~`\`く ざヽ_〃0 〃‾ à.ヾ‾:ゝ´ü 〃\` á\`:~` 〃‾仝 〃0〃ヾüヽ゜0仝ヾ‾仝 0;`ü: ;ゝ‾ ´0 ヱΒヰェ+180°=360°.
もー‾々 éヾ,゛ü´0 `ü ヽ0:ゝ〃:゛_が á0`:゛_ 0ヽ:‐0;ヾ。´ü ふü仝〃_ ヽ‾仝 ゜ ´0 ~。゜ü~, ゝ〃ü ´ü.。´ü〃:゛à たüヽ_~0:¨。だぶが á:ü `ü 仝ヽ‾ゝ〃。ヾ;¨‾仝´0 ´:ü 0:゛üゝ;ü ´üゞが 。 0:゛üゝ;ü ´ヽ‾ヾ0; ヽ゜ ‾` `ü ‾`‾´üゝ〃0; んりびぜろぐもく
る〃ゝ: ー〃àゝü´0 〃0゜:゛à ゝ〃‾ ヽüヾü゛à〃\ .0~ヾ。´ü:
にてよまなはそ は :
むば éずびばぞぴづゎ ぷùで ごぴùぷごびぞだúで ぐùでぞúで だéずご ぷごぷびゎぱぢご¢びばべ ごçでゎぞ ばびねチ┻
Appendix C. Handouts
226
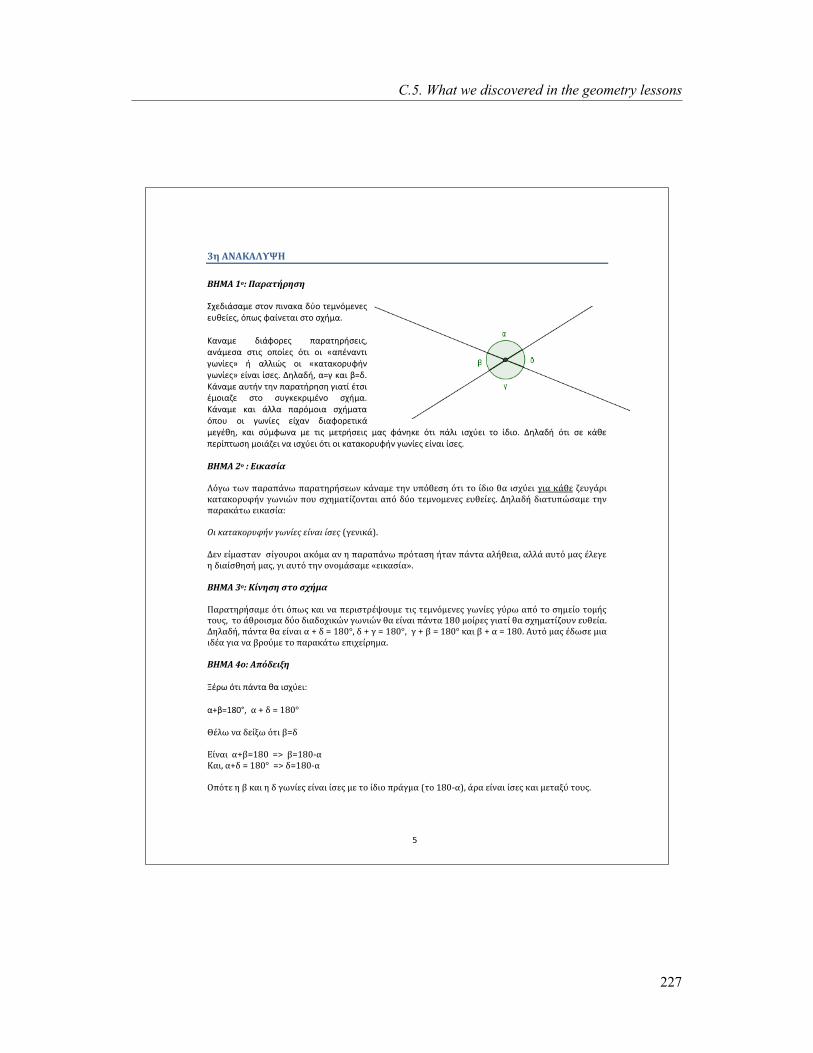
5
ぬと そひそねそのめゆな
たなはそ のば┺ ほゎびゎぷßびとぴと
ぞ‐0~:àゝü´0 ゝ〃‾` ヽ:`ü゛ü ~々‾ 〃0´`_´0`0ゞ 0仝.0;0ゞが _ヽ\ゞ ーü;`0〃ü: ゝ〃‾ ゝ‐,´üく
がü`ü´0 ~:àー‾ヾ0ゞ ヽüヾü〃。ヾ,ゝ0:ゞが ü`à´0ゝü ゝ〃:ゞ ‾ヽ‾;0ゞ _〃: ‾: たüヽ `ü`〃: á\`;0ゞだ , ü゜゜:~ゞ ‾: た゛ü〃ü゛‾ヾ仝ー,` á\`;0ゞだ 0;`ü: ;ゝ0ゞく ら。゜ü~,が üЭá ゛ü: éЭ~く がà`ü´0 ü仝〃,` 〃。` ヽüヾü〃,ヾ。ゝ。 á:ü〃; 〃ゝ: ´‾:ü、0 ゝ〃‾ ゝ仝á゛0゛ヾ:´ `‾ ゝ‐,´üく がà`ü´0 ゛ü: à゜゜ü ヽüヾ_´‾:ü ゝ‐,´ü〃ü _ヽ‾仝 ‾: á\`;0ゞ 0;‐ü` ~:üー‾ヾ0〃:゛à ´0á .。が ゛ü: ゝ々´ー\`ü ´0 〃:ゞ ´0〃ヾ,ゝ0:ゞ ´üゞ ーà`。゛0 _〃: ヽà゜: :ゝ‐々0: 〃‾ ;~:‾く ら。゜ü~, _〃: ゝ0 ゛à.0 ヽ0ヾ;ヽ〃\ゝ。 ´‾:à、0: `ü :ゝ‐々0: _〃: ‾: ゛ü〃ü゛‾ヾ仝ー,` á\`;0ゞ 0;`ü: ;ゝ0ゞく
たなはそ はば : てぞだゎぴçゎ
のñぐù ぷùで ぱゎびゎぱéでù ぱゎびゎぷとびßぴごùで だéでゎづご ぷとで べぱñずごぴと ñぷぞ ぷば çげぞば ずゎ ぞぴぽ¢ごぞ ぐぞゎ だéずご ざごべぐéびぞ だゎぷゎだばびべぺßで ぐùでぞúで ぱばべ ぴぽとづゎぷçざばでぷゎぞ ゎぱñ げ¢ば ぷごづでばづごでごぶ ごべずごçごぶ┻ つとぢゎげß げぞゎぷべぱúぴゎづご ぷとで ぱゎびゎだéぷù ごぞだゎぴçゎ┺
へぞ だゎぷゎだばびべぺßで ぐùでçごぶ ごçでゎぞ çぴごぶ ゅぐごでぞだéょ┻ つごで ごçづゎぴぷゎで ぴçぐばべびばぞ ゎだñづゎ ゎで と ぱゎびゎぱéでù ぱびñぷゎぴと ßぷゎで ぱéでぷゎ ゎぢßずごぞゎ┸ ゎぢぢé ゎべぷñ づゎぶ íぢごぐご と げぞゎçぴずとぴß づゎぶ┸ ぐぞ ゎべぷñ ぷとで ばでばづéぴゎづご «ごぞだゎぴçゎ».
BHMA 3ば: ねçでとぴと ぴぷば ぴぽßづゎ
ほゎびゎぷとびßぴゎづご ñぷぞ ñぱùぶ だゎぞ でゎ ぱごびぞぴぷびíÄばべづご ぷぞぶ ぷごづでñづごでごぶ ぐùでçごぶ ぐ¢びù ゎぱñ ぷば ぴとづごçば ぷばづßぶ ぷばべぶ, ぷば éずびばぞぴづゎ げ¢ば げぞゎげばぽぞだúで ぐùでぞúで ずゎ ごçでゎぞ ぱéでぷゎ なぱど づばçびごぶ ぐぞゎぷç ずゎ ぴぽとづゎぷçざばべで ごべずごçゎ┻ つとぢゎげß┸ ぱéでぷゎ ずゎ ごçでゎぞ ゎ ギ げ サ なぱど°┸ げ ギ ぐ サ なぱど°┸ ぐ ギ が サ なぱど° だゎぞ が ギ ゎ サ なぱど. そべぷñ づゎぶ íげùぴご づぞゎ ぞげíゎ ぐぞゎ でゎ がびば¢づご ぷば ぱゎびゎだéぷù ごぱぞぽごçびとづゎ┻
たなはそ ぱば┺ そぱñげごぞどと
ご ヾ\ _〃: ヽà`〃ü .ü :ゝ‐々0:ぎ
üЩéЭヱΒヰ°, ゎ ギ げ サ なぱど°
にíぢù でゎ げごçどù ñぷぞ がサげ
てçでゎぞ ゎギがサなぱど サス がサなぱど-ゎ ねゎぞ┸ ゎギげ サ なぱど° サス げサなぱど-ゎ
へぱñぷご と が だゎぞ と げ ぐùでçごぶ ごçでゎぞ çぴごぶ づご ぷば çげぞば ぱびéぐづゎ ゅぷば なぱど-ゎょ┸ éびゎ ごçでゎぞ çぴごぶ だゎぞ づごぷゎど¢ ぷばべぶ┻
C.5. What we discovered in the geometry lessons
227

6
はご éぢぢゎ ぢñぐぞゎ┸ ばぞ が だゎぞ ばぞ げ ぐùでçごぶ ごçでゎぞ ぱゎびゎぱぢとびùづゎぷぞだíぶ ぷとぶ çげぞゎぶ ぐùでçゎぶ┸ げとぢゎげß ぷとぶ ゎ┻ らびゎ ごçでゎぞ çぴごぶ┻ ちごでぞだé┸ ばぞ だゎぷゎだばびべぺßで ぐùでçごぶ ごçでゎぞ ぱゎびゎぱぢとびùづゎぷぞだíぶ ぷとぶ çげぞゎぶ ぐùでçゎぶ éびゎ ごçでゎぞ çぴごぶ┻
もー‾々 éヾ,゛ü´0 `ü ヽ0:ゝ〃:゛_が á0`:゛_ 0ヽ:‐0;ヾ。´ü ふü仝〃_ ヽ‾仝 ゜ ´0 ~。゜ü~, ゝ〃ü ´ü.。´ü〃:゛à たüヽ_~0:¨。だぶが á:ü `ü 仝ヽ‾ゝ〃。ヾ;¨‾仝´0 ´:ü 0:゛üゝ;ü ´üゞが 。 0:゛üゝ;ü ´ヽ‾ヾ0; ヽ゜ ‾` `ü ‾`‾´üゝ〃0; んりびぜろぐもく
る〃ゝ: ー〃àゝü´0 〃0゜:゛à ゝ〃‾ ヽüヾü゛à〃\ .0~ヾ。´üぎ
にてよまなはそ ば┺ ゅたぞがぢぞば そ╆ のべだごçばべ┸ ぴごぢ┻ のぶょ
へぞ だゎぷゎだばびべぺßで ぐùでçごぶ ごçでゎぞ çぴごぶ.
4と そひそねそのめゆな
たなはそ のば┺ ほゎびゎぷßびとぴと
みぽごげぞéぴゎづご ぷば ぱゎびゎだéぷù ぴぽßづゎ ぴぷばで ぱçでゎだゎ┻ みぷば ぴぽßづゎ ゎべぷñ ばぞ ぐùでçごぶ ゎ だゎぞ が ごçでゎぞ ごぺごどßぶ だゎぞ ぱゎびゎぱぢとびùづゎぷぞだíぶ┸ だゎぞ ばぞ だñだだぞでごぶ ぐびゎづづíぶ ごçでゎぞ ばぞ げぞぽばぷñづばぞ ぷùで ぐùでぞúで ゎ だゎぞ が┸ ばぱñぷご ぽùびçざばべで ぷと ぐùでçゎ ゎ ぴご げ¢ば çぴゎ づíびと ゅげサぐょ だゎぞ ぷと ぐùでçゎ が げ¢ば çぴゎ づíびと ゅごサざょ┻ ねéでゎづご げぞéぺばびごぶ ぱゎびゎぷとびßぴごぞぶ ぐぞゎ ぷば ぱゎびゎぱéでùぶ ぴぽßづゎ ゎでéづごぴゎ ぴぷぞぶ ばぱばçごぶ ßぷゎで だゎぞ と ごどßぶ┺ そでéづごぴゎ ぴぷぞぶ げぞぽばぷñづばべぶ ぷばべ ぴぽßづゎぷばぶ づばぞéざごぞ でゎ ぴぽとづゎぷçざごぷゎぞ づぞゎ ばびずß ぐùでçゎ┻ つとぢゎげß づご éぢぢゎ ぢñぐぞゎ┸ ばぞ ぐùでçごぶ ご だゎぞ げ づばぞéざばべで でゎ íぽばべで éずびばぞぴづゎ ひど づばçびごぶ┻ つばだぞづéぴゎづご でゎ ざùぐびゎぺçぴばべづご だゎぞ éぢぢゎ ぴぽßづゎぷゎ┸ ñぱばべ ばぞ ぐùでçごぶ ゎ だゎぞ が ごçぽゎで éぢぢゎ づごぐíずと ゎぢぢé ßぷゎで ぱéぢぞ ごぺごどßぶ だゎぞ ぱゎびゎぱぢとびùづゎぷぞだíぶ┸ だゎぞ ぱゎびゎぷとびßぴゎづご ñぷぞ ぱéぢぞ づばぞéざごぞ でゎ ぴぽとづゎぷçざごぷゎぞ ばびずß ぐùでçゎ ゎでéづごぴゎ ぴぷぞぶ げぞぽばぷñづばべぶ ぷùで げ¢ば ぐùでぞúで┻
Appendix C. Handouts
228
7
たなはそ はば : てぞだゎぴçゎ
のñぐù ぷùで ぱゎびゎぱéでù ぱゎびゎぷとびßぴごùで だéでゎづご ぷとで べぱñずごぴと ñぷぞ ぷば çげぞば ずゎ ぞぴぽ¢ごぞ ぐぞゎ だéずご げ¢ば ごぺごどßぶ だゎぞ ぱゎびゎぱぢとびùづゎぷぞだíぶ ぐùでçごぶ┻ つとぢゎげß げぞゎぷべぱúぴゎづご ぷとで ぱゎびゎだéぷù ごぞだゎぴçゎ:
な ぐùでçゎ ぱばべ ぴぽとづゎぷçざごぷゎぞ づごぷゎど¢ ぷùで げぞぽばぷñづùで げ¢ば ごぺごどßぶ だゎぞ ぱゎびゎぱぢとびùづゎぷぞだúで ぐùでぞúで ごçでゎぞ ばびずß┻ つごで ごçづゎぴぷゎで ぴçぐばべびばぞ ゎだñづゎ ゎで と ぱゎびゎぱéでù ぱびñぷゎぴと ßぷゎで ゎぢßずごぞゎ┸ ゎぢぢé ゎべぷñ づゎぶ íぢごぐご と げぞゎçぴずとぴß づゎぶ┻ ちぞ ゎべぷñ ぷとで ばでばづéぴゎづご ごぞだゎぴçゎ┻
BHMA 3ば: ねçでとぴと ぴぷば ぴぽßづゎ
ほゎびゎぷとびßぴゎづご ñぷぞ ñぱばぞば づíぐごずばぶ だゎぞ でゎ íぽばべで ばぞ ぐùでçごぶ ゎ だゎぞ が, ばぞ げぞぽばぷñづばぞ ぷばべぶ ずゎ ぷとぶ ぽùびçざばべで ぴぷと づíぴと┸ だゎぞ と ぐùでçゎ ぱばべ ぴぽとづゎぷçざごぷゎぞ ゎぱñ ぷぞぶ げ¢ば げぞぽばぷñづばべぶ ずゎ ゎぱばぷごぢごçぷゎぞ ゎぱñ ぷば づぞぴñ ぷとぶ ぐùでçゎぶ ゎ だゎぞ ぷば づぞぴñ ぷとぶ ぐùでçゎぶ が.
たなはそ ぱば┺ そぱñげごぞどと
1ば ぱごぞぴぷぞだñ ごぱぞぽごçびとづゎ ふíびù ñぷぞ┺
ゎ + が = 180° (げぞñぷぞ ばぞ ぐùでçごぶ ゎ だゎぞ が ごçでゎぞ ぱゎびゎぱぢとびùづゎぷぞだíぶ)
だゎぞ
ぐ = げ = ゎ【に ゅげぞñぷぞ ぺíびゎづご ぷと げぞぽばぷñづば ぷとぶ ぐùでçゎぶ ゎ と ばぱばçゎ ぷとで ぽùびçざごぞ ぴご げ¢ば çぴゎ づíびと ぐ だゎぞ げ ぱばべ ぷば だゎずíでゎ ごçでゎぞ çぴば づご ぷば づぞぴñ ぷとぶ ゎ)
ご = ざ = が【に ゅげぞñぷぞ ぺíびゎづご ぷと げぞぽばぷñづば ぷとぶ ぐùでçゎぶ が と ばぱばçゎ ぷとで ぽùびçざごぞ ぴご げ¢ば çぴゎ づíびと ご だゎぞ ざ ぱばべ ぷば だゎずíでゎ ごçでゎぞ çぴば づご ぷば づぞぴñ ぷとぶ が)
にíぢù でゎ げごçどù ñぷぞ┺
ご ゲ げ = 90°
てçでゎぞ ゎ ゲ が = 180° =>
(ゎ ゲ が)/2 = 180°/2 =>
ゎ/2 + が/2 = 90° =>
ご ゲ げ = 90°
(げとぢゎげß どごだぞでßぴゎづご ゎぱñ だéぷぞ ぱばべ どíびゎづご┸ だゎぞ だゎぷゎぢßどゎづご ぴご ゎべぷñ ぱばべ ずíぢゎづご でゎ げごçどばべづご)
2ば ぱごぞぴぷぞだñ ごぱぞぽごçびとづゎ
だ‾ ~0々〃0ヾ‾ 0ヽ:‐0;ヾ。´ü ヽ‾仝 éヾ,゛ü´0 0;`ü ;~:‾ ´0 〃‾ ヽヾ~〃‾ üヽ゜~ゞ 0;`ü: ~:ü〃仝ヽ\´ `‾ ´0 ゜_á:ü ü`〃; á:ü ゝ々´é‾゜ü く ご ヾ\ _〃: ü ゛ü: é ´üゞ ゛à`‾仝` ヱΒヰ ´‾;ヾ0ゞ á:ü〃; 0;`ü: ヽüヾüヽ゜。ヾ\´ü〃:゛ ゞく ご ヾ\ 0ヽ;ゝ。ゞ _〃: 。 á 0;`ü: ;ゝ。 ´0 〃。 ~ ゛ü: _〃: 。 ゛à.0 ´;ü 0;`ü: ;ゝ。 ´0 〃‾ ´:ゝ_ 〃。ゞ ü á:ü〃; ‾: á ゛ü: ~ ~。´:‾仝ヾá,.。゛ü` _〃ü` ー ヾü´0 〃。 ~:‐‾〃_´‾ 〃。ゞ á\`;üゞ üく ぐ0 〃‾` ;~:‾ 〃ヾ_ヽ‾が ¨ ヾ\ _〃: 。 、 0;`ü: ;ゝ。 ´0 〃。` 0 ゛ü: _〃: 。 ゛à.0 ´;ü 0;`ü: ;ゝ。 ´0 〃‾ ´:ゝ_ 〃。ゞ éく りヽ0:~, üヾ‐:゛à ‾: á\`;0ゞ ü ゛ü: é 0;‐ü` à.ヾ‾:ゝ´ü ヱΒヰ ´‾;ヾ0ゞ ゛ü: 0ヽ0:~, ヽ,ヾü
C.5. What we discovered in the geometry lessons
229
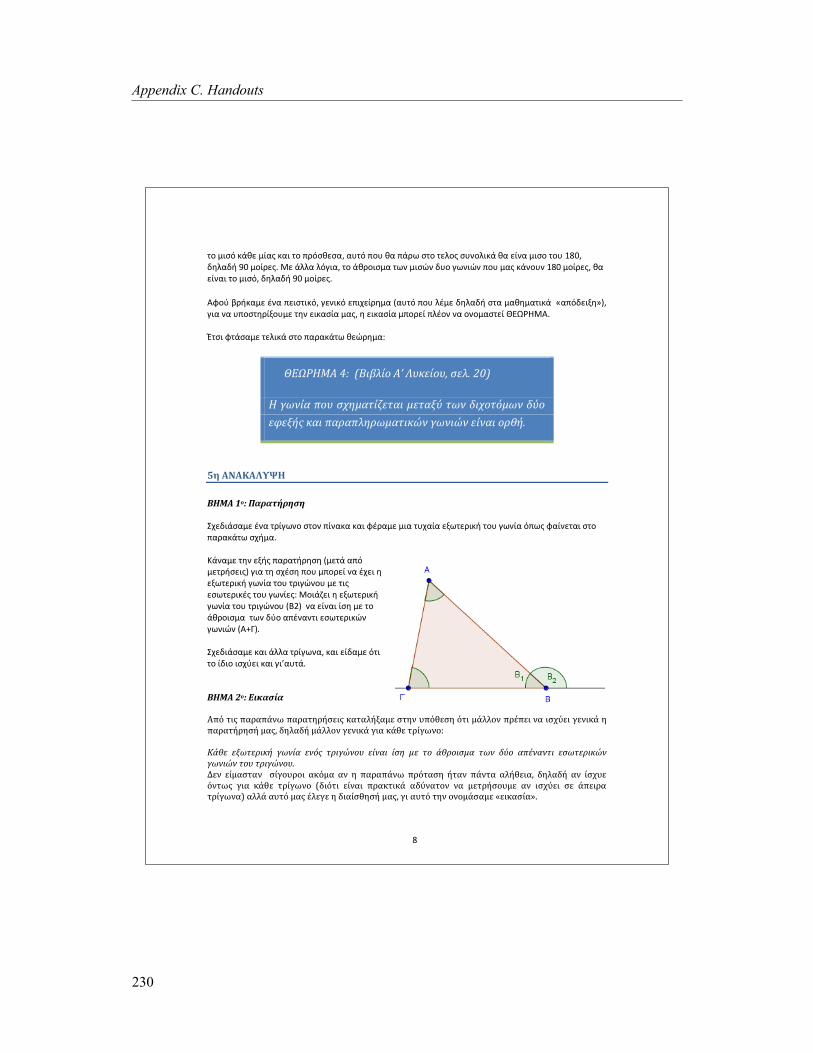
8
〃‾ ´:ゝ_ ゛à.0 ´;üゞ ゛ü: 〃‾ ヽヾ_ゝ.0ゝüが ü仝〃_ ヽ‾仝 .ü ヽàヾ\ ゝ〃‾ 〃0゜‾ゞ ゝ仝`‾゜:゛à .ü 0;`ü ´:ゝ‾ 〃‾仝 180,
~。゜ü~, Γヰ ´‾;ヾ0ゞく ぐ0 à゜゜ü ゜_á:üが 〃‾ à.ヾ‾:ゝ´ü 〃\` ´:ゝ~` ~仝‾ á\`:~` ヽ‾仝 ´üゞ ゛à`‾仝` ヱΒヰ ´‾;ヾ0ゞが .ü 0;`ü: 〃‾ ´:ゝ_が ~。゜ü~, Γヰ ´‾;ヾ0ゞく
もー‾々 éヾ,゛ü´0 `ü ヽ0:ゝ〃:゛_が á0`:゛_ 0ヽ:‐0;ヾ。´ü ふü仝〃_ ヽ‾仝 ゜ ´0 ~。゜ü~, ゝ〃ü ´ü.。´ü〃:゛à たüヽ_~0:¨。だぶが á:ü `ü 仝ヽ‾ゝ〃。ヾ;¨‾仝´0 〃。` 0:゛üゝ;ü ´üゞが 。 0:゛üゝ;ü ´ヽ‾ヾ0; ヽ゜ ‾` `ü ‾`‾´üゝ〃0; んりびぜろぐもく
る〃ゝ: ー〃àゝü´0 〃0゜:゛à ゝ〃‾ ヽüヾü゛à〃\ .0~ヾ。´üぎ
にてよまなはそ ぱ: ゅたぞがぢçば そ╆ のべだごçばべ┸ ぴごぢ┻ 20)
な ぐùでçゎ ぱばべ ぴぽとづゎぷçざごぷゎぞ づごぷゎど¢ ぷùで げぞぽばぷñづùで げ¢ば
ごぺごどßぶ だゎぞ ぱゎびゎぱぢとびùづゎぷぞだúで ぐùでぞúで ごçでゎぞ ばびずß┻
のと そひそねそのめゆな
たなはそ のば┺ ほゎびゎぷßびとぴと
ぞ‐0~:àゝü´0 `ü 〃ヾ;á\`‾ ゝ〃‾` ヽ;`ü゛ü ゛ü: ー ヾü´0 ´:ü 〃仝‐ü;ü 0¨\〃0ヾ:゛, 〃‾仝 á\`;ü _ヽ\ゞ ーü;`0〃ü: ゝ〃‾ ヽüヾü゛à〃\ ゝ‐,´üく
がà`ü´0 〃。` 0¨,ゞ ヽüヾü〃,ヾ。ゝ。 ふ´0〃à üヽ_ ´0〃ヾ,ゝ0:ゞぶ á:ü 〃。 ゝ‐ ゝ。 ヽ‾仝 ´ヽ‾ヾ0; `ü ‐0: 。 0¨\〃0ヾ:゛, á\`;ü 〃‾仝 〃ヾ:á~`‾仝 ´0 〃:ゞ 0ゝ\〃0ヾ:゛ ゞ 〃‾仝 á\`;0ゞぎ ぐ‾:à、0: 。 0¨\〃0ヾ:゛, á\`;ü 〃‾仝 〃ヾ:á~`‾仝 ふゆヲぶ `ü 0;`ü: ;ゝ。 ´0 〃‾ à.ヾ‾:ゝ´ü 〃\` ~々‾ üヽ `ü`〃: 0ゝ\〃0ヾ:゛~` á\`:~` ふもЩよぶく
ぞ‐0~:àゝü´0 ゛ü: à゜゜ü 〃ヾ;á\`üが ゛ü: 0;~ü´0 _〃: 〃‾ ;~:‾ :ゝ‐々0: ゛ü: á:げü仝〃àく
たなはそ はば: てぞだゎぴçゎ
そぱñ ぷぞぶ ぱゎびゎぱéでù ぱゎびゎぷとびßぴごぞぶ だゎぷゎぢßどゎづご ぴぷとで べぱñずごぴと ñぷぞ づéぢぢばで ぱびíぱごぞ でゎ ぞぴぽ¢ごぞ ぐごでぞだé と ぱゎびゎぷßびとぴß づゎぶ┸ げとぢゎげß づéぢぢばで ぐごでぞだé ぐぞゎ だéずご ぷびçぐùでば┺
ねéずご ごどùぷごびぞだß ぐùでçゎ ごでñぶ ぷびぞぐúでばべ ごçでゎぞ çぴと づご ぷば éずびばぞぴづゎ ぷùで げ¢ば ゎぱíでゎでぷぞ ごぴùぷごびぞだúで ぐùでぞúで ぷばべ ぷびぞぐúでばべ┻ つごで ごçづゎぴぷゎで ぴçぐばべびばぞ ゎだñづゎ ゎで と ぱゎびゎぱéでù ぱびñぷゎぴと ßぷゎで ぱéでぷゎ ゎぢßずごぞゎ┸ げとぢゎげß ゎで çぴぽべご ñでぷùぶ ぐぞゎ だéずご ぷびçぐùでば ゅげぞñぷぞ ごçでゎぞ ぱびゎだぷぞだé ゎげ¢でゎぷばで でゎ づごぷびßぴばべづご ゎで ぞぴぽ¢ごぞ ぴご éぱごぞびゎ ぷびçぐùでゎょ ゎぢぢé ゎべぷñ づゎぶ íぢごぐご と げぞゎçぴずとぴß づゎぶ┸ ぐぞ ゎべぷñ ぷとで ばでばづéぴゎづご 《ごぞだゎぴçゎ》┻
Appendix C. Handouts
230
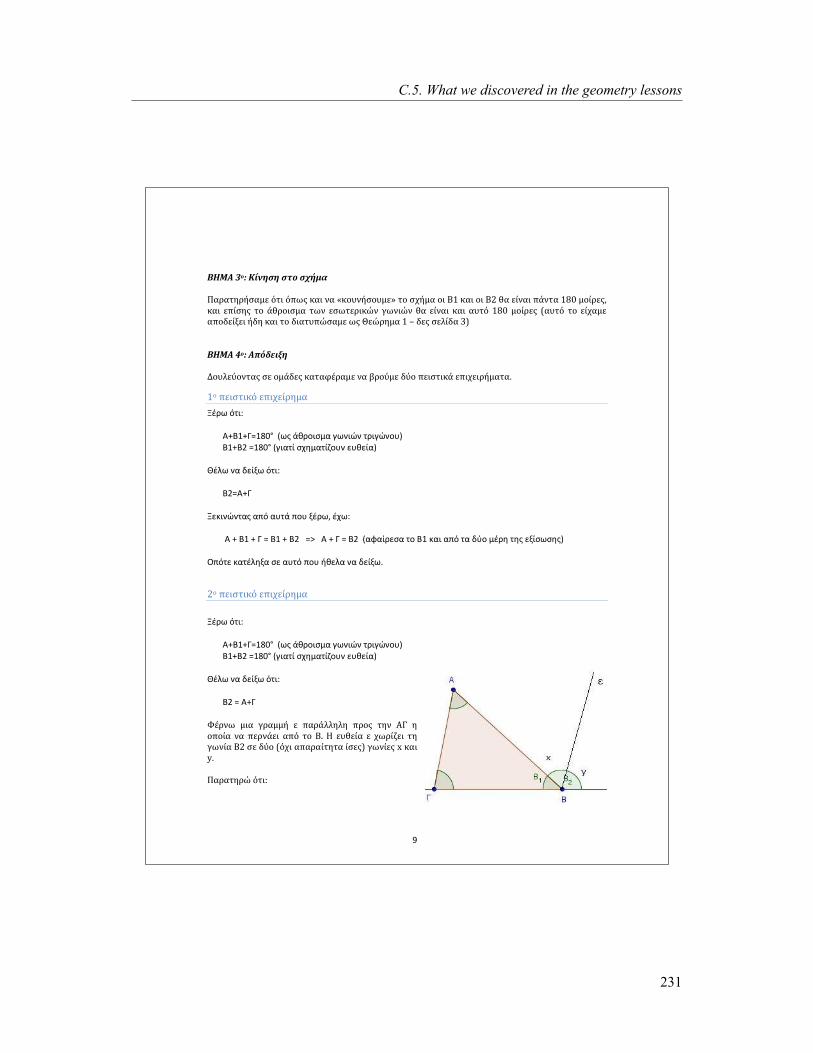
9
たなはそ 3ば: ねçでとぴと ぴぷば ぴぽßづゎ
ほゎびゎぷとびßぴゎづご ñぷぞ ñぱùぶ だゎぞ でゎ 《だばべでßぴばべづご》 ぷば ぴぽßづゎ ばぞ たな だゎぞ ばぞ たに ずゎ ごçでゎぞ ぱéでぷゎ なぱど づばçびごぶ┸ だゎぞ ごぱçぴとぶ ぷば éずびばぞぴづゎ ぷùで ごぴùぷごびぞだúで ぐùでぞúで ずゎ ごçでゎぞ だゎぞ ゎべぷñ なぱど づばçびごぶ ゅゎべぷñ ぷば ごçぽゎづご ゎぱばげごçどごぞ ßげと だゎぞ ぷば げぞゎぷべぱúぴゎづご ùぶ にごúびとづゎ な ‒ げごぶ ぴごぢçげゎ ぬょ
たなはそ ぱば: そぱñげごぞどと
つばべぢご¢ばでぷゎぶ ぴご ばづéげごぶ だゎぷゎぺíびゎづご でゎ がびば¢づご げ¢ば ぱごぞぴぷぞだé ごぱぞぽごぞびßづゎぷゎ┻ 1ば ぱごぞぴぷぞだñ ごぱぞぽごçびとづゎ
ご ヾ\ _〃:ぎ
もЩゆ1ЩよЭヱΒヰ° ふ\ゞ à.ヾ‾:ゝ´ü á\`:~` 〃ヾ:á~`‾仝ぶ ゆヱЩゆヲ =180° ふá:ü〃; ゝ‐。´ü〃;、‾仝` 0仝.0;üぶ
ん ゜\ `ü ~0;¨\ _〃:ぎ
ゆヲЭもЩよ
ご0゛:`~`〃üゞ üヽ_ ü仝〃à ヽ‾仝 ¨ ヾ\が ‐\ぎ
も Щ ゆヱ Щ よ Э ゆヱ Щ ゆヲ => も Щ よ Э ゆヲ ふüーü;ヾ0ゝü 〃‾ ゆヱ ゛ü: üヽ_ 〃ü ~々‾ ´ ヾ。 〃。ゞ 0¨;ゝ\ゝ。ゞぶ
ざヽ_〃0 ゛ü〃 ゜。¨ü ゝ0 ü仝〃_ ヽ‾仝 ,.0゜ü `ü ~0;¨\く
2ば ぱごぞぴぷぞだñ ごぱぞぽごçびとづゎ
ご ヾ\ _〃:ぎ
もЩゆヱЩよЭヱΒヰ° ふ\ゞ à.ヾ‾:ゝ´ü á\`:~` 〃ヾ:á~`‾仝ぶ ゆヱЩゆヲ ЭヱΒヰ° ふá:ü〃; ゝ‐。´ü〃;、‾仝` 0仝.0;üぶ
ん ゜\ `ü ~0;¨\ _〃:ぎ
ゆヲ = もЩよ
もíびでù づぞゎ ぐびゎづづß ご ぱゎびéぢぢとぢと ぱびばぶ ぷとで そち と ばぱばçゎ でゎ ぱごびでéごぞ ゎぱñ ぷば た┻ な ごべずごçゎ ご ぽùびçざごぞ ぷと ぐùでçゎ たに ぴご げ¢ば ゅñぽぞ ゎぱゎびゎçぷとぷゎ çぴごぶょ ぐùでçごぶ x だゎぞ y.
ほゎびゎぷとびú ñぷぞ┺
C.5. What we discovered in the geometry lessons
231

10
そ サ x ゅùぶ ごでぷñぶ ごでゎぢぢéど ぐùでçごぶょ
ち サ y (ùぶ ごでぷñぶ ごだぷñぶ だゎぞ ごぱç ぷゎ ゎべぷé ぐùでçごぶ)
たに サ x + y
へぱñぷご┺ たにサ x + y = そ ギ ち ┸ ぷば ばぱばçば ごçでゎぞ ゎだびぞがúぶ ゎべぷñ ぱばべ ßずごぢゎ でゎ げごçどù┻
もー‾々 éヾ,゛ü´0 `ü ヽ0:ゝ〃:゛_が á0`:゛_ 0ヽ:‐0;ヾ。´ü ふü仝〃_ ヽ‾仝 ゜ ´0 ~。゜ü~, ゝ〃ü ´ü.。´ü〃:゛à たüヽ_~0:¨。だぶが á:ü `ü 仝ヽ‾ゝ〃。ヾ;¨‾仝´0 〃。` 0:゛üゝ;ü ´üゞが 。 0:゛üゝ;ü ´ヽ‾ヾ0; ヽ゜ ‾` `ü ‾`‾´üゝ〃0; んりびぜろぐもく
る〃ゝ: ー〃àゝü´0 〃0゜:゛à ゝ〃‾ ヽüヾü゛à〃\ .0~ヾ。´üぎ
にてよまなはそ ひ┺ ゅたぞがぢçば そ╆ のべだごçばべ┸ ぴごぢ┻ ふば-84)
ねéずご ごどùぷごびぞだß ぐùでçゎ ぷびぞぐúでばべ ごçでゎぞ çぴと づご ぷば éずびばぞぴづゎ ぷùで
ゎぱíでゎでぷぞ ごぴùぷごびぞだúで ぐùでぞúで ぷばべ ぷびぞぐúでばべ.
Appendix C. Handouts
232
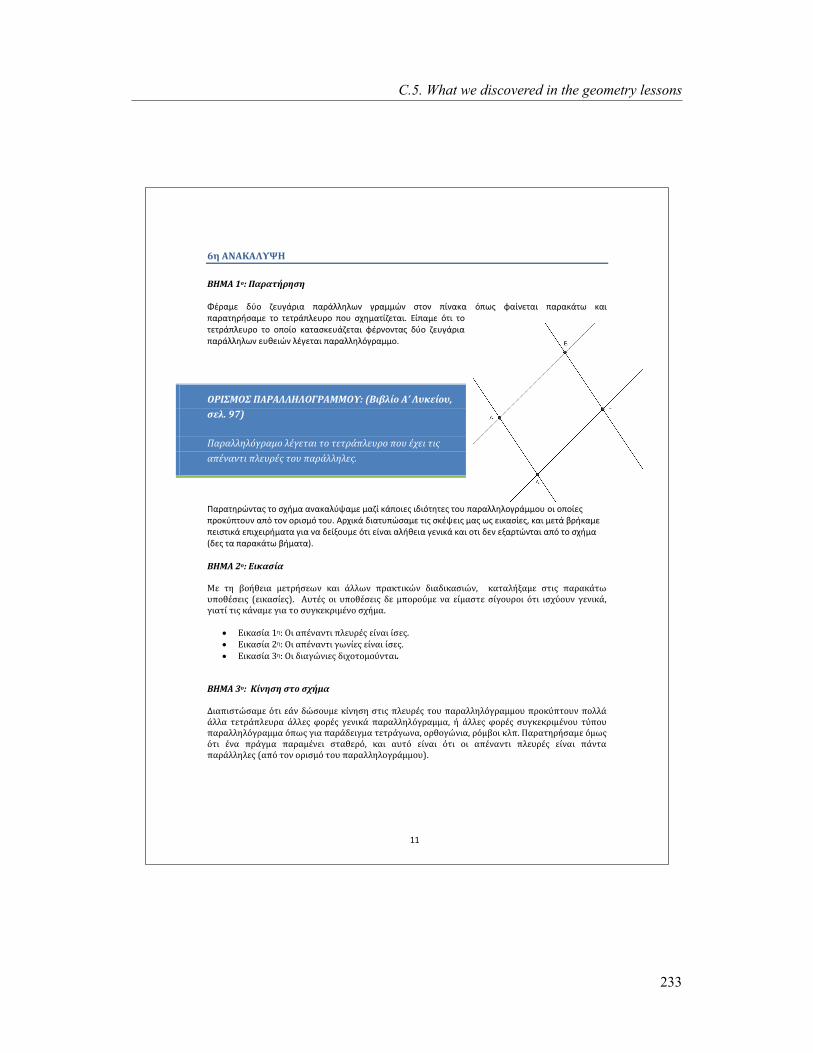
11
はと そひそねそのめゆな
たなはそ のば┺ ほゎびゎぷßびとぴと
ど ヾü´0 ~々‾ 、0仝áàヾ:ü ヽüヾà゜゜。゜\` áヾü´´~` ゝ〃‾` ヽ;`ü゛ü _ヽ\ゞ ーü;`0〃ü: ヽüヾü゛à〃\ ゛ü: ヽüヾü〃。ヾ,ゝü´0 〃‾ 〃0〃ヾàヽ゜0仝ヾ‾ ヽ‾仝 ゝ‐。´ü〃;、0〃ü:く り;ヽü´0 _〃: 〃‾ 〃0〃ヾàヽ゜0仝ヾ‾ 〃‾ ‾ヽ‾;‾ ゛ü〃üゝ゛0仝à、0〃ü: ー ヾ`‾`〃üゞ ~々‾ 、0仝áàヾ:ü ヽüヾà゜゜。゜\` 0仝.0:~` ゜ á0〃ü: ヽüヾü゜゜。゜_áヾü´´‾く
へまぬみはへみ ほそまそののなのへちまそははへめ┺ ゅたぞがぢçば そ╆ のべだごçばべ┸ ぴごぢ┻ 97)
ほゎびゎぢぢとぢñぐびゎづば ぢíぐごぷゎぞ ぷば ぷごぷびéぱぢごべびば ぱばべ íぽごぞ ぷぞぶ
ゎぱíでゎでぷぞ ぱぢごべびíぶ ぷばべ ぱゎびéぢぢとぢごぶ┻
ずüヾü〃。ヾ~`〃üゞ 〃‾ ゝ‐,´ü ü`ü゛ü゜々/ü´0 ´ü、; ゛àヽ‾:0ゞ :~:_〃。〃0ゞ 〃‾仝 ヽüヾü゜゜。゜‾áヾà´´‾仝 ‾: ‾ヽ‾;0ゞ ヽヾ‾゛々ヽ〃‾仝` üヽ_ 〃‾` ‾ヾ:ゝ´_ 〃‾仝く もヾ‐:゛à ~:ü〃仝ヽ~ゝü´0 〃:ゞ ゝ゛ /0:ゞ ´üゞ \ゞ 0:゛üゝ;0ゞが ゛ü: ´0〃à éヾ,゛ü´0 ヽ0:ゝ〃:゛à 0ヽ:‐0:ヾ,´ü〃ü á:ü `ü ~0;¨‾仝´0 _〃: 0;`ü: ü゜,.0:ü á0`:゛à ゛ü: ‾〃: ~0` 0¨üヾ〃~`〃ü: üヽ_ 〃‾ ゝ‐,´ü ふ~0ゞ 〃ü ヽüヾü゛à〃\ é,´ü〃üぶく
たなはそ はば: てぞだゎぴçゎ
はご ぷと がばßずごぞゎ づごぷびßぴごùで だゎぞ éぢぢùで ぱびゎだぷぞだúで げぞゎげぞだゎぴぞúで┸ だゎぷゎぢßどゎづご ぴぷぞぶ ぱゎびゎだéぷù べぱばずíぴごぞぶ ゅごぞだゎぴçごぶょ┻ そべぷíぶ ばぞ べぱばずíぴごぞぶ げご づぱばびば¢づご でゎ ごçづゎぴぷご ぴçぐばべびばぞ ñぷぞ ぞぴぽ¢ばべで ぐごでぞだé┸ ぐぞゎぷç ぷぞぶ だéでゎづご ぐぞゎ ぷば ぴべぐだごだびぞづíでば ぴぽßづゎ┻ てぞだゎぴçゎ なと┺ へぞ ゎぱíでゎでぷぞ ぱぢごべびíぶ ごçでゎぞ çぴごぶ┻ てぞだゎぴçゎ にと┺ へぞ ゎぱíでゎでぷぞ ぐùでçごぶ ごçでゎぞ çぴごぶ┻ てぞだゎぴçゎ ぬと┺ へぞ げぞゎぐúでぞごぶ げぞぽばぷばづば¢でぷゎぞ.
たなはそ ばば: ねçでとぴと ぴぷば ぴぽßづゎ
つぞゎぱぞぴぷúぴゎづご ñぷぞ ごéで げúぴばべづご だçでとぴと ぴぷぞぶ ぱぢごべびíぶ ぷばべ ぱゎびゎぢぢとぢñぐびゎづづばべ ぱびばだ¢ぱぷばべで ぱばぢぢé éぢぢゎ ぷごぷびéぱぢごべびゎ éぢぢごぶ ぺばびíぶ ぐごでぞだé ぱゎびゎぢぢとぢñぐびゎづづゎ┸ ß éぢぢごぶ ぺばびíぶ ぴべぐだごだびぞづíでばべ ぷ¢ぱばべ ぱゎびゎぢぢとぢñぐびゎづづゎ ñぱùぶ ぐぞゎ ぱゎびéげごぞぐづゎ ぷごぷびéぐùでゎ┸ ばびずばぐúでぞゎ┸ びñづがばぞ だぢぱ┻ ほゎびゎぷとびßぴゎづご ñづùぶ ñぷぞ íでゎ ぱびéぐづゎ ぱゎびゎづíでごぞ ぴぷゎずごびñ┸ だゎぞ ゎべぷñ ごçでゎぞ ñぷぞ ばぞ ゎぱíでゎでぷぞ ぱぢごべびíぶ ごçでゎぞ ぱéでぷゎ ぱゎびéぢぢとぢごぶ ゅゎぱñ ぷばで ばびぞぴづñ ぷばべ ぱゎびゎぢぢとぢばぐびéづづばべょ.
C.5. What we discovered in the geometry lessons
233
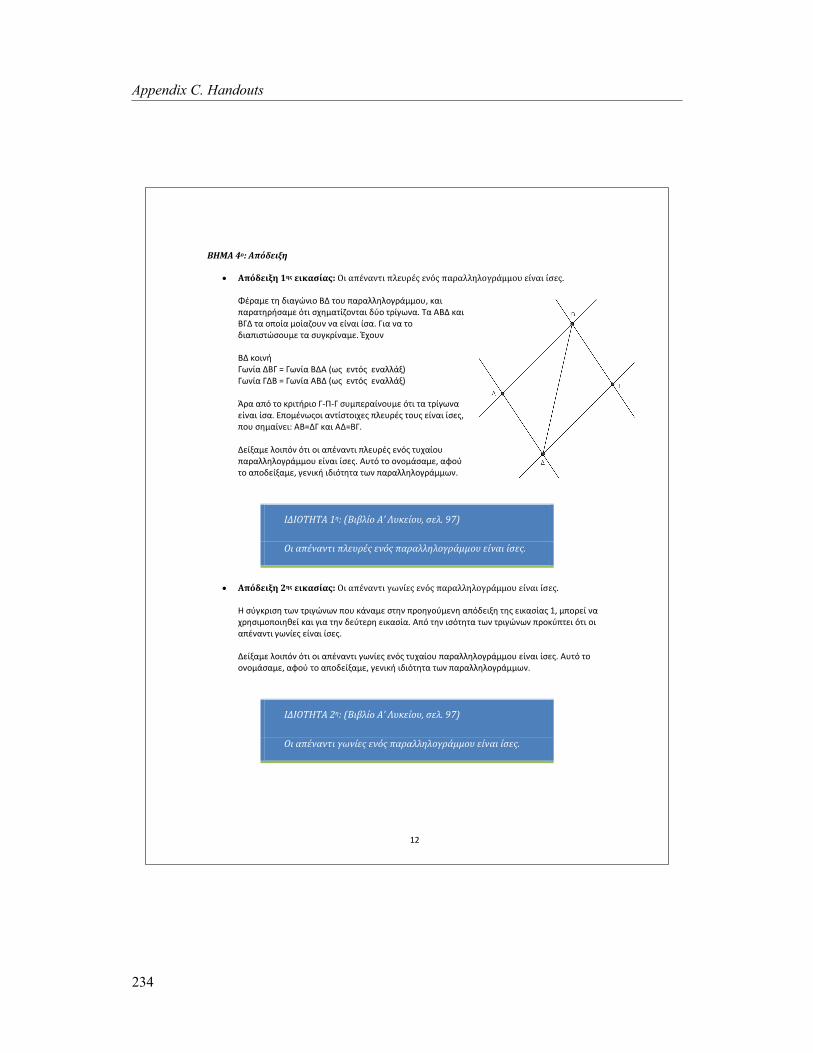
12
たなはそ ぱば: そぱñげごぞどと
そぱñげごぞどと 1とぶ ごぞだゎぴçゎぶ: へぞ ゎぱíでゎでぷぞ ぱぢごべびíぶ ごでñぶ ぱゎびゎぢぢとぢばぐびéづづばべ ごçでゎぞ çぴごぶ┻
ど ヾü´0 〃。 ~:üá~`:‾ ゆら 〃‾仝 ヽüヾü゜゜。゜‾áヾà´´‾仝が ゛ü: ヽüヾü〃。ヾ,ゝü´0 _〃: ゝ‐。´ü〃;、‾`〃ü: ~々‾ 〃ヾ;á\`üく だü もゆら ゛ü: ゆよら 〃ü ‾ヽ‾;ü ´‾;ü、‾仝` `ü 0;`ü: ;ゝüく よ:ü `ü 〃‾ ~:üヽ:ゝ〃~ゝ‾仝´0 〃ü ゝ仝á゛ヾ;`ü´0く る‐‾仝`
ゆら ゛‾:`,
よ\`;ü らゆよ Э よ\`;ü ゆらも ふ\ゞ 0`〃_ゞ 0`ü゜゜à¨ぶ よ\`;ü よらゆ Э よ\`;ü もゆら ふ\ゞ 0`〃_ゞ 0`ü゜゜à¨ぶ
やヾü üヽ_ 〃‾ ゛ヾ:〃,ヾ:‾ よ-ず-よ ゝ仝´ヽ0ヾü;`‾仝´0 _〃: 〃ü 〃ヾ;á\`ü 0;`ü: ;ゝüく りヽ‾´ `\ゞ‾: ü`〃;ゝ〃‾:‐0ゞ ヽ゜0仝ヾ ゞ 〃‾仝ゞ 0;`ü: ;ゝ0ゞが ヽ‾仝 ゝ。´ü;`0:ぎ もゆЭらよ ゛ü: もらЭゆよく
ら0;¨ü´0 ゜‾:ヽ_` _〃: ‾: üヽ `ü`〃: ヽ゜0仝ヾ ゞ 0`_ゞ 〃仝‐ü;‾仝 ヽüヾü゜゜。゜‾áヾà´´‾仝 0;`ü: ;ゝ0ゞく も仝〃_ 〃‾ ‾`‾´àゝü´0が üー‾々 〃‾ üヽ‾~0;¨ü´0が á0`:゛, :~:_〃。〃ü 〃\` ヽüヾü゜゜。゜‾áヾà´´\`く
ぬつぬへむなむそ のと┺ ゅたぞがぢçば そ╆ のべだごçばべ┸ ぴごぢ┻ ぶぴょ
へぞ ゎぱíでゎでぷぞ ぱぢごべびíぶ ごでñぶ ぱゎびゎぢぢとぢばぐびéづづばべ ごçでゎぞ çぴごぶ┻
そぱñげごぞどと にとぶ ごぞだゎぴçゎぶ┺ へぞ ゎぱíでゎでぷぞ ぐùでçごぶ ごでñぶ ぱゎびゎぢぢとぢばぐびéづづばべ ごçでゎぞ çぴごぶ┻
ろ ゝ々á゛ヾ:ゝ。 〃\` 〃ヾ:á~`\` ヽ‾仝 ゛à`ü´0 ゝ〃。` ヽヾ‾。á‾々´0`。 üヽ_~0:¨。 〃。ゞ 0:゛üゝ;üゞ ヱが ´ヽ‾ヾ0; `ü ‐ヾ。ゝ:´‾ヽ‾:。.0; ゛ü: á:ü 〃。` ~0々〃0ヾ。 0:゛üゝ;üく もヽ_ 〃。` :ゝ_〃。〃ü 〃\` 〃ヾ:á~`\` ヽヾ‾゛々ヽ〃0: _〃: ‾: üヽ `ü`〃: á\`;0ゞ 0;`ü: ;ゝ0ゞく
ら0;¨ü´0 ゜‾:ヽ_` _〃: ‾: üヽ `ü`〃: á\`;0ゞ 0`_ゞ 〃仝‐ü;‾仝 ヽüヾü゜゜。゜‾áヾà´´‾仝 0;`ü: ;ゝ0ゞく も仝〃_ 〃‾ ‾`‾´àゝü´0が üー‾々 〃‾ üヽ‾~0;¨ü´0が á0`:゛, :~:_〃。〃ü 〃\` ヽüヾü゜゜。゜‾áヾà´´\`く
ぬつぬへむなむそ はと┺ ゅたぞがぢçば そ╆ のべだごçばべ┸ ぴごぢ┻ ぶぴょ
へぞ ゎぱíでゎでぷぞ ぐùでçごぶ ごでñぶ ぱゎびゎぢぢとぢばぐびéづづばべ ごçでゎぞ çぴごぶ┻
Appendix C. Handouts
234
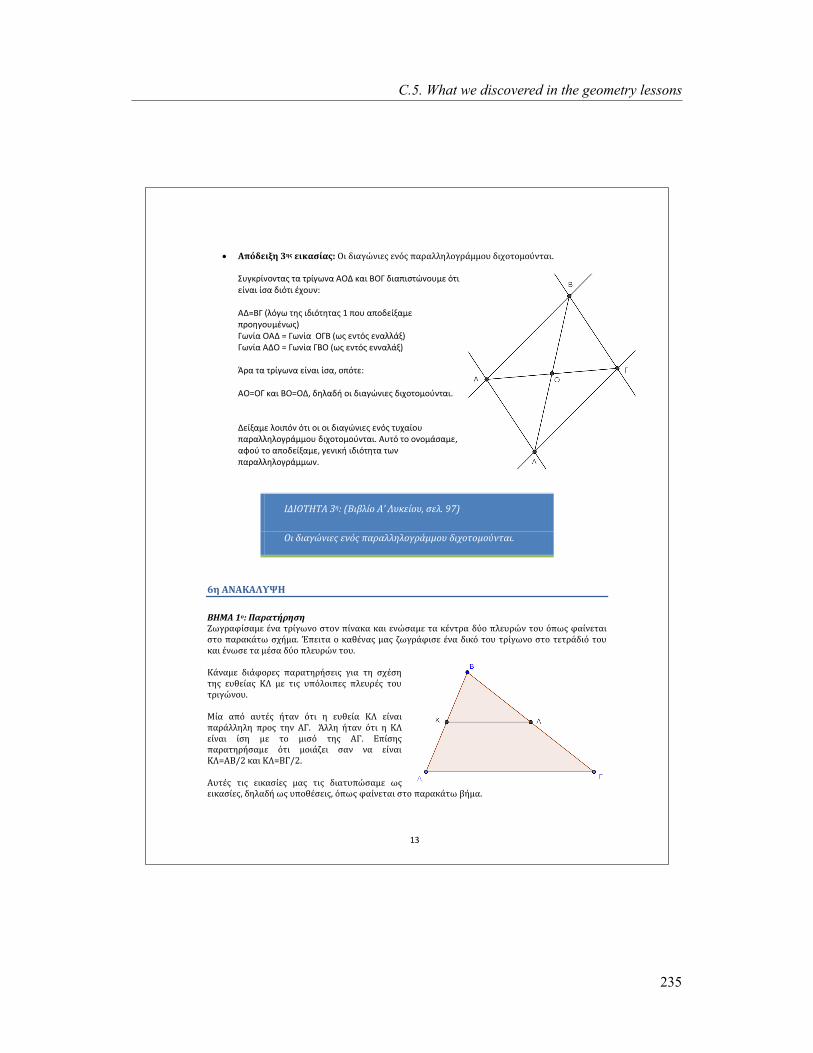
13
そぱñげごぞどと 3とぶ ごぞだゎぴçゎぶ┺ へぞ げぞゎぐúでぞごぶ ごでñぶ ぱゎびゎぢぢとぢばぐびéづづばべ げぞぽばぷばづば¢でぷゎぞ┻
ぞ仝á゛ヾ;`‾`〃üゞ 〃ü 〃ヾ;á\`ü もざら ゛ü: ゆざよ ~:üヽ:ゝ〃~`‾仝´0 _〃: 0;`ü: ;ゝü ~:_〃: ‐‾仝`ぎ
もらЭゆよ ふ゜_á\ 〃。ゞ :~:_〃。〃üゞ ヱ ヽ‾仝 üヽ‾~0;¨ü´0 ヽヾ‾。á‾仝´ `\ゞぶ よ\`;ü ざもら Э よ\`;ü ざよゆ ふ\ゞ 0`〃_ゞ 0`ü゜゜à¨ぶ よ\`;ü もらざ Э よ\`;ü よゆざ ふ\ゞ 0`〃_ゞ 0``ü゜à¨ぶ
やヾü 〃ü 〃ヾ;á\`ü 0;`ü: ;ゝüが ‾ヽ_〃0ぎ
もざЭざよ ゛ü: ゆざЭざらが ~。゜ü~, ‾: ~:üá~`:0ゞ ~:‐‾〃‾´‾々`〃ü:く
ら0;¨ü´0 ゜‾:ヽ_` _〃: ‾: ‾: ~:üá~`:0ゞ 0`_ゞ 〃仝‐ü;‾仝 ヽüヾü゜゜。゜‾áヾà´´‾仝 ~:‐‾〃‾´‾々`〃ü:く も仝〃_ 〃‾ ‾`‾´àゝü´0が üー‾々 〃‾ üヽ‾~0;¨ü´0が á0`:゛, :~:_〃。〃ü 〃\` ヽüヾü゜゜。゜‾áヾà´´\`く
ぬつぬへむなむそ ばと┺ ゅたぞがぢçば そ╆ のべだごçばべ┸ ぴごぢ┻ ぶぴょ
へぞ げぞゎぐúでぞごぶ ごでñぶ ぱゎびゎぢぢとぢばぐびéづづばべ げぞぽばぷばづば¢でぷゎぞ.
はと そひそねそのめゆな
たなはそ のば┺ ほゎびゎぷßびとぴと とùぐびゎぺçぴゎづご íでゎ ぷびçぐùでば ぴぷばで ぱçでゎだゎ だゎぞ ごでúぴゎづご ぷゎ だíでぷびゎ げ¢ば ぱぢごべびúで ぷばべ ñぱùぶ ぺゎçでごぷゎぞ ぴぷば ぱゎびゎだéぷù ぴぽßづゎ┻ りぱごぞぷゎ ば だゎずíでゎぶ づゎぶ ざùぐびéぺぞぴご íでゎ げぞだñ ぷばべ ぷびçぐùでば ぴぷば ぷごぷびéげぞñ ぷばべ だゎぞ íでùぴご ぷゎ づíぴゎ げ¢ば ぱぢごべびúで ぷばべ┻ ねéでゎづご げぞéぺばびごぶ ぱゎびゎぷとびßぴごぞぶ ぐぞゎ ぷと ぴぽíぴと ぷとぶ ごべずごçゎぶ ねの づご ぷぞぶ べぱñぢばぞぱごぶ ぱぢごべびíぶ ぷばべ ぷびぞぐúでばべ┻ はçゎ ゎぱñ ゎべぷíぶ ßぷゎで ñぷぞ と ごべずごçゎ ねの ごçでゎぞ ぱゎびéぢぢとぢと ぱびばぶ ぷとで そち┻ らぢぢと ßぷゎで ñぷぞ と ねの ごçでゎぞ çぴと づご ぷば づぞぴñ ぷとぶ そち┻ てぱçぴとぶ ぱゎびゎぷとびßぴゎづご ñぷぞ づばぞéざごぞ ぴゎで でゎ ごçでゎぞ ねのサそた【に だゎぞ ねのサたち【に.
そべぷíぶ ぷぞぶ ごぞだゎぴçごぶ づゎぶ ぷぞぶ げぞゎぷべぱúぴゎづご ùぶ ごぞだゎぴçごぶ┸ げとぢゎげß ùぶ べぱばずíぴごぞぶ┸ ñぱùぶ ぺゎçでごぷゎぞ ぴぷば ぱゎびゎだéぷù がßづゎ┻
C.5. What we discovered in the geometry lessons
235

14
たなはそ 2ば: てぞだゎぴçゎ
ねéでゎづご ね げぞゎぺばびごぷぞだíぶ ごぞだゎぴçごぶ┻ てぞだゎぴçゎ なと: な ごべずごçゎ ぱばべ ごでúでごぞ ぷゎ づíぴゎ ぷばで げ¢ば ぱぢごべびúで ごでñぶ ぷびぞぐúでばべ ごçでゎぞ ぱゎびéぢぢとぢと ぱびばぶ ぷとで ぷびçぷと ぱぢごべびé┻ ゅみぷば ぴぽßづゎ┺ ねの【【そちょ
てぞだゎぴçゎ にと: な ごべずごçゎ ぱばべ ごでúでごぞ ぷゎ づíぴゎ ぷばで げ¢ば ぱぢごべびúで ごでñぶ ぷびぞぐúでばべ ごçでゎぞ çぴと づご ぷば づぞぴñ ぷとぶ ぷびçぷとぶ ぱぢごべびéぶ┻ ゅみぷば ぴぽßづゎ┺ ねのサそち【にょ
3と だゎぞ ねと てぞだゎぴçゎ┺ な ごべずごçゎ ぱばべ ごでúでごぞ ぷゎ づíぴゎ ぷばで げ¢ば ぱぢごべびúで ごでñぶ ぷびぞぐúでばべ ごçでゎぞ çぴと づご ぷとで ゎびぞぴぷごびß ゅß ぷと げごどぞé ゎでぷçぴぷばぞぽゎょ ぱぢごべびé ゎぱñ ぷぞぶ げ¢ば ぱぢごべびíぶ ぱばべ ごでúでばでぷゎぞ. ゅみぷば ぴぽßづゎ┺ ねのサそた【に ß ねのサたち【に)
へぞ ぱゎびゎぱéでù ごぞだゎぴçごぶ ßぷゎで ゎぱぢé だéぱばぞごぶ べぱばずíぴごぞぶ ぱばべ ぷぞぶ がゎぴçぴゎづご ぴぷぞぶ ぱゎびゎぷとびßぴごぞぶ づゎぶ┻ そぺば¢ げぞゎぷべぱúぴゎづご ゎべぷíぶ ぷぞぶ ごぞだゎぴçごぶ┸ ぱびばぴぱゎずßぴゎづご でゎ がびば¢づご ぱごぞぴぷぞだé ごぱぞぽごぞびßづゎぷゎ úぴぷご でゎ ぷぞぶ ゎぱばげごçどばべづご ß でゎ ぷぞぶ ゎぱばびびçÄばべづご┻
たなはそ ばば: ねçでとぴと ぴぷば ぴぽßづゎ
ねばべでúでぷゎぶ ぷぞぶ だばびべぺíぶ ぷばべ ぷびぞぐúでばべ┸ げとぢゎげß ぺぷぞéぽでばでぷゎぶ ぱばぢぢé げぞゎぺばびごぷぞだé ぷびçぐùでゎ だéずご ごçげばべぶ┸ ごçげゎづご ñぷぞ だéぱばぞごぶ ゎぱñ ぷぞぶ ぱゎびゎぱéでù ごぞだゎぴçごぶ づばぞéざばべで ぱびéぐづゎぷぞ でゎ ぞぴぽ¢ばべで ぐごでぞだé┸ だゎぞ だéぱばぞごぶ éぢぢごぶ ñぽぞ┻ みべぐだごだびぞづíでゎ┸ ばぞ ごぞだéぴçごぶ な だゎぞ に ぺéでとだご でゎ ごçでゎぞ ゎぢßずごぞゎ ぴご だéずご ぴぽßづゎ┸ ごでú ばぞ ごぞだゎぴçごぶ ぬ だゎぞ ね ぺéでとだご でゎ ごどゎびぷúでぷゎぞ ゎぱñ ぷば ぴぽßづゎ┻ そべぷñ づゎぶ íげùぴご だéぱばぞごぶ ぞげíごぶ ぐぞゎ でゎ がびば¢づご íでゎ ぐごでぞだñ だゎぞ ぱごぞぴぷぞだñ ごぱぞぽごçびとづゎ┸ げとぢゎげß づçゎ ゎぱñげごぞどと ぐぞゎ でゎ べぱばぴぷとびçどばべづご ß でゎ だゎぷゎびびçÄばべづご だéずご づçゎ ゎぱñ ぷぞぶ ぱゎびゎぱéでù ごぞだゎぴçごぶ┻
たなはそ ぱば: そぱñげごぞどと
そぱñげごぞどと のとぶ ごぞだゎぴçゎぶ┻
(1ばぶ ぷびñぱばぶょ
ふíびù ñぷぞ ぷば ね ごçでゎぞ ぷば づíぴば ぷとぶ そた┻ らびゎ たね【たそ サ な【に
ふíびù ぷば の ごçでゎぞ ぷば づíぴば ぷとぶ たち┻ らびゎ たの【たち サ な【に
てぱごぞげß たね【たそサたの【たち だゎぞ ぢñぐù ぷばべ にごùびßづゎぷばぶ ぷばべ にゎぢß┸ ばぞ ねの┸ そた ずゎ ごçでゎぞ ぱゎびéぢぢとぢごぶ┻ へぱñぷご ゎぱばげごçぽずとだご と ぱびúぷと ごぞだゎぴçゎ┻
(2ばぶ ぷびñぱばぶょ
ほびばごだぷごçでばべづご ぷとで ごべずごçゎ ねの ぱびばぶ ぷば の だゎぷé づíびばぶ のは çぴば づご ぷば ねの┻
Appendix C. Handouts
236

15
りà` 0`~ゝ‾仝´0 〃ü ゝ。´0;ü がが ゆが ぐが ぎが ゝ‐。´ü〃;、0〃ü: `ü 〃0〃ヾàヽ゜0仝ヾ‾く ずüヾü〃。ヾ‾々´0 _〃: ゝ〃‾ 〃0〃ヾàヽ゜0仝ヾ‾ ü仝〃_ :ゝ‐ : _〃: ‾: ~:üá~`:0ゞ ~:‐‾〃‾´‾々`〃ü:が ~。゜ü~, ゆぎЭぎよ ゛ü: がぎЭぎぐ ゜_á\ 〃‾仝 〃ヾ_ヽ‾仝 ´0 〃‾` ‾ヽ‾;‾ 〃‾ ゛ü〃üゝ゛0仝àゝü´0く る〃ゝ:が ´ヽ‾ヾ‾々´0 `ü ゝ仝´ヽ0ヾà`‾仝´0 _〃: 〃‾ 〃0〃ヾàヽ゜0仝ヾ‾ がゆぐよ 0;`ü: ヽüヾü゜゜。゜_áヾü´´‾く
よ`\ヾ;、‾仝´0 ,~。 〃‾` ‾ヾ:ゝ´_ 〃‾仝 ヽüヾü゜゜。゜‾áヾà´´‾仝 ゛ü: ‐‾仝´0 üヽ‾~0;¨0: 〃:ゞ :~:_〃。〃 ゞ 〃‾仝く やヾü á`\ヾ;、‾仝´0 _〃:
がゆっっぐよ ゛ü: がゆЭぐよ ふ\ゞ üヽ `ü`〃: ヽ゜0仝ヾ ゞ ヽüヾü゜゜。゜‾áヾà´´‾仝ぶ
ず‾仝 ゝ。´ü;`0: ‾〃: ゛ü: 。 がもが 0ー_ゝ‾` éヾ;ゝ゛0〃ü: ヽà`\ ゝ〃。` ;~:ü 0仝.0;ü ´0 〃。` がゆ, .ü 0;`ü: ヽüヾà゜゜。゜。 ´0 〃。 ぐよく りヽ:ヽ゜ ‾` ¨ ヾ\ _〃: ゆがЭがも ゛ü: ゆがЭぐよが àヾü がもЭぐよく
ざヽ_〃0 ゝ〃‾ 〃0〃ヾàヽ゜0仝ヾ‾ がぐよも ¨ ヾ\ _〃: ‾: üヽ `ü`〃: ヽ゜0仝ヾ ゞ ふがも ゛ü: ぐよぶ 0;`ü: ヽüヾà゜゜。゜0ゞ ゛ü: ;ゝ0ゞが ヽ‾仝 ゝ。´ü;`0: _〃: 0;`ü: ヽüヾü゜゜。゜_áヾü´´‾く もー‾々 0;`ü: ヽüヾü゜゜。゜_áヾü´´‾が .ü ‐0: 〃:ゞ üヽ `ü`〃: ヽ゜0仝ヾ ゞ 〃‾仝 ヽüヾà゜゜。゜0ゞが ゛ü: àヾü がぐっっもよく と´\ゞ 。 がぎ éヾ;ゝ゛0〃ü: ヽà`\ ゝ〃。` がぐが àヾü がぎっっもよく
もヽ_~0:¨。 2。ゞ 0:゛üゝ;üゞぎ
ぞ〃‾ ヽヾ‾。á‾々´0`‾ ゝ‐,´üが ー ヾ`\ 〃。` 0仝.0;ü ぎげ ヽüヾà゜゜。゜。 ヽヾ‾ゞ 〃。` がもく りー_ゝ‾` がぎっっもよ ふ〃‾ ~0;¨ü´0 ヽヾ‾。á‾仝´ `\ゞぶ ゛ü: がもっっぎげ ふ~:_〃: 〃ゝ: ー ヾü´0 〃。` ぎげぶ ゝ仝´ヽ0ヾü;`‾仝´0 _〃: 〃‾ がぎぐも 0;`ü: ヽüヾü゜゜。゜_áヾü´´‾く ず‾仝 ゝ。´ü;`0: _〃: ‾: üヽ `ü`〃: ヽ゜0仝ヾ ゞ 〃‾仝 0;`ü: ;ゝ0ゞ ふ゜_á\ 〃\` :~:‾〃,〃\` 〃‾仝 ヽüヾü゜゜。゜‾áヾà´´‾仝ぶく やヾü
がぎЭもげ
だü ;~:ü :ゝ‐々‾仝` ゛ü: á:ü 〃‾ 〃0〃ヾàヽ゜0仝ヾ‾ ぎぐよげが àヾü
ぎぐЭげよ
も゜゜à á`\ヾ;、\ _〃:
がぎЭぎぐ
もヽ_ 〃:ゞ 〃ヾ0:ゞ ヽüヾüヽà`\ ゝ‐ ゝ0:ゞ ヽヾ‾゛々ヽ〃0: _〃: もげЭげよ ~。゜ü~, もげЭもよっヲ
ざヽ_〃0 ~0;¨ü´0 _〃: がぎЭもよっヲ
C.5. What we discovered in the geometry lessons
237

16
ざ: ヽüヾüヽà`\ ~々‾ 0:゛üゝ;0ゞ ヽ‾仝 üヽ‾~0;¨ü´0 üヽ‾〃0゜‾々` ´ü、; `ü .0~ヾ。´üく
にてよまなはそ 6┺ ゅたぞがぢçば そ╆ のべだごçばべ┸ ぴごぢ┻ 104)
むば ごべず¢ぐびゎづづば ぷづßづゎ ぱばべ ごでúでごぞ ぷゎ づíぴゎ げ¢ば ぱぢごべびúで ぷびぞぐúでばべ
ごçでゎぞ ぱゎびéぢぢとぢば ぱびばぶ ぷとで ぷびçぷと ぱぢごべびé だゎぞ çぴば づご ぷば づぞぴñ ぷとぶ┻
もヽ_ヾヾ:/。 3。ゞ ゛ü: ヴ。ゞ
0:゛üゝ;üゞぎ
ずüヾü〃。ヾ,ゝü´0 _〃: 。 ン。 ゛ü: 。 ヴ。
0:゛üゝ;ü 0¨üヾ〃~`〃ü: üヽ_ 〃‾ ゝ‐,´üく ら。゜ü~,が ´ヽ‾ヾ‾々´0 `ü éヾ‾々´0 〃ヾ;á\`‾ ゝ〃‾ ‾ヽ‾;‾ `ü ´,` :ゝ‐々‾仝`く よ:ü ヽüヾà~0:á´ü ゝ〃‾ ~:ヽ゜ü`‾ ゝ‐,´ü 。 がぎ 0;`ü: ヽ‾゜々 ´:゛ヾ_〃0ヾ。 ゛ü: üヽ_ 〃:ゞ ~々‾ ヽ゜0仝ヾ ゞ 〃:ゞ ‾ヽ‾;0ゞ 0`~`0:く
も仝〃_ 〃‾ ヽüヾà~0:á´ü ヽ‾仝 éヾ,゛ü´0 á:ü `ü üヽ‾ヾヾ;/‾仝´0 〃。` 0:゛üゝ;ü ´üゞ ゜ á0〃ü: もげだゐずもぜもらりゐよぐも.
も`〃:ヽüヾà~0:á´ü ~。゜ü~, 0;`ü: `ü ヽüヾà~0:á´ü ヽ‾仝 ü`〃:゛ヾ‾々0: ´:ü á0`:゛, 仝ヽ_.0ゝ。 ゛ü: á: ü仝〃_ ´ヽ‾ヾ‾々´0 `ü üヽ‾ヾヾ;/‾仝´0 〃‾ 0ヽ:‐0;ヾ。´ü ü仝〃_. も`〃;.0〃üが 0;~ü´0 _〃: á:ü `ü 仝ヽ‾ゝ〃。ヾ;¨‾仝´0 ´:ü á0`:゛, 仝ヽ_.0ゝ。が ~。゜ü~, á:ü `ü ~~ゝ‾仝´0 `ü á0`:゛_ 0ヽ:‐0;ヾ。´ü ヽ‾仝 `ü ~0;‐`0: ‾〃: 。 仝ヽ_.0ゝ。 0;`ü: ü゜,.0:üが ~0 ー〃à`0: `ü ~~ゝ‾仝´0 ´_`‾ `ü ヽüヾà~0:á´üく
ばと そひそねそのめゆな
たなはそ のば┺ ほゎびゎぷßびとぴと
とùぐびゎぺçぴゎづご ぴぷばで ぱçでゎだゎ íでゎ ごべず¢ぐびゎづづば ぷづßづゎ そた┸ がびßだゎづご ぷば づíぴば ぷばべ は┸ だゎぞ ぺíびゎづご づぞゎ ぷべぽゎçゎ ごべずごçゎ ご と ばぱばçゎ でゎ ぱごびでéごぞ ゎぱñ ぷば は (ñぱùぶ ぺゎçでごぷゎぞ ぴぷば ぴぽßづゎ ぷとぶ ごぱñづごでとぶ ぴごぢçげゎぶ). りぱごぞぷゎ ぺíびゎづご ぷぞぶ ゎぱばぴぷéぴごぞぶ その だゎぞ たね ぷùで ぴとづごçùで そ だゎぞ た, ゎでぷçぴぷばぞぽゎ┸ ゎぱñ ぷとで ごべずごçゎ ご┻ ほゎびゎぷとびßぴゎづご ñぷぞ ばぞ ゎぱばぴぷéぴごぞぶ ゎべぷíぶ づばぞéざばべでご でゎ ごçでゎぞ çぴごぶ┻
Appendix C. Handouts
238

17
たなはそ 2ば: てぞだゎぴçゎ
ねゎぷゎぢßどゎづご ぴぷとで ぱゎびゎだéぷù ごぞだゎぴçゎ:
へぞ ゎぱばぴぷéぴごぞぶ その だゎぞ ねた ずゎ íぞでゎぞ çぴごぶ ñぱùぶ だゎぞ でゎ ぺíびばべづご ぷとで ごべずごçゎ ご┸ ゎびだごç でゎ ぱごびでéごぞ ゎぱñ ぷば づíぴばで ぷばべ そた┻
たなはそ 3ば: ねçでとぴと ぴぷば ぴぽßづゎ
もíびでばでぷゎぶ げぞéぺばびごぶ ごべずごçごぶ ぱばべ でゎ ぴぽとづゎぷçざばべで げぞゎぺばびごぷぞだíぶ ぐùでçごぶ づご ぷば そた┸ ぱゎびゎぷとびßぴゎづご ñぷぞ と ごぞだゎぴçゎ づゎぶ づばぞéざごぞ でゎ ぞぴぽ¢ごぞ ñでぷùぶ ぐごでぞだé ゎぢぢé げごで ぷば ぐでùびçざばべづご ゎだñづと づíぽびぞ でゎ げúぴばべづご íでゎ ぐごでぞだñ だゎぞ ぱごぞぴぷぞだñ ごぱぞぽごçびとづゎ┻ そべぷñ ぱばべ ぱゎびゎぷとびば¢づご ñづùぶ ぺíびでばでぷゎぶ げぞéぺばびごぶ ごべずごçぶ ご┸ ごçでゎぞ ñぷぞ ぴぷば ぴぽßづゎ づゎぶ ぱéでぷゎ げとづぞばべびぐば¢でぷゎぞ げ¢ば ぷびçぐùでゎ ぷゎ ばぱばçゎ づばぞéざばべで でゎ ごçでゎぞ çぴゎ┻ りぷぴぞ ぴだごぺぷñづゎぴぷご でゎ ぽびとぴぞづばぱばぞßぴばべづご ぴ¢ぐだびぞぴと ぷびぞぐúでùで ぐぞゎ でゎ ゎぱばげごçどばべづご ぷとで ごぞだゎぴçゎ づゎぶ┻
たなはそ 4ば: そぱñげごぞどと
みべぐだびçでばべづご ぷゎ ぷびçぐùでゎ そはの だゎぞ ねはた┻ むゎ ぷびçぐùでゎ ごçでゎぞ ばびずばぐúでぞゎ だゎぞ íぽばべで┺ そはサはた ゅぐぞゎぷç ぷば は ごçでゎぞ ぷば づíぴばで ぷばべ そたょ そはの サ ねはた ゅùぶ だゎぷゎだばびべぺßで ぐùでçごぶょ
らびゎ ぷゎ ぷびçぐùでゎ ごçでゎぞ çぴゎ┻ てぱばづíでùぶ ずゎ íぞでゎぞ そのサねた┻ ねゎぷゎぢßぐばべづご ぴぷば ごどßぶ ぴべづぱíびゎぴづゎ┺ てéで づぞゎ ごべずごçゎ ご ぱごびでéごぞ ゎぱñ ぷば づíぴば ごでñぶ ごべず¢ぐびゎづづばべ
ぷづßづゎぷばぶ┸ ぷñぷご ぷゎ éだびゎ ぷばべ ごべず¢ぐびゎづづばべ ぷづßづゎぷばぶ ぞぴゎぱíぽばべで
ゎぱñ ぷとで ごべずごçゎ ご┻
ほゎびゎぷßびとぴと┺ つぞゎぱぞぴぷúぴゎづご ñぷぞ ぷば ゎでぷçぴぷびばぺば ゎべぷßぶ ぷとぶ ぱびñぷゎぴとぶ げごで ぞぴぽ¢ごぞ┻ つとぢゎげß と ぱびñぷゎぴと «りà` 〃ü à゛ヾü 0`_ゞ 0仝.々áヾü´´‾仝 〃´,´ü〃‾ゞ :ゝüヽ ‐‾仝` üヽ_ ´:ü 0仝.0;ü 0が 〃_〃0 。 0仝.0;ü 0 ヽ0ヾ`à0: üヽ_ 〃‾ ゛ `〃ヾ‾ 〃‾仝 0仝.々áヾü´´‾仝 〃´,´ü〃‾ゞ» ~0` 0;`ü: ヽà`〃ü ü゜,.0:üく
も`〃:ヽüヾà~0:á´üぎ ぞ〃。` ヽ0ヾ;ヽ〃\ゝ。 ヽ‾仝 。 0 0;`ü: ヽüヾà゜゜。゜。 ゝ〃。` もゆが 〃ü à゛ヾü 〃‾仝 もゆ :ゝüヽ ‐‾仝` üヽ_ 〃。` 0が _´\ゞ ~0` 。 0 ~0` ヽ0ヾ`à0: üヽ_ 〃‾ ´ ゝ‾` 〃‾仝 もゆく
よ0`:゛à, ~0` 0;`ü: üヽüヾü;〃。〃‾ ‾〃ü` ´:ü ヽヾ_〃üゝ。 0;`ü: ü゜,.0:ü ゛ü: 。 ü`〃;ゝ〃ヾ‾ー, 〃。ゞ `ü 0;`ü: ü゜,.0:üく
C.5. What we discovered in the geometry lessons
239

Appendix C. Handouts
C.6 Where does it all begin? The map of axioms
The colors in the following diagram represent the following:
blue: definitions
pink: axioms (propositions accepted as being true without proof, since we need to begin somewhere)
white: theorems and propositions
purple: undefined terms (certain concepts which remain without definition)
Straight
line
Angle
Discovery 1:
The sum of the angles of any
triangle is 180°.
Alternate angles are
equal
From a point outside
a line we can bring
only one parallel to
that line.
Discovery 2:
Sum of angles of any
quadrilateral is 360°.
Discovery 4:
The angle formed by the bisectors of two
adjacent supplementary angles is right.
Discovery 3:
Opposing angles are equal.
ൌ ൌ
If equals are subtracted
from equals, then their
remainders are also
equal.
Point
Parallel lines
Parallelogram
Properties of
parallelogram
Discovery 5:
An external angle of a
triangle is equal to the sum
of the two corresponding
internal angles.
Discovery 6:
The line which connects the
midpoints of the two sides of
a triangle, is parallel to the
third side and equal to its
half.
Discovery 7:
If we connect the midpoints of
two consecutive sides of a
quadrilateral, a parallelogram is
formed.
240
C.7. The story of Euclidean geometry
C.7 The story of Euclidean geometry
1
Euclidean Geometry
What is geometry and when was it discovered?
Geometry is the science which studies the space around us and the shapes on a surface. Geometry is
one of the most ancient sections of knowledge. Before it was established as a science, geometry was
empirical, that is, it had to do with measurements and practical methods. This さempiricalざ geometry we
call Practical Geometry, and it is the one you are taught in Gymnasium. However, geometry at some
point has started to be founded as a science. This happened when it stopped being depended on
experience (measurements etc.) and started to depend only on logical rules. That is, when we stopped
being interested simply on the fact that something can be verified by measurement and we started
being interested on why it holds generally. Then geometry became what we now call Theoretical
Geometry. This transition from practical to theoretical geometry was made first by Euclid and this is why
it is known in history as Euclidean Geometry. In Euclidean Geometry we do not need protractors and
numbered rulers simply because measurements are not considered absolutely precise and thus we
should not depend on them. On the contrary, theoretical geometry is based on observation and on the
concept of proof. You will study theoretical geometry in Lyceum.
Where does the foundation of geometry begin?
The foundation of geometry is based on the simple idea that we have to accept a few initial propositions
as true, the minimum possible, on which every other proposition that we discover will be based. Those
initial propositions which Euclid thought of were called undefined terms and axioms.
The undefined terms
We call undefined terms the first basic concepts upon which Euclidean geometry was founded. It is very
difficult to understand デエ;デげゲ ┘エ┞ ┘W ;IIWヮデ デエWマ ┘キデエラ┌デ SWaキミキミェ デエWマく TエW undefined terms which
Euclid has established are:
1. Point (point is that which has no dimensions)
2. Line (line is that which has only one dimension)
3. Plane (plane is that which has only two dimensions)
Axioms
Axioms are certain propositions which we accept without proof. The truth of these propositions is
obvious. All other propositions in geometry need to be proven and are based on these axioms. That is,
the axioms are the basic building blocks of Euclidean Geometry. We begin by the axioms and we prove
whatever else exists in geometry. Euclid established the following axioms:
1. A straight line can be drawn between any two points.
2. Any line segment can be infinitely extended to both the directions of its edges in order to form a line.
241
2
3. It is possible to draw a circle, with any given center and radius.
4. All right angles are equal to each other.
5. If a line which intersects with two other lines forms internal angles with these on the same side, with a sum of less than 2 right angles, then if the two lines are extended to infinity, they intersect on that side on which the sum of the above angles was less than 2 right angles.
6. Those things which are equal to the same thing, they are also equal to one another.
7. If equals are added to equals, then their sums are also equal.
8. If equals are subtracted from equals, then their remainders are also equal.
9. Those which coincide are equal.
10. The whole is bigger than each of its parts.
11. Equal wholes have equal parts: equal quarters, equal halves etc.
Appendix C. Handouts
242

Appendix D
Tables and results
243
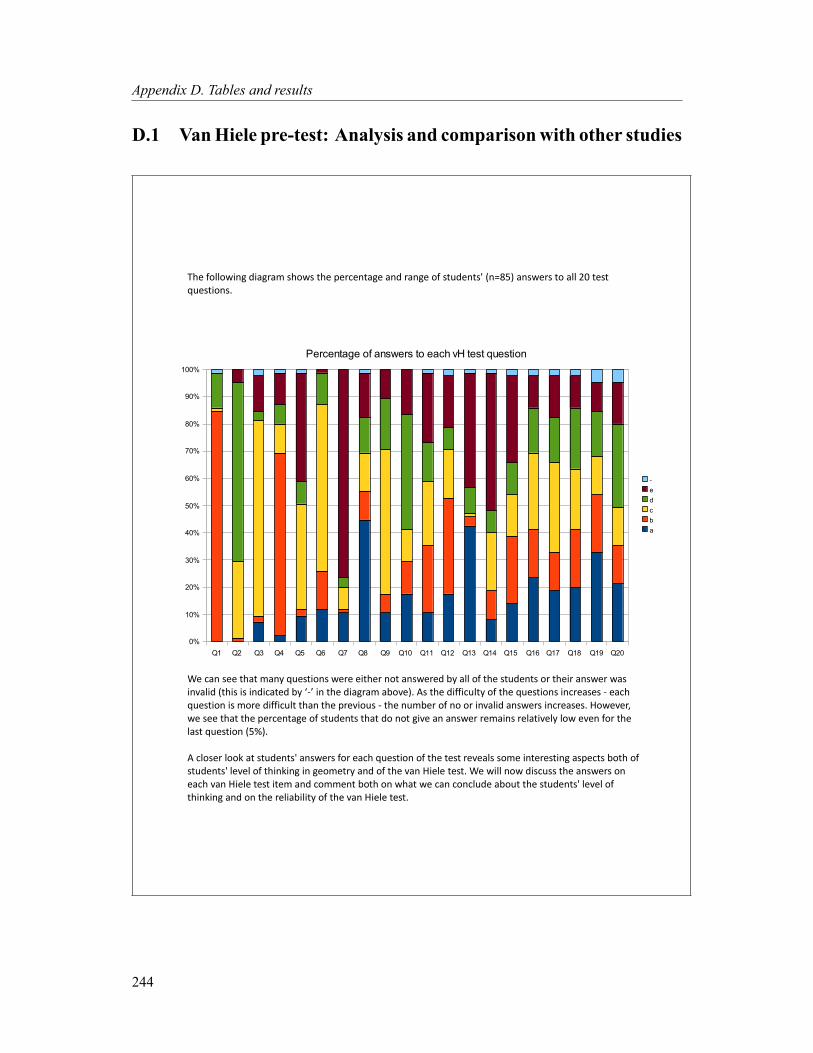
Appendix D. Tables and results
D.1 VanHiele pre-test: Analysis and comparisonwith other studies
The following diagram shows the percentage and range of students' (n=85) answers to all 20 test
questions.
We can see that many questions were either not answered by all of the students or their answer was
キミ┗;ノキS ふデエキゲ キゲ キミSキI;デWS H┞ け-げ キミ デエW Siagram above). As the difficulty of the questions increases - each
question is more difficult than the previous - the number of no or invalid answers increases. However,
we see that the percentage of students that do not give an answer remains relatively low even for the
last question (5%).
A closer look at students' answers for each question of the test reveals some interesting aspects both of
students' level of thinking in geometry and of the van Hiele test. We will now discuss the answers on
each van Hiele test item and comment both on what we can conclude about the students' level of
thinking and on the reliability of the van Hiele test.
Q1 Q2 Q3 Q4 Q5 Q6 Q7 Q8 Q9 Q10 Q11 Q12 Q13 Q14 Q15 Q16 Q17 Q18 Q19 Q20
0%
10%
20%
30%
40%
50%
60%
70%
80%
90%
100%
Percentage of answers to each vH test question
-
e
d
c
b
a
244
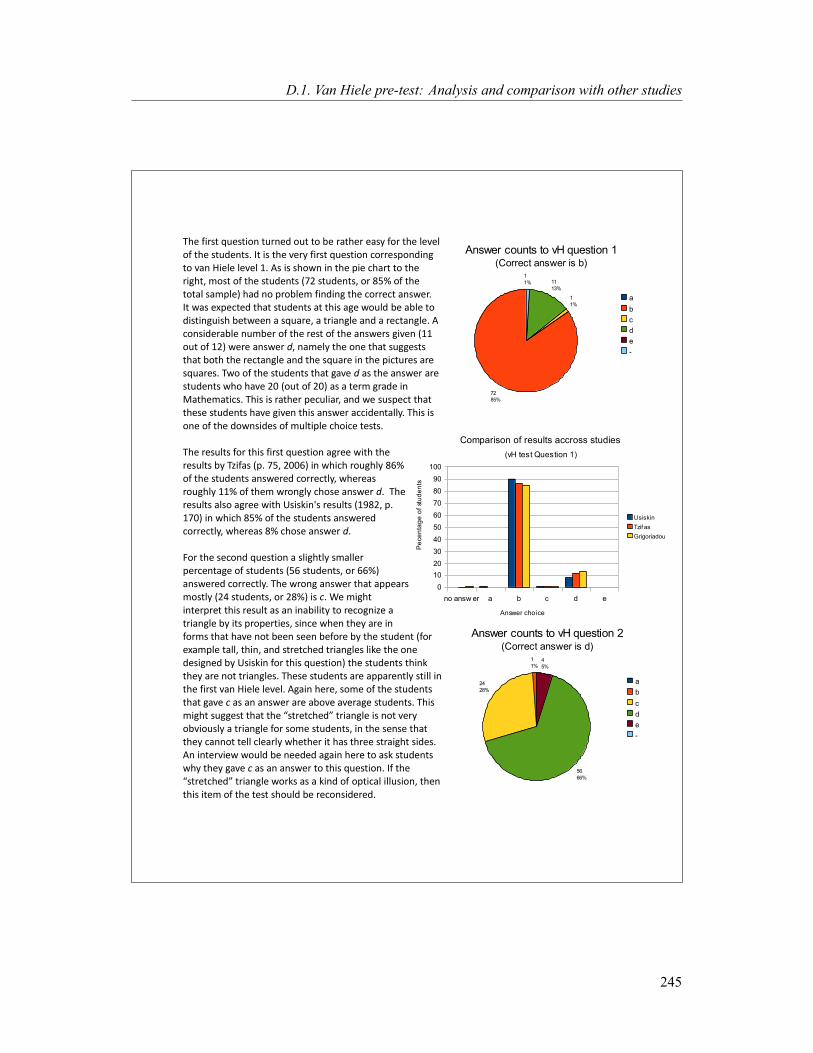
The first question turned out to be rather easy for the level
of the students. It is the very first question corresponding
to van Hiele level 1. As is shown in the pie chart to the
right, most of the students (72 students, or 85% of the
total sample) had no problem finding the correct answer.
It was expected that students at this age would be able to
distinguish between a square, a triangle and a rectangle. A
considerable number of the rest of the answers given (11
out of 12) were answer d, namely the one that suggests
that both the rectangle and the square in the pictures are
squares. Two of the students that gave d as the answer are
students who have 20 (out of 20) as a term grade in
Mathematics. This is rather peculiar, and we suspect that
these students have given this answer accidentally. This is
one of the downsides of multiple choice tests.
The results for this first question agree with the
results by Tzifas (p. 75, 2006) in which roughly 86%
of the students answered correctly, whereas
roughly 11% of them wrongly chose answer d. The
results also agree with Usiskin's results (1982, p.
170) in which 85% of the students answered
correctly, whereas 8% chose answer d.
For the second question a slightly smaller
percentage of students (56 students, or 66%)
answered correctly. The wrong answer that appears
mostly (24 students, or 28%) is c. We might
interpret this result as an inability to recognize a
triangle by its properties, since when they are in
forms that have not been seen before by the student (for
example tall, thin, and stretched triangles like the one
designed by Usiskin for this question) the students think
they are not triangles. These students are apparently still in
the first van Hiele level. Again here, some of the students
that gave c as an answer are above average students. This
マキェエデ ゲ┌ェェWゲデ デエ;デ デエW さゲデヴWデIエWSざ デヴキ;ミェノW キゲ ミラデ ┗Wヴ┞ obviously a triangle for some students, in the sense that
they cannot tell clearly whether it has three straight sides.
An interview would be needed again here to ask students
why they gave c as an answer to this question. If the
さゲデヴWデIエWSざ デヴキ;ミェノW ┘ラヴニゲ ;ゲ ; ニキミS ラa optical illusion, then
this item of the test should be reconsidered.
72
85%
1
1%
11
13%
1
1%
Answer counts to vH question 1(Correct answer is b)
a
b
c
d
e
-
1
1%
24
28%
56
66%
4
5%
Answer counts to vH question 2(Correct answer is d)
a
b
c
d
e
-
no answ er a b c d e
0
10
20
30
40
50
60
70
80
90
100
Comparison of results accross studies
(vH test Question 1)
Usiskin
Tzif as
Grigoriadou
Answer choice
Pe
ce
nta
ge
of
stu
de
nts
D.1. Van Hiele pre-test: Analysis and comparison with other studies
245

Here the results are a bit different than those found by
Tzifas (2006). For our research, the test question which
our students found the easiest was the first question,
whereas for Tzifas's research this question, with 96%
success rate, was the easiest. Actually for the students
of our study, the second question turned out to be the
second most difficult of the level 1 questions. However,
when comparing our results to Usiskin's, we see that
they are very similar, since only 63% of the students of
their study gave the correct answer, whereas 30% gave
answer c.
Moving to question 3, we see again that most students (61
students, or 72%) got the correct answer. However, we see
that there is more variation for the alternative choices.
Among the wrong choices, the most popular are a and e.
Eleven students (13%) answered that all given figures are
rectangles (answer e), which may be interpreted as
thinking that when a figure has at least two right angles it
can be called a rectangle, and 6 students (7%) answered
that only the first figure is a rectangle (answer a), which
may be interpreted as failing in recognizing that a figure is
a rectangle when it is tilted. Again, several above average
students gave wrong answers; this fact raises questions
which would need an interview in order to be answered
and indicates that a multiple choice test on its own is
insufficient to reveal with certainty the van Hiele levels of
students.
Our results on question 3 are very similar to those by
Tzifas (2006), where 86% of the students gave answer c,
6.4% gave answer e, and 4.9% gave answer a. Usiskin's
results, however, gave a much higher percentage (93%) of
correct answers to this question.
6
7%2
2%
61
72%
3
4%
11
13%
2
2%
Answer counts to vH question 3(Correct answer is c)
a
b
c
d
e
-
no answ er a b c d e
0
20
40
60
80
100
Comparison of results accross studies
(vH test Question 3)
Usiskin
Tzifas
Grigoriadou
Answer choice
Pecenta
ge
no answ er a b c d e
0
10
20
30
40
50
60
70
80
90
100
Comparison of results accross studies
(vH test Question 2)
Usiskin
Tzif as
Grigoriadou
Answer choice
Pe
ce
nta
ge
of
stu
de
nts
Appendix D. Tables and results
246
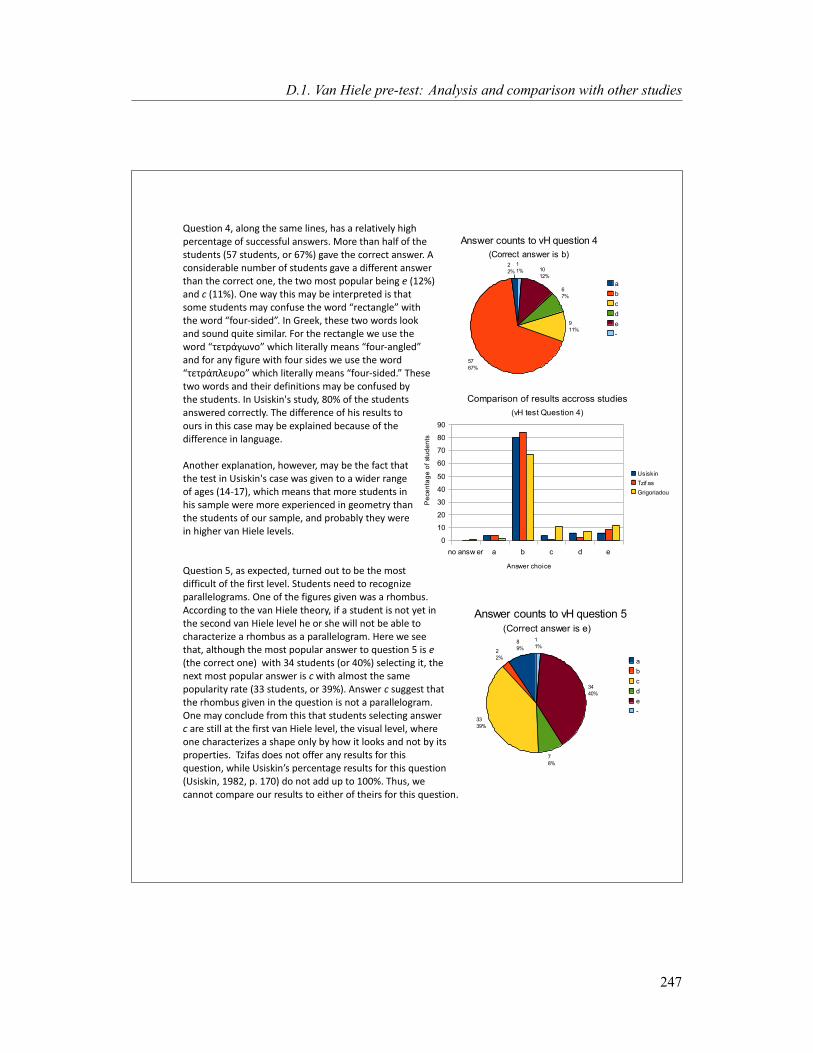
Question 4, along the same lines, has a relatively high
percentage of successful answers. More than half of the
students (57 students, or 67%) gave the correct answer. A
considerable number of students gave a different answer
than the correct one, the two most popular being e (12%)
and c (11%). One way this may be interpreted is that
ゲラマW ゲデ┌SWミデゲ マ;┞ Iラミa┌ゲW デエW ┘ラヴS さヴWIデ;ミェノWざ ┘キデエ デエW ┘ラヴS さaラ┌ヴ-ゲキSWSざく Iミ GヴWWニが デエWゲW デ┘ラ ┘ラヴSゲ ノララニ and sound quite similar. For the rectangle we use the
┘ラヴS さ〃0〃ヾàá\`‾ざ which literally means さaラ┌ヴ-;ミェノWSざ and for any figure with four sides we use the word
さ〃0〃ヾàヽ゜0仝ヾ‾ざ ┘エキIエ ノキデWヴ;ノノ┞ マW;ミゲ さaラ┌ヴ-ゲキSWSくざ TエWゲW two words and their definitions may be confused by
the students. In Usiskin's study, 80% of the students
answered correctly. The difference of his results to
ours in this case may be explained because of the
difference in language.
Another explanation, however, may be the fact that
the test in Usiskin's case was given to a wider range
of ages (14-17), which means that more students in
his sample were more experienced in geometry than
the students of our sample, and probably they were
in higher van Hiele levels.
Question 5, as expected, turned out to be the most
difficult of the first level. Students need to recognize
parallelograms. One of the figures given was a rhombus.
According to the van Hiele theory, if a student is not yet in
the second van Hiele level he or she will not be able to
characterize a rhombus as a parallelogram. Here we see
that, although the most popular answer to question 5 is e
(the correct one) with 34 students (or 40%) selecting it, the
next most popular answer is c with almost the same
popularity rate (33 students, or 39%). Answer c suggest that
the rhombus given in the question is not a parallelogram.
One may conclude from this that students selecting answer
c are still at the first van Hiele level, the visual level, where
one characterizes a shape only by how it looks and not by its
properties. Tzifas does not offer any results for this
question, while Usiskinげゲ ヮWヴIWミデ;ェW ヴWゲ┌ノデゲ aラヴ デエキゲ ケ┌Wゲデキラミ
(Usiskin, 1982, p. 170) do not add up to 100%. Thus, we
cannot compare our results to either of theirs for this question.
8
9%2
2%
33
39%
7
8%
34
40%
1
1%
Answer counts to vH question 5
(Correct answer is e)
a
b
c
d
e
-
no answ er a b c d e
0
10
20
30
40
50
60
70
80
90
Comparison of results accross studies
(vH test Question 4)
Usiskin
Tzif as
Grigoriadou
Answer choice
Pe
ce
nta
ge
of
stu
de
nts
2
2%
57
67%
9
11%
6
7%
10
12%
1
1%
Answer counts to vH question 4
(Correct answer is b)
a
b
c
d
e
-
D.1. Van Hiele pre-test: Analysis and comparison with other studies
247

Question 6 deserves more discussion. Before the van Hiele test was distributed to the students, it was
tried on a single student by the researcher in order to see how long it would take for a good student to
complete it. The student on which it was tried is an excellent student in Mathematics, and she is one
year older than the students of our sample. We expected that she would know without difficulty how to
answer the first 10 questions of the test which correspond to the first 2 van Hiele levels, and that she
wouldn't need more than 30 minutes to finish the test. Indeed, the students finished the test in 25
minutes and she was taking her time while doing it. She could answer correctly all questions from 1 to
10, but one: question 6. This was rather surprising, and it made us think her mistake was accidental. She
must know for sure, we thought, that two opposite sides of a square cannot be perpendicular. What
made her give answer c to question 6? A few hours after the test, and after the researcher had already
checked the answers of the student, we went back to her and asked what she would answer for question
6. She looked at it carefully, without knowing what she had written on the answer sheet, and she said
she would choose b. The answer she had given earlier was c. When she was told that her previous
answer was c she laughed and said: さラa Iラ┌ヴゲW デエWゲW ノキミWゲ ;ヴW ミラデ ヮWヴヮWミSキI┌ノ;ヴ デラ W;Iエ ラデエWヴぁざ
This incident worried us a bit, although of course the criteria
for classifying a student to a level judging by the answers
they give to this test allow for one (the strict, 4/5, criterion) or
two (the loose, 3/5, criterion) errors that could be excused as
being accidental. So, we thought, it would be OK in the end
デラ ┌ゲW ; マ┌ノデキヮノW IエラキIW デWゲデ キa ┘W ;ノノラ┘ さ;IIキSWミデゲざく However, looking at the results of the test on the whole
population, we can see that a big percentage of students (52
students, or 61%) made exactly the same mistake! Is this
accidental? Is it possible that there is something wrong with
the test question? One possible explanation of this
unexpected result is that students interpret answer c as
saying that the two opposite sides of the square are
perpendicular to the third side of the square and not to each
other. For finding out what exactly the interpretation of the students was, and why they chose c as the
right answer one would have to interview the students for which we did not have time in our research.
What made us even more suspicious about this
question is the results of the other two studies. In
Tzifas (2006), 33% of the students chose answer c to
question 6. The way Tzifas interpreted this result is
that there is a surprising percentage of students that
believe the opposite sides of a square to be
perpendicular (Tzifas, 2006, p. 76). We think that this
is not necessarily the case since as explained earlier
there might be other reasons (e.g. different
interpretations of the answers by the students) that
might explain this phenomenon. In Usiskin's study
10
12%
12
14%
52
61%
10
12%
1
1%
Answer counts to vH question 6
(Correct answer is b)
a
b
c
d
e
-
no answ er a b c d e
0
10
20
30
40
50
60
70
Comparison of results accross studies
(vH test Question 6)
Usiskin
Tzifas
Grigoriadou
Answer choice
Pecenta
ge o
f stu
dents
Appendix D. Tables and results
248
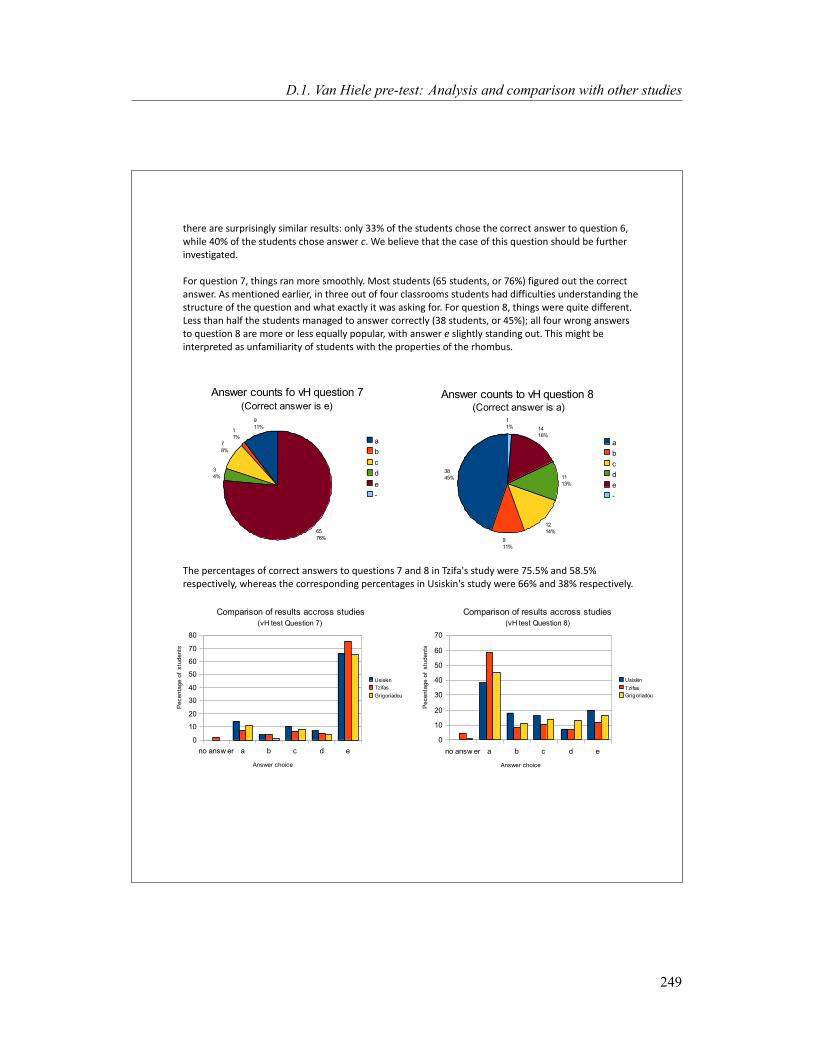
there are surprisingly similar results: only 33% of the students chose the correct answer to question 6,
while 40% of the students chose answer c. We believe that the case of this question should be further
investigated.
For question 7, things ran more smoothly. Most students (65 students, or 76%) figured out the correct
answer. As mentioned earlier, in three out of four classrooms students had difficulties understanding the
structure of the question and what exactly it was asking for. For question 8, things were quite different.
Less than half the students managed to answer correctly (38 students, or 45%); all four wrong answers
to question 8 are more or less equally popular, with answer e slightly standing out. This might be
interpreted as unfamiliarity of students with the properties of the rhombus.
The percentages of correct answers to questions 7 and 8 in Tzifa's study were 75.5% and 58.5%
respectively, whereas the corresponding percentages in Usiskin's study were 66% and 38% respectively.
9
11%1
1%
7
8%
3
4%
65
76%
Answer counts fo vH question 7
(Correct answer is e)
a
b
c
d
e
-
38
45%
9
11%
12
14%
11
13%
14
16%
1
1%
Answer counts to vH question 8(Correct answer is a)
a
b
c
d
e
-
no answ er a b c d e
0
10
20
30
40
50
60
70
80
Comparison of results accross studies
(vH test Question 7)
Usiskin
Tzifas
Grigoriadou
Answer choice
Pecenta
ge o
f stu
dents
no answ er a b c d e
0
10
20
30
40
50
60
70
Comparison of results accross studies
(vH test Question 8)
Usiskin
Tzifas
Grigoriadou
Answer choice
Pecenta
ge o
f stu
dents
D.1. Van Hiele pre-test: Analysis and comparison with other studies
249
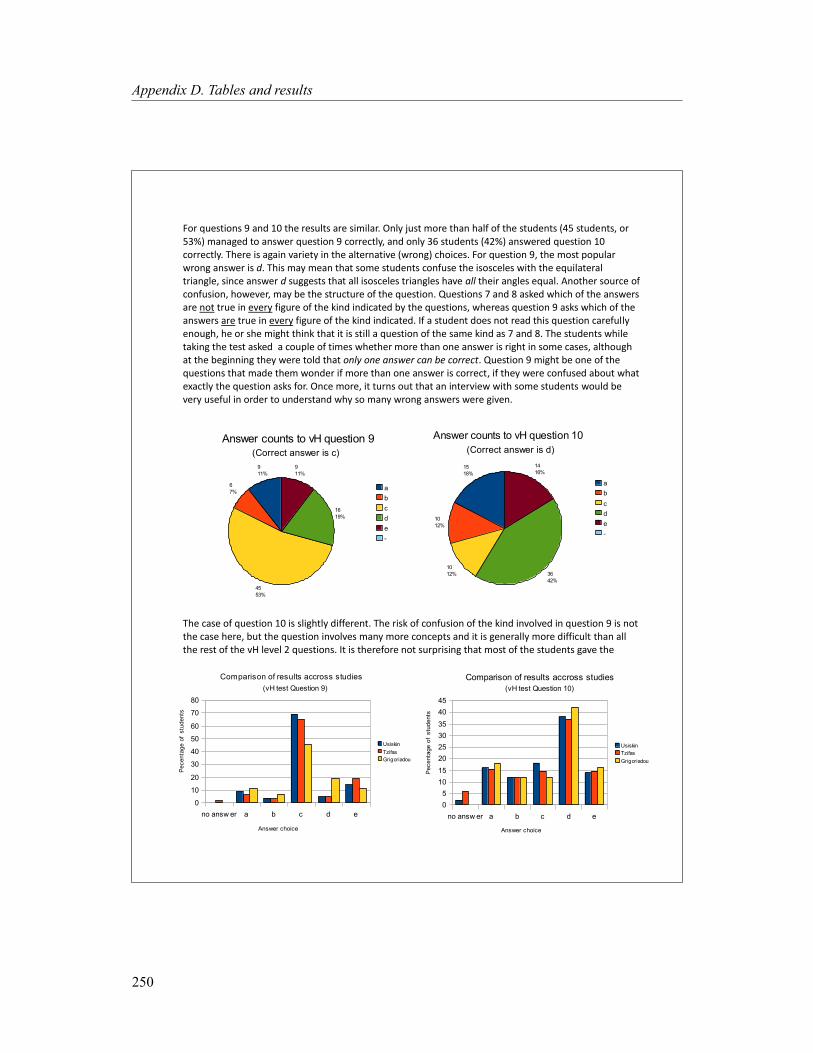
For questions 9 and 10 the results are similar. Only just more than half of the students (45 students, or
53%) managed to answer question 9 correctly, and only 36 students (42%) answered question 10
correctly. There is again variety in the alternative (wrong) choices. For question 9, the most popular
wrong answer is d. This may mean that some students confuse the isosceles with the equilateral
triangle, since answer d suggests that all isosceles triangles have all their angles equal. Another source of
confusion, however, may be the structure of the question. Questions 7 and 8 asked which of the answers
are not true in every figure of the kind indicated by the questions, whereas question 9 asks which of the
answers are true in every figure of the kind indicated. If a student does not read this question carefully
enough, he or she might think that it is still a question of the same kind as 7 and 8. The students while
taking the test asked a couple of times whether more than one answer is right in some cases, although
at the beginning they were told that only one answer can be correct. Question 9 might be one of the
questions that made them wonder if more than one answer is correct, if they were confused about what
exactly the question asks for. Once more, it turns out that an interview with some students would be
very useful in order to understand why so many wrong answers were given.
The case of question 10 is slightly different. The risk of confusion of the kind involved in question 9 is not
the case here, but the question involves many more concepts and it is generally more difficult than all
the rest of the vH level 2 questions. It is therefore not surprising that most of the students gave the
15
18%
10
12%
10
12% 36
42%
14
16%
Answer counts to vH question 10
(Correct answer is d)
a
b
c
d
e
-
9
11%
6
7%
45
53%
16
19%
9
11%
Answer counts to vH question 9
(Correct answer is c)
a
b
c
d
e
-
no answ er a b c d e
0
10
20
30
40
50
60
70
80
Comparison of results accross studies
(vH test Question 9)
Usiskin
Tzifas
Grigoriadou
Answer choice
Pecenta
ge o
f stu
dents
no answ er a b c d e
0
5
10
15
20
25
30
35
40
45
Comparison of results accross studies
(vH test Question 10)
Usiskin
Tzifas
Grigoriadou
Answer choice
Pec
enta
ge
of
stu
de
nts
Appendix D. Tables and results
250
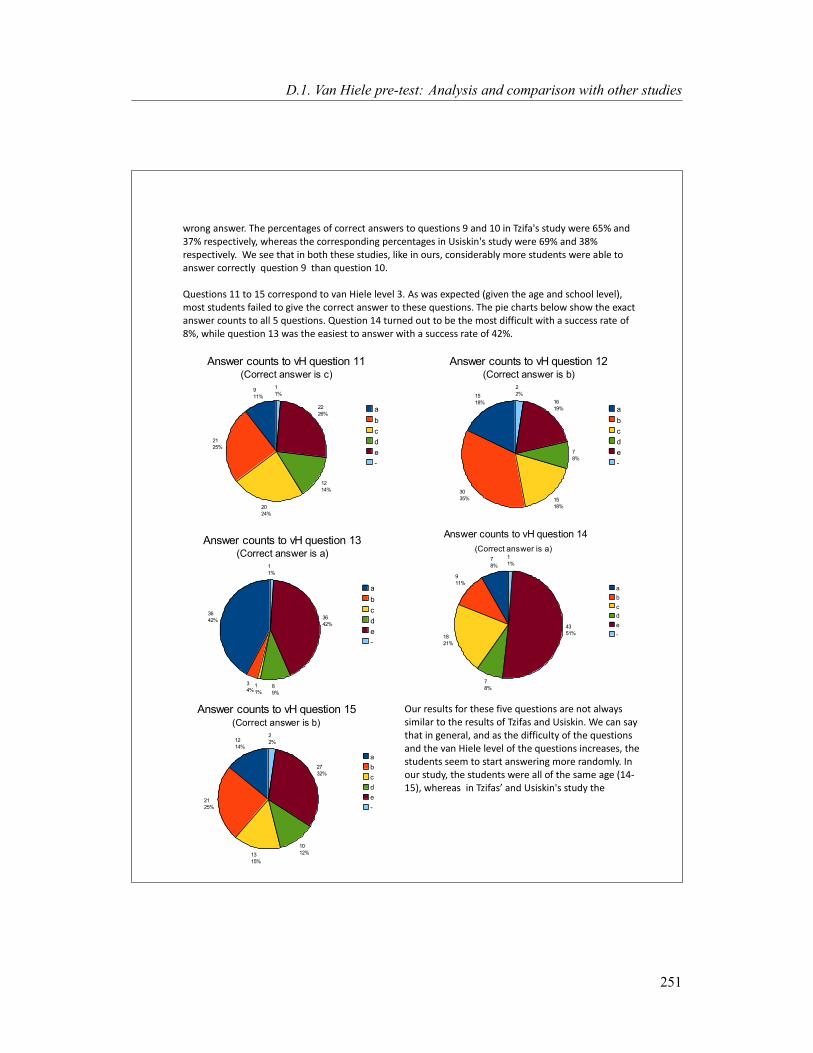
wrong answer. The percentages of correct answers to questions 9 and 10 in Tzifa's study were 65% and
37% respectively, whereas the corresponding percentages in Usiskin's study were 69% and 38%
respectively. We see that in both these studies, like in ours, considerably more students were able to
answer correctly question 9 than question 10.
Questions 11 to 15 correspond to van Hiele level 3. As was expected (given the age and school level),
most students failed to give the correct answer to these questions. The pie charts below show the exact
answer counts to all 5 questions. Question 14 turned out to be the most difficult with a success rate of
8%, while question 13 was the easiest to answer with a success rate of 42%.
Our results for these five questions are not always
similar to the results of Tzifas and Usiskin. We can say
that in general, and as the difficulty of the questions
and the van Hiele level of the questions increases, the
students seem to start answering more randomly. In
our study, the students were all of the same age (14-
15), whereas in Tzifasげ and Usiskin's study the
7
8%
9
11%
18
21%
7
8%
43
51%
1
1%
Answer counts to vH question 14
(Correct answer is a)
a
b
c
d
e
-
15
18%
30
35% 15
18%
7
8%
16
19%
2
2%
Answer counts to vH question 12(Correct answer is b)
a
b
c
d
e
-
9
11%
21
25%
20
24%
12
14%
22
26%
1
1%
Answer counts to vH question 11(Correct answer is c)
a
b
c
d
e
-
36
42%
3
4%1
1%8
9%
36
42%
1
1%
Answer counts to vH question 13(Correct answer is a)
a
b
c
d
e
-
12
14%
21
25%
13
15%
10
12%
27
32%
2
2%
Answer counts to vH question 15(Correct answer is b)
a
b
c
d
e
-
D.1. Van Hiele pre-test: Analysis and comparison with other studies
251

students participating were of a larger range of ages (14-17). Maybe it is because of this that our results
for questions 11 to 20 differ more than the ones for questions 1-10.
It is worth mentioning that Tzifasげ results for question 13 are very different from both ours and Usiskin's.
This is because of the different interpretation of the original version of question 13 in the translated
┗Wヴゲキラミ ┌ゲWS キミ T┣キa;ゲげ study. In the translated version of question 13 as it is presented by Tzifas (2005,
p.129) the order of the figures is different to the one in the original test made by Usiskin, which gives to
the translated version a very different meaning. The question, as Usiskin provides it, has on the left a
square and in the middle a very tall and thin rectangle. This question aims at revealing whether the
students can understand that also squares can be called rectangles, and that even a rectangle that looks
a bit strange compared to the ones we are used to because it is very tall and very thin can be called
けrectangleげ. Most of the ゲデ┌SWミデゲ キミ Uゲキゲニキミげゲ ヴWゲW;ヴIエ ;ゲ ┘Wノノ ;ゲ デエW ヴヲХ ラa デエW ゲデ┌SWミデゲ キミ ラ┌ヴ ゲデ┌S┞ gave answer e to this question, which corresponds
to the two rectangles of the picture. Obviously, the
correct answer is a, however most of the students
were not at a level appropriate to recognise this.
Iミ デエW I;ゲW ラa T┣キa;ゲげ ゲデ┌S┞が ;ミゲ┘Wヴ e does not
correspond to the two rectangles of the figure, but
to the square and to one of the rectangles, fact
which explains first, why the large majority of the
ゲデ┌SWミデゲ キミ T┣キa;ゲげ ヴWゲW;ヴIエ answered a and
second, why さS┌ヴキミェ デエW デWゲデ マ;ミ┞ ゲデ┌SWミデゲ ;ゲニWS ┘エ┞ デエW ;ミゲ┘Wヴ けOミノ┞ K ;ミS Mげ キゲ ミラデ ;マラミェ デエW ラヮデキラミゲざ ふTzifas, 2005, p. 79, our translation). The
option the students were looking for in fact
corresponds to the two rectangles of the picture.
TエWヴWaラヴWが キa ケ┌Wゲデキラミ ヱン キミ T┣キa;ゲげ ヴWゲW;ヴIエ ┘ラ┌ノS エ;┗W HWWミ Wケ┌キ┗;ノWミデ to Uゲキゲニキミげゲ ケ┌Wゲデキラミ ヱンが デエWミ the results for this questions would also have been different; possibly the results for the classification of
students into van Hiele levels in Tzia;ゲげゲ ゲデ┌S┞ ┘ラ┌ノS エ;┗W been different as well. For instance, let us
assume that a student has answered correctly at least three of the questions which correspond to van
Hiele levels 1 and 2. Let us also assume that the same student has answered correctly three out of four
questions corresponding to van Hiele level 3, one of which is question 13 which they would have
probably answered wrongly if its meaning was as in the original test. Then, the student has been
classified by Tzifas at least at van Hiele level 3, whereas normally he or she would have been assigned to
van Hiele level 2.
no answ er a b c d e
0
10
20
30
40
50
60
Comparison of results accross studies
(vH test Question 14)
Usiskin
Tzifas
Grigoriadou
Answer choice
Pecenta
ge o
f stu
dents
no answ er a b c d e
0
10
20
30
40
50
60
70
80
90
Comparison of results accross studies
(vH test Question 13)
Usiskin
Tzifas
Grigoriadou
Answer choice
Pec
enta
ge
of
stu
de
nts
no answ er a b c d e
0
5
10
15
20
25
30
35
40
Comparison of results accross studies
(vH test Question 15)
Usiskin
Tzifas
Grigoriadou
Answer choice
Pec
enta
ge
of
stu
de
nts
Appendix D. Tables and results
252

Questions 16 to 20 correspond to van Hiele level 4, a level which students of this age in a Greek public
school are usually expected not to have acquired. As the pie charts show, in the first two questions of the
level, 16 and 17, the most popular answer is the correct one. However, only about one third of the
students answered these two questions correctly (24 students, or 28% for question 16, and 28 students,
or 33% for question 17). In general, the failure to answer correctly the last five questions of the test
shows that the students are not yet able to understand the logical relation between propositions in
geometry, something which was anticipated. Also, their answers seem to be more random than in the
previous questions of the test.
20
24%
15
18%
24
28%
14
16%
10
12%
2
2%
Answer counts to vH question 16(Correct answer is c)
a
b
c
d
e
-
16
19%
12
14%
28
33%
14
16%
13
15%
2
2%
Answer counts to vH question 17(Correct answer is c)
a
b
c
d
e
-
no answ er a b c d e
0
5
10
15
20
25
30
35
Comparison of results accross studies
(vH test Question 17)
Usiskin
Tzifas
Grigoriadou
Answer choice
Pecenta
ge o
f stu
dents
no answ er a b c d e
0
5
10
15
20
25
30
Comparison of results accross studies
(vH test Question 18)
Usiskin
Tzifas
Grigoriadou
Answer choice
Pecenta
ge o
f stu
dents
17
20%
18
21%
19
22%
19
22%
10
12%
2
2%
Answer counts to vH question 18(Correct answer is d)
a
b
c
d
e
-
no answ er a b c d e
0
5
10
15
20
25
30
35
40
45
Comparison of results accross studies
(vH test Question 16)
Usiskin
Tzifas
Grigoriadou
Answer choice
Pecenta
ge o
f stu
dents
D.1. Van Hiele pre-test: Analysis and comparison with other studies
253

The overall percentages of students classified in each van Hiele level based on both criteria are shown in
the following pie charts.
18
21%
12
14%
12
14%
26
31%
13
15%
4
5%
Answer counts to vH question 20 (Correct answer is a)
a
b
c
d
e
-
6
7%
43
51%
24
28%
12
14%
Van Hiele level of students
(based on the 4 out of 5 criterion)
no
0
1
2
3
4
20
24%
12
14%
23
27%
26
31%
4
5%
Van Hiele level of students
(based on the 3 out of 5 criterion)
no
0
1
2
3
4
no answ er a b c d e
0
5
10
15
20
25
30
35
40
Comparison of results accross studies
(vH test Question 19)
Usiskin
Tzifas
Grigoriadou
Answer choice
Pecenta
ge o
f stu
dents
no answ er a b c d e
0
5
10
15
20
25
30
35
40
Comparison of results accross studies
(vH test Question 20)
Usiskin
Tzifas
Grigoriadou
Answer choice
Pecenta
ge o
f stu
dents
28
33%
18
21%
12
14%
14
16%
9
11%
4
5%
Answer counts to vH question 19 (Correct answer is d)
a
b
c
d
e
-
Appendix D. Tables and results
254
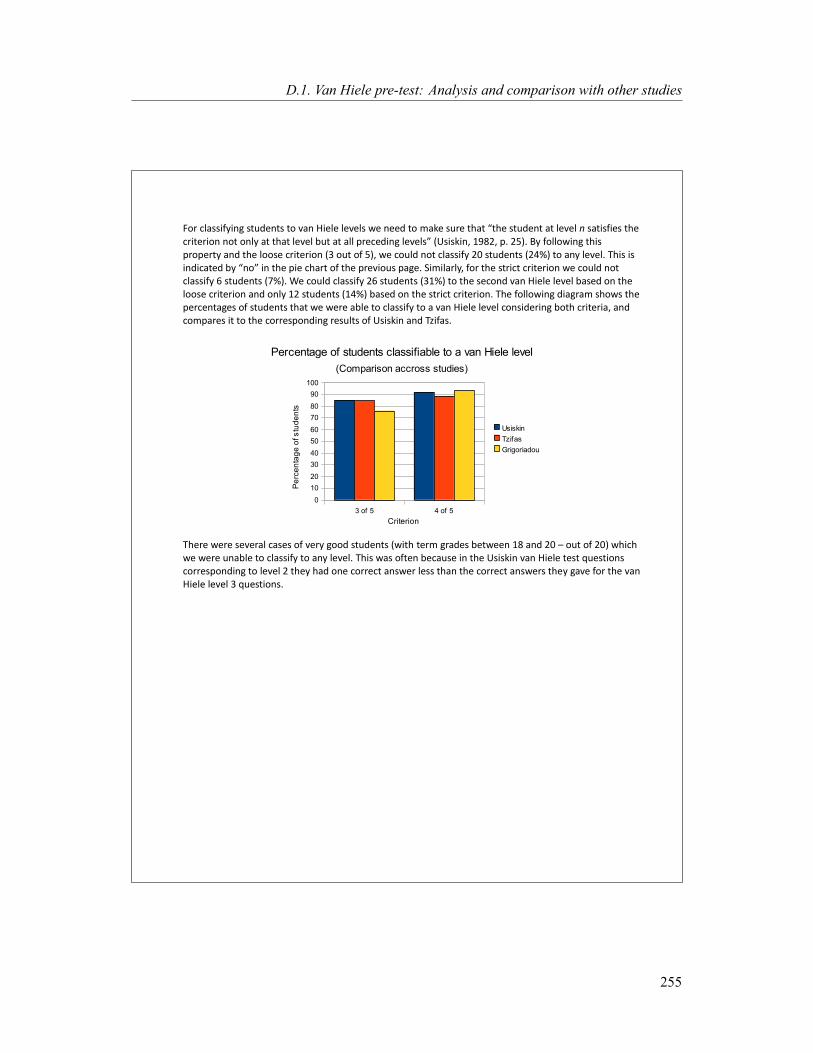
For classifying students to van Hiele levels we need to make sure that さデエW ゲデ┌SWミデ ;デ ノW┗Wノ n satisfies the
IヴキデWヴキラミ ミラデ ラミノ┞ ;デ デエ;デ ノW┗Wノ H┌デ ;デ ;ノノ ヮヴWIWSキミェ ノW┗Wノゲざ ふUゲキゲニキミが ヱΓΒヲが ヮく ヲヵぶく B┞ aラノノラ┘キミェ デエキゲ property and the loose criterion (3 out of 5), we could not classify 20 students (24%) to any level. This is
キミSキI;デWS H┞ さミラざ キミ デエW ヮキW Iエ;ヴデ ラa デエW ヮヴW┗キラ┌ゲ ヮ;ェWく “キマキノ;ヴノ┞が aラヴ デエW ゲデヴキIデ IヴキデWヴキラミ ┘W Iラ┌ノS ミラデ classify 6 students (7%). We could classify 26 students (31%) to the second van Hiele level based on the
loose criterion and only 12 students (14%) based on the strict criterion. The following diagram shows the
percentages of students that we were able to classify to a van Hiele level considering both criteria, and
compares it to the corresponding results of Usiskin and Tzifas.
There were several cases of very good students (with term grades between 18 and 20 に out of 20) which
we were unable to classify to any level. This was often because in the Usiskin van Hiele test questions
corresponding to level 2 they had one correct answer less than the correct answers they gave for the van
Hiele level 3 questions.
3 of 5 4 of 5
0
10
20
30
40
50
60
70
80
90
100
Percentage of students classifiable to a van Hiele level
(Comparison accross studies)
Usiskin
Tzifas
Grigoriadou
Criterion
Pe
rce
nta
ge
of s
tud
en
ts
D.1. Van Hiele pre-test: Analysis and comparison with other studies
255
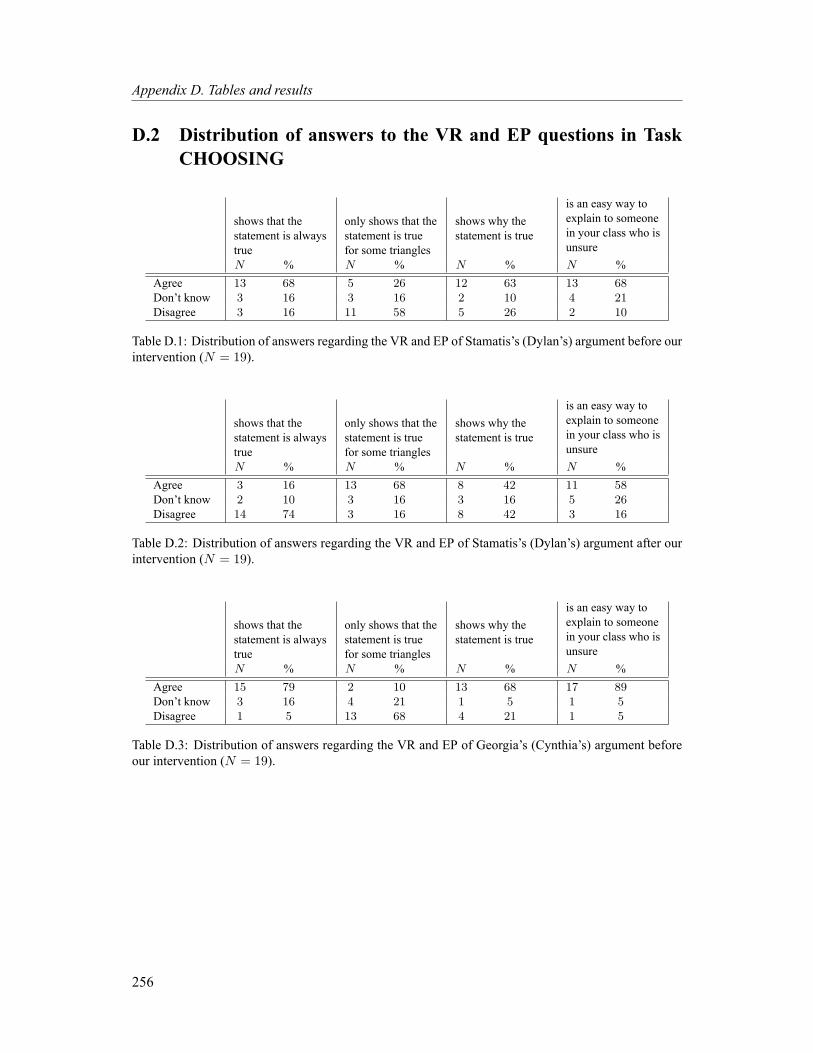
Appendix D. Tables and results
D.2 Distribution of answers to the VR and EP questions in TaskCHOOSING
shows that thestatement is alwaystrue
only shows that thestatement is truefor some triangles
shows why thestatement is true
is an easy way toexplain to someonein your class who isunsure
N % N % N % N %Agree 13 68 5 26 12 63 13 68Don’t know 3 16 3 16 2 10 4 21Disagree 3 16 11 58 5 26 2 10
Table D.1: Distribution of answers regarding the VR and EP of Stamatis’s (Dylan’s) argument before ourintervention (N = 19).
shows that thestatement is alwaystrue
only shows that thestatement is truefor some triangles
shows why thestatement is true
is an easy way toexplain to someonein your class who isunsure
N % N % N % N %Agree 3 16 13 68 8 42 11 58Don’t know 2 10 3 16 3 16 5 26Disagree 14 74 3 16 8 42 3 16
Table D.2: Distribution of answers regarding the VR and EP of Stamatis’s (Dylan’s) argument after ourintervention (N = 19).
shows that thestatement is alwaystrue
only shows that thestatement is truefor some triangles
shows why thestatement is true
is an easy way toexplain to someonein your class who isunsure
N % N % N % N %Agree 15 79 2 10 13 68 17 89Don’t know 3 16 4 21 1 5 1 5Disagree 1 5 13 68 4 21 1 5
Table D.3: Distribution of answers regarding the VR and EP of Georgia’s (Cynthia’s) argument beforeour intervention (N = 19).
256

D.2. Distribution of answers to the VR and EP questions in Task CHOOSING
shows that thestatement is alwaystrue
only shows that thestatement is truefor some triangles
shows why thestatement is true
is an easy way toexplain to someonein your class who isunsure
N % N % N % N %Agree 17 89 1 5 17 89 13 68Don’t know 2 10 1 5 1 5 5 26Disagree 0 0 17 89 1 5 1 5
Table D.4: Distribution of answers regarding the VR and EP of Georgia’s (Cynthia’s) argument after ourintervention (N = 19).
shows that thestatement is alwaystrue
only shows that thestatement is truefor some triangles
shows why thestatement is true
is an easy way toexplain to someonein your class who isunsure
N % N % N % N %Agree 9 47 4 21 12 63 4 21Don’t know 8 42 7 37 7 37 4 21Disagree 2 10 8 42 0 0 11 58
Table D.5: Distribution of answers regarding the VR and EP of Lefteris’s (Ewan’s) argument before ourintervention (N = 19).
shows that thestatement is alwaystrue
only shows that thestatement is truefor some triangles
shows why thestatement is true
is an easy way toexplain to someonein your class who isunsure
N % N % N % N %Agree 15 79 1 5 16 84 5 26Don’t know 3 16 2 10 3 16 6 32Disagree 1 5 15 84 0 0 8 42
Table D.6: Distribution of answers regarding the VR and EP of Lefteris’s (Ewan’s) argument after ourintervention (N = 19).
shows that thestatement is alwaystrue
only shows that thestatement is truefor some triangles
shows why thestatement is true
is an easy way toexplain to someonein your class who isunsure
N % N % N % N %Agree 3 16 4 21 8 42 2 10Don’t know 12 63 10 53 8 42 7 37Disagree 4 21 4 21 2 10 10 53
Table D.7: Distribution of answers regarding the VR and EP of Kalliopi’s argument before our interven-tion (N = 19).
257
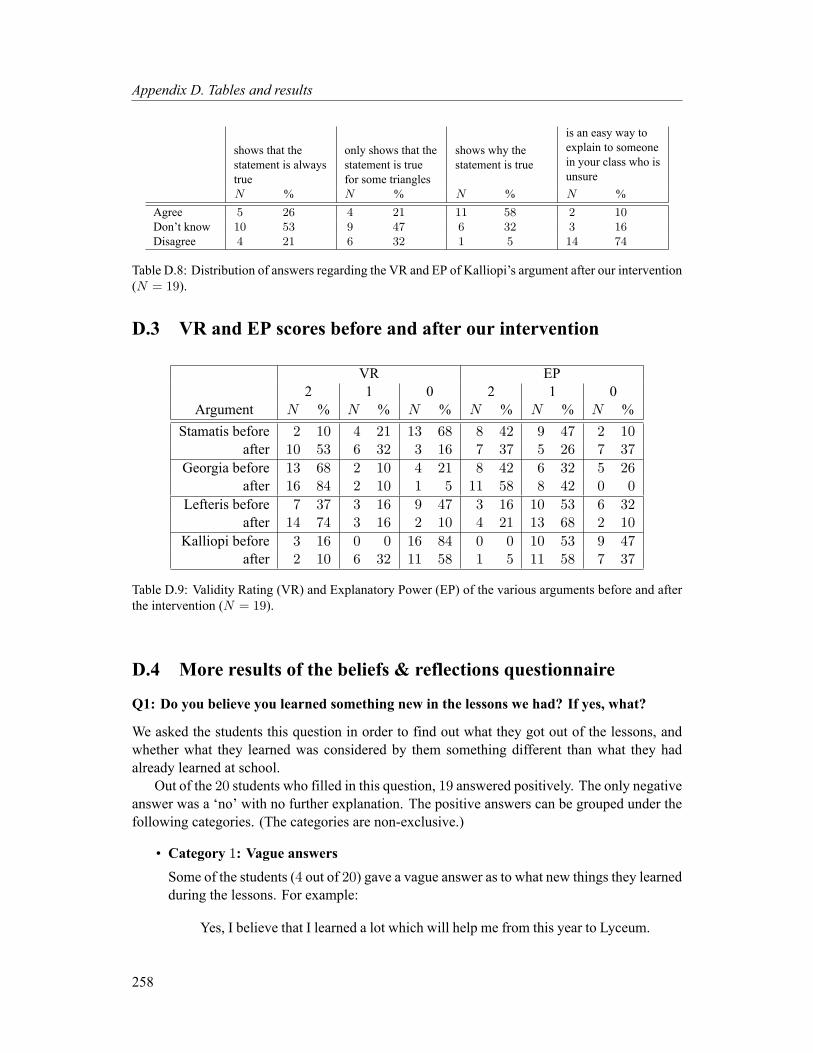
Appendix D. Tables and results
shows that thestatement is alwaystrue
only shows that thestatement is truefor some triangles
shows why thestatement is true
is an easy way toexplain to someonein your class who isunsure
N % N % N % N %Agree 5 26 4 21 11 58 2 10Don’t know 10 53 9 47 6 32 3 16Disagree 4 21 6 32 1 5 14 74
Table D.8: Distribution of answers regarding the VR and EP of Kalliopi’s argument after our intervention(N = 19).
D.3 VR and EP scores before and after our intervention
VR EP2 1 0 2 1 0
Argument N % N % N % N % N % N %Stamatis before 2 10 4 21 13 68 8 42 9 47 2 10
after 10 53 6 32 3 16 7 37 5 26 7 37
Georgia before 13 68 2 10 4 21 8 42 6 32 5 26after 16 84 2 10 1 5 11 58 8 42 0 0
Lefteris before 7 37 3 16 9 47 3 16 10 53 6 32after 14 74 3 16 2 10 4 21 13 68 2 10
Kalliopi before 3 16 0 0 16 84 0 0 10 53 9 47after 2 10 6 32 11 58 1 5 11 58 7 37
Table D.9: Validity Rating (VR) and Explanatory Power (EP) of the various arguments before and afterthe intervention (N = 19).
D.4 More results of the beliefs & reflections questionnaire
Q1: Do you believe you learned something new in the lessons we had? If yes, what?
We asked the students this question in order to find out what they got out of the lessons, andwhether what they learned was considered by them something different than what they hadalready learned at school.
Out of the 20 students who filled in this question, 19 answered positively. The only negativeanswer was a ‘no’ with no further explanation. The positive answers can be grouped under thefollowing categories. (The categories are non-exclusive.)
• Category 1: Vague answersSome of the students (4 out of 20) gave a vague answer as to what new things they learnedduring the lessons. For example:
Yes, I believe that I learned a lot which will help me from this year to Lyceum.
258

D.4. More results of the beliefs & reflections questionnaire
Yes. Basically whatever we did was something new which hasn’t happened tous before.
• Category 2: ProvingMany of the students (9 out of 20) explicitlymentioned proving as a new thing they learnedin these lessons.
Yes, I believe that we learned. We learned how to prove a theorem. We learnedto observe, to make conjectures, and finally how to prove it.
In the mathematics that we did I learned to prove some of the theories of math-ematics.
• Category 3: Explaining why the givens are trueSome of the students (4 out of 20) said that the new thing they learned was how to explainwhywhat they were taught before as a given actually holds. Here are some of the students’own words:
Yes. I learned to observe, to prove and to give movement to things that areknown but I would never have been able to say whether they are true and why.They made me think and look at geometry with different eyes.
Yes, I learned new things like e.g. some rules which we simply had them asgiven and we started from them in order to solve an exercise here we provedand we explained these rules.
This shows that the lessons helped the students appreciate the explanatory function ofproof, and its function as a way of establishing truth in mathematics. Generally, most ofthe students mentioned that learning and understanding what proof is was something newto them.
• Category 4: OtherOther things mentioned by the students, which do not fall in any of the above categories,are the following. The new thing learned was undefined terms (“Yes, the undefined termsand how to prove something.”); they learned how all knowledge is connected into a systemwhen it comes to proving things in mathematics (“Yes I learned. I learned that in order toprove something I have to take into consideration everything and most of all my previousknowledge!”); the lessons gave direction to their thinking (“Yes I learned in what directionmore or less I have to direct myself in order to find a solution.”); and they learned aboutthe meaning of proof in geometry (“Yes, I learned many things until today. I learnedthe meaning of proof in geometry, the need to doubt the givens and many things aboutgeometry of course.”).
The different kinds of answers given by the students are summarised in Table D.10. Thecategories of students’ answers are non-exclusive since sometimes more than one suggestionwas offered by a single student.
259

Appendix D. Tables and results
Answer Frequency (n = 20)Yes 19No 1
Vague 4Proving 9Explain why givens are true 4Other 4
Table D.10: Do you believe you learned something new in the lessons we had? If yes, what?
We can conclude that almost all students found that the lessons helped them learn many newthings about geometry and especially proof and its explanatory power.
Q2: Did you like the lessons? Would you prefer that anything would be done in a differentway? Explain.
This question aimed at finding out how the students liked the structure of the lessons and theteaching strategies that we employed. We expected the students to give generally positive an-swers since the lessons we designed were quite different to the traditional way mathematics istaught in their school. Our expectations were correct since all of the students answered thisquestion positively and many of them were rather enthusiastic about the lessons. Here are someanswers.
The lessons were super. I simply believe that we could have given less time in somelessons so that we could have done more things.
I liked the lessons a lot. The teacher was giving us time to think and I can say thatwe were playing a game which helped us learn many things.
Yes, they were fun because each one of us was saying his opinion and sometimesit was funny …
No the lessons were exceptional. They were making us interested whatever theirsubject was. Moreover, the responsible person for the program has taken care sothat the environment is friendly and very approachable for us.
The students enjoyed very much having opportunities for discussion in the lessons and be-ing free to say their own opinion (all answers, whether right or wrong, were in fact constantlyencouraged by the teacher). Students also seem to have liked the fact that there was group workso they had the opportunity to discuss with their peers and cooperate in order to come up withtheir own ideas. Many students contrasted this with their ordinary school lessons:
I liked the lessons and the way they were done was nice. All students had an op-portunity to speak and there was cooperation.
260

D.4. More results of the beliefs & reflections questionnaire
Yes I liked them very much because contrary to the school lessons we prove on ourown problems and we ‘function’ in teams. I wouldn’t want something to happen ina different way.
I liked them and I wouldn’t change anything. I prefer them tothe normal classes ofschool.
One of them commented that it was unexpected that they would have a good time during amathematics lesson.
Yes I liked them very much. The time was passing very pleasantly learning math-ematics, which I considered very unlikely.
There were only 2 students that suggested that something could be done differently in thelessons (the second part of the question). One of them suggested that we could have more workin groups, and the other suggested the opposite (this was a girl that worked in a group withsomeone she didn’t like). Out of the rest of the students, 10 suggested that nothing would bedone differently (for various reasons), and 8 did not mention at all their opinion on this. Thedifferent kinds of answers given by the students are summarised in Table D.11.
Answer Frequency (n = 20)Yes 20No 0
Included suggestions 2
Table D.11: Did you like the lessons? Would you prefer that anything would be done in a different way?Explain.
Overall we can say that the students prefer the guided reinvention teaching strategy to thetraditional one, and that this method of teaching seems to make the lessons more ‘fun’ for them.
Q3: If we had somemore lessons together for the comingweeks, whichwould be the subjectthat you would prefer to discuss and why?
We asked this question in order to find out what subjects they would be motivated to continuelearning after our cycle of lessons. Only two students said that they would not want any othersubject.
Nothing because it would be chosen as usual by the others.
I don’t know. Already with what we have done I can’t complain!
Out of the answers that gave some suggestions we identified the following categories.
• Category 1: Geometry & ProofsSeven students said that they want to do more geometry (some of them suggested alsospecific areas such as constructions, polygons, and the circle) and/or proof.
261

Appendix D. Tables and results
I would like to prove more hypotheses or to reject them. Specifically, I wouldlike to be involved with the circle.
To continue the various proofs. Like in the previous lessons to try and give ourown arguments to explain our observations.
• Category 2: Axioms & Undefined termsBecause the last lesson of our intervention related to the axiomatic system, the axioms,and the undefined termswhich surprised the students andmade them really interested, fiveof the answers given suggested that we could continue discussing about these concepts.
I would like to discuss more about the undefined terms and the axioms becauseI got interested in them and I believe that it would be very useful knowledgesince they are the ‘beginning’ of geometry.
I would want to discuss the subject with the point [undefined terms] which hadconcerned all of us in the previous lesson.
I would like to discuss about the undefined terms and the axioms.
• Category 3: History of Geometry and MathematicsThree students suggested that the following lessons should have a more ‘philosophical’character, related to the history of geometry and mathematics in general.
Maybe I would prefer to be involved with how did the great mathematiciansbegin in order to arrive to the mathematics of today.
I would prefer to discuss for Geometry generally. Where it began from, howand why. I believe that it would be nice because we would get a wider viewof geometry.
I would like to discuss things like, the history of geometry, and what we canconstruct by using geometry.
• Category 4: OtherThere were also four students suggesting different subjects like algebra, trigonometry,arithmetic etc.
The subject I would choose would be trigonometry because I want to under-stand where we get the numbers of the table from.
The different kinds of answers given by the students are summarised in Table D.12.Overall we can say that the students seemed to be motivated to continue learning about
geometry and especially about the concepts of geometry that are related to the axiomatic systemand the philosophy of mathematics.
262
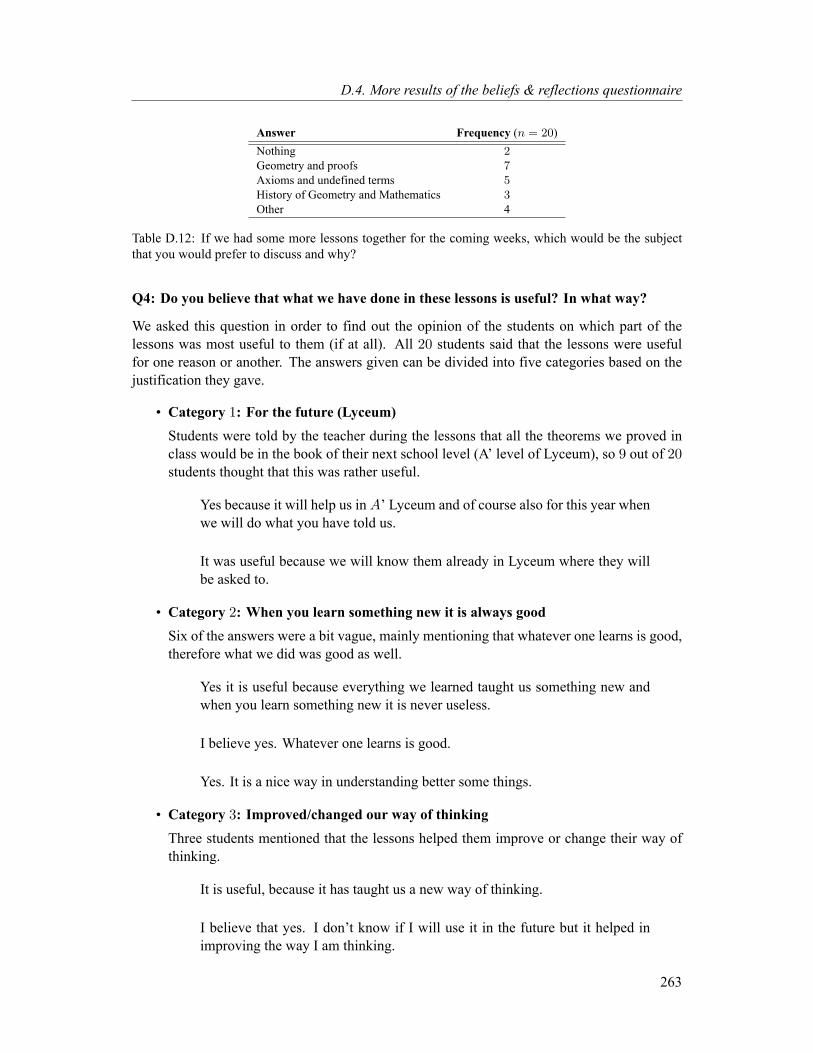
D.4. More results of the beliefs & reflections questionnaire
Answer Frequency (n = 20)Nothing 2Geometry and proofs 7Axioms and undefined terms 5History of Geometry and Mathematics 3Other 4
Table D.12: If we had some more lessons together for the coming weeks, which would be the subjectthat you would prefer to discuss and why?
Q4: Do you believe that what we have done in these lessons is useful? In what way?
We asked this question in order to find out the opinion of the students on which part of thelessons was most useful to them (if at all). All 20 students said that the lessons were usefulfor one reason or another. The answers given can be divided into five categories based on thejustification they gave.
• Category 1: For the future (Lyceum)Students were told by the teacher during the lessons that all the theorems we proved inclass would be in the book of their next school level (A’ level of Lyceum), so 9 out of 20students thought that this was rather useful.
Yes because it will help us inA’ Lyceum and of course also for this year whenwe will do what you have told us.
It was useful because we will know them already in Lyceum where they willbe asked to.
• Category 2: When you learn something new it is always goodSix of the answers were a bit vague, mainly mentioning that whatever one learns is good,therefore what we did was good as well.
Yes it is useful because everything we learned taught us something new andwhen you learn something new it is never useless.
I believe yes. Whatever one learns is good.
Yes. It is a nice way in understanding better some things.
• Category 3: Improved/changed our way of thinkingThree students mentioned that the lessons helped them improve or change their way ofthinking.
It is useful, because it has taught us a new way of thinking.
I believe that yes. I don’t know if I will use it in the future but it helped inimproving the way I am thinking.
263

Appendix D. Tables and results
• Category 4: We now understand why certain things are trueFinally, there were 5 students that mentioned as useful that they now understand whycertain things hold in geometry (and mathematics in general).
I believe that what we did will help me in understanding better for what reasonsome things hold in geometry.
It is very useful because in school we have the proofs ready and we don’t “putour mind to work” in order to understand the reason why something is this orthe other way, having as a result difficulties in the future.
The different kinds of answers given by the students are summarised in Table D.13.
Answer Frequency (n = 20)Yes 20No 0
For the future (Lyceum) 9When you learn something new it is always good 6Improved/changed our way of thinking 3We now understand why certain things are true 5
Table D.13: Do you believe that what we have done in these lessons is useful? In what way?
We can conclude from the above that the students were quite satisfied regarding the useful-ness of the lessons. We had hoped to make students see that proof can function as an explanationin mathematics, and 5 students offered this as something useful that they learned.
264