reaves utility income fund · reaves utility income fund shareholder letter october 31, 2017...
TRANSCRIPT

Reaves Utility income FUnd
UTGANNUAL REPORT
10.31.17
Reaves Utility Income Fund (the “Fund”), acting pursuant to a Securities and Exchange Commission (“SEC”) exemptive order and with the approval of the Fund’s Board of Trustees (the “Board”), has adopted a plan, consistent with its investment objectives and policies to support a level distribution of income, capital gains and/or return of capital (the “Plan”). In accordance with the Plan, the Fund currently distributes $0.16 per share on a monthly basis.
The fixed amount distributed per share is subject to change at the discretion of the Fund’s Board. Under the Plan, the Fund will distribute all available invest-ment income to its shareholders, consistent with its primary investment objec-tives and as required by the Internal Revenue Code of 1986, as amended (the “Code”). If sufficient investment income is not available on a monthly basis, the Fund will distribute long-term capital gains and/or return of capital to share-holders in order to maintain a level distribution. Each monthly distribution to shareholders is expected to be at the fixed amount established by the Board, except for extraordinary distributions and potential distribution rate increases or decreases to enable the Fund to comply with the distribution requirements imposed by the Code.
Shareholders should not draw any conclusions about the Fund’s investment performance from the amount of these distributions or from the terms of the Plan. The Fund’s total return performance on net asset value is presented in its financial highlights table.
The Board may amend, suspend or terminate the Fund’s Plan without prior notice if it deems such action to be in the best interest of the Fund or its share-holders. The suspension or termination of the Plan could have the effect of creating a trading discount (if the Fund’s stock is trading below net asset value) or widening an existing trading discount. The Fund is subject to risks that could have an adverse impact on its ability to maintain level distributions. Examples of potential risks include, but are not limited to, economic downturns impacting the markets, increased market volatility, companies suspending or decreasing corporate dividend distributions and changes in the Code.
Please refer to Additional Information for a cumulative summary of the Section 19(a) notices for the Fund’s current fiscal period. Section 19(a) notices for the Fund, as applicable, are available on the Reaves Utility Income Fund website www.utilityincomefund.com.
section 19(b) disclosURe
October 31, 2017 (Unaudited)
Reaves Utility Income Fund Table of Contents
Annual Report | October 31, 2017 1
Shareholder Letter .......................................................................................................... 2
Report of Independent Registered Public Accounting Firm ............................................ 6
Statement of Investments .............................................................................................. 7
Statement of Assets and Liabilities ............................................................................... 11
Statement of Operations .............................................................................................. 12
Statement of Changes in Net Assets ............................................................................. 13
Statement of Cash Flows .............................................................................................. 14
Financial Highlights ....................................................................................................... 16
Notes to Financial Statements ...................................................................................... 18
Additional Information ................................................................................................. 27
Trustees & Officers ....................................................................................................... 31

Reaves Utility Income Fund Shareholder Letter October 31, 2017 (Unaudited)
2 www.utilityincomefund.com
To our Shareholders: Investment Portfolio Returns Total net assets of the Fund were $1,612,864,612 at October 31, 2017, or $33.14 of net asset value (“NAV”) per common share. One year ago, net assets totaled $1,116,575,921 representing $32.53 of net asset value per common share. The changes include the proceeds from the October 2017 rights offering and distributions to shareholders totaling $99,792,157 including a $0.92/share special distribution paid in January 2017. Changes in the market price of the Fund can and do differ from the underlying changes in the net asset value per common share. As a result, the market return to common shares can be higher or lower than the NAV return. The fiscal 2017 market return for shareholders was 12.70% as is reflected in the table to follow. The share price of the Fund traded at a discount of 6.40% to the NAV at fiscal year‐end, a decrease from the 7.78% discount at the beginning of the fiscal year. Performance Year Ended October 31, 2017
One Year Three Years+ Five Years+ Ten Years+ Since
Inception+** Total investment return – Net Asset Value* 11.04% 7.62% 12.38% 8.73% 11.79% Total investment return – Market Price* 12.70% 7.32% 11.23% 9.58% 10.87% S&P Utilities Index1 15.40% 10.45% 12.46% 6.78% 10.37% Dow Jones Utility Average2 15.46% 11.87% 13.54% 7.62% 11.66%
+ Annualized * Assumes all dividends being reinvested ** Index data since 02/29/04 1 S&P Utilities Index is a capitalization-weighted index containing 28 Electric and Gas Utility
stocks (including multi-utilities and independent power producers). Prior to July 1996, this index included telecommunications equities.
2 The Dow Jones Utility Average (DJUA) is a price-weighted average of the 15 utility stocks traded in the United States.
Distributions to Common Shareholders The Trustees of the Fund regularly review the amount of the monthly distribution. Since the Fund’s first distribution in April 2004, the monthly distribution has been increased on nine occasions from the initial monthly amount of $0.0967 to the current amount of $0.16, representing a cumulative increase of 65.5%. For calendar year 2016, all distributions from the Fund were paid from net investment income including realized capital gains. We anticipate that all distributions for the 12 months ending December 31, 2017 will be characterized as paid from net investment income and realized capital gains. Rights Offering The October 2017 rights offering increased the Fund’s shares outstanding by 14,314,706 to a total of 48.67 million shares. Proceeds to the Fund totaled $428.0 million which was only partially invested as of October 31, 2017 resulting in cash comprising the largest holding at fiscal year‐end.
Reaves Utility Income Fund Shareholder Letter October 31, 2017 (Unaudited)
Annual Report | October 31, 2017 3
The intent is to fully invest the balance of the proceeds by mid‐January, primarily in equities, consistent with the Fund’s objectives of achieving current and rising dividend income accompanied by capital appreciation from investments held. Leverage Facility The principal amount of the loan facility was unchanged at $320,000,000. The leverage decreased from 28.7% of net assets to 19.8% at October 31, 2017. The current level of leverage is the lowest at any time in the Fund’s 13‐year‐plus existence. For details about the facility please refer to Note 4 of the accompanying financial statements. Overview The Fund’s portfolio has performed well in the face of three Federal Reserve rate increases during Fiscal 2017: December 2016, March 2017 and June 2017. The fiscal year began with the 10‐year U.S. Treasury yielding 1.84% and rising to 2.60% for two days around the date of the Fed’s December rate increase. Again, in March the 10‐year U.S. Treasury peaked at 2.62% for one day and thereafter declined irregularly to 2.53% at fiscal year‐end. Our view is that the Fund’s high‐yielding portfolio is not as interest sensitive as commonly believed, and the fiscal 2017 performance is consistent with our experience over more than a decade. The yield on the Fund’s portfolio has comfortably exceeded that of the 10‐year U.S. Treasury throughout the fiscal year. Dividend increases by portfolio companies have met our expectations, and are supported by earnings growth. The Fund’s top‐ten holdings, excluding proceeds of the October 2017 rights offering, comprised consistently more than 40% of the portfolio. The industries included were utilities, telecommunications, railroads, cable and energy. Eight of the top‐ten had double‐digit internal rates of return for the year. The laggard was Verizon, the large integrated telecommunications corporation, whose total return approximated its mid‐single‐digit dividend yield. Utilities For the second year in a row, utilities produced double‐digit total returns. A positive action by the Trump Administration was the proposal of four candidates to the Federal Energy Regulatory Commission (“FERC”). Their confirmation created a quorum at FERC which enables the FERC to rule on all outstanding dockets including approval of significant new energy infrastructure projects. We believe utilities with material renewables assets experienced rising stock prices due to a reduction of the uncertainty about the future of incentives for investment in renewables. For example, American Electric Power announced a $4.5 billion plan to build 2000 megawatts of wind power in the Oklahoma panhandle, dubbed the Wind Catcher Energy Connection Project. Abundant wind resources and increasingly efficient technology enabled American Electric Power to invest $4.5 billion, shut down existing coal plants, and deliver savings to customers. The announcement confirmed that new wind generation is finally cheaper than existing power plants. This has significant implications for future utility growth. Utility growth is typically constrained by the impact capital investments have on customer bills, not project availability. Most companies try to limit bill increases to less than inflation and set capital budgets correspondingly. If renewable resources can deliver savings to customers, utilities will likely deploy more capital to such projects and, consequently, earnings growth should be higher. We anticipate that cost reductions in battery storage will accelerate this trend. Communications The Fund’s communications holdings, which include integrated telecommunications, as well as cable, tower, and fiber companies, produced mid‐teen total returns with the strongest performance coming from cable companies and towers. The strong performance in cable was a result of growth in broadband subscribers and average revenue per user as demand for digital
Reaves Utility Income Fund Shareholder Letter October 31, 2017 (Unaudited)
4 www.utilityincomefund.com
data and especially video streaming continues to grow. The same basic trend drove growth at the tower companies. Cable returns were also helped by merger and acquisition speculation around Charter Communications. In the last three months of the fiscal year, the share price of both Charter and Comcast came under considerable pressure as investors reacted to video subscriber losses. We think the reaction is overdone and that demand for consumer broadband and business services will drive sustained growth at both companies. Negative returns from U.S.‐based integrated telecommunication companies, Verizon and AT&T, partly offset strong cable performance, as they struggled with a very competitive wireless environment and, at AT&T, high‐margin video subscriber losses from its recently acquired DirecTV business. BCE Inc., the largest telecom service provider in Canada, generated a mid‐single‐digit positive return. Its wireless business operates in a much more benign competitive environment. As we look out to next year, we think demand for broadband from consumers and businesses stemming from video streaming, digitization of the enterprise, and the growing internet of things will drive continued growth at both cable and tower companies. We believe competitive pressures within the wireless sector in the U.S. appear, at long last, to be easing, evidenced by Verizon’s expectation to return to wireless service revenue growth. Energy Holdings of integrated oil majors contributed meaningfully to dividend income. Investors’ concern that dividends were not sustainable abated as expenses and capital expenditures were reduced. The rise in the average price of oil per barrel as a result of OPEC3 producers’ ongoing production restraint, together with increased operating discipline, has led to a materially higher margin per barrel for Royal Dutch Shell PLC. Cash flow is such that they have eliminated the scrip portion of their dividend. Outlook The 10‐year U.S. Treasury interest rate fell in fiscal 2016 and rose in 2017. The Fund’s portfolio performed well in each year. The Federal Reserve is baffled by the persistence of sub‐2% inflation at a time when the jobless rate has fallen. We believe the Federal Reserve risks a fall in inflated asset prices if they tighten prematurely. The result is an interest climate that is, in our opinion, hospitable for the moderate earnings and dividend growth of Fund investments. Returns can be supplemented with a prudent use of leverage. The proceeds of the rights offering will be invested as opportunities present themselves due to management actions of individual companies, market volatility or sector dislocation resulting from changing investor expectations. The additional shares issued provide increased liquidity for investors who desire it. We appreciate the opportunity to serve you and thank you for your continued support demonstrated by participation in the rights offering. Sincerely, Ronald J. Sorenson, Chief Investment Officer, Chief Executive Officer John P. Bartlett, Vice President, CFA
Reaves Utility Income Fund Shareholder Letter October 31, 2017 (Unaudited)
Annual Report | October 31, 2017 5
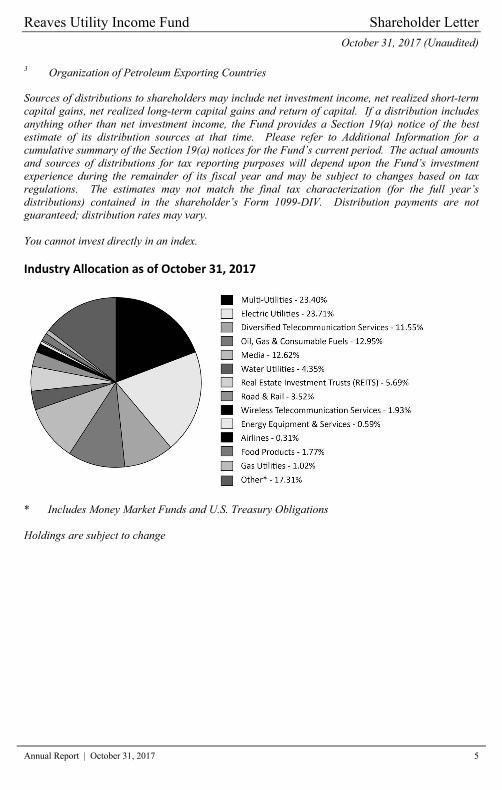
3 Organization of Petroleum Exporting Countries Sources of distributions to shareholders may include net investment income, net realized short-term capital gains, net realized long-term capital gains and return of capital. If a distribution includes anything other than net investment income, the Fund provides a Section 19(a) notice of the best estimate of its distribution sources at that time. Please refer to Additional Information for a cumulative summary of the Section 19(a) notices for the Fund’s current period. The actual amounts and sources of distributions for tax reporting purposes will depend upon the Fund’s investment experience during the remainder of its fiscal year and may be subject to changes based on tax regulations. The estimates may not match the final tax characterization (for the full year’s distributions) contained in the shareholder’s Form 1099-DIV. Distribution payments are not guaranteed; distribution rates may vary. You cannot invest directly in an index. Industry Allocation as of October 31, 2017
* Includes Money Market Funds and U.S. Treasury Obligations Holdings are subject to change
Report of Independent Registered Reaves Utility Income Fund Public Accounting Firm
6 www.utilityincomefund.com
To the Board of Trustees and Shareholders of Reaves Utility Income Fund: We have audited the accompanying statement of assets and liabilities of Reaves Utility Income Fund (the "Fund"), including the statement of investments, as of October 31, 2017, and the related statements of operations and cash flows for the year then ended, the statements of changes in net assets for each of the two years in the period then ended, and the financial highlights for each of the five years in the period then ended. These financial statements and financial highlights are the responsibility of the Fund's management. Our responsibility is to express an opinion on these financial statements and financial highlights based on our audits. We conducted our audits in accordance with the standards of the Public Company Accounting Oversight Board (United States). Those standards require that we plan and perform the audit to obtain reasonable assurance about whether the financial statements and financial highlights are free of material misstatement. The Fund is not required to have, nor were we engaged to perform, an audit of its internal control over financial reporting. Our audits included consideration of internal control over financial reporting as a basis for designing audit procedures that are appropriate in the circumstances, but not for the purpose of expressing an opinion on the effectiveness of the Fund's internal control over financial reporting. Accordingly, we express no such opinion. An audit also includes examining, on a test basis, evidence supporting the amounts and disclosures in the financial statements, assessing the accounting principles used and significant estimates made by management, as well as evaluating the overall financial statement presentation. Our procedures included confirmation of securities owned as of October 31, 2017, by correspondence with the custodian, partnership administrators, and brokers; when replies were not received from brokers, we performed other auditing procedures. We believe that our audits provides a reasonable basis for our opinion. In our opinion, such financial statements and financial highlights referred to above present fairly, in all material respects, the financial position of Reaves Utility Income Fund as of October 31, 2017, the results of its operations and its cash flows for the year then ended, the changes in its net assets for each of the two years in the period then ended, and the financial highlights for each of the five years in the period then ended, in conformity with accounting principles generally accepted in the United States of America. DELOITTE & TOUCHE LLP Denver, Colorado December 21, 2017

Reaves Utility Income Fund Statement of Investments October 31, 2017
Annual Report | October 31, 2017 7
SHARES VALUECOMMON STOCKS 101.16%
Airlines 0.31% Delta Air Lines, Inc. 100,000 $5,003,000
Diversified Telecommunication Services 11.45% AT&T, Inc.(1) 1,300,000 43,745,000 BCE, Inc.(1) 1,210,000 55,853,600 CenturyLink, Inc. 1,050,000 19,939,500 Verizon Communications, Inc.(1) 1,240,000 59,358,800 Zayo Group Holdings, Inc.(2) 160,000 5,769,600
184,666,500
Electric Utilities 23.71% Avangrid, Inc. 197,500 10,216,675 Edison International(1) 416,000 33,259,200 Eversource Energy(1) 585,000 36,644,400 Fortis, Inc. 1,400,000 51,561,321 NextEra Energy Partners LP 525,253 20,663,453 NextEra Energy, Inc.(1) 683,000 105,912,810 Pinnacle West Capital Corp.(1) 483,000 42,363,930 PPL Corp. 830,000 31,174,800 Red Electrica Corp. SA 200,000 4,428,760 The Southern Co. 884,000 46,144,800
382,370,149
Energy Equipment & Services 0.59% Baker Hughes, a GE Company 302,000 9,491,860
Food Products 1.77% The Kraft Heinz Co.(1) 370,000 28,612,100
Gas Utilities 1.02% Atmos Energy Corp.(1) 150,000 13,086,000 South Jersey Industries, Inc. 100,000 3,397,000
16,483,000
Media 12.62% Charter Communications, Inc., Class A(1)(2)(3) 246,182 82,266,639 Comcast Corp., Class A(1) 2,712,000 97,713,360 Time Warner, Inc. 240,000 23,589,600
203,569,599
Reaves Utility Income Fund Statement of Investments October 31, 2017
8 www.utilityincomefund.com
SHARES VALUEMulti‐Utilities 23.40%
CMS Energy Corp.(1) 390,000 $18,864,300 Dominion Energy, Inc. 715,000 58,015,100 DTE Energy Co.(1) 898,000 99,193,080 Infraestructura Energetica Nova SAB de CV 750,000 3,825,942 National Grid PLC, Sponsored ADR 101,100 6,172,155 NiSource, Inc.(1) 993,500 26,198,595 PG&E Corp.(1) 600,000 34,662,000 Public Service Enterprise Group, Inc. 65,000 3,198,000 SCANA Corp. 317,000 13,675,380 Sempra Energy(1) 520,000 61,100,000 WEC Energy Group, Inc.(1) 780,000 52,564,200
377,468,752
Oil, Gas & Consumable Fuels 10.80% BP PLC, Sponsored ADR 100,000 4,067,000 Chevron Corp.(1) 167,500 19,411,575 Exxon Mobil Corp. 470,000 39,174,500 ONEOK, Inc. 120,000 6,512,400 Pioneer Natural Resources Co. 35,000 5,238,450 Royal Dutch Shell PLC:
Class A 350,000 10,996,093 Class A, Sponsored ADR(1) 1,030,000 64,920,900
The Williams Cos, Inc. 600,000 17,100,000 TransCanada Corp. 144,000 6,837,120
174,258,038
Real Estate Investment Trusts (REITS) 5.69% American Tower Corp. 228,000 32,756,760 Annaly Capital Management, Inc.(1) 2,500,000 28,650,000 Crown Castle International Corp.(1) 230,000 24,628,400 Uniti Group, Inc. 326,140 5,707,450
91,742,610
Road & Rail 3.52% Union Pacific Corp. 490,000 56,737,100
Water Utilities 4.35% American Water Works Co., Inc.(1) 770,300 67,601,528 Aqua America, Inc. 70,000 2,483,600
70,085,128

Reaves Utility Income Fund Statement of Investments October 31, 2017
Annual Report | October 31, 2017 9
SHARES VALUEWireless Telecommunication Services 1.93%
T‐Mobile US, Inc.(1)(2) 520,000 $31,080,400
TOTAL COMMON STOCKS (Cost $1,193,240,859) 1,631,568,236
LIMITED PARTNERSHIPS 2.15%
Oil, Gas & Consumable Fuels 2.15%Bastion Energy LLC (Anglo Dutch)(2)(4)(5) 1,000 4,262,554 Enterprise Products Partners LP(1) 1,100,000 26,950,000 Talara Opportunities II, LP(2)(4)(5)(6) 40,519 3,442,500
34,655,054
TOTAL LIMITED PARTNERSHIPS (Cost $27,468,985) 34,655,054
BOND RATING PRINCIPAL MOODY/S&P AMOUNT VALUE CORPORATE BONDS 0.10%
Diversified Telecommunication Services 0.10% Frontier Communications Corp., 7.125%,
01/15/2023 B3/B $2,000,000 1,545,620
TOTAL CORPORATE BONDS (Cost $1,917,801) 1,545,620
SHARES VALUEMONEY MARKET FUNDS 13.60%
Federated Treasury Obligations Money Market Fund, 0.900% (7‐Day Yield) 219,420,447 219,420,447
TOTAL MONEY MARKET FUNDS (Cost $219,420,447) 219,420,447
U.S. TREASURY OBLIGATIONS 3.71% United States Treasury Bill 0.977%, 01/25/2018(7) 30,000,000 29,922,437 United States Treasury Bill 1.178%, 04/26/2018(7) 30,000,000 29,818,885
59,741,322
TOTAL U.S. TREASURY OBLIGATIONS (Cost $59,743,694) 59,741,322
Reaves Utility Income Fund Statement of Investments October 31, 2017
10 www.utilityincomefund.com
SHARES VALUETOTAL INVESTMENTS ‐ 120.72%
(Cost $1,501,791,786) $1,946,930,679
LEVERAGE FACILITY ‐ (19.84%) (320,000,000)
LIABILITIES IN EXCESS OF OTHER ASSETS ‐ (0.88%) (14,066,067)
NET ASSETS ‐ 100.00% $1,612,864,612
(1) Pledged security; a portion or all of the security is pledged as collateral for borrowings as ofOctober 31, 2017. (See Note 4)
(2) Non-Income Producing Security. (3) This security is marked to cover the unfunded commitment. (See Note 1) (4) Restricted security. Investment represents a non-public partnership interest and is not
unitized. (See Note 5) (5) Security fair valued by management, pursuant to procedures approved by the Board of
Trustees, using significant unobservable inputs. (See Note 1) (6) Represents funded portion of total outstanding commitments. See Note 1 for information on
any unfunded commitments. (7) Rate shown represents the bond equivalent yield to maturity at date of purchase.
Common Abbreviations: ADR - American Depositary Receipt Co. - Company Corp. - Corporation Cos. - Companies Inc. - Incorporated LLC - Limited Liability Company LP - Limited Partnership PLC - Public Limited Company SAB de CV - A variable rate company
See Notes to Financial Statements.

Reaves Utility Income Fund Statement of Assets and Liabilities October 31, 2017
See Notes to Financial Statements.
Annual Report | October 31, 2017 11
ASSETS: Investments, at value (Cost $1,501,791,786) $ 1,946,930,679 Cash 663,661 Foreign currency, at value (Cost $53,121) 53,121 Dividends receivable 2,342,258 Interest receivable 47,618
Total Assets 1,950,037,337
LIABILITIES: Loan payable 320,000,000 Interest payable on loan outstanding 240,711 Payable for investments purchased 15,194,292 Accrued investment advisory fees 888,313 Accrued administration fees 409,396 Accrued trustees' fees 43,932 Accrued chief compliance officer fees 3,250 Accrued expenses for rights offering costs 347,647 Other payables and accrued expenses 45,184
Total Liabilities 337,172,725
Total Commitments for Contingencies (Notes 1 and 8)
Net Assets Applicable to Common Shareholders $ 1,612,864,612
COMPOSITION OF NET ASSETS ATTRIBUTABLE TO COMMON SHARES:Paid‐in capital $ 1,137,884,083 Overdistributed net investment income (7,194,515) Accumulated net realized gain 37,039,861 Net unrealized appreciation 445,135,183
Net Assets Applicable to Common Shareholders $ 1,612,864,612
Shares of common stock outstanding of no par value, unlimited shares
authorized 48,670,001
Net asset value per common share $ 33.14
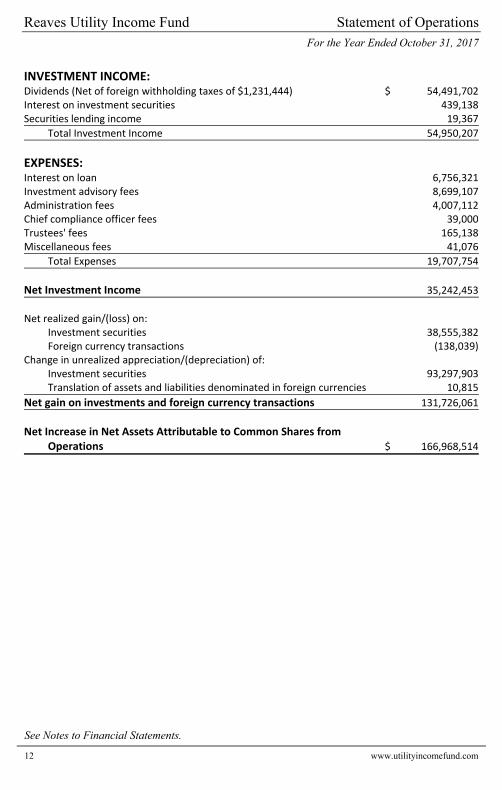
Reaves Utility Income Fund Statement of Operations For the Year Ended October 31, 2017
See Notes to Financial Statements.
12 www.utilityincomefund.com
INVESTMENT INCOME: Dividends (Net of foreign withholding taxes of $1,231,444) $ 54,491,702 Interest on investment securities 439,138 Securities lending income 19,367
Total Investment Income 54,950,207
EXPENSES: Interest on loan 6,756,321 Investment advisory fees 8,699,107 Administration fees 4,007,112 Chief compliance officer fees 39,000 Trustees' fees 165,138 Miscellaneous fees 41,076
Total Expenses 19,707,754
Net Investment Income 35,242,453
Net realized gain/(loss) on:
Investment securities 38,555,382 Foreign currency transactions (138,039)
Change in unrealized appreciation/(depreciation) of: 93,308,718 Investment securities 93,297,903 Translation of assets and liabilities denominated in foreign currencies 10,815
Net gain on investments and foreign currency transactions 131,726,061
Net Increase in Net Assets Attributable to Common Shares from Operations $ 166,968,514

Reaves Utility Income Fund Statement of Changes in Net Assets
See Notes to Financial Statements.
Annual Report | October 31, 2017 13
For the Year Ended
October 31, 2017
For the Year Ended
October 31, 2016
COMMON SHAREHOLDER OPERATIONS:Net investment income $ 35,242,453 $ 28,129,956 Net realized gain 38,417,343 76,956,060
Long‐term capital gains from other investment companies – 1,787
Change in unrealized appreciation 93,308,718 67,461,003
Net increase in net assets attributable to common shares from operations 166,968,514 172,548,806
DISTRIBUTIONS TO COMMON SHAREHOLDERS:From net investment income (36,543,080) (24,132,999) From net realized gains (63,249,077) (37,661,585)
Net decrease in net assets from distributions to common shareholders (99,792,157) (61,794,584)
CAPITAL SHARE TRANSACTIONS:
Proceeds from rights offering, net of offering cost 428,014,151 126,869,555 Proceeds from common shares issued to
shareholders from reinvestment of dividends 1,098,183 –
Net increase from capital share transactions 429,112,334 126,869,555
Net Increase in Net Assets Attributable to Common Shares 496,288,691 237,623,777
NET ASSETS ATTRIBUTABLE TO COMMON SHAREHOLDERS:Beginning of year $ 1,116,575,921 $ 878,952,144
End of year* $ 1,612,864,612 $ 1,116,575,921
*Including overdistributed net investment income of: $ (7,194,515) $ (6,267,605)

Reaves Utility Income Fund Statement of Cash Flows For the Year Ended October 31, 2017
See Notes to Financial Statements.
14 www.utilityincomefund.com
CASH FLOWS FROM OPERATING ACTIVITIES:Net increase in net assets from operations $166,968,514Adjustments to reconcile net increase in net assets from operations to net
used in operating activities: Purchase of investment securities (366,554,020)Proceeds from disposition of investment securities 226,479,829Net purchases of short‐term investment securities (224,276,315)Premium amortization (40,169)Net realized (gain)/loss on:
Investment securities (38,555,382)Net change in unrealized (appreciation)/depreciation on:
Investments (93,297,903)(Increase)/Decrease in assets:
Dividends receivable (43,312)Interest receivable (4,005)
Increase/(Decrease) in liabilities:Interest payable on loan outstanding 193,282Accrued investment advisory fees 186,523Accrued administration fees 85,962Accrued trustees' fees 11,444Accrued expenses for rights offering costs (See Note 3) 208,348Other payables and accrued expenses 10,087
Net Cash Used in Operating Activities (328,627,117)
CASH FLOWS FROM FINANCING ACTIVITIES:Proceeds from rights offering, net of offering cost 428,014,151Cash distributions paid on Common Shares (98,693,974)
Net Cash Provided by Financing Activities 329,320,177
Net Increase in cash 693,060
Cash, beginning of year $23,722
Cash and Foreign currency, end of year $716,782
SUPPLEMENTAL DISCLOSURE OF CASH FLOW INFORMATION:Cash paid during the period for interest from bank borrowing $6,563,039Non‐cash financing activities not included herein consist of reinvestment of
distributions of: $1,098,183
Page Intentionally Left Blank
Reaves Utility Income Fund
See Notes to Financial Statements.
16 www.utilityincomefund.com
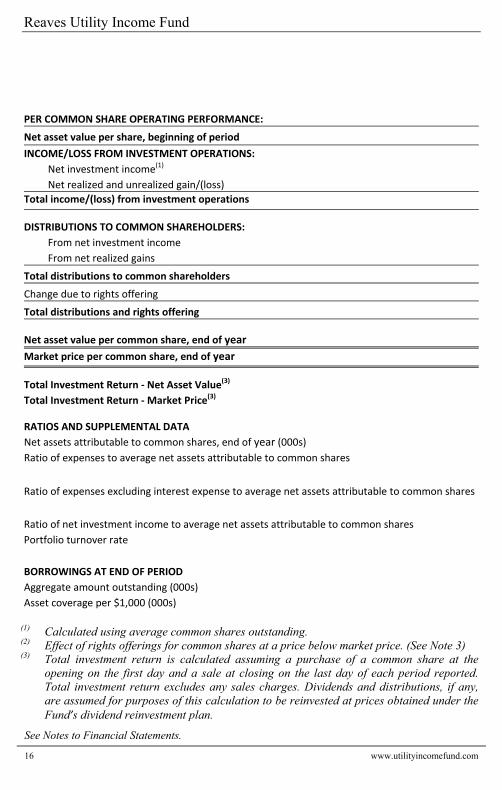
PER COMMON SHARE OPERATING PERFORMANCE:
Net asset value per share, beginning of period
INCOME/LOSS FROM INVESTMENT OPERATIONS:
Net investment income(1)
Net realized and unrealized gain/(loss)
Total income/(loss) from investment operations
DISTRIBUTIONS TO COMMON SHAREHOLDERS:
From net investment income
From net realized gains
Total distributions to common shareholders
Change due to rights offering
Total distributions and rights offering
Net asset value per common share, end of year
Market price per common share, end of year
Total Investment Return ‐ Net Asset Value(3)
Total Investment Return ‐ Market Price(3)
RATIOS AND SUPPLEMENTAL DATA
Net assets attributable to common shares, end of year (000s)
Ratio of expenses to average net assets attributable to common shares
Ratio of expenses excluding interest expense to average net assets attributable to common shares
Ratio of net investment income to average net assets attributable to common shares
Portfolio turnover rate
BORROWINGS AT END OF PERIOD
Aggregate amount outstanding (000s)
Asset coverage per $1,000 (000s)
(1) Calculated using average common shares outstanding. (2) Effect of rights offerings for common shares at a price below market price. (See Note 3) (3) Total investment return is calculated assuming a purchase of a common share at the
opening on the first day and a sale at closing on the last day of each period reported. Total investment return excludes any sales charges. Dividends and distributions, if any,are assumed for purposes of this calculation to be reinvested at prices obtained under theFund’s dividend reinvestment plan.
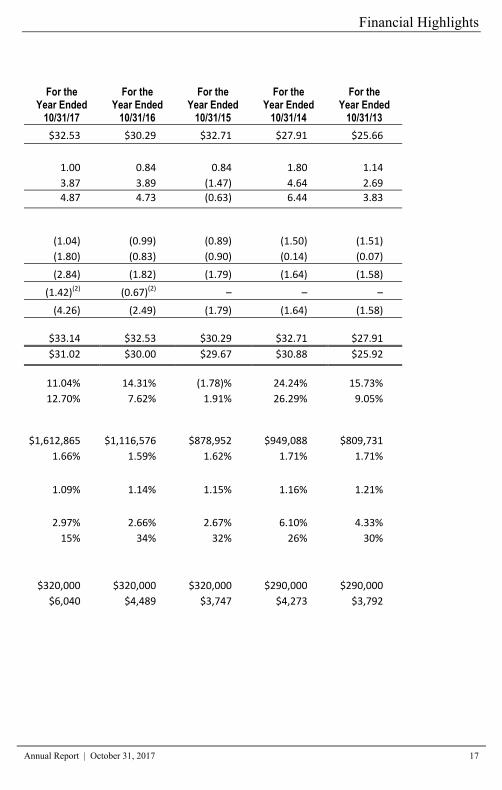
Financial Highlights
Annual Report | October 31, 2017 17
For the Year Ended
10/31/17
For the Year Ended
10/31/16
For the Year Ended
10/31/15
For the Year Ended
10/31/14
For the Year Ended
10/31/13
$32.53 $30.29 $32.71 $27.91 $25.66
1.00 0.84 0.84 1.80 1.14
3.87 3.89 (1.47) 4.64 2.69
4.87 4.73 (0.63) 6.44 3.83
(1.04) (0.99) (0.89) (1.50) (1.51)
(1.80) (0.83) (0.90) (0.14) (0.07)
(2.84) (1.82) (1.79) (1.64) (1.58)
(1.42)(2) (0.67)(2) – – –
(4.26) (2.49) (1.79) (1.64) (1.58)
$33.14 $32.53 $30.29 $32.71 $27.91
$31.02 $30.00 $29.67 $30.88 $25.92
11.04% 14.31% (1.78)% 24.24% 15.73%
12.70% 7.62% 1.91% 26.29% 9.05%
$1,612,865 $1,116,576 $878,952 $949,088 $809,731
1.66% 1.59% 1.62% 1.71% 1.71%
1.09% 1.14% 1.15% 1.16% 1.21%
2.97% 2.66% 2.67% 6.10% 4.33%
15% 34% 32% 26% 30%
$320,000 $320,000 $320,000 $290,000 $290,000
$6,040 $4,489 $3,747 $4,273 $3,792

Reaves Utility Income Fund Notes to Financial Statements October 31, 2017
18 www.utilityincomefund.com
1. SIGNIFICANT ACCOUNTING AND OPERATING POLICIES Reaves Utility Income Fund (the “Fund”) is registered under the Investment Company Act of 1940, as amended (the “1940 Act”), as a closed‐end management investment company. The Fund was organized under the laws of the state of Delaware by an Agreement and Declaration of Trust dated September 15, 2003. The Fund’s investment objective is to provide a high level of after‐tax income and total return consisting primarily of tax‐advantaged dividend income and capital appreciation. The Fund is a diversified investment company for purpose of the 1940 Act. The Agreement and Declaration of Trust provides that the Trustees may authorize separate classes of shares of beneficial interest. The Fund’s common shares are listed on the NYSE American LLC (the “Exchange”) and trade under the ticker symbol “UTG”. The Fund may have elements of risk, including the risk of loss of equity. There is no assurance that the investment process will consistently lead to successful results. An investment concentrated in sectors and industries may involve greater risk and volatility than a more broadly diversified investment. The Fund invests a significant portion of its total assets in securities of utility companies, which may include companies in the electric, gas, water, and telecommunications sectors, as well as other companies engaged in other infrastructure operations. This may make the Fund particularly susceptible to adverse economic, political or regulatory occurrences affecting those sectors. As concentration of the Fund’s investments in a sector increases, so does the potential for fluctuation in the net asset value of common shares. The following is a summary of significant accounting policies followed by the Fund in the preparation of its financial statements. The preparation of financial statements is in accordance with generally accepted accounting principles in the United States of America (“U.S. GAAP”), which requires management to make estimates and assumptions that affect the reported amounts and disclosures in the financial statements. Actual results could differ from those estimates. The Fund is considered an investment company under U.S. GAAP and follows the accounting and reporting guidance applicable to investment companies in the Financial Accounting Standards Board Accounting Standards Codification Topic 946.
Investment Valuation: The net asset value per common share (“NAV”) of the Fund is determined no less frequently than daily, on each day that the Exchange is open for trading, as of the close of regular trading on the Exchange (normally 4:00 p.m. New York time). The NAV is determined by dividing the value of the Fund’s total assets less its liabilities by the number of shares outstanding. The Board of Trustees (the “Board”) has established the following procedures for valuation of the Fund’s asset values under normal market conditions. For domestic equity securities, foreign equity securities and funds that are traded on an exchange, the market price is usually the closing sale or official closing price on that exchange. In the case of a domestic and foreign equity security not traded on an exchange, or if such closing prices are not otherwise available, the mean of the closing bid and ask price will be used. The fair value for debt obligations is generally the evaluated mean price supplied by the Fund’s primary and/or secondary independent third‐party pricing service, approved by the Board. An evaluated mean is considered to be a daily fair valuation price which may use a matrix, formula or other objective method that takes into consideration various factors, including, but not limited to: structured product markets, fixed income markets, interest rate movements, new issue information, trading, cash flows, yields, spreads, credit quality and other

Reaves Utility Income Fund Notes to Financial Statements October 31, 2017
Annual Report | October 31, 2017 19
pertinent information as determined by the pricing services evaluators and methodologists. If the Fund’s primary and/or secondary independent third‐party pricing services are unable to supply a price, or if the price supplied is deemed to be unreliable, the market price may be determined using quotations received from one or more broker‐dealers that make a market in the security. Investments in non‐exchange traded funds are fair valued at their respective net asset values. Securities, for which market quotations or valuations are not available, are valued at fair value in good faith by or at the direction of the Board. When applicable, fair value of an investment is determined by the Fund’s Fair Valuation Committee as a designee of the Board. In fair valuing the Fund’s investments, consideration is given to several factors, which may include, among others, the following: the fundamental business data relating to the issuer, borrower or counterparty; an evaluation of the forces which influence the market in which the investments are purchased and sold; the type, size and cost of the investment; the information as to any transactions in or offers for the investment; the price and extent of public trading in similar securities (or equity securities) of the issuer, or comparable companies; the coupon payments, yield data/cash flow data; the quality, value and saleability of collateral, if any, securing the investment; the business prospects of the issuer, borrower or counterparty, as applicable, including any ability to obtain money or resources from a parent or affiliate and an assessment of the issuer’s, borrower’s or counterparty’s management; the prospects for the industry of the issuer, borrower or counterparty, as applicable, and multiples (of earnings and/or cash flow) being paid for similar businesses in that industry; one or more non‐affiliated independent broker quotes for the sale price of the portfolio security; and other relevant factors. The Fund discloses the classification of its fair value measurements following a three‐tier hierarchy based on the inputs used to measure fair value. Inputs refer broadly to the assumptions that market participants would use in pricing the asset or liability, including assumptions about risk. Inputs may be observable or unobservable. Observable inputs reflect the assumptions market participants would use in pricing the asset or liability that are developed based on market data obtained from sources independent of the reporting entity. Unobservable inputs reflect the reporting entity’s own assumptions about the assumptions market participants would use in pricing the asset or liability that are developed based on the best information available. Various inputs are used in determining the value of the Fund’s investments as of the end of the reporting period. When inputs used fall into different levels of the fair value hierarchy, the level in the hierarchy within which the fair value measurement falls is determined based on the lowest level input that is significant to the fair value measurement in its entirety. The designated input levels are not necessarily an indication of the risk or liquidity associated with these investments. These inputs are categorized in the following hierarchy under applicable financial accounting standards: Level 1 – Unadjusted quoted prices in active markets for identical, unrestricted assets or
liabilities that the Fund has ability to access at the measurement date; Level 2 – Quoted prices which are not active, quoted prices for similar assets or liabilities in active
markets or inputs other than quoted prices that are observable (either directly or indirectly) for substantially the full term of the asset or liability; and
Reaves Utility Income Fund Notes to Financial Statements October 31, 2017
20 www.utilityincomefund.com
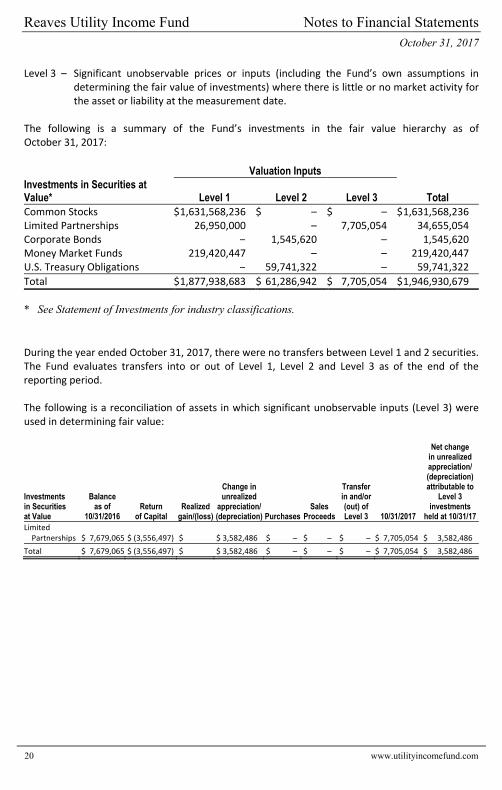
Level 3 – Significant unobservable prices or inputs (including the Fund’s own assumptions in determining the fair value of investments) where there is little or no market activity for the asset or liability at the measurement date.
The following is a summary of the Fund’s investments in the fair value hierarchy as of October 31, 2017:
Valuation Inputs Investments in Securities at Value* Level 1 Level 2 Level 3 Total Common Stocks $1,631,568,236 $ – $ – $1,631,568,236 Limited Partnerships 26,950,000 – 7,705,054 34,655,054 Corporate Bonds – 1,545,620 – 1,545,620 Money Market Funds 219,420,447 – – 219,420,447 U.S. Treasury Obligations – 59,741,322 – 59,741,322
Total $1,877,938,683 $ 61,286,942 $ 7,705,054 $1,946,930,679
* See Statement of Investments for industry classifications.
During the year ended October 31, 2017, there were no transfers between Level 1 and 2 securities. The Fund evaluates transfers into or out of Level 1, Level 2 and Level 3 as of the end of the reporting period. The following is a reconciliation of assets in which significant unobservable inputs (Level 3) were used in determining fair value:
Investments in Securities at Value
Balance as of
10/31/2016 Return
of Capital Realized
gain/(loss)
Change in unrealized
appreciation/ (depreciation) Purchases
Sales Proceeds
Transfer in and/or (out) of Level 3 10/31/2017
Net change in unrealized appreciation/ (depreciation) attributable to
Level 3 investments
held at 10/31/17 Limited Partnerships
$ 7,679,065
$ (3,556,497)
$
$ 3,582,486 $ – $ – $ –
$ 7,705,054
$ 3,582,486
Total $ 7,679,065 $ (3,556,497) $ $ 3,582,486 $ – $ – $ – $ 7,705,054 $ 3,582,486
Reaves Utility Income Fund Notes to Financial Statements October 31, 2017
Annual Report | October 31, 2017 21
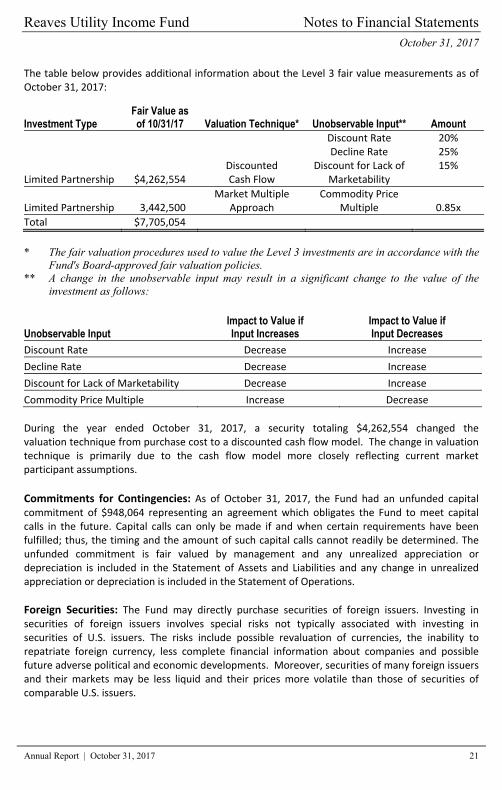
The table below provides additional information about the Level 3 fair value measurements as of October 31, 2017:
Investment Type Fair Value as of 10/31/17 Valuation Technique* Unobservable Input** Amount
Limited Partnership $4,262,554 Discounted Cash Flow
Discount RateDecline Rate
Discount for Lack of Marketability
20% 25% 15%
Limited Partnership 3,442,500 Market Multiple
Approach Commodity Price
Multiple 0.85x
Total $7,705,054
* The fair valuation procedures used to value the Level 3 investments are in accordance with the
Fund's Board-approved fair valuation policies. ** A change in the unobservable input may result in a significant change to the value of the
investment as follows:
Unobservable Input Impact to Value if Input Increases
Impact to Value if Input Decreases
Discount Rate Decrease Increase
Decline Rate Decrease Increase
Discount for Lack of Marketability Decrease Increase
Commodity Price Multiple Increase Decrease
During the year ended October 31, 2017, a security totaling $4,262,554 changed the valuation technique from purchase cost to a discounted cash flow model. The change in valuation technique is primarily due to the cash flow model more closely reflecting current market participant assumptions.
Commitments for Contingencies: As of October 31, 2017, the Fund had an unfunded capital commitment of $948,064 representing an agreement which obligates the Fund to meet capital calls in the future. Capital calls can only be made if and when certain requirements have been fulfilled; thus, the timing and the amount of such capital calls cannot readily be determined. The unfunded commitment is fair valued by management and any unrealized appreciation or depreciation is included in the Statement of Assets and Liabilities and any change in unrealized appreciation or depreciation is included in the Statement of Operations.
Foreign Securities: The Fund may directly purchase securities of foreign issuers. Investing in securities of foreign issuers involves special risks not typically associated with investing in securities of U.S. issuers. The risks include possible revaluation of currencies, the inability to repatriate foreign currency, less complete financial information about companies and possible future adverse political and economic developments. Moreover, securities of many foreign issuers and their markets may be less liquid and their prices more volatile than those of securities of comparable U.S. issuers.
Reaves Utility Income Fund Notes to Financial Statements October 31, 2017
22 www.utilityincomefund.com
Foreign Currency Translation: The books and records of the Fund are maintained in U.S. dollars. Investment valuations and other assets and liabilities initially expressed in foreign currencies are converted each business day the Exchange is open into U.S. dollars based upon current exchange rates. Prevailing foreign exchange rates may generally be obtained at the close of the Exchange (normally, 4:00 p.m. New York time). The portion of realized and unrealized gains or losses on investments due to fluctuations in foreign currency exchange rates is not separately disclosed and is included in realized and unrealized gains or losses on investments, when applicable. As of and during the year ended October 31, 2017, the Fund had no outstanding forward foreign currency contracts.
Distributions to Shareholders: The Fund intends to make a level distribution each month to common shareholders after payment of interest on any outstanding borrowings. The level dividend rate may be modified by the Board of Trustees from time to time. Any net capital gains earned by the Fund are distributed at least annually. Distributions to shareholders are recorded by the Fund on the ex‐dividend date.
Income Taxes: The Fund’s policy is to comply with the provisions of the Code applicable to regulated investment companies and to distribute all of its taxable income and gains to its shareholders. Therefore, no federal income tax provision is required.
Investment Transactions: Investment security transactions are accounted for as of trade date. Dividend income is recorded on the ex‐dividend date, or as soon as information is available to the Fund. Interest income, which includes amortization of premium and accretion of discount, is accrued as earned. Realized gains and losses from investment transactions are determined using the first‐in first‐out basis for both financial reporting and income tax purposes.
2. INCOME TAXES AND TAX BASIS INFORMATION The Fund complies with the requirements under Subchapter M of the Code applicable to regulated investment companies and intends to distribute substantially all of its net taxable income and net capital gains, if any, each year. The Fund is not subject to income taxes to the extent such distributions are made. As of and during the fiscal year ended October 31, 2017, the Fund did not have a liability for any unrecognized tax benefits in the accompanying financial statements. The Fund files U.S. federal, state, and local tax returns as required. The Fund’s tax returns are subject to examination by the relevant tax authorities until expiration of the applicable statute of limitations, which is generally three years after the filing of the tax return but which can be extended to six years in certain circumstances. Tax returns for open years have incorporated no uncertain tax positions that require a provision for income taxes. Net investment income (loss) and net realized gain (loss) may differ for financial statement and tax purposes. The character of distributions made during the year from net investment income or net realized gains may differ from its ultimate characterization for federal income tax purposes. Also, due to the timing of dividend distributions, the fiscal year in which amounts are distributed may differ from the fiscal year in which the income or realized gain was recorded by the Fund.
Reaves Utility Income Fund Notes to Financial Statements October 31, 2017
Annual Report | October 31, 2017 23
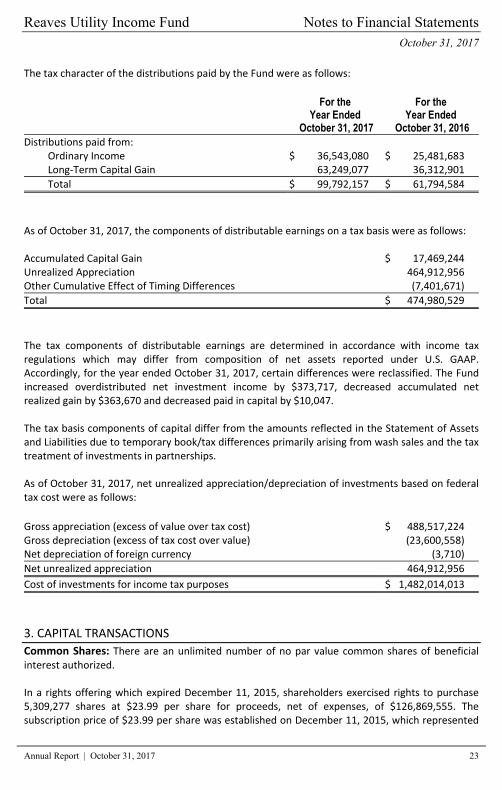
The tax character of the distributions paid by the Fund were as follows:
For the Year Ended
October 31, 2017
For the Year Ended
October 31, 2016 Distributions paid from:
Ordinary Income $ 36,543,080 $ 25,481,683 Long‐Term Capital Gain 63,249,077 36,312,901
Total $ 99,792,157 $ 61,794,584
As of October 31, 2017, the components of distributable earnings on a tax basis were as follows: Accumulated Capital Gain $ 17,469,244 Unrealized Appreciation 464,912,956 Other Cumulative Effect of Timing Differences (7,401,671)
Total $ 474,980,529
The tax components of distributable earnings are determined in accordance with income tax regulations which may differ from composition of net assets reported under U.S. GAAP. Accordingly, for the year ended October 31, 2017, certain differences were reclassified. The Fund increased overdistributed net investment income by $373,717, decreased accumulated net realized gain by $363,670 and decreased paid in capital by $10,047. The tax basis components of capital differ from the amounts reflected in the Statement of Assets and Liabilities due to temporary book/tax differences primarily arising from wash sales and the tax treatment of investments in partnerships. As of October 31, 2017, net unrealized appreciation/depreciation of investments based on federal tax cost were as follows:
Gross appreciation (excess of value over tax cost) $ 488,517,224 Gross depreciation (excess of tax cost over value) (23,600,558) Net depreciation of foreign currency (3,710)
Net unrealized appreciation 464,912,956
Cost of investments for income tax purposes $ 1,482,014,013
3. CAPITAL TRANSACTIONS
Common Shares: There are an unlimited number of no par value common shares of beneficial interest authorized. In a rights offering which expired December 11, 2015, shareholders exercised rights to purchase 5,309,277 shares at $23.99 per share for proceeds, net of expenses, of $126,869,555. The subscription price of $23.99 per share was established on December 11, 2015, which represented

Reaves Utility Income Fund Notes to Financial Statements October 31, 2017
24 www.utilityincomefund.com
95% of the reported market price per share, based on the average of the last reported sales price of a common share on the Exchange for the five trading days preceding December 11, 2015. In a rights offering which expired October 4, 2017, shareholders exercised rights to purchase 14,314,706 shares at $29.93 per share for proceeds, net of expenses, of $428,014,151. The subscription price of $29.93 per share was established on October 4, 2017, which represented 95% of the reported market price per share, based on the average of the last reported sales price of a common share on the Exchange for the five trading days preceding October 4, 2017. Transactions in common shares were as follows:
For the Year Ended
October 31, 2017
For the Year Ended
October 31, 2016 Common Stock outstanding ‐ beginning of period 34,323,571 29,014,294 Common Stock issued from rights offering 14,314,706 5,309,277 Common Stock issued as reinvestment of dividends 31,724 –
Common Stock outstanding ‐ end of period 48,670,001 34,323,571
4. BORROWINGS Effective December 8, 2016, the Fund entered into a Credit Agreement with Pershing LLC. Under the terms of the Credit Agreement, the Fund is allowed to borrow up to $330,000,000. Interest is charged at a rate of the one month LIBOR (London Interbank Offered Rate) plus 1.10%. Borrowings under the Credit Agreement are secured by assets of the Fund that are held by the Fund’s custodian in a separate account (the “pledged collateral”). Borrowing commenced under the terms of the Credit Agreement on December 13, 2016. Prior to December 8, 2016, the Fund had entered into a Committed Facility Agreement (the “Agreement”) with BNP Paribas Prime Brokerage, Inc. (“BNP”) that allowed the Fund to borrow up to $320,000,000 (“Maximum Commitment”) and a Lending Agreement. The Agreement allowed for fixed rate borrowing (the “Fixed Commitment”) in the amount of $72,500,000 and variable rate borrowing (the “Variable Commitment”) in the amount of $247,500,000. Interest on the Fixed Commitment was charged at a rate of 1.7512%, interest on the Variable Commitment was charged at the one month LIBOR plus 0.80%. Borrowings under the Agreement were secured by pledged collateral. The Lending Agreement allowed BNP to borrow a portion of the pledged collateral (the “Lent Securities”), the Fund received income from BNP based on the value of the Lent Securities. On October 25, 2016, the Fixed Commitment terms of the Agreement expired. The principal amount borrowed under the Fixed Commitment converted to the Variable Commitment terms of the Agreement. For the period from November 1, 2016 to December 12, 2016, the average amount borrowed under the Agreement for the Variable Commitment was $320,000,000, at an average rate of 1.39%. For the period from December 13, 2016 to October 31, 2017, the average amount borrowed under the Credit Agreement was $320,000,000, at an average rate of 2.14%. As of October 31, 2017, the amount of outstanding borrowings was $320,000,000, the interest rate was 2.34% and the amount of pledged collateral was $520,562,540.
Reaves Utility Income Fund Notes to Financial Statements October 31, 2017
Annual Report | October 31, 2017 25
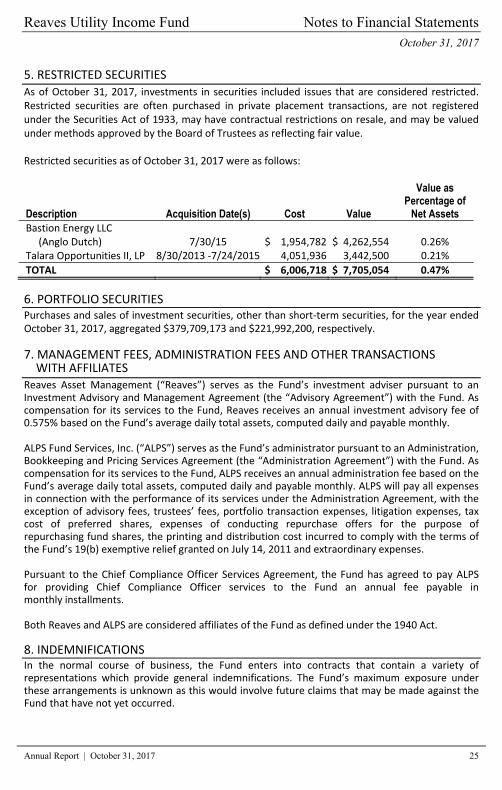
5. RESTRICTED SECURITIES As of October 31, 2017, investments in securities included issues that are considered restricted. Restricted securities are often purchased in private placement transactions, are not registered under the Securities Act of 1933, may have contractual restrictions on resale, and may be valued under methods approved by the Board of Trustees as reflecting fair value. Restricted securities as of October 31, 2017 were as follows:
Description Acquisition Date(s) Cost
Value
Value as Percentage of
Net Assets Bastion Energy LLC (Anglo Dutch) 7/30/15 $ 1,954,782 $ 4,262,554 0.26% Talara Opportunities II, LP 8/30/2013 ‐7/24/2015 4,051,936 3,442,500 0.21%
TOTAL $ 6,006,718 $ 7,705,054 0.47%
6. PORTFOLIO SECURITIES Purchases and sales of investment securities, other than short‐term securities, for the year ended October 31, 2017, aggregated $379,709,173 and $221,992,200, respectively. 7. MANAGEMENT FEES, ADMINISTRATION FEES AND OTHER TRANSACTIONS WITH AFFILIATES Reaves Asset Management (“Reaves”) serves as the Fund’s investment adviser pursuant to an Investment Advisory and Management Agreement (the “Advisory Agreement”) with the Fund. As compensation for its services to the Fund, Reaves receives an annual investment advisory fee of 0.575% based on the Fund’s average daily total assets, computed daily and payable monthly. ALPS Fund Services, Inc. (“ALPS”) serves as the Fund’s administrator pursuant to an Administration, Bookkeeping and Pricing Services Agreement (the “Administration Agreement”) with the Fund. As compensation for its services to the Fund, ALPS receives an annual administration fee based on the Fund’s average daily total assets, computed daily and payable monthly. ALPS will pay all expenses in connection with the performance of its services under the Administration Agreement, with the exception of advisory fees, trustees’ fees, portfolio transaction expenses, litigation expenses, tax cost of preferred shares, expenses of conducting repurchase offers for the purpose of repurchasing fund shares, the printing and distribution cost incurred to comply with the terms of the Fund’s 19(b) exemptive relief granted on July 14, 2011 and extraordinary expenses. Pursuant to the Chief Compliance Officer Services Agreement, the Fund has agreed to pay ALPS for providing Chief Compliance Officer services to the Fund an annual fee payable in monthly installments. Both Reaves and ALPS are considered affiliates of the Fund as defined under the 1940 Act. 8. INDEMNIFICATIONS In the normal course of business, the Fund enters into contracts that contain a variety of representations which provide general indemnifications. The Fund’s maximum exposure under these arrangements is unknown as this would involve future claims that may be made against the Fund that have not yet occurred.
Reaves Utility Income Fund Notes to Financial Statements October 31, 2017
26 www.utilityincomefund.com
9. RECENT ACCOUNTING PRONOUNCEMENTS In December 2016, the Financial Accounting Standards Board ("FASB") issued Accounting Standards Update (“ASU”) 2016‐19, “Technical Corrections and Improvements.” It includes an update to Accounting Standards Codification Topic 820 (“Topic 820”), Fair Value Measurement. The update to Topic 820 clarifies the difference between a valuation approach and a valuation technique. It also requires disclosure when there has been a change in either or both a valuation approach and/or a valuation technique. The changes related to Topic 820 are effective for annual reporting periods, including interim periods within those annual periods, beginning after December 15, 2016. Management is currently evaluating the impact of the ASU to the financial statements.
Reaves Utility Income Fund Additional Information October 31, 2017 (Unaudited)
Annual Report | October 31, 2017 27
DIVIDEND REINVESTMENT PLAN Unless the registered owner of Common Shares elects to receive cash by contacting DST Systems, Inc. (the “Plan Administrator”), all dividends declared on Common Shares will be automatically reinvested by the Plan Administrator for shareholders in the Fund’s Dividend Reinvestment Plan (the “Plan”), in additional Common Shares. Shareholders who elect not to participate in the Plan will receive all dividends and other distributions in cash paid by check mailed directly to the shareholder of record (or, if the Common Shares are held in street or other nominee name, then to such nominee) by the Plan Administrator as dividend disbursing agent. You may elect not to participate in the Plan and to receive all dividends in cash by contacting the Plan Administrator, as dividend disbursing agent, at the address set forth below. Participation in the Plan is completely voluntary and may be terminated or resumed at any time without penalty by notice if received and processed by the Plan Administrator prior to the dividend record date; otherwise, such termination or resumption will be effective with respect to any subsequently declared dividend or other distribution. Some brokers may automatically elect to receive cash on your behalf and may re‐invest that cash in additional Common Shares for you. If you wish for all dividends declared on your Common Shares to be automatically reinvested pursuant to the Plan, please contact your broker. The Plan Administrator will open an account for each Common Shareholder under the Plan in the same name in which such Common Shareholder’s Common Shares are registered. Whenever the Fund declares a dividend or other distribution (together, a “Dividend”) payable in cash, non‐participants in the Plan will receive cash and participants in the Plan will receive the equivalent in Common Shares. The Common Shares will be acquired by the Plan Administrator for the participants’ accounts, depending upon the circumstances described below, either (i) through receipt of additional unissued but authorized Common Shares from the Fund (“Newly Issued Common Shares”) or (ii) by purchase of outstanding Common Shares on the open market (“Open‐Market Purchases”) on the NYSE American LLC or elsewhere. If, on the payment date for any Dividend, the closing market price plus estimated brokerage commissions per Common Share is equal to or greater than the net asset value per Common Share, the Plan Administrator will invest the Dividend amount in Newly Issued Common Shares on behalf of the participants. The number of Newly Issued Common Shares to be credited to each participant’s account will be determined by dividing the dollar amount of the Dividend by the net asset value per Common Share on the payment date; provided that, if the net asset value is less than or equal to 95% of the closing market value on the payment date, the dollar amount of the Dividend will be divided by 95% of the closing market price per Common Share on the payment date. If, on the payment date for any Dividend, the net asset value per Common Share is greater than the closing market value plus estimated brokerage commissions, the Plan Administrator will invest the Dividend amount in Common Shares acquired on behalf of the participants in Open‐Market Purchases. In the event of a market discount on the payment date for any Dividend, the Plan Administrator will have until the last business day before the next date on which the Common Shares trade on an “ex‐dividend” basis or 30 days after the payment date for such Dividend, whichever is sooner (the “Last Purchase Date”), to invest the Dividend amount in Common Shares acquired in Open‐Market Purchases. It is contemplated that the Fund will pay monthly income Dividends. Therefore, the period during which Open‐Market Purchases can be made will exist only from the payment date of each Dividend through the date before the next “ex‐dividend” date which typically will be approximately ten days. If, before the Plan Administrator has completed its Open‐Market Purchases, the market price per Common Share exceeds the net asset value per Common Share,

Reaves Utility Income Fund Additional Information October 31, 2017 (Unaudited)
28 www.utilityincomefund.com
the average per Common Share purchase price paid by the Plan Administrator may exceed the net asset value of the Common Shares, resulting in the acquisition of fewer Common Shares than if the Dividend had been paid in Newly Issued Common Shares on the Dividend payment date. Because of the foregoing difficulty with respect to Open‐Market Purchases, the Plan provides that if the Plan Administrator is unable to invest the full Dividend amount in Open‐Market Purchases during the purchase period or if the market discount shifts to a market premium during the purchase period, the Plan Administrator may cease making Open‐Market Purchases and may invest the uninvested portion of the Dividend amount in Newly Issued Common Shares at the net asset value per Common Share at the close of business on the Last Purchase Date, provided that, if the net asset value is less than or equal to 95% of the then current market price per Common Share, the dollar amount of the Dividend will be divided by 95% of the market price on the payment date. The Plan Administrator maintains all shareholders’ accounts in the Plan and furnishes written confirmation of all transactions in the accounts, including information needed by shareholders for tax records. Common Shares in the account of each Plan participant will be held by the Plan Administrator on behalf of the Plan participant, and each shareholder proxy will include those shares purchased or received pursuant to the Plan. The Plan Administrator will forward all proxy solicitation materials to participants and vote proxies for shares held under the Plan in accordance with the instructions of the participants. In the case of Common Shareholders such as banks, brokers or nominees which hold shares for others who are the beneficial owners, the Plan Administrator will administer the Plan on the basis of the number of Common Shares certified from time to time by the record shareholder’s name and held for the account of beneficial owners who participate in the Plan. There will be no brokerage charges with respect to Common Shares issued directly by the Fund. However, each participant will pay a pro rata share of brokerage commissions incurred in connection with Open‐Market Purchases. The automatic reinvestment of Dividends will not relieve participants of any federal, state or local income tax that may be payable (or required to be withheld) on such Dividends. Participants that request a sale of Common Shares through the Plan Administrator are subject to brokerage commissions. The Fund reserves the right to amend or terminate the Plan. There is no direct service charge to participants with regard to purchases in the Plan; however, the Fund reserves the right to amend the Plan to include a service charge payable by the participants. All correspondence or questions concerning the Plan should be directed to the Plan Administrator, DST Systems, Inc., 333 West 11th Street, 5th Floor, Kansas City, Missouri 64105.
FUND PROXY VOTING POLICIES & PROCEDURES A description of the policies and procedures that the Fund uses to determine how to vote proxies relating to portfolio securities is available without charge upon request by calling toll‐free 1‐800‐644‐5571, or on the Fund’s website at http://www.utilityincomefund.com. Information regarding how the Fund voted proxies relating to portfolio securities during the most recent 12‐month period ended June 30 is also available without charge upon request by calling toll‐free 1‐800‐644‐5571, or on the SEC’s website at http://www.sec.gov.
Reaves Utility Income Fund Additional Information October 31, 2017 (Unaudited)
Annual Report | October 31, 2017 29
PORTFOLIO HOLDINGS The Fund files its complete schedule of portfolio holdings with the Commission for the first and third quarters of each fiscal year on Form N‐Q. Copies of the Fund’s Forms N‐Q are available on the Commission’s website at http://www.sec.gov. You may also review and copy Forms N‐Q at the Commission’s Public Reference Room in Washington, D.C. For more information about the operation of the Public Reference Room, please call the Commission at 1‐800‐SEC‐0330. Information on the Fund’s Forms N‐Q is available without a charge, upon request, by contacting the Fund at 1‐800‐644‐5571 and on the website at http://www.utilityincomefund.com.
NOTICE Notice is hereby given in accordance with Section 23(c) of the Investment Company Act of 1940 that the Fund may purchase at market prices from time to time shares of its common stock in the open market.
TAX INFORMATION (UNAUDITED) The Fund designates the following for federal income tax purposes for distributions made during the calendar year ended December 31, 2016 qualified dividend income (“QDI”) and as qualifying for the corporate dividends received deduction (“DRD”).
QDI DRD Reaves Utility Income Fund 100% 100%
In early 2017, if applicable, shareholders of record received this information for the distribution paid to them by the Fund during the calendar year 2016 via Form 1099. The Fund will notify shareholders in early 2018 of amounts paid to them by the Fund, if any, during the calendar year 2017. Pursuant to Section 852(b)(3) of the Internal Revenue Code, the Fund designated $63,249,077 as long‐term capital gain distribution for the year ended October 31, 2017.
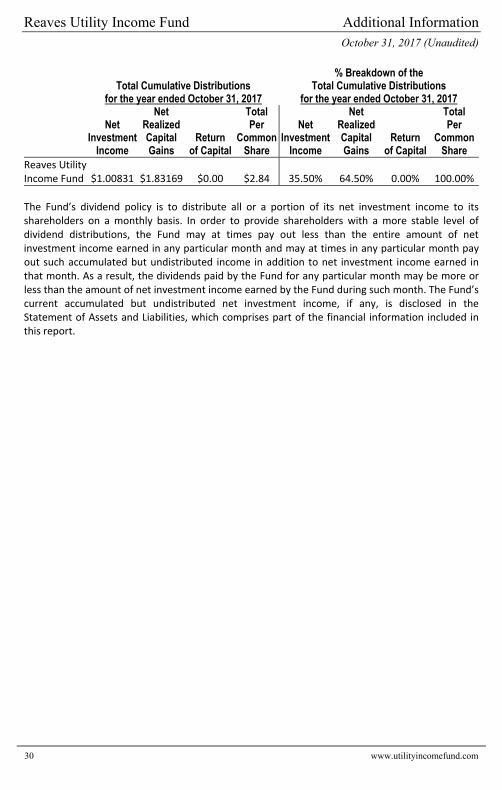
SECTION 19(A) NOTICES The following table sets forth the estimated amount of the sources of distribution for purposes of Section 19 of the Investment Company Act of 1940, as amended, and the related rules adopted there under. The Fund estimates the following percentages, of the total distribution amount per share, attributable to (i) current and prior fiscal year net investment income, (ii) net realized short‐term capital gain, (iii) net realized long‐term capital gain and (iv) return of capital or other capital source as a percentage of the total distribution amount. These percentages are disclosed for the fiscal year‐to‐date cumulative distribution amount per share for the Fund. The amounts and sources of distributions reported in these 19(a) notices are only estimates and not for tax reporting purposes. The actual amounts and sources of the amounts for tax reporting purposes will depend upon the Fund’s investment experience during the remainder of its fiscal year and may be subject to changes based on tax regulations. Shareholders will receive a Form 1099‐DIV for the calendar year that will tell you how to report these distributions for federal income tax purposes.
Reaves Utility Income Fund Additional Information October 31, 2017 (Unaudited)
30 www.utilityincomefund.com
Total Cumulative Distributions
for the year ended October 31, 2017
% Breakdown of the Total Cumulative Distributions
for the year ended October 31, 2017
Net Investment
Income
Net Realized Capital Gains
Return of Capital
Total Per
Common Share
Net Investment
Income
Net Realized Capital Gains
Return of Capital
Total Per
Common Share
Reaves Utility Income Fund $1.00831 $1.83169 $0.00 $2.84 35.50% 64.50% 0.00% 100.00%
The Fund’s dividend policy is to distribute all or a portion of its net investment income to its shareholders on a monthly basis. In order to provide shareholders with a more stable level of dividend distributions, the Fund may at times pay out less than the entire amount of net investment income earned in any particular month and may at times in any particular month pay out such accumulated but undistributed income in addition to net investment income earned in that month. As a result, the dividends paid by the Fund for any particular month may be more or less than the amount of net investment income earned by the Fund during such month. The Fund’s current accumulated but undistributed net investment income, if any, is disclosed in the Statement of Assets and Liabilities, which comprises part of the financial information included in this report.

Reaves Utility Income Fund Trustees & Officers October 31, 2017 (Unaudited)
Annual Report | October 31, 2017 31
The following table includes information regarding the Fund’s trustees and officers, and their principal occupations and other affiliations during the past five years. The address for all trustees is 1290 Broadway, Suite 1100, Denver, CO 80203. The “independent trustees” consist of those trustees who are not “interested persons” of the Fund, as that term is defined under the 1940 Act.
Name, Position(s) Held with the Fund, Address1, and Year of Birth
Term of Office and Length of
Time Served2 Principal Occupation(s) During Past Five Years
Number of Portfolios in
Fund Complex
Overseen by Trustee
Other Directorships Held by Trustee
or Nominee4 Independent Trustees E. Wayne Nordberg Trustee 1938
Since 2012* Mr. Nordberg is currently the Chairman and Chief Investment Officer of Hollow Brook Wealth Management, LLC, a private investment management firm. Mr. Nordberg was formerly a Senior Director at Ingalls & Snyder LLC, a privately owned registered investment advisor.
1 Mr. Nordberg is a Director of Annaly Capital Management, Inc., a real estate investment trust and PetroQuest Energy, Inc., an oil and gas exploration company.
Larry W. Papasan Trustee 1940
Since Inception*
Mr. Papasan is currently a Director/Trustee of Mimedx Inc., Bio Medical Tissue Technologies, Bionova, Inc., Spinez, Inc., and Cogenix Inc., each a medical services company, SSR Engineering, an engineering company, and Triumph Bankshares, Inc., a financial institution.
1 None

Reaves Utility Income Fund Trustees & Officers October 31, 2017 (Unaudited)
32 www.utilityincomefund.com
Name, Position(s) Held with the Fund, Address1, and Year of Birth
Term of Office and Length of
Time Served2 Principal Occupation(s) During Past Five Years
Number of Portfolios in Fund
Complex Overseen by Trustee
Other Directorships Held by Trustee
or Nominee4 Independent Trustees Mary K. Anstine Trustee 1940
Since Inception***
Ms. Anstine is also a Trustee of A.V. Hunter Trust and Director of Colorado Uplift Board. Ms. Anstine was formerly a Director of the Trust Bank of Colorado (later purchased and now known as Northern Trust Bank), HealthONE, and Denver Area Council of the Boy Scouts of America, and a member of the American Bankers Association Trust Executive Committee.
1 Ms. Anstine is a Trustee of ALPS ETF Trust (19 funds); Financial Investors Trust (33 funds); ALPS Variable Investment Trust (10 funds); and Westcore Funds (14 funds).
Michael F. Holland Trustee 1944
Since Inception***
Mr. Holland is Chairmanof Holland & Company, an investment management company.
1 Mr. Holland is a Director of Blackstone/GSO and Real Estate Funds (1 fund), Holland Series Funds, Inc. (1 fund); and Trustee of State Street Master Funds (5 funds) and China Fund, Inc. (1 fund).
Jeremy W. Deems Chairman and Trustee 1976
Trustee Since 2008** Chairman Since 2017
Mr. Deems is the Co‐Founder, Chief Financial Officer of Green Alpha Advisors, LLC, a registered investment adviser, and Co‐Portfolio Manager of the Shelton Green Alpha Fund. Prior to joining Green Alpha Advisors, Mr. Deems was Chief Financial Officer and Treasurer of Forward Management, LLC, ReFlow Management, Co., LLC, ReFlow Fund, LLC, a private investment fund, and Sutton Place Management, LLC, an administrative services company from 2004 to 2007.
1 Mr. Deems is a Trustee of ALPS ETF Trust (19 funds); Financial Investors Trust (33 funds); Clough Funds Trust (1); ALPS Variable Investment Trust (10 funds); and Elevation ETF Trust (1 fund).
Reaves Utility Income Fund Trustees & Officers October 31, 2017 (Unaudited)
Annual Report | October 31, 2017 33
Name, Position(s) Held with the Fund, Address1, and Year of Birth
Term of Office and Length of
Time Served2 Principal Occupation(s) During Past Five Years
Number of Portfolios in Fund
Complex Overseen by Trustee
Other Directorships Held by Trustee
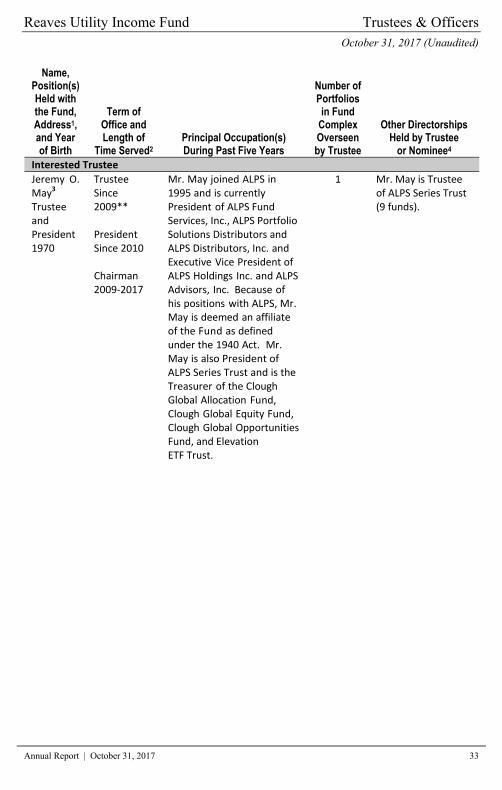
or Nominee4 Interested Trustee
Jeremy O. May3 Trustee and President 1970
Trustee Since 2009** President Since 2010 Chairman 2009‐2017
Mr. May joined ALPS in1995 and is currently President of ALPS Fund Services, Inc., ALPS Portfolio Solutions Distributors and ALPS Distributors, Inc. and Executive Vice President of ALPS Holdings Inc. and ALPS Advisors, Inc. Because of his positions with ALPS, Mr. May is deemed an affiliate of the Fund as defined under the 1940 Act. Mr. May is also President of ALPS Series Trust and is the Treasurer of the Clough Global Allocation Fund, Clough Global Equity Fund, Clough Global Opportunities Fund, and Elevation ETF Trust.
1 Mr. May is Trustee of ALPS Series Trust (9 funds).
Reaves Utility Income Fund Trustees & Officers October 31, 2017 (Unaudited)
34 www.utilityincomefund.com
Name, Position(s) Held with the Fund,
Address1, and Year of Birth
Term of Office and Length of
Time Served2 Principal Occupation(s) During Past Five Years
Other Directorships Held by Trustee
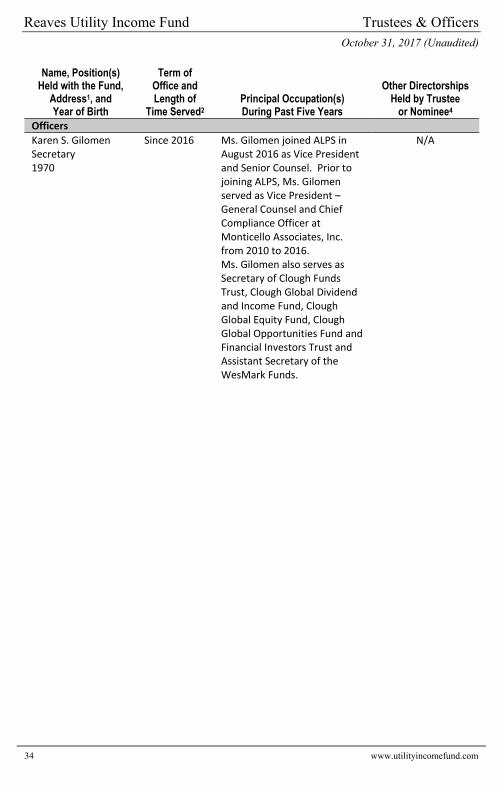
or Nominee4 Officers
Karen S. Gilomen
Secretary 1970
Since 2016 Ms. Gilomen joined ALPS in August 2016 as Vice President and Senior Counsel. Prior to joining ALPS, Ms. Gilomen served as Vice President – General Counsel and Chief Compliance Officer at Monticello Associates, Inc. from 2010 to 2016. Ms. Gilomen also serves as Secretary of Clough Funds Trust, Clough Global Dividend and Income Fund, Clough Global Equity Fund, Clough Global Opportunities Fund and Financial Investors Trust and Assistant Secretary of the WesMark Funds.
N/A
Reaves Utility Income Fund Trustees & Officers October 31, 2017 (Unaudited)
Annual Report | October 31, 2017 35
Name, Position(s) Held with the Fund,
Address1, and Year of Birth
Term of Office and Length of
Time Served2 Principal Occupation(s) During Past Five Years
Other Directorships Held by Trustee
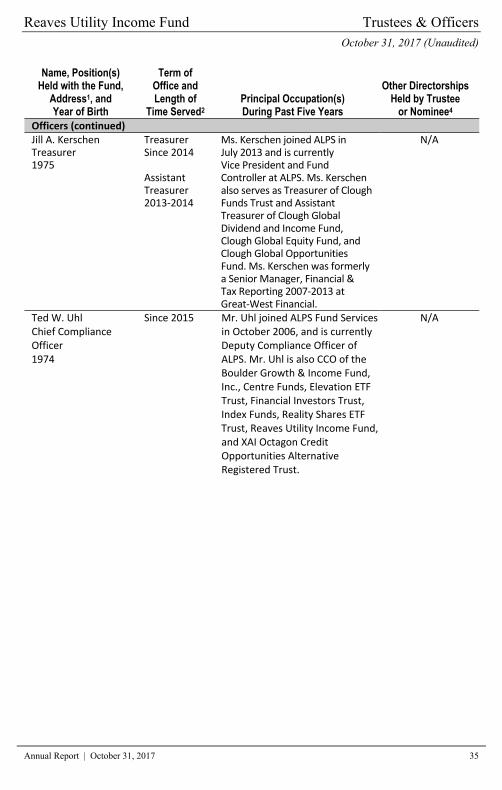
or Nominee4 Officers (continued) Jill A. Kerschen Treasurer 1975
TreasurerSince 2014 Assistant Treasurer 2013‐2014
Ms. Kerschen joined ALPS in July 2013 and is currently Vice President and Fund Controller at ALPS. Ms. Kerschen also serves as Treasurer of Clough Funds Trust and Assistant Treasurer of Clough Global Dividend and Income Fund, Clough Global Equity Fund, and Clough Global Opportunities Fund. Ms. Kerschen was formerly a Senior Manager, Financial & Tax Reporting 2007‐2013 at Great‐West Financial.
N/A
Ted W. Uhl Chief Compliance Officer 1974
Since 2015 Mr. Uhl joined ALPS Fund Services in October 2006, and is currently Deputy Compliance Officer of ALPS. Mr. Uhl is also CCO of the Boulder Growth & Income Fund, Inc., Centre Funds, Elevation ETF Trust, Financial Investors Trust, Index Funds, Reality Shares ETF Trust, Reaves Utility Income Fund, and XAI Octagon Credit Opportunities Alternative Registered Trust.
N/A
Reaves Utility Income Fund Trustees & Officers October 31, 2017 (Unaudited)
36 www.utilityincomefund.com
(1) Address: 1290 Broadway, Suite 1100, Denver, Colorado 80203. (2) The Fund commenced operations on February 24, 2004. The Fund’s Board of Trustees is divided
into three classes, each class serves for a term of three years. Each year the term of office of one class expires and the successors elected to such class serve for a term of three years. * Term expires at the Fund’s 2018 Annual Meeting of Shareholders. ** Term expires at the Fund’s 2019 Annual Meeting of Shareholders. *** Term expires at the Fund’s 2020 Annual Meeting of Shareholders.
(3) Mr. May is considered to be an “interested person” (as defined in the 1940 Act) because of his affiliation with ALPS, which acts as the Fund’s administrator.
(4) The numbers enclosed in the parentheticals represent the number of funds overseen in each respective directorship held by the Trustee.
The Statement of Additional Information includes additional information about the Fund’s Trustees and is available, without a charge, upon request, by contacting the Fund at 1‐800‐644‐5571.

This Fund is neither insured nor guaranteed by the U.S. Government, the FDIC, the Federal Reserve Board or any other governmental agency or insurer.
For more information, please call 1-800-644-5571.
Secondary market support provided to the Fund by ALPS Fund Services, Inc.’s affiliate ALPS Portfolio Solutions Distributor, Inc., a FINRA member.
Reaves Utility income FUnd1290 Broadway, Suite 1100Denver, CO 802031-800-644-5571