rebalancing finance and boosting investment€¦ · pattern of boom-bust credit cycles, whereby...
TRANSCRIPT

10 TRANSITION REPORT 2015-16REBALANCING FINANCE
CHAPTER 1: REBALANCING FINANCE AND BOOSTING INVESTMENT
25PERCENTAGE POINTS INCREASE IN THAT DEBT-TO-GDP RATIO BETWEEN 2007 AND 2014
AROUND
US$75 BILLION A YEARCONSERVATIVE ESTIMATE OF THE REGION’S ADDITIONAL INVESTMENT FINANCING NEEDS
REBALANCING FINANCE AND BOOSTING INVESTMENT
123%DEBT-TO-GDP RATIO OF THE REGION’S NON-FINANCIAL SECTOR

11
The global financial crisis has triggered a dramatic reduction in external imbalances in the transition region, but this rebalancing has come at the expense of investment. The region needs to invest around US$ 75 billion more per year to bring investment back to the levels expected of economies at this stage of development. However, despite those lower levels of investment and the credit crunch, the debt of the non-financial sector in the region has actually increased. Meeting those additional investment needs will require financial sector rebalancing, with greater use of equity instruments, resolution of non-performing loans and more diverse cross-border funding.
IntroductionSeven years have now passed since Lehman Brothers collapsed in September 2008. By and large, the financial crisis of 2008-09 was initially considered to be the result of a lending boom that turned into a bust. Over time, however, concerns have been raised that this latest crisis did not follow the usual pattern of boom-bust credit cycles, whereby indebtedness rises quickly during the boom period and then readjusts during the bust phase.1 Instead, in both advanced and emerging market economies, the overall stock of debt has actually continued to rise since the crisis. Recent estimates suggest that the global debt-to-GDP ratio increased by 17 percentage points between 2007 and 2014, reaching 286 per cent,2 with advanced economies seeing particularly strong increases in levels of public debt. Some view the large stock of debt before 2008 and the increase in overall indebtedness since the crisis as the main reasons for the sluggish post-crisis recovery in the global economy.3
APPROXIMATE SHARE OF EU-15 COUNTRIES IN FDI INFLOWS IN THE REGION
60% 1 See Schularick and Taylor (2012) for analysis of credit-fuelled crises. 2 See McKinsey Global Institute (2015). 3 See, for instance, Lo and Rogoff (2015).

Unwe
ight
ed a
vera
ge s
hare
of G
DP (p
er c
ent)
FDI (net) Other capital flows (net) Savings Investment
2000
2001
2002
2003
2004
2005
2006
2007
2008
2009
2010
2011
2012
2013
2014
2015
2016
-5
0
5
10
15
20
25
30
35
Unwe
ight
ed a
vera
ge s
hare
of G
DP (p
er c
ent)
2000
2001
2002
2003
2004
2005
2006
2007
2008
2009
2010
2011
2012
2013
2014
2015
2016
-5
0
5
10
15
20
25
30
35
FDI (net) Other capital flows (net) Savings Investment
Unwe
ight
ed a
vera
ge s
hare
of G
DP (p
er c
ent)
2000
2001
2002
2003
2004
2005
2006
2007
2008
2009
2010
2011
2012
2013
2014
2015
2016
-5
0
5
10
15
20
25
30
35
FDI (net) Other capital flows (net) Savings Investment
Unwe
ight
ed a
vera
ge s
hare
of G
DP (p
er c
ent)
2000
2001
2002
2003
2004
2005
2006
2007
2008
2009
2010
2011
2012
2013
2014
2015
2016
-5
0
5
10
15
20
25
30
35
FDI (net) Other capital flows (net) Savings Investment
New EU Member states
Emerging Asia
Rest of EBRD region
Latin America
12 TRANSITION REPORT 2015-16REBALANCING FINANCE
CHAPTER 1: REBALANCING FINANCE AND BOOSTING INVESTMENT
investment. It then looks at the evolution of total debt, finding that this has continued rising steadily, despite the fact that credit granted to companies (adjusted for inflation) has been contracting in many countries. The discussion then moves on to the factors that explain how lower investment levels and the credit crunch can co-exist with rising debt levels. The chapter then assesses the implications that this has for the financing of future investment needs, considering both debt and equity instruments. It first looks at how overall debt levels in the region compare with those in other emerging markets (examining the quantity of debt, the composition of debt and, importantly, the quality of debt) before looking at alternative financing options involving a greater role for equity. Lastly, in light of the current shortage of domestic savings, the chapter turns its attention to foreign-financed equity, examining the levels of foreign direct investment (FDI) after the crisis and opportunities for the geographical diversification of FDI flows.
This raises a number of interrelated questions. Have similar trends been observed in the region where the EBRD invests? Has indebtedness continued to rise? And if so, has it reached excessive levels? How have savings, investment and investment needs evolved since the crisis? And if both investment needs and debt levels are high and rising, how can these trends be reconciled, both historically and in the future? Answering these questions may provide some insight into how finance in the post-crisis world can be rebalanced, made more diverse and better support the long-term convergence of incomes with the levels of more advanced economies.
This chapter starts by looking at the savings-investment balance in the region and the rapid adjustment of countries’ external positions following the 2008-09 crisis. It considers the implications of this adjustment for investment financing needs, showing that the region needs to considerably increase
CHART 1.1. Savings, investment and capital flows as a percentage of GDP
Source: IMF and authors’ calculations. Note: Data represent simple averages. The new EU member states are Bulgaria, Croatia, Cyprus, Estonia, Hungary, Latvia, Lithuania, Poland, Romania, the Slovak Republic and Slovenia. Emerging Asia comprises China, Hong Kong Special Administrative Region, India, Indonesia, Malaysia, the Philippines, South Korea, Thailand and Vietnam. Latin America comprises Argentina, Bolivia, Brazil, Chile, Colombia, Ecuador, Mexico, Paraguay, Peru, Uruguay and Venezuela.

Per c
ent
CEB SEE SEMED Russia Central Asia EEC Turkey-5
0
5
10
15
20
25
30
35
40
2004-08 2009-14
13
CHART 1.2. Annual growth rate of domestic corporate debt, adjusted for inflation and exchange rate movements
4 See Friedrich et al. (2013). 5 See EBRD (2009) for a discussion of this issue. 6 See De Haas and Van Lelyveld (2006 and 2014). 7 See Brown and De Haas (2012).8 See De Haas and Van Horen (2012).9 See, for instance, Levchenko and Mauro (2006).
Savings, investment and financing needs
External imbalances before the crisisThe last time the Transition Report was dedicated to the subject of finance, back in 2006, financial sectors across the region were booming, economies were enjoying strong rates of growth and income was converging with the levels seen in advanced economies in the European Union. In particular, cross-border capital flows played a key role in supporting growth in emerging Europe during the 2000s.
To a large extent, those strong capital inflows came in the form of FDI and were accompanied by deeper institutional integration with more advanced European economies in the context of the EU accession of countries in central and south-eastern Europe.4 Inflows of FDI, as well as other capital inflows, enabled Europe’s emerging markets to sustain relatively high levels of investment given their traditionally low levels of domestic savings (see Chart 1.1). In turn, these high investment levels supported growth. Most capital inflows in the region came from countries in the eurozone, such as Austria, Germany and Italy.
Increased foreign ownership of banks played a very important role, both as a form of FDI in the financial services sector and as a channel for the financing of investment.5 Foreign banks’ access to parent funding improved the availability of credit in the host economies and helped to reduce the adverse impact of local financial shocks, including the impact of the Russian crisis of 1998.6 However, this then increased the vulnerabilities that are associated with having a higher percentage of debt denominated in or indexed to a foreign currency.7
Swift external adjustmentFollowing the 2008-09 crisis, net capital flows from advanced European economies fell sharply as Europe battled its economic crisis and the eurozone experienced a protracted recession. Cross-border lending, particularly in the form of syndicated loans, declined very quickly, falling by around 60 per cent in the year after the collapse of Lehman Brothers.8
In the face of this major shock, external adjustment in the region has been impressive. In many countries, vast current account deficits (which in some cases exceeded 20 per cent of GDP before the crisis) declined swiftly and large external imbalances were eliminated or dramatically reduced within months.
The fact that a large proportion of foreign investment in emerging Europe came in the form of FDI played a stabilising role during the global financial crisis, since FDI is less prone to sudden reversals than other types of capital inflow, such as portfolio investment.9 The Vienna Initiative – coordinated efforts by host and home supervisors, cross-border banks and international financial institutions – helped to ensure that foreign banks did not embark on an immediate large-scale withdrawal from the region. That initiative helped, at least temporarily, to stabilise lending by the 17 banks that signed commitment letters.10
At the same time, banking sectors across the transition region – particularly in central Europe and the Baltic states (CEB) andsouth-eastern Europe (SEE) – have continued to deleverage,
as discussed in the Macroeconomic Overview. As a result, average real growth in domestic credit granted to companies (that is to say, growth adjusted for inflation and exchange rate movements) has been negative in the CEB and SEE regions, as well as in the southern and eastern Mediterranean (SEMED; see Chart 1.2). Small and medium-sized enterprises (SMEs) in these regions have been particularly affected by this credit crunch, as discussed in Chapter 2.
Investment shortfallWhile the external adjustment has been swift, it has resulted in strong declines in investment (see Chart 1.1). Investment in the transition region has stood at close to 20 per cent of GDP since 2008 – a modest figure for middle-income economies. The fall in the rate of investment has been particularly sharp in the new EU member states, which were more reliant on cross-border capital flows from the EU-15 economies for the financing of investment prior to the crisis (as well as being the countries where the credit crunch has been most pronounced). However, a broadly similar pattern has been observed in the rest of the region as well. At the same time, the increase in domestic savings (calculated as the sum of household savings, corporate savings and government savings) in emerging Europe has been very limited. Marked increases in domestic savings rates have mostly been limited to economies where levels of domestic savings before the crisis were particularly low – such as the single digit figures observed in Bulgaria and Lithuania.
In some ways, this type of adjustment may not be particularly surprising. In a crisis, governments typically seek to stimulate aggregate demand in the short term by boosting consumption (both private and public) at the expense of savings. In the longer term, however, higher levels of savings are needed to sustain adequate levels of investment without accumulating ever larger stocks of debt. Thus, short and longer-term policy objectives may be at odds with each other and may need to be reconciled.
Source: IMF, national authorities via CEIC Data, BIS and authors’ calculations.
10 See De Haas et al. (2015) for empirical evidence.

Adjusted GDP per capita in 2004 (log)
Adju
sted
inve
stm
ent r
ate
(per
iod
aver
age;
per
cen
t)
ALB
BOS
BULCRO
CYP
EST
GRCHUN
LAT
LIT
MNG
POL
ROMSERSVKSLO
ARM
AZE BEL
EGYGEO
JOR
KAZ
KGZ
MDAMONMOR
RUS
TJKTUN
TUR
UKR
-1.0 -0.8 -0.6 -0.4 -0.2 0.0 0.2 0.4 0.6 0.8-10
-5
0
5
10
15
20
CEB and SEE Rest of EBRD region Rest of the world Line of best fit
Adjusted GDP per capita in 2009 (log)
Adju
sted
inve
stm
ent r
ate
(per
iod
aver
age;
per
cen
t)
ALB
BOS
BULCRO
CYPEST
GRCHUN
LATLIT
MNG
POL
ROM
SER SVK
SLO
ARM
BEL
EGY
GEO
JOR
KAZKGZ
MDA
MON
MOR
RUS
TJKTUN
TUR
UKR
-1.0 -0.5 0.0 0.5-10
-5
0
5
10
15
20
CEB and SEE Rest of EBRD region Rest of the world Line of best fit
Before the crisis: 2004-07
After the crisis: 2009-13
14 TRANSITION REPORT 2015-16REBALANCING FINANCE
CHAPTER 1: REBALANCING FINANCE AND BOOSTING INVESTMENT
Is this adjustment a cause for concern? The answer depends on whether those reduced investment levels are broadly typical of economies at this stage of development and whether a protracted period of low investment puts long-term growth in emerging Europe at risk.12
Investment financing needsIn order to shed some light on this issue, we can look at annual gross fixed capital formation – physical investment in things like factories, buildings and computers – and compare it with the levels of investment observed elsewhere, while taking into account differences in the existing stock of capital, the level of income per capita, the stability of the macroeconomic environment and other relevant characteristics of individual economies.
The second panel of Chart 1.3 shows the average annual rate of gross fixed capital formation (that is, investment net of change in inventory levels) as a percentage of GDP for various countries in the post-crisis period (2009-13), plotted against those countries’ GDP per capita at the start of the period, adjusted for differences in purchasing power. The figures take account of various economic characteristics of those countries. The first panel depicts the same relationship in the build-up to the financial crisis (2004-07). Countries with a lower income per capita – typically economies in the catching-up phase – tend to have higher rates of investment,13 and this relationship has become more pronounced since the global financial crisis.
While countries in emerging Europe and Central Asia used to invest roughly the same amount as their peers around the world before the financial crisis, they have invested significantly less in the post-crisis period. This decline appears to be particularly large in the CEB and SEE regions (with the corresponding dots in Chart 1.3 dropping from around the fitted line to below the fitted line). This is a first piece of evidence suggesting that the sustained decline in investment may indeed be a cause for concern and that the region’s investment needs will rise substantially in the future.
This analysis is supported by a regression framework that relates investment (gross fixed capital formation as a percentage of GDP) in the pre and post-crisis periods to the initial levels of income per capita and capital stock as well as various other country-level characteristics. For instance, countries that have experienced stronger economic growth in the preceding period – a proxy for investors’ perceptions of growth potential – tend to invest more.14 Higher average inflation (a reflection of a lackof macroeconomic stability) is associated with lower investmentlevels, while greater political stability is associated with higher levels of investment.
According to this regression analysis,15 investment levels in the region in the mid-2000s were a little higher than would be expected on the basis of countries’ economic characteristics, although the differences between the observed and expected levels of investment were not statistically significant. Meanwhile, even during the pre-crisis period, investment levels in Russia were markedly lower than those of its peers.16
However, since the 2008-09 crisis economies in the CEB and SEE regions have been investing, on average, 3 to 4 percentage
The transition region’s adjustment through low investment rates stands in stark contrast with the post-crisis experiences of emerging markets in Asia and Latin America (see Chart 1.1). The majority of emerging Asian economies traditionally enjoy much higher levels of domestic savings, which are more than sufficient to finance the high levels of investment in these countries.11 This trend has hardly been affected by the 2008-09 crisis. Indeed, investment has actually increased somewhat as a share of GDP as a result of the large public capital spending programmes that were adopted in China and a number of other countries in the region in the wake of the global crisis. In Latin America, on the other hand, investment levels were somewhat on the low side throughout the 2000s but they have, if anything, increased since the crisis. This underscores the unique nature of the post-crisis external adjustment observed in Europe’s emerging market economies.
11 This could be for cultural reasons, or it could be because these countries’ welfare systems are less generous than the European model (see World Bank, 2012).
12 See also EBRD (2013) for a discussion of this issue. 13 See Murphy et al. (1989).
14 Growth is lagged to exclude feedback from weak investment to contemporaneous growth, as well as to focus on potential growth. Observed growth may also play a role as firms respond to weaker demand in their post-crisis economies. However, the IMF (2015b) finds that in the aftermath of the 2008-09 crisis the decline in investment in emerging economies has been two to four times stronger than those normally observed during recessions.
CHART 1.3. Fixed capital investment and GDP per capita: before and after the crisis
Source: IMF, Penn World Tables 8.0 and authors’ calculations. Note: The trend line shows a linear relationship between fixed capital formation as a percentage of GDP (averages for the periods 2004-07 and 2009-13, conditional on a number of country-level characteristics) and the log of GDP per capita at purchasing power parity at the start of the period.

15
points of GDP less than comparable emerging market economies elsewhere (with these differences being statistically significant). In eastern Europe and the Caucasus (EEC; excluding Belarus) the corresponding gap is as much as 7 percentage points of GDP. Estimates also point to weaker than expected investment in other regions in the post-crisis period (see Chart 1.4) – with the exception of Belarus, Mongolia and Morocco, where investment levels have remained relatively high (see Chart 1.3).
Reflecting broader trends in investment, recent spending on infrastructure – a particular type of investment which benefits large numbers of businesses and consumers – has also been low by historical standards (see Box 1.1). Estimates based on long-term trends suggest that infrastructure spending needs to rise by at least half a percentage point of GDP, unless significant improvements can be made in terms of the cost-efficiency of infrastructure spending.17
This shortage of investment is unlikely to be sustainable in the long term without negative implications for growth, so the investment rate will need to increase accordingly. Indeed, Table 1.1 (left-hand columns) indicates that the region requires around US$ 75 billion of additional investment per year. The cumulative shortfall for the period 2016-20 is estimated at over US$ 400 billion (using IMF World Economic Outlook assumptions about the growth of economies’ nominal GDP).
Another way of estimating shortfalls in investment relative to peers is to individually match countries from the region where the EBRD invests to groups of countries outside the region that have similar economic characteristics, rather than accounting for differences in economic characteristics by means of a regression analysis. Average differences in investment rates between groups of countries from the region and their matched peers from outside the region provide an alternative set of estimates of investment shortfalls.
The overall estimates reported in Table 1.1 (right-hand columns) are similar to the estimates obtained using the regression analysis (both in terms of levels and in terms of their statistical significance). If anything, they are somewhat larger, doubling the estimated investment needs for some regions. The estimated investment needs are higher in the case of both the CEB and SEE regions, but somewhat lower for Russia.
In fact, both sets of estimates in Table 1.1 are fairly conservative. They do not involve any assessment of the required level of investment and are based entirely on comparing investment levels in the region with those in other economies that are comparable in terms of their income per capita, capital stocks and other characteristics, assuming that the region’s economies need to gradually scale up investment to the average levels observed in countries with similar economic characteristics.18
15 Other factors include education, demographic characteristics, the quality of economic institutions, the initial level of debt, and indicators related to the structure of output and dependence on commodities.
16 See EBRD (2012) for a detailed discussion.17 See McKinsey Global Institute (2013) and IMF (2014) for a discussion and estimates.
CHART 1.4. Estimated investment surplus/shortfall as a percentage of GDP
Source: IMF, Penn World Tables 8.0 and authors’ calculations. Note: These estimates are based on pooled ordinary least squares with standard errors clustered by country. The explanatory variables include the log of capital stock per worker at the start of the period, GDP per capita at purchasing power parity and a number of other country-level characteristics. * denotes values that are statistically significant at the 5 per cent level.
Source: IMF, Penn World Tables 8.0 and authors’ calculations.Note: These values represent coefficients for regional dummies when regressing gross fixed capital formation as a percentage of GDP on the log of capital stock per worker at purchasing power parity at the start of the period, the log of GDP per capita, average inflation and a number of other country-level characteristics. Positive values correspond to investment gaps. Conservative estimate 1 is based on a single coefficient for the entire region. Conservative estimate 2 only takes into account statistically significant coefficients and assumes the rest to be equal to zero. Conservative estimate 3 subtracts negative investment gaps for subregions from the main estimate.
TABLE 1.1. Estimated annual shortfall in investment
Region
Regression analysis(global sample)
Matching with countries with similar characteristics
% of GDPUS$ billions % of GDP
US$ billions
Total EBRD region 1.34 59.5 1.26 56.1
CEB 3.15 28.1 6.13 54.6
SEE 2.95 16.5 6.21 34.7
EEC excl. Belarus 6.57 11.6 2.58 4.6
Turkey 0.42 3.1 4.74 35.7
Russia 1.12 13.2 0.70 8.2
SEMED excl. Morocco 0.77 2.9 2.72 10.4
Central Asia excl. Mongolia -1.63 -5.4 -1.12 -3.7
Belarus, Mongolia and Morocco -10.81 -18.9 -9.58 -16.8
Total investment gap (US$ billions at 2015 prices)
Main estimate 75.4 148.1
Conservative estimate I 59.5 56.1
Conservative estimate II 56.1 93.9
Conservative estimate III 51.1 127.6
18 For a less conservative approach, see, for instance, Lopez de Silanes et al. (2015) who estimate additional financing needs of 5 per cent of GDP or more to meet SME demand for funding in Poland and Romania.
Perc
enta
ge p
oint
s of
GDP
EEC* excl. Belarus
CEB* SEE* Russia SEMED excl. Morocco
Turkey Central Asia excl. Mongolia
-10
-8
-6
-4
-2
0
2
4
2009-13 2009-13 2004-07 2004-07

16 TRANSITION REPORT 2015-16REBALANCING FINANCE
CHAPTER 1: REBALANCING FINANCE AND BOOSTING INVESTMENT
In fact, annual changes in the region’s debt-to-GDP ratio before and after the 2008-09 crisis have been fairly similar (see red dots in Chart 1.6). Before the crisis, the nominal stock of debt expanded very rapidly but so did nominal GDP. And since the crisis, growth in nominal debt has slowed significantly, but economic growth has slowed as well.
What explains this rapid increase in total gross debt against the background of weak investment, continued deleveraging by parent banks with subsidiaries in the region (see Macroeconomic Overview) and the severe credit constraints faced by firms? To answer this question, it is important to look not only at the quantity of debt, but also at its composition and its quality. Three developments in particular have played a key role in this regard. First, the prevalence of debt denominated in foreign currency has led to revaluations of the stock of debt when currencies have depreciated. Second, increases in public debt and active use of external borrowing by larger companies have added to the stock of debt. Third, non-performing loans (NPLs) continue to clog up the balance sheets of banks and companies and inflate the debt-to-GDP figures, while at the same time weighing on the flow of fresh credit to the economy. The next few sections explore these various factors in turn.
A continued reliance on foreign currency-denominated debtThe depreciation of the region’s currencies against the US dollar and the euro meant that in 2009, 2012 and 2014 a significant percentage of the increase in the debt-to-GDP ratio was due to the revaluation of the existing stock of debt (both external
Debt finance: is the transition region overleveraged?How can the region’s large additional investment needs best be financed? Funding additional investment will require a combination of debt and equity financing. This chapter looks at both, starting with debt.
Rising debt levelsGiven the decline in physical investment in the region in recent years and the credit crunch faced by SMEs in many countries, it may come as a surprise to learn that the overall debt of the non-financial sector in the transition region (which comprises the debt of governments and households, as well as firms’ domestic and external debt) increased from 98 per cent of GDP in 2007 to 123 per cent of GDP in 2014.19 This increase is broadly in line with global trends but somewhat stronger than the average, totalling 25 percentage points of GDP compared with a global average increase of 17 percentage points. It has also been broadly based: both countries with relatively low initial levels of debt and those with higher levels of indebtedness have increased their debt levels, and they have done so to a similar extent (see Chart 1.5).
Chart 1.5 confirms that average debt increases in the region have outpaced those observed elsewhere. Excluding Cyprus and Greece, debt levels have increased most strongly in Ukraine, Mongolia, Armenia and Slovenia (the countries that lie furthest away from the 45-degree diagonal line), while in terms of aggregate debt levels, the most indebted countries are Hungary, Jordan and Croatia.
19 If Greece is excluded, the corresponding increase in the debt-to-GDP ratio is from 89 per cent in 2007 to 115 per cent in 2014.
CHART 1.5. Debt levels in 2007 and 2014 as a percentage of GDP CHART 1.6. Contributions to changes in debt-to-GDP ratios
Source: IMF, national authorities via CEIC Data, BIS and authors’ calculations. Note: Total debt comprises public debt, domestic private-sector debt and external debt of non-financial companies. Cyprus and Greece are not shown.
Source: IMF, national authorities via CEIC Data, BIS and authors’ calculations. Note: Data represent simple averages. Debt comprises public debt, domestic private-sector debt and ex-ternal debt of non-financial companies. The contribution made by exchange rates is based on approximate assumptions about the currency composition of debt denominated in foreign currency.
Total debt in 2007 (per cent of GDP)
Tota
l deb
t in
2014
or l
ates
t figu
res
(per
cen
t of G
DP)
ALBARM
AZE
BEL BOS
BUL
CRO
EGY
EST
FYRGEO
HUN
JOR
KAZ
KOS
KGZ
LAT
LIT MDA
MONMNG
MORPOL
ROMRUS
SERSVK
SLO
TJK
TUN
TUR
UKR
45-degree line
45-degree line
0 50 100 150 200 250 3000
50
100
150
200
250
300
Chan
ge in
deb
t-to-
GDP
ratio
(per
cent
age
poin
ts)
Debt (per cent of GDP)
2004
2005
2006
2007
2008
2009
2010
2011
2012
2013
2014
2015
-25
-20
-15
-10
-5
0
5
10
15
20
25
30
95
100
105
110
115
120
125
130
135
140
145
150
Contribution of nominal GDP (left-hand axis) Contribution of nominal debt (left-hand axis)Contribution of exchange rate (left-hand axis)Level of debt (right-hand axis)
Change in debt-to-GDP ratio (left-hand axis)

17
and domestic debt denominated in foreign currency). On the basis of current trends, this revaluation effect will be even stronger in 2015. One example of such an effect was the jump in the effective cost of mortgages denominated in Swiss francs following the franc’s sharp appreciation against the euro in January 2015. These mortgages were popular in several CEB countries before the crisis owing to their low nominal interest rates. In fact, prior to the crisis, the region’s currencies also had a tendency to appreciate, reducing the burden of foreign currency-denominated debt.
The level of dollarisation (that is to say, credit denominated in US dollars or another foreign currency as a percentage of total credit) is high in most countries in the region (see Chart 1.7). Indeed, it is now significantly higher than in most emerging market or advanced comparator economies. While dollarisation ratios in Latin American countries, for instance, have been steadily declining since the mid-1990s, dollarisation levels in the region where the EBRD invests have barely changed (as can be seen from the fact that the diamonds in Chart 1.7 corresponding to 2007 figures tend to be close to the bars indicating the latest data). Even in countries which have seen significant declines in dollarisation (such as Albania, FYR Macedonia, Georgia and Tajikistan), the initial levels were exceptionally high, so dollarisation remains at elevated levels.
Dollarisation ratios are even higher if they are calculated on the basis of the entire stock of debt (rather than just domestic debt), as external debt of governments and companies denominated in foreign currency represents a significant proportion of total debt in many countries. This is also true of other emerging markets. However, even using this broader measure, the level of dollarisation in the region where the EBRD invests remains significantly higher than in other emerging market economies (the averages of 51 and 28 per cent, respectively).
The second round of the EBRD’s Banking Environment and Performance Survey (BEPS II), which was conducted in 2011 across the region where the EBRD invests, provided insight into the main reasons for the high levels of dollarisation in the region. As part of the survey, banks’ CEOs were asked to assess the importance of various factors in terms of explaining the underlying trends in foreign currency lending. The factors can be grouped together in three main categories. The first related to funding – the availability of funding in foreign and local currencies from parent banks, international markets and domestic depositors. The second captured the relative terms of loans in foreign and local currencies (as regards their interest rates and maturities) and demand from clients (including the competitive pressures that banks face to respond to clients’ demand for foreign currency denominated loans). The third group reflected changes in the perceived riskiness of foreign currency lending according to the respondent, the regulator or risk managers.
Their answers suggest that clients’ demand for foreign currency lending (owing to lower interest rates and/or longer maturities on offer) and competitive pressures are the main factors driving up dollarisation, while declines in dollarisation are mainly due to the increased riskiness of foreign currency lending
CHART 1.7. Percentage of domestic corporate and household debt denominated in foreign currency
CHART 1.8. Percentage of managers that report the given factor explains/contributes to an increase/decrease in the proportion of foreign currency lending
Source: IMF, national authorities via CEIC Data and authors’ calculations. Note: Data for 2007 are not shown for countries that have subsequently adopted the euro.
Source: BEPS II and authors’ calculations. Note: The percentages refer to the proportion of managers who reported that the respective groups of factors were very important (top category in the five-point scale).
15-30%ESTIMATED INCREASE IN BILATERAL INWARD FDI IN RESPONSE TO A SUBSTANTIAL REDUCTION IN CORRUPTION
Croa
tiaSe
rbia
Bosn
ia a
nd H
erz.
Arm
enia
Geor
gia
Alba
nia
Tajik
ista
nBu
lgar
iaRo
man
iaUr
ugua
yKy
rgyz
Rep
.Hu
ngar
yBe
laru
sFY
R M
aced
onia
Ukra
ine
Mol
dova
Peru
Hong
Kon
g SA
RAu
stra
liaKa
zakh
stan
Mon
golia
Mex
ico
Turk
eyPo
land
Azer
baija
nEg
ypt
Cypr
usCz
ech
Rep.
Russ
iaCh
ileSp
ain
Braz
ilIn
done
sia
Jord
anSa
udi A
rabi
aIn
dia
Icel
and
Phili
ppin
esSo
uth
Afric
aIs
rael
Colo
mbi
aTh
aila
ndAr
gent
ina
Mal
aysi
aSl
oven
iaSw
itzer
land
Latv
iaUn
ited
King
dom
Chin
a
0
10
20
30
40
50
60
70
80
90
100
2014 or latest figures 2007
Client demand Funding Perceived risk Perceived risk Client demand Funding0
10
20
30
40
50
60
Increase Decrease
Change in share of foreign currency lending

18 TRANSITION REPORT 2015-16REBALANCING FINANCE
CHAPTER 1: REBALANCING FINANCE AND BOOSTING INVESTMENT
as perceived by risk managers and regulators (see Chart 1.8). Funding conditions also play a role, particularly in encouraging dollarisation.
Firms and households may continue to demand foreign currency credit that appears to be cheaper as they often fail to take into account the high costs of servicing foreign currency debt when domestic currency depreciates. This creates negative externalities for the economy as a higher debt burden, following depreciation of the local currency, leads to weaker aggregate demand which in turn makes it even harder for firms to service their obligations. Reducing the dollarisation of lending in the region may therefore require a more proactive stance by regulators, as well as the fine-tuning of risk management practices within banks. It also requires an established track record of sound macroeconomic policies, which will help to anchor the inflation expectations of both lenders and borrowers.20
A shift from private to public debtPrivate-sector deleveraging is often accompanied by an increase in government debt. As private firms reduce their leverage, they cut investment and employment, thus reducing aggregate demand in the economy. Reduced demand for their products may force firms to deleverage more, creating a vicious circle of deleveraging and falling demand. In fact, there is evidence that leverage amplifies the effect of economic crises on employment and investment.21 Governments then frequently step in to boost demand and create more accommodative conditions for deleveraging – often at the cost of higher public debt. In some instances, governments may also be called upon to directly bail out financial institutions or large companies. These bailouts are also often financed – either directly or indirectly – by public debt.
In most countries in the region, both public and private-sector debt levels increased over the period 2007-14 (see red arrows in Chart 1.9). In almost all countries where private debt-to-GDP ratios did decline, public debt increased. The only exception was the Kyrgyz Republic, which benefited from a partial write-off of its debt owed to Russia. In fact, in almost all of those countries, public debt increased by more than private debt declined (see orange arrows), sometimes by a large margin (particularly in Slovenia and Latvia). Only in Egypt, Jordan and Lithuania did the shift from private to public debt result in an overall reduction in the level of debt (see green arrows).
Furthermore, in some countries where debt levels were relatively modest at the start of the 2008-09 crisis, policy responses included measures to encourage credit growth. This helped to boost aggregate demand in the economy in the short term but potentially with the effect of increasing vulnerabilities in the longer term. Turkey, for instance, relaxed restrictions on the provision of foreign currency-denominated lending to unhedged borrowers in 2009, subject to certain conditions. The net foreign currency-denominated liabilities of Turkey’s corporate sector have since risen significantly, from around 10 to 20 per cent of GDP (see Chart 1.10). Indeed, Turkey stands out as one of only two countries in the region where public debt has declined since 2007 but private debt has increased significantly (see purple arrows in Chart 1.9).
20 See Zettelmeyer et al. (2010) for a discussion of this issue.21 See, for instance, Sharpe (1994) and Chodorow-Reich (2014).
CHART 1.9. Changes in levels of public and private debt as a percentage of GDP, 2007-14
CHART 1.10. Net foreign currency-denominated liabilities of Turkey’s corporate sector as a percentage of GDP
Source: IMF, national authorities via CEIC Data, BIS and authors’ calculations.Note: Selected countries. Data comprise public debt, domestic private-sector debt and external debt of non-financial companies. The initial observation for Kosovo relates to 2009.
Source: Central Bank of Turkey, IMF World Economic Outlook and authors’ calculations.
Private debt (per cent of GDP)
Publ
ic d
ebt (
per c
ent o
f GDP
)
ALB
ARM
AZE
BELGEO
CROHUN
KOS
MOR
FYR
MNG
MON
POL
RUS
SER
SVKTUN
UKR
KAZ
BOS
BUL
EST
LAT
SLO
MDA
ROM
EGY JOR
LIT
KGZ
TJKTUR
0 10 20 30 40 50 60 70 80 90 100 110 120 1300
10
20
30
40
50
60
70
80
90
100
2002
2003
2004
2005
2006
2007
2008
2009
2010
2011
2012
2013
2014
Apr 2
015
-40
-30
-20
-10
0
10
20
Assets Net foreign exchange positionLiabilities

19
22 See IMF (2015a).23 See also Laryea (2010).
CHART 1.11. Initial debt levels and NPLs
CHART 1.12. NPLs and increases in domestic private debt-to-GDP ratios
Source: IMF, national authorities via CEIC Data, BIS and authors’ calculations.Note: National definitions of NPLs may vary.
Source: IMF, national authorities via CEIC Data, BIS and authors’ calculations. Note: National definitions of NPLs may vary.
The overhang of NPLsThe prevalence of NPLs in the region is another factor that helps to explain how rising levels of debt co-exist with low investment levels and restrictive credit constraints. In fact, the removal of NPLs from the balance sheets of banks and companies can create space for the growth of new credit. In this case, the provision of fresh credit to the economy need not result in significant increases in overall levels of indebtedness, provided that NPLs are written off.
Seven years after the crisis began, NPL ratios (that is to say, NPLs as a percentage of total loans) remain above 15 per cent in many countries in the SEE region, as well as Kazakhstan and Ukraine (see the Macroeconomic Overview for a more detailed discussion of this issue). More generally, countries in the region where the EBRD invests are among those with the highest NPL ratios worldwide (see Chart 1.11). Indeed, of the 25 countries with the highest average NPL levels (as a percentage of GDP) during the post-crisis period, 16 are from emerging Europe or Central Asia.
On average, higher initial levels of indebtedness at the time of the global financial crisis are associated with higher subsequent levels of NPLs (both relative to the total stock of loans and relative to the country’s GDP; see Chart 1.11). This relationship holds across a sample of more than 100 countries worldwide and is especially pronounced in the region where the EBRD invests.
Although the overall ratio of corporate debt to GDP in central and south-eastern Europe may not be too high, as Chart 1.11 suggests, outstanding debt has a disproportionate tendency to be owed by firms with poor cash flows and/or low levels of equity capital. This concentration of debt in firms with poor liquidity and solvency indicators is greater in parts of the transition region than, for instance, in southern Europe.22 As a result, even as firms’ average profitability has improved, NPL levels have continued to rise.
Higher levels of NPLs are, in turn, associated with weaker subsequent growth in domestic credit to the private sector (see Chart 1.12 and Chapter 2). Furthermore, high NPL levels are associated with weak investment, both across a large sample of developed and developing countries and within the specific region where the EBRD invests (see Box 1.2 for a discussion on how rising NPLs and weaker growth can reinforce each other in a vicious circle).
Thus, removing NPLs from the balance sheets of banks and companies could help to reinvigorate credit growth while achieving overall private-sector deleveraging – thereby making more funds available to finance investment. In order to effectively deal with overhangs of NPLs, countries must: (i) tighten provisioning requirements and eliminate forbearance; (ii) facilitate out-of-court restructuring and simplify bankruptcy procedures for firms; (iii) avoid unfavourable tax treatment of NPL write-offs; and (iv) develop a market for NPLs involving specialist asset management companies (see also Box 1.2).23
3 to 4PERCENTAGE POINTS OF GDPINVESTMENT DEFICIT IN CENTRAL AND SOUTH-EASTERN EUROPE RELATIVE TO SIMILAR ECONOMIES ELSEWHERE
Total debt as a percentage of GDP, 2009
Aver
age
NPL-
to-G
DP ra
tio, 2
009-
14 (l
og)
EBRD region Rest of the world
0 50 100 150 200 250 300 350 4000.2
0.4
1
2
4
10
20
40
100
200
NPLs as a percentage of GDP, 2009 (log)
Chan
ge in
dom
estic
priv
ate
debt
-to-G
DP
ratio
, 20
09-1
4 (p
erce
ntag
e po
ints
)
0.4 1.0 6.0 20.0-60
-40
-20
0
20
40
60
EBRD region Rest of the world

20 TRANSITION REPORT 2015-16REBALANCING FINANCE
CHAPTER 1: REBALANCING FINANCE AND BOOSTING INVESTMENT
Long-term debt levels tend to be higher where creditors’ rights are better protected;29 this effect appears to be particularly strong in the case of household debt. Superior institutions – resulting in reduced incidence of corruption as captured by the World Bank’s Worldwide Governance Indicators – are associated with higher levels of domestic corporate and household debt but lower levels of government debt. A higher labour-to-national-income ratio is associated with higher levels of household credit, as households are in a better position to service debt. It is also associated with higher levels of corporate debt, as firms’ retained earnings (an alternative source of financing) are lower. Corporate debt also tends to be lower where labour markets are less rigid, as firms enjoy greater flexibility when it comes to investment and hiring decisions and need to borrow less during downturns.30 More favourable demographic conditions – such as a larger working population as a percentage of the total population – are associated with lower levels of government debt, as are abundant natural resources. In addition, firms in countries with greater openness to trade tend to have higher levels of credit – both domestic and external.
Debt before the crisisOnce all of these factors have been taken into account, the residuals in the regressions provide estimates of economies’ over-indebtedness or under-indebtedness, controlling for various macroeconomic and societal characteristics explaining economies’ ability to service debt. Chart 1.13 plots an average measure of over-indebtedness in the region (as a percentage of GDP), showing the contribution made by each component of the total stock of debt. Negative values denote under-indebtedness. As the Transition Report 2006 showed, prior to the onset of the financial crisis most economies in the region had aggregate debt levels that were below what would be expected on the basis of the experience of other emerging markets (particularly in the case of household debt, but also in the case of domestic corporate debt).
In this regard, the severity of the crisis in the region and the subsequent increase in NPLs reflects not so much the overall levels of debt as the very strong credit growth in the mid-2000s, which was accompanied by the relaxation of underwriting standards, heavy reliance on parent bank funding and large amounts of debt denominated in foreign currency.
That said, a number of countries appear to have been significantly overleveraged relative to their economic fundamentals in 2007, including Bulgaria, Moldova, Mongolia and Kazakhstan. All of these countries saw major banks fail in subsequent years.
Relative over-indebtedness today varies greatly across countriesDespite significant increases in debt-to-GDP ratios since 2007, debt levels in the region were still lower, on average, than those of other emerging market economies with similar characteristics in 2014 (see Chart 1.14). Those differences were explained almost entirely by the significantly lower levels of household debt and domestic corporate debt; levels of public debt were broadly in
Debt sustainability and the composition of debt from an international perspectiveRising debt levels, both globally and within the region where the EBRD invests, are also partly a reflection of the policy choices made in the post-crisis environment, which have encouraged consumption at the expense of savings. If investment were to be increased significantly and financed by fresh credit, this could cause an even faster accumulation of debt. Given that debt was to blame for the severity of the 2008-09 crisis, a growth strategy relying on rapid increases in debt could lay the foundations for another major crisis. The seriousness of this concern depends, in part, on the extent to which the region already holds excessive debt today.
Determinants of debt levelsThe question of whether a certain level of debt is sustainable is commonly asked with respect to public debt or external debt.24 In the case of public debt, the concern is whether a government’s future tax receipts (and any revenues from privatisation) are sufficient to service its obligations. Likewise, a country’s future goods and services export and interest payment receipts may or may not be sufficient to service its liabilities in relation to external creditors. A similar question can be asked more broadly with respect to an economy’s entire stock of debt – that is to say, whether the future income streams of firms and households are likely to be sufficient to service their obligations. In particular, high levels of aggregate debt make firms and households more vulnerable to changes in asset prices. Indeed, when leverage is high, even small fluctuations in asset prices can result in negative equity (that is to say, situations where gross liabilities to creditors exceed the value of assets held by firms and households).
The assessment of the overall level of debt depends on various country-level characteristics that make it easier – or more difficult – for households, companies and the government to service their debts. For instance, debt-to-GDP ratios tend to be higher over the longer term in countries with higher per capita income and superior economic institutions.25 In this regard, the Transition Report 2006 noted that levels of private-sector debt in the region were significantly lower than the region’s income levels would imply.26
With this in mind, this section looks at levels and determinants of public debt, corporate debt (domestic and external) and household debt across a sample of more than 70 developed and developing countries over the period 2005-14.27 In each case, the ratio of debt to GDP is explained by a number of economic variables, including the level of income, the quality of economic institutions, the flexibility of labour markets, openness to trade, the average rate of inflation and an index of creditor rights. The analysis focuses on each country’s macroeconomic and demographic characteristics but does not cover elements of the structure of each country’s banking system that may affect access to credit (which are discussed in Chapter 2).
The results confirm that richer countries tend to have higher debt-to-GDP ratios. Macroeconomic instability, which is reflected in higher average inflation rates, is associated with significantly lower levels of domestic corporate debt.28
24 See Brown and Lane (2011) for a discussion with respect to the transition region.25 See Djankov et al. (2007).26 EBRD (2006). 27 This is based on available data for these four components of debt. To the best of our knowledge, this
is the broadest dataset that has ever been used to study the separate determinants of household and corporate debt.
28 See Dehesa et al. (2007) for a discussion of this issue.29 See, for instance, Aghion and Bolton (1992).30 In the presence of inflexible labour markets, firms may be forced, for instance, to hoard labour and
disproportionately cut investment during downturns (see Sharpe, 1994). Labour market flexibility is captured by the Fraser Institute’s index of labour market regulations.

21
line with those observed elsewhere. As in 2007, levels of external corporate debt were, if anything, somewhat higher than countries’ economic characteristics would suggest, mirroring the weaker than expected supply of domestic credit to companies.
On balance, analysis suggests that in a number of countries there appears to be substantial scope for increasing domestic corporate debt (Chart 1.15). There is also some room to increase household debt, although evidence strongly suggests that domestic credit to firms has a much greater bearing on economies’ growth prospects than credit to households.31 The countries that appear to have the greatest scope to increase domestic corporate debt are Slovenia, Poland, Estonia, Lithuania, the Slovak Republic, Croatia, Bosnia and Herzegovina, Georgia and Egypt. In other countries, the estimated scope for growth in domestic corporate debt-to-GDP ratios is smaller or even negative. Here, credit growth would be dependent on improvements in fundamental factors determining countries’ ability to sustain debt (such as the quality of institutions), as well as structural shifts in the financial sector (as discussed in Chapter 2), including those related to cross-border deleveraging by parent banks with subsidiaries in the region.
Equity finance: an alternative to growing indebtednessThis analysis suggests that debt can play a role in financing the region’s investment needs but only up to a point, as a continued rise in the total level of debt will raise concerns about its sustainability. Both the quantity and the quality of debt matter for its sustainability. The successful resolution of the overhang of NPLs could free up space for additional debt financing; shifts
31 See Beck et al. (2012). Mian et al. (2015) find that increasing household debt may actually have a negative effect on growth, at least in advanced economies.
CHART 1.13. Estimated regional under-indebtedness in 2007 as a percentage of GDP
CHART 1.15. Relative over-indebtedness in 2014
CHART 1.14. Estimated regional under-indebtedness in 2014 as a percentage of GDP
Source: IMF, national authorities via CEIC Data, BIS and authors’ calculations. Note: A negative sign reflects under-indebtedness relative to global comparators. Weighted averages across the region where the EBRD invests, based on coefficients for dummy variables for the region. The model is estimated as a system of seemingly unrelated regression equations.
Source: IMF, national authorities via CEIC Data, BIS and authors’ calculations.
Source: IMF, national authorities via CEIC Data, BIS and authors’ calculations.Note: A negative sign reflects under-indebtedness relative to global comparators. Weighted averages across the region where the EBRD invests based on coefficients for dummy variables for the region. The model is estimated as a system of seemingly unrelated regression equations.
Total debt
Externalcorporate debt
Domesticcorporate debt
Household debt
Government debt
-25 -20 -15 -10 -5 0 5
Total debt
External corporate debt
Domestic corporate debt
Household debt
Government debt
-35 -30 -25 -20 -15 -10 -5 0 5
Estim
ated
ove
r-ind
ebte
dnes
s in
201
4 (p
er c
ent o
f GDP
)
MON UK
R
KGZ
MNG AZ
E
KAZ
EGY
CRO
MOR TJ
K
MDA AL
B
ARM
SER
BUL
FYR
HUN
GEO
EBRD RU
S
ROM
TUR
BOS
POL
SVK
LAT
SLO
EST
LIT-120
-100
-80
-60
-40
-20
0
20
40
60
80
100
Government debt Household debt Domestic corporate debt External corporate debt Total debt

22 TRANSITION REPORT 2015-16REBALANCING FINANCE
CHAPTER 1: REBALANCING FINANCE AND BOOSTING INVESTMENT
towards local currency financing could make debt less risky; and in some countries there is additional scope to increase domestic corporate debt. On balance, however, the region also needs to look beyond debt financing and make better use of equity instruments if it is to increase investment.
Equity enables investors and financiers to share the upside and downside risks associated with investment projects more evenly. It plays a particularly important role in industries where firms cannot easily provide collateral against loans.32 In addition to financing, equity may also result in non-financial benefits such as higher standards of corporate governance and transparency (see Chapter 3).
A number of policies can help both to boost domestic savings and accelerate the development of domestic equity markets. Pension reform can strengthen individuals’ incentives to save for retirement and catalyse the development of pension funds – institutional investors with a long-term approach. Policies supporting the development of capital markets from the supply side (such as simplified listing procedures for SMEs) and the demand side (such as favourable tax treatment for investment income) can also play an important role. And rationalising government spending can boost public savings – the differencebetween tax receipts and current expenditure such as public-sector wages.33 Increasing domestic savings is the only wayof meeting an economy’s rising investment needs without exacerbating external imbalances.
Besides increases in domestic savings, additional equity investment can also come from abroad in the form of private equity, allocations by international institutional investors or FDI. Private equity can bring in managerial expertise, help to strengthen corporate governance and play a particular role in supporting change in firms (aspects that are discussed in more detail in the last two chapters of this report). FDI, meanwhile, can also support the transfer of skills and technologies, help companies gain access to foreign markets and facilitate development of cross-border economic linkages.34
FDI: diversifying sources of financeChart 1.1 showed that FDI played a particularly important role in financing overall investment in the region prior to the crisis. However, flows of inward FDI have declined substantially since 2008, particularly in the CEB and SEE regions, reflecting the depth of the crisis in the advanced European economies that have been historically the main providers of FDI to the region. With this in mind, the next section examines whether FDI in the region has been too low after the crisis. It also looks at the various sources of FDI in the region and their potential for diversification. Inward FDI in the region where the EBRD invests totalled on average 20 to 25 per cent of the value of economies’ gross capital formation in recent years. At first glance, sources of FDI in the region where the EBRD invests appear to remain strongly concentrated. Even in the post-crisis environment, the EU-15 economies account for around 60 per cent of total FDI inflows in the EBRD’s countries of operations, according to UNCTAD data.35 Other advanced economies, including the United States, Canada and Japan, account for a further 15 per cent.
32 See Berger and Udell (1998).33 See Loayza et al. (2000) for a discussion of this issue.34 See Moran (2007) for details of examples.
TABLE 1.2. Determinants of global bilateral investment flows, 2008-12
Bilateral FDI (log)
Dependent variable (1) (2) (3)
Distance (log) -0.130*** -0.119*** -0.133***
(0.0445) (0.0442) (0.0446)
Common border 1.068*** 0.946*** 1.088***
(0.164) (0.169) (0.164)
GDP per capita at destination (log) 0.135** 0.178*** 0.183***
(0.0678) (0.0582) (0.0571)
GDP per capita at origin (log) 0.169*** 0.173** 0.187***
(0.0584) (0.0675) (0.0671)
Population at destination (log) 0.401*** 0.336*** 0.343***
(0.0804) (0.0720) (0.0710)
Population at origin (log) 0.322*** 0.455*** 0.461***
(0.0727) (0.0800) (0.0797)
Common language 0.651*** 0.648*** 0.640***
(0.134) (0.135) (0.134)
Colonial ties 0.328** 0.316** 0.390**
(0.159) (0.158) (0.155)
Control of corruption at destination 0.541*** 0.151*** 0.0948
(0.0392) (0.0582) (0.0580)
Control of corruption at origin 0.335*** 0.481*** 0.370***
(0.0372) (0.0398) (0.0431)
Control of corruption, origin*destination
0.170*** 0.211***
(0.0367) (0.0366)
From the entire world -0.459*** -0.461***
(0.102) (0.101)
From EU-15 0.00808
(0.124)
From other advanced economies -0.391*
(0.202)
Within the EBRD region -1.375***
(0.156)
From China -0.207
(0.412)
From other emerging markets -0.929***
(0.330)
Observations 7,291 7,291 7,291
R2 0.256 0.261 0.271
35 Systematic cross-country data on bilateral investment flows are limited, largely owing to the difficulty of identifying and consistently reporting the country of origin. Substantial discrepancies exist between key datasets, such as those compiled by Eurostat, the Organisation for Economic Co-operation and Development and the United Nations Conference on Trade and Development (UNCTAD), as reported in the Investment Map database. Unlike the other datasets, UNCTAD covers all countries.
Source: UNCTAD and authors’ calculations. Note: Estimated using pooled ordinary least squares with clustered standard errors. All regressions include a constant and fixed time effects. Robust standard errors are provided in parentheses. ***, ** and * denote values significant at the 10, 5 and 1 per cent levels respectively.
23
FDI flows from elsewhere in the region account for around 20 per cent of total inward investment and around 5 per cent of FDI comes from other emerging markets, including China, India and Brazil (“south-south flows”).
Have FDI flows to the EBRD region been low by international standards during the post-crisis period? And should we expect sources of FDI to become more diverse? To see how the current cross-border investment and its composition compare with what could be expected on the basis of the economic sizes and other characteristics of the respective regions, we can use a standard gravity model of FDI. In a gravity setting, aggregate investment from a given source country to a given destination is explained by the size of the two economies (in terms of population), their level of development (in terms of income per capita), the distance between the two countries and a number of other variables. Table 1.2 summarises the results of a simple gravity model of investment estimated for a large sample of developed and developing countries using UNCTAD data for the period 2008-12.
These results confirm that bilateral investment flows are strongly dependent on the size and income levels of both the source economy and the destination economy. Bilateral investment flows increase by an average of more than 90 per cent if countries share a border. Other measures of proximity also matter: a common language increases investment by around 65 per cent, while a common colonial history adds 30 to 40 per cent to investment flows (even after a common language has been taken into account).
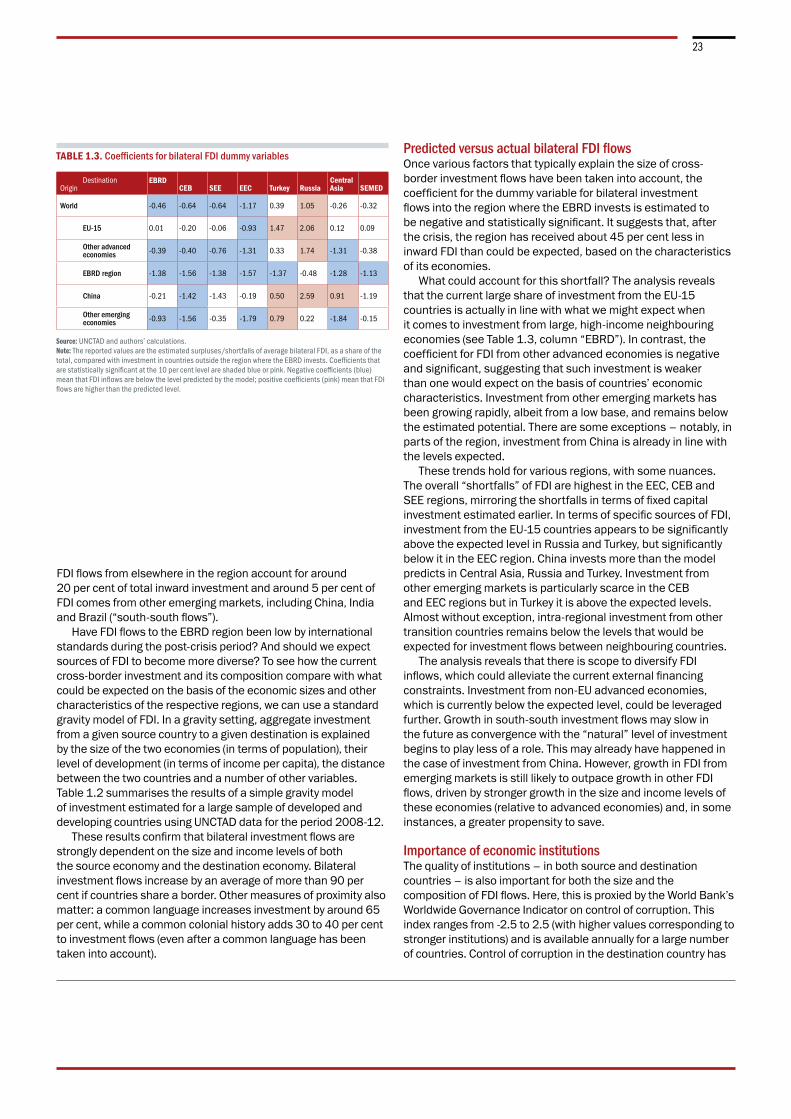
Predicted versus actual bilateral FDI flowsOnce various factors that typically explain the size of cross-border investment flows have been taken into account, the coefficient for the dummy variable for bilateral investment flows into the region where the EBRD invests is estimated to be negative and statistically significant. It suggests that, after the crisis, the region has received about 45 per cent less in inward FDI than could be expected, based on the characteristics of its economies.
What could account for this shortfall? The analysis reveals that the current large share of investment from the EU-15 countries is actually in line with what we might expect when it comes to investment from large, high-income neighbouring economies (see Table 1.3, column “EBRD”). In contrast, the coefficient for FDI from other advanced economies is negative and significant, suggesting that such investment is weaker than one would expect on the basis of countries’ economic characteristics. Investment from other emerging markets has been growing rapidly, albeit from a low base, and remains below the estimated potential. There are some exceptions – notably, in parts of the region, investment from China is already in line with the levels expected.
These trends hold for various regions, with some nuances. The overall “shortfalls” of FDI are highest in the EEC, CEB and SEE regions, mirroring the shortfalls in terms of fixed capital investment estimated earlier. In terms of specific sources of FDI, investment from the EU-15 countries appears to be significantly above the expected level in Russia and Turkey, but significantly below it in the EEC region. China invests more than the model predicts in Central Asia, Russia and Turkey. Investment from other emerging markets is particularly scarce in the CEB and EEC regions but in Turkey it is above the expected levels. Almost without exception, intra-regional investment from other transition countries remains below the levels that would be expected for investment flows between neighbouring countries.
The analysis reveals that there is scope to diversify FDI inflows, which could alleviate the current external financing constraints. Investment from non-EU advanced economies, which is currently below the expected level, could be leveraged further. Growth in south-south investment flows may slow in the future as convergence with the “natural” level of investment begins to play less of a role. This may already have happened in the case of investment from China. However, growth in FDI from emerging markets is still likely to outpace growth in other FDI flows, driven by stronger growth in the size and income levels of these economies (relative to advanced economies) and, in some instances, a greater propensity to save.
Importance of economic institutionsThe quality of institutions – in both source and destination countries – is also important for both the size and the composition of FDI flows. Here, this is proxied by the World Bank’s Worldwide Governance Indicator on control of corruption. This index ranges from -2.5 to 2.5 (with higher values corresponding to stronger institutions) and is available annually for a large number of countries. Control of corruption in the destination country has
TABLE 1.3. Coefficients for bilateral FDI dummy variables
Source: UNCTAD and authors’ calculations.Note: The reported values are the estimated surpluses/shortfalls of average bilateral FDI, as a share of the total, compared with investment in countries outside the region where the EBRD invests. Coefficients that are statistically significant at the 10 per cent level are shaded blue or pink. Negative coefficients (blue) mean that FDI inflows are below the level predicted by the model; positive coefficients (pink) mean that FDI flows are higher than the predicted level.
DestinationOrigin
EBRDCEB SEE EEC Turkey Russia
Central Asia SEMED
World -0.46 -0.64 -0.64 -1.17 0.39 1.05 -0.26 -0.32
EU-15 0.01 -0.20 -0.06 -0.93 1.47 2.06 0.12 0.09
Other advanced economies -0.39 -0.40 -0.76 -1.31 0.33 1.74 -1.31 -0.38
EBRD region -1.38 -1.56 -1.38 -1.57 -1.37 -0.48 -1.28 -1.13
China -0.21 -1.42 -1.43 -0.19 0.50 2.59 0.91 -1.19
Other emerging economies -0.93 -1.56 -0.35 -1.79 0.79 0.22 -1.84 -0.15

24 TRANSITION REPORT 2015-16REBALANCING FINANCE
CHAPTER 1: REBALANCING FINANCE AND BOOSTING INVESTMENT
investment relationships may, in turn, help improve business practices, corporate governance and the quality of management, eventually leading to positive feedback regarding the quality of domestic institutions. This could give rise to a virtuous circle of institution building. The opposite scenario (that is to say, a vicious circle of deteriorating institutions) is also a possibility.
ConclusionThe financing landscape in the transition region has evolved substantially since the 2008-09 crisis. Prior to the crisis, the booming – and in some cases, overheating – financial sector was a key driving force behind the high levels of investment and growth. However, this also led to large and widening external imbalances. The crisis resulted in a swift external adjustment, bringing domestic investment into line with the (predominantly low) levels of domestic savings. The withdrawal of funds by cross-border banks followed and banking systems gradually started relying more on domestic sources of finance.
Despite the decline in investment levels, the region’s overall indebtedness has continued growing at approximately the same rate as before the crisis. This reflects several factors: (i) the much weaker growth in nominal GDP since the crisis; (ii) the revaluation of the large proportion of debt that is denominated in foreign
a significant impact on bilateral investment, as does control of corruption in the investment’s country of origin (see column 2 of Table 1.2).
The marginal impact that improving institutions has on bilateral investment flows may also depend on the quality of institutions in the partner country.36 To investigate this possibility, regressions in column 3 of Table 1.2 include an interaction term between control of corruption in the country of origin and control of corruption in the country of destination.
The results suggest that the quality of institutions in the country of origin does indeed matter. If a country of origin has relatively strong institutions (for example, a score of 0.5, as in the case of Poland or South Korea), a 1-standard-deviation improvement in the destination country’s control of corruption leads to an increase of around 30 per cent in bilateral investment flows. If a source country’s control of corruption is relatively weak (for example, a score of -0.5, as in the case of China or Russia), a 1-standard-deviation improvement in the destination country’s control of corruption leads to an increase of only around 15 per cent.
In other words, institutional improvements help attract more investment from countries with better institutions, while investment from countries with weak institutions may be unaffected or increase only slightly. This rebalancing of
36 See Belgibayeva and Plekhanov (2015) for a detailed discussion.37 See IMF (2014). 38 See McKinsey Global Institute (2013).
39 See Wagenvoort et al. (2010) and Kravets (2013).40 See Bhattacharya et al. (2012).
BOX 1.1. BOOSTING INVESTMENT IN INFRASTRUCTURE
Despite the importance of infrastructure for economic growth,37 data are not systematically collected for either private or public investment in infrastructure. However, the snapshots that are provided by available data suggest that the countries where the EBRD invests have underspent on infrastructure over the last two decades. Annual investment in economic infrastructure (including roads, railways, ports, airports, power, water and telecommunications) averaged 3.3 per cent of GDP in the period 1992-2011.38 While this exceeds the 2.6 per cent of GDP that was recorded in advanced EU countries and the United States during that period, it is substantially lower than the investment levels observed in emerging markets such as China (8.5 per cent of GDP) and India (4.7 per cent of GDP).
Cross-country comparisons are further complicated by differences in cost-effectiveness and the targeting of infrastructure across countries. Infrastructure projects with poor economic justification may inflate headline infrastructure spending figures, without making a sizeable contribution to economic growth. Furthermore, estimates of infrastructure spending often exclude social infrastructure relating to health care and education. When such social infrastructure is taken into account, total infrastructure spending in the new EU member states averaged 4.3 per cent of GDP in the period 2003-14 according to Eurostat estimates – still a modest figure.
Information about the stock of infrastructure is also scarce. The World Economic Forum estimates the quality of infrastructure on a scale of 1 to 7. Estimates for the EBRD region vary greatly, from 5.2 in Cyprus (whichis ranked 30th in the world) to 2.9 in Egypt (which is ranked 125th).
Increasing investment in infrastructure presents significant challenges. Currently, the majority of infrastructure investment in the region comes from public budgets. The limited data available suggest that in many transition countries 60 to 70 per cent of infrastructure is government-financed, compared with between 15 and 60 per cent in the EU-15 economies. Indeed, in some transition countries the government’s share exceeds 90 per cent.39 Given the tight fiscal constraints in many countries and the rapidly rising public debt levels, public resources may, in many cases, be insufficient to pay for additional infrastructure.
Consequently, substantial funding needs to come from private sources and be delivered through mechanisms that involve the private sector, such as public-private partnerships. In addition, capital markets can be used to channel the large and growing pool of global savings into debt and equity financing for infrastructure, which offers stable returns in the long term.40 This may improve the exit prospects of dedicated infrastructure equity funds, thereby catalysing the development of this type of infrastructure financing.
Lastly, the key policy challenge is to build an institutional environment that helps to deliver infrastructure at a lower cost and sustain efficiency gains over time. Improvements in the overall quality of governance that reduce corruption and strengthen the rule of law can help to reduce the cost of infrastructure. Improvements in technical skills as regards the evaluation, preparation and implementation of infrastructure projects can help to improve the prioritisation of projects and help to design better maintenance contracts for existing infrastructure.

25
BOX 1.2. FRESH MOMENTUM IN THE RESOLUTION OF THE NPL PROBLEM
Following the end of the credit boom in central and south-eastern Europe, banking systems have become burdened with a large overhang of NPLs. Rising NPLs can strangle credit supply and trap collateral in firms where excessive leverage and dysfunctional relationships with creditors prevent effective restructuring. As the economy stagnates, the NPL problem then perpetuates itself. Within banks, the prevalence of NPLs raises funding costs and reduces operational efficiency. This pattern is often observed when a financial sector contracts and economic growth stagnates. Indeed, a large number of countries in the region experienced sharp increases in NPLs in the early years of the transition process and in the aftermath of the Russian crisis of 1998.
And yet, in 2010 the region’s laws and institutions were still largely incapable of effectively dealing with the problem of NPLs. Legal frameworks governing restructuring and insolvency suffered from uncertainty, which was exacerbated by capacity constraints in the judiciary. Private creditors lacked experience of restructuring viable but overleveraged companies. Standards governing the classification of loan quality differed widely and supervisors were initially reluctant to enforce requirements of broader provisioning.
Since then, some economies in the region have taken steps to address the NPL problem. The Baltic states, for example, have seen a sizeable reduction in NPLs over the last four years, following the very sharp increases observed between 2008 and 2010. Slovenia reformed its legal framework governing restructuring in 2013 and has established an asset management company, into which banks (primarily state-owned banks) have transferred distressed assets. Meanwhile, Hungary has made efforts to reduce NPLs arising from foreign currency-denominated household lending by requiring that such loans be converted to domestic currency (albeit levels of corporate NPLs remain high).
Progress with the reduction of NPLs may be accelerating. The European Central Bank’s (ECB’s) asset quality review and stress tests for
the largest banks in the eurozone (the results of which were published in October 2014) have resulted in a substantial upward correction of loan provisions, which have increased by €136 billion. This correction stems largely from the application of the new common methodology for loan classification, forbearance and provisioning developed by the European Banking Authority. Now that the ECB has taken on its new supervisory role within the eurozone, it will increasingly encourage the enforcement of stricter standards for loan classification and provisioning. This will directly affect all banks with a balance sheet in excess of €30 billion, which includes most banking groups that operate in the transition region.
EU regulators in the host countries of bank subsidiaries will apply this methodology for regulatory reporting, and regulators with close links to the EU may increasingly do so as well. Over time, this may be reflected in banks’ own financial reporting. Banks, in turn, are likely to become more proactive when it comes to provisioning and portfolio sales. In Romania, for example, such transactions considerably reduced NPL levels in 2014. This may mark the beginning of a broader trend.
There has also been encouraging progress (in Serbia and Slovenia, for instance) with the reform of frameworks governing private restructuring. However, this will only succeed if there is greater certainty surrounding the court-led restructuring and insolvency process, as well as sufficient capacity within the judiciary and among insolvency professionals to handle the substantial caseload.
Specialist state-owned asset management companies (such as the one established in Slovenia) can accelerate corporate restructuring, although ownership transfers for distressed assets will be subject to constraints safeguarding competition within the banking sector. There is generally a need for governments to coordinate the resolution of systemic NPL problems, bringing together the financial sector, banking supervisors and tax authorities. While measures to reduce NPLs may be associated with certain fiscal costs in the short term, in the longer term reviving financial intermediation and corporate investment will support growth and fiscal revenues.
currency; (iii) the significant increase in public debt that has accompanied private-sector deleveraging; and (iv) the fact that NPLs have weighed heavily on banks’ balance sheets. Despite those increases in the total level of debt, in some economies (particularly in the CEB and SEE regions) the ratio of domestic corporate debt to GDP remains below the level that would be expected on the basis of those countries’ per capita income, economic institutions and other relevant characteristics. In other countries, scope for increasing debt appears to be much more limited.
Thus, providing funding for investment presents a major challenge. Indeed, the region has significant investment financing needs, estimated at an extra US$ 75 billion or so per year. In order to effectively meet these needs, financing must be rebalanced. Rebalancing finance is not just about making banks safer – an area where significant progress has been made since
the crisis (see Box 1.3). It is also about ensuring that investment needs are met in full, thereby allowing growth and income convergence to continue.
The rest of this report looks in greater detail at how this challenge can be met through the use of both debt and equity financing. The next chapter looks at the challenges of meeting SMEs’ demand for credit in the post-crisis environment. At the same time, an important element of the overall strategy is the increased use of equity products and the diversification of sources of FDI. The last two chapters look in greater detail at the role of equity and equity markets as sources of financing. They examine a particular type of equity financing – private equity – and the non-financial benefits that it may provide. More broadly, measures to encourage domestic savings would help to support a sustainable increase in levels of investment.

26 TRANSITION REPORT 2015-16REBALANCING FINANCE
CHAPTER 1: REBALANCING FINANCE AND BOOSTING INVESTMENT
BOX 1.3. EUROPE’S BANKING UNION AND THE BANKING NETWORKS IN CENTRAL AND SOUTH-EASTERN EUROPE
The global financial crisis underlined the risks of poorly coordinated banking supervision and highlighted the potential vicious circle of banking sector problems and sovereign debt distress. This led to the establishment of Europe’s banking union, which represents a fundamental change in the governance of Europe’s banking sector. This change will profoundly affect the networks of bank subsidiaries in central and south-eastern Europe, both within and outside the EU.41
As a first step, the Single Supervisory Mechanism (SSM) was established by the ECB in November 2014. In principle, the SSM’s powers of supervision cover all credit institutions in participating countries, although initially they are limited to those deemed systemically important. The SSM will be able to draw on the comprehensive asset quality reviews and EU-wide stress tests conducted earlier.
For the SSM to support banking sector stability in the transition region, it will be necessary to facilitate the sharing of early and accurate information with the supervisors of bank subsidiaries in the transition region. In practice, however, complications may arise. In order to access the assessments of supervisors responsible for major EU banking groups, non-EU supervisors will need to conclude confidentiality agreements with the European Banking Authority. A number of these agreements have recently been concluded. The incentives for information sharing may be weak unless the subsidiary is systemically important within the host market and that market is significant from the perspective of the banking group as a whole.
41 See Lehmann and Nyberg (2014) for a detailed discussion.
Effective information sharing may be even more problematic in the case of a cross-border bank in distress, as burden-sharing arrangements have traditionally been unclear. In this respect, the EU’s new Bank Resolution and Recovery Directive requires national authorities to adopt resolution plans for all banks as of 2016 and establishes resolution tools for the purposes of early intervention. In particular, by the time of resolution, minimum bail-in funds need to be in place in each country where a cross-border banking group operates.
Within the eurozone, the Single Resolution Mechanism (SRM) will complement the shared supervision arrangements, ensure the consistency of resolution plans and eventually organise the shared funding of resolutions where banks are subject to SSM supervision.
The centralisation of resolution powers may have certain benefits for non-EU countries where cross-border banking groups operate. As the SRM becomes the sole counterpart establishing crisis management and resolution strategies for key eurozone banks, the transaction costs of supervision for non-EU host countries should decline. The new SRM will internalise potential externalities that could previously have been overlooked – for instance, those resulting from aggressive deleveraging by a subsidiary of a parent bank operating in a different country. Host country supervisors outside the eurozone have thus largely welcomed the stronger and more uniform supervisory procedures. EU countries outside the eurozone can, in principle, opt in to both the SSM and the SRM, although none have yet done so.
The EU’s new member states and its neighbouring countries have benefited from financial integration through international banking networks. The challenge for the new institutions and regulators across emerging Europe will be to preserve these gains.

27
References P. Aghion and P. Bolton (1992) “An Incomplete Contracts Approach to Corporate Bankruptcy”, Review of Economic Studies, Vol. 59, pp. 473-494.T. Beck, B. Büyükkarabacak, F. Rioja and N. Valev (2012)“Who Gets the Credit? And Does It Matter? Household vs. Firm Lending across Countries”,The B.E. Journal of Macroeconomics,Vol. 12, pp. 1-46.A. Belgibayeva and A. Plekhanov (2015)“Does corruption matter for sources of foreign direct investment?”, EBRD Working Paper No. 176. A. Berger and G. Udell (1998)“The economics of small business finance: The roles of private equity and debt markets in the financial growth cycle”, Journal of Banking and Finance, Vol. 22, pp. 613-673.A. Bhattacharya, M. Romani andN. Stern (2012)“Infrastructure for development: meeting the challenge”, policy paper, Centre for Climate Change Economics and Policy and Grantham Research Institute on Climate Change and the Environment.M. Brown and R. De Haas (2012)“Foreign banks and foreign currency lending in emerging Europe”, Economic Policy,Vol. 27, pp. 57-98.M. Brown and P. Lane (2011)“Debt Overhang in Emerging Europe?”, World Bank Policy Research Working Paper No. 5784.G. Chodorow-Reich (2014)“The employment effects of credit market disruptions: Firm-level evidence from the 2008-9 financial crisis”, Quarterly Journal of Economics, Vol. 129, pp. 1-59.R. De Haas, Y. Korniyenko, A. Pivovarsky and T. Tsankova (2015)“Taming the Herd? Foreign Banks, the Vienna Initiative and Crisis Transmission”, Journal of Financial Intermediation, Vol. 24, pp. 325-355.R. De Haas and N. Van Horen (2012)“International Shock Transmission after the Lehman Brothers Collapse: Evidence from Syndicated Lending”, American Economic Review, Vol. 102, pp. 231-237.R. De Haas and I. Van Lelyveld (2006)“Foreign Banks and Credit Stability in Central and Eastern Europe. A Panel Data Analysis”, Journal of Banking and Finance, Vol. 30, pp. 1927-1952.
R. De Haas and I. Van Lelyveld (2014)“Multinational Banks and the Global Financial Crisis: Weathering the Perfect Storm?”, Journalof Money, Credit and Banking, Vol. 46, pp. 333-364.M. Dehesa, P. Druck and A. Plekhanov (2007)“Relative Price Stability, Creditor Rights, and Financial Deepening”, IMF Working Paper No. 07/139.S. Djankov, C. McLiesh and A. Shleifer (2007)“Private Credit in 129 Countries”, Journal of Financial Economics, Vol. 84, pp. 299-329.EBRD (2006)Transition Report 2006: Finance in Transition,London.EBRD (2009)Transition Report 2009: Transition in Crisis?,London.EBRD (2012)Diversifying Russia: Harnessing Regional Diversity, London.EBRD (2013)Transition Report 2013: Stuck in Transition?,London.C. Friedrich, I. Schnabel andJ. Zettelmeyer (2013)“Financial integration and growth – Why is Emerging Europe different?”, Journal of International Economics, Vol. 89, pp. 522-538.IMF (2014)World Economic Outlook, October, Washington, DC.IMF (2015a)“Mind the Credit Gap”, Regional EconomicIssues: Central, Eastern, and Southeastern Europe, May, Washington, DC.IMF (2015b)“Private Investment: What’s the Holdup?”, World Economic Outlook, Chapter 4, April, Washington, DC.O. Kravets (2013)“Infrastructure Investments in Eastern Neighbours and Central Asia (ENCA)”, EIB Working Paper No. 2013/01.T. Laryea (2010)“Approaches to Corporate Debt Restructuring in the Wake of the Financial Crisis”, IMF Staff Discussion Note No. 10/02.A. Lehmann and L. Nyberg (2014)“Europe’s banking union in the global financial system: constructing open and inclusive institutions”, EBRD Working Paper No. 175.A. Levchenko and P. Mauro (2006)“Do Some Forms of Financial Flows Help Protect from Sudden Stops?”, IMF Working Paper No. WP/06/202.
S. Lo and K. Rogoff (2015)“Secular stagnation, debt overhang and other rationales for sluggish growth, six years on”, Bank for International Settlements Working Paper No. 482.N. Loayza, K. Schmidt-Hebbel and L. Serven (2000)“Saving in Developing Countries: An Overview”, World Bank Economic Review, Vol. 14, pp. 393-414.F. Lopez de Silanes, J. McCahery, D. Schoenmaker and D. Stanišić (2015)“The European Capital Market Study”, Duisenberg School of Finance.McKinsey Global Institute (2013)Infrastructure productivity: How to save $1 trillion a year.McKinsey Global Institute (2015)Debt and (not much) deleveraging.A. Mian, A. Su and E. Verner (2015)“Household Debt and Global Growth”, Princeton University working paper. T. Moran (2007)“How to Investigate the Impact of Foreign Direct Investment on Development and Use the Results to Guide Policy”, Brookings Trade Forum, pp. 1-60.K. Murphy, A. Shleifer and R. Vishny (1989)“Industrialization and the Big Push”, Journal of Political Economy, Vol. 97, pp. 1003-1026.M. Schularick and A. Taylor (2012)“Credit booms gone bust: Monetary policy, leverage cycles and financial crises, 1870-2008”, American Economic Review, Vol. 102, pp. 1029-1061.S. Sharpe (1994)“Financial Market Imperfections, Firm Leverage, and the Cyclicality of Employment”, AmericanEconomic Review, Vol. 84, pp. 1060-1074.R. Wagenvoort, C. De Nicola and A. Kappeler (2010)“Infrastructure finance in Europe: Composition, evolution and crisis impact”, EIB Papers, Vol. 15, pp. 16-39.World Bank (2012)Golden Growth: Restoring the Lustre of the European Economic Model, Washington, DC. J. Zettelmeyer, P. Nagy and S. Jeffrey (2010)“Addressing private sector currency mismatches in emerging Europe”, EBRD Working Paper No. 115.