rebecca harrington
TRANSCRIPT
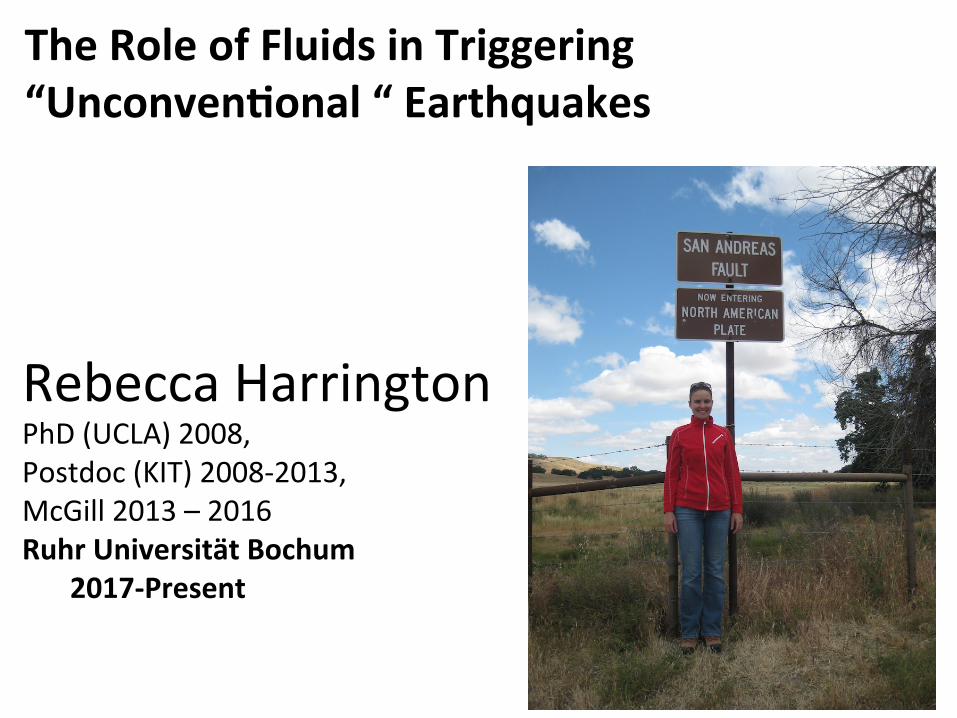
RebeccaHarringtonPhD(UCLA)2008,Postdoc(KIT)2008-2013,McGill2013–2016RuhrUniversitätBochum
2017-Present
TheRoleofFluidsinTriggering“Unconven?onal“Earthquakes
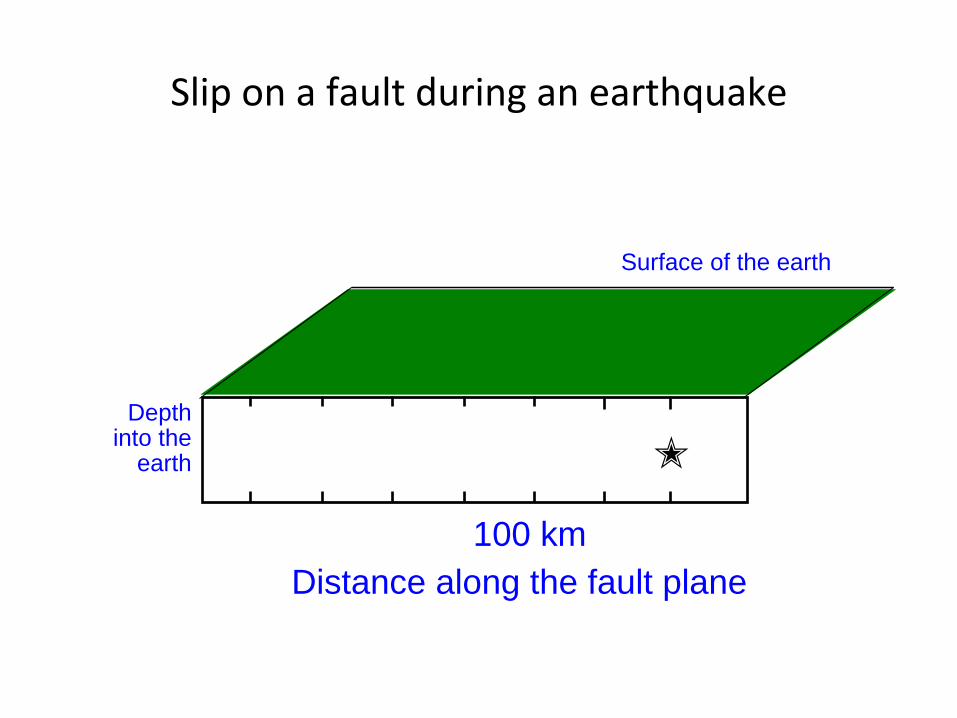
Sliponafaultduringanearthquake
✭Depth
into theearth
Surface of the earth
Distance along the fault plane 100 km
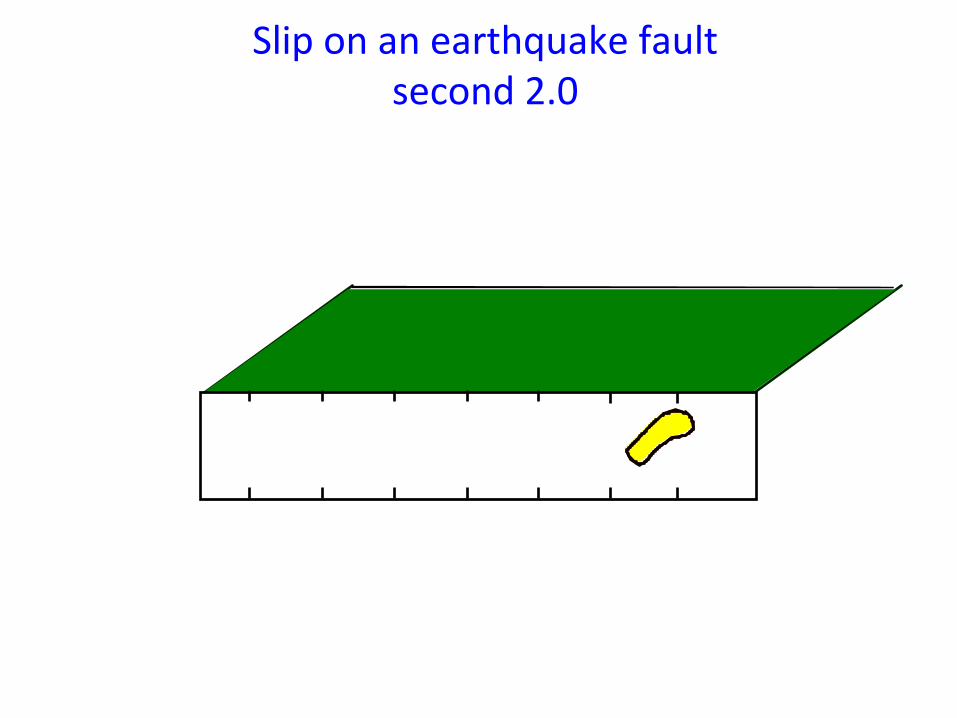
Sliponanearthquakefaultsecond2.0
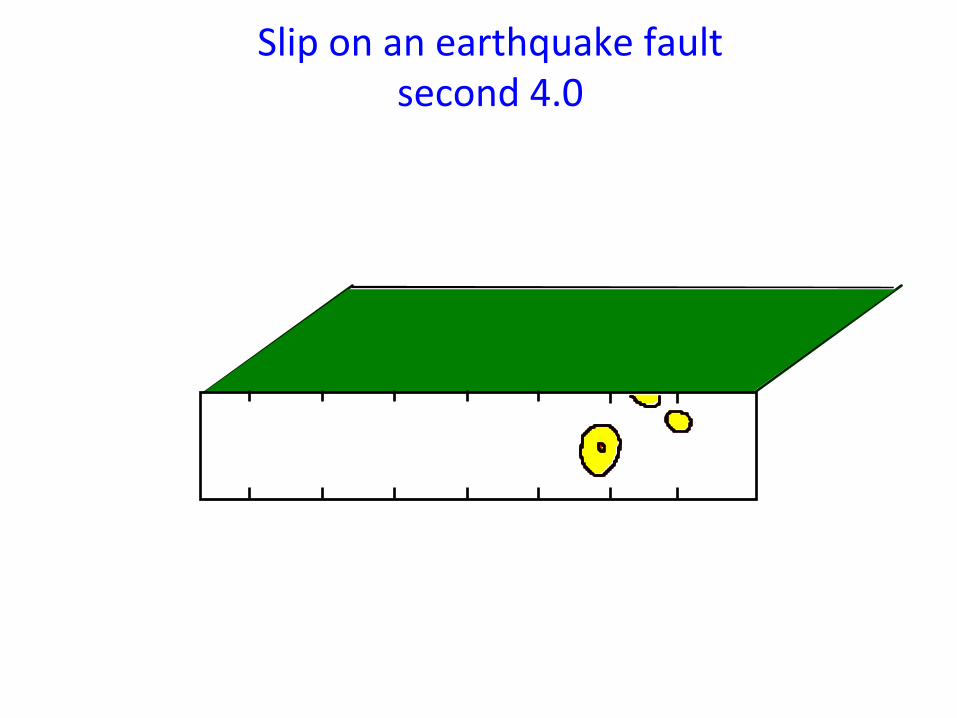
Sliponanearthquakefaultsecond4.0

Sliponanearthquakefaultsecond6.0
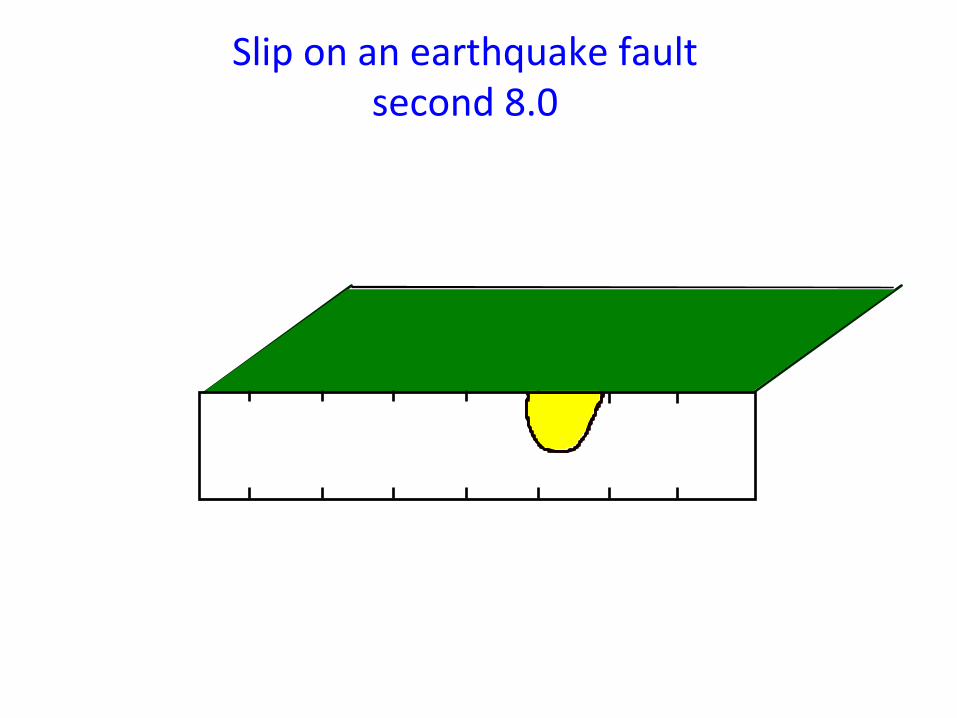
Sliponanearthquakefaultsecond8.0
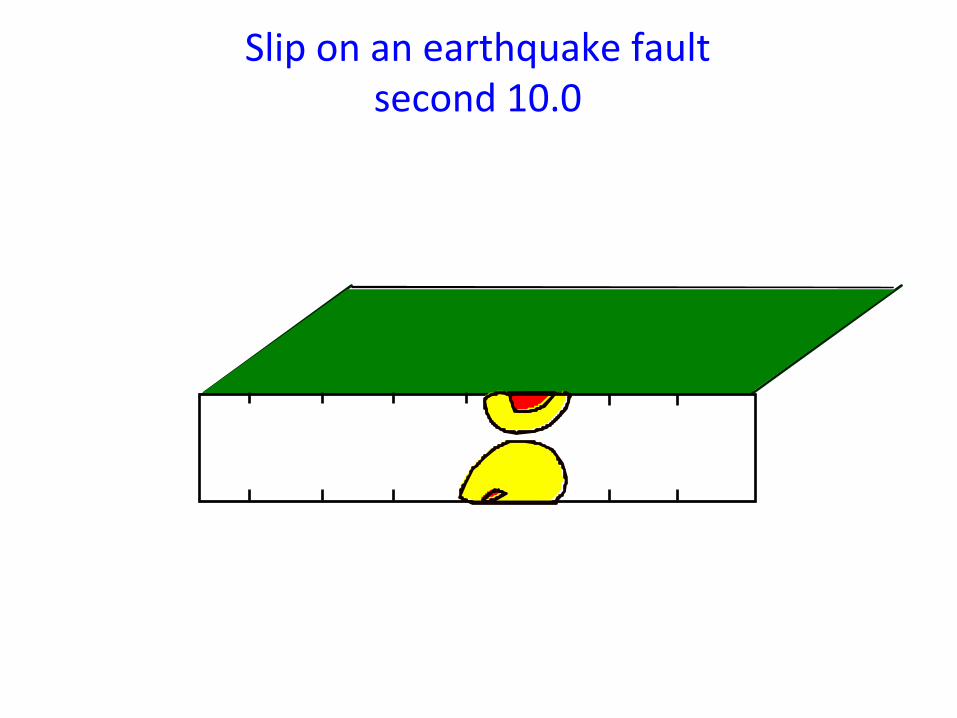
Sliponanearthquakefaultsecond10.0
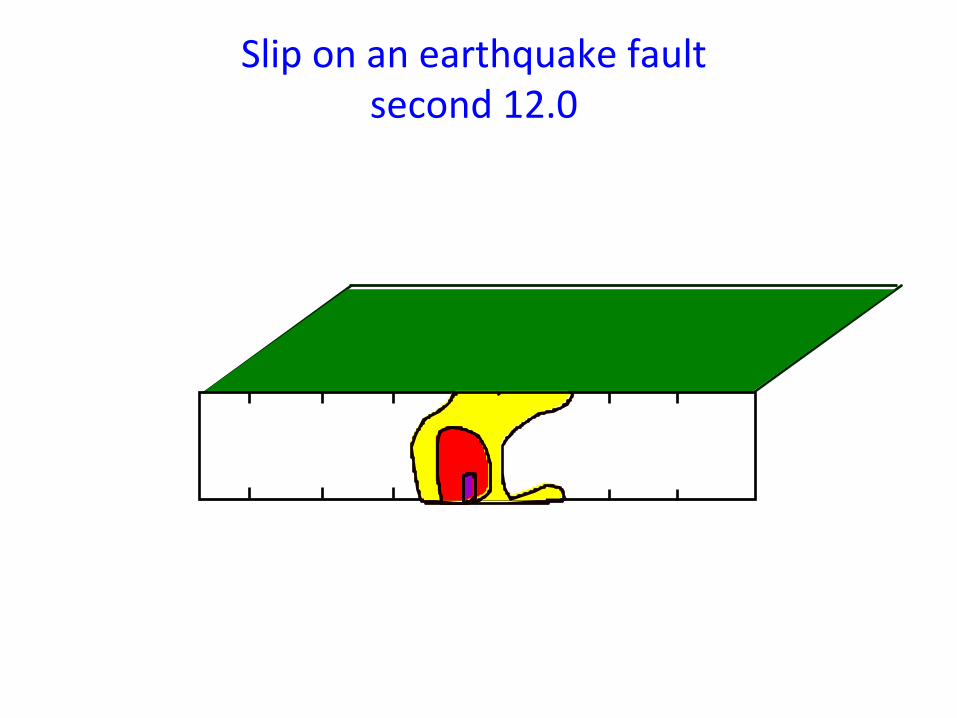
Sliponanearthquakefaultsecond12.0
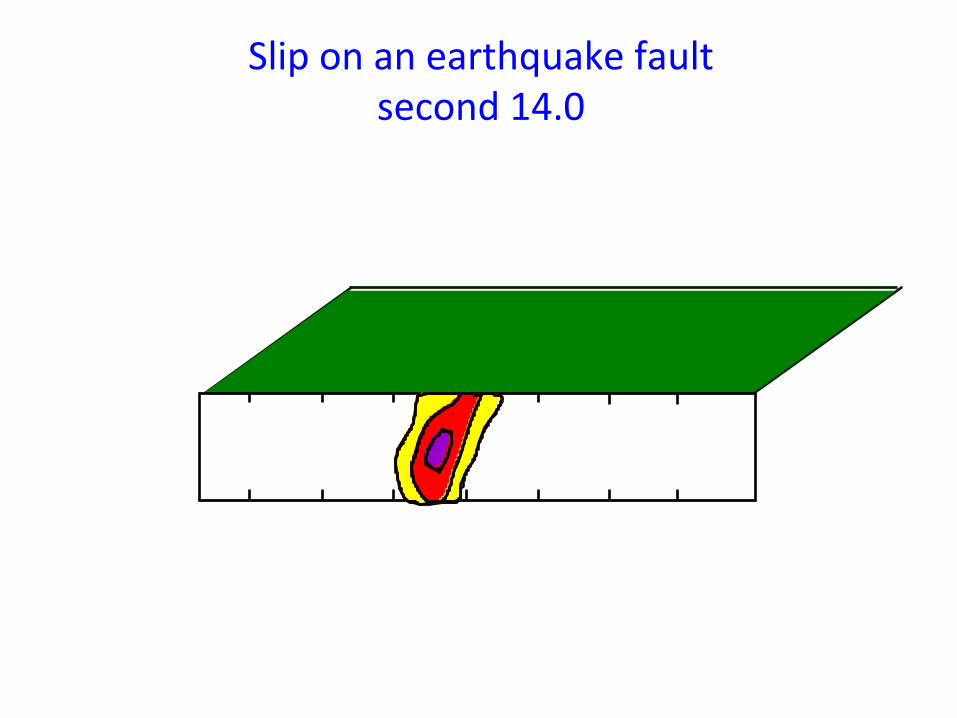
Sliponanearthquakefaultsecond14.0
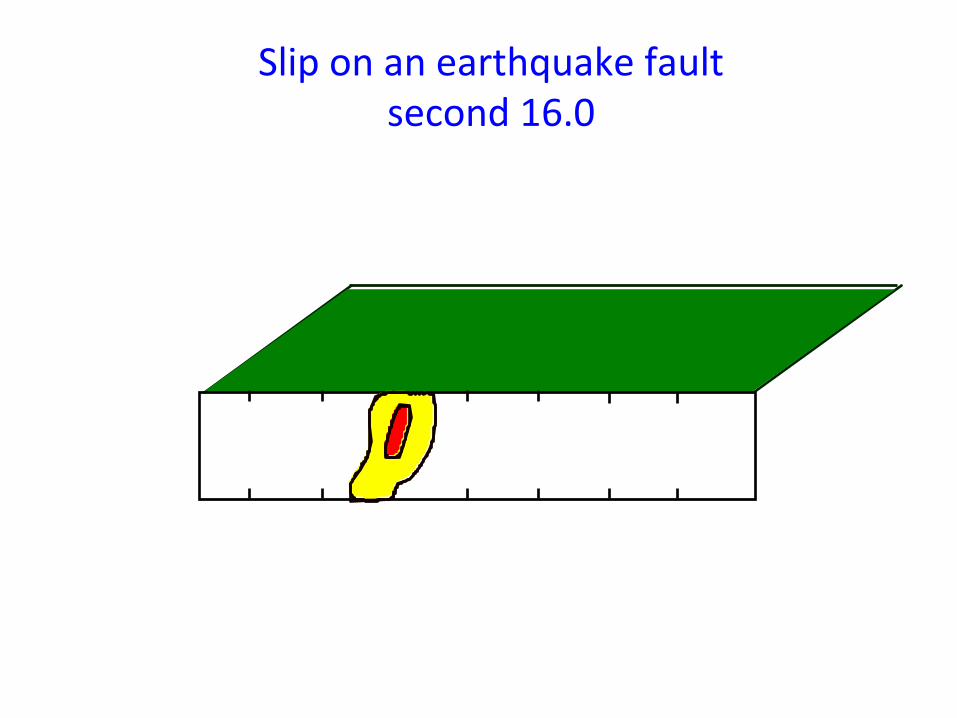
Sliponanearthquakefaultsecond16.0
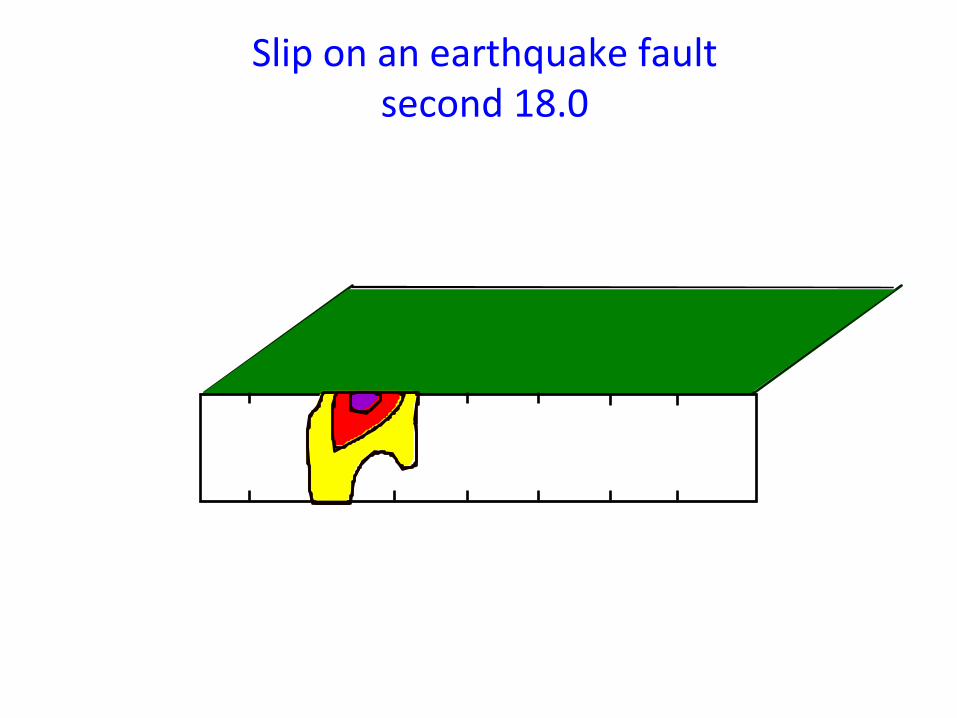
Sliponanearthquakefaultsecond18.0
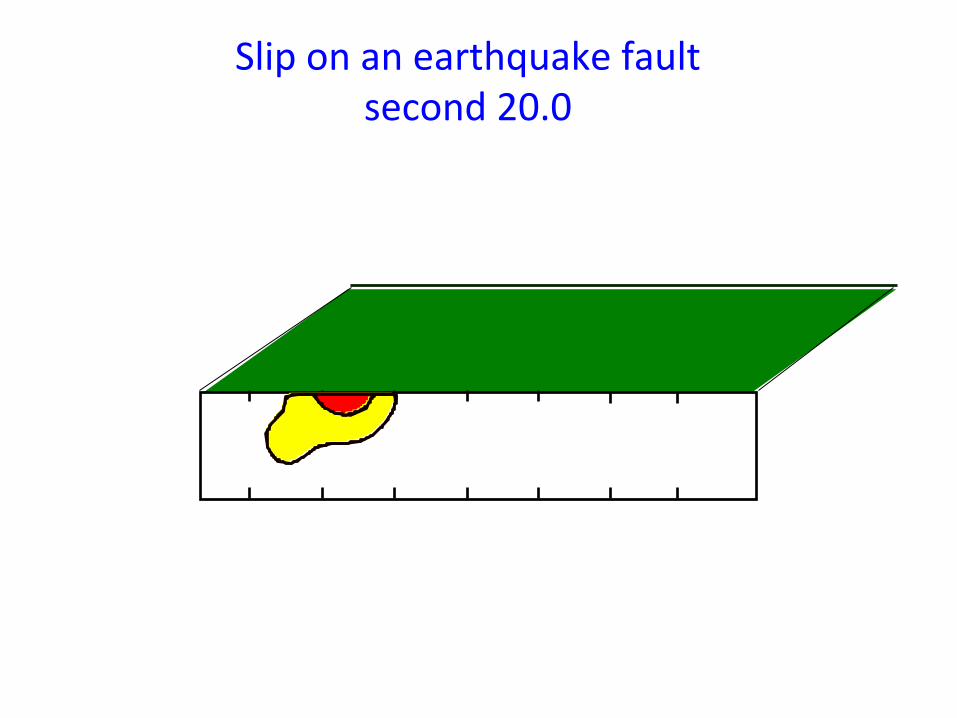
Sliponanearthquakefaultsecond20.0
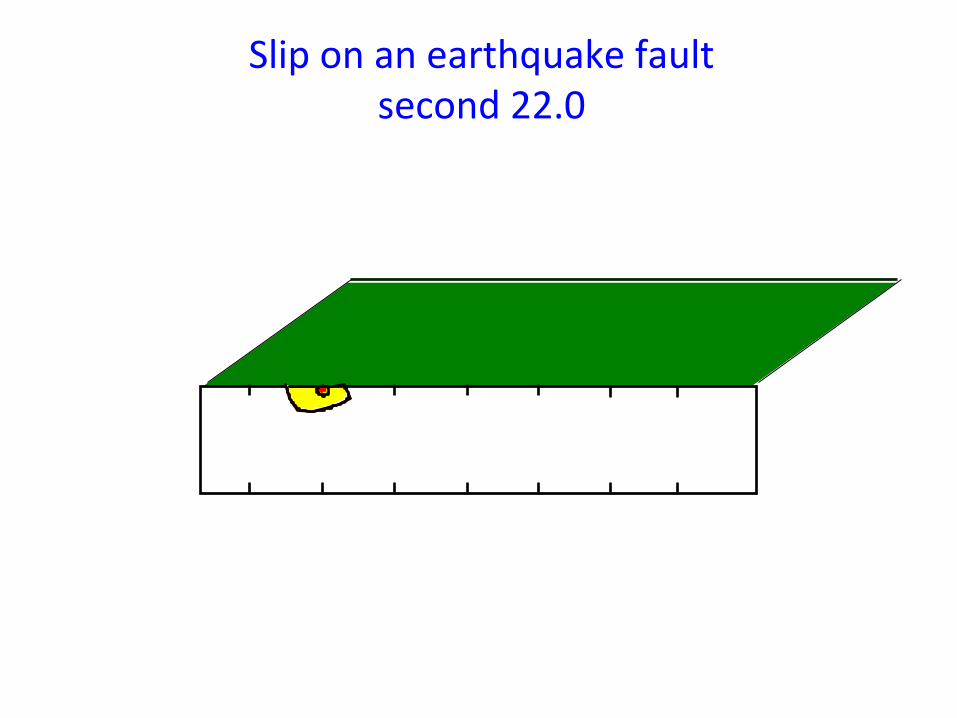
Sliponanearthquakefaultsecond22.0
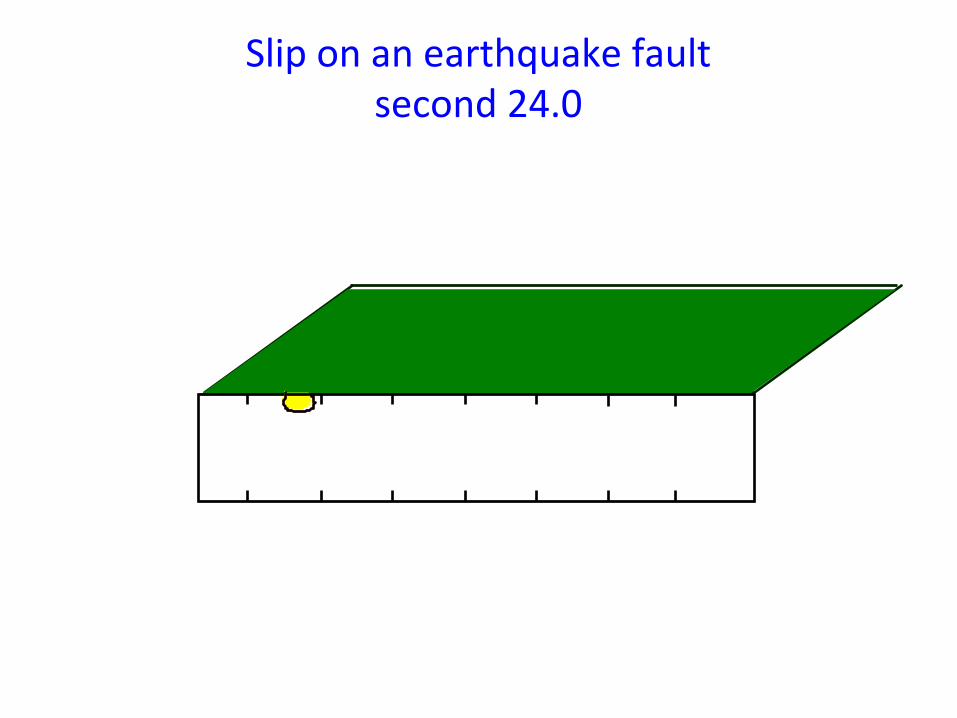
Sliponanearthquakefaultsecond24.0
P/%,&,QI"&-J&)*J-(R%S-*&);&)*&%&;");R-+(%RT&
P/%,&,QI"&-J&)*J-(R%S-*&);&)*&%&;");R-+(%RT&
!"&1<K(%S-*@A6&
#$&1;)U"6&
V("LK"*$Q&1'U6&
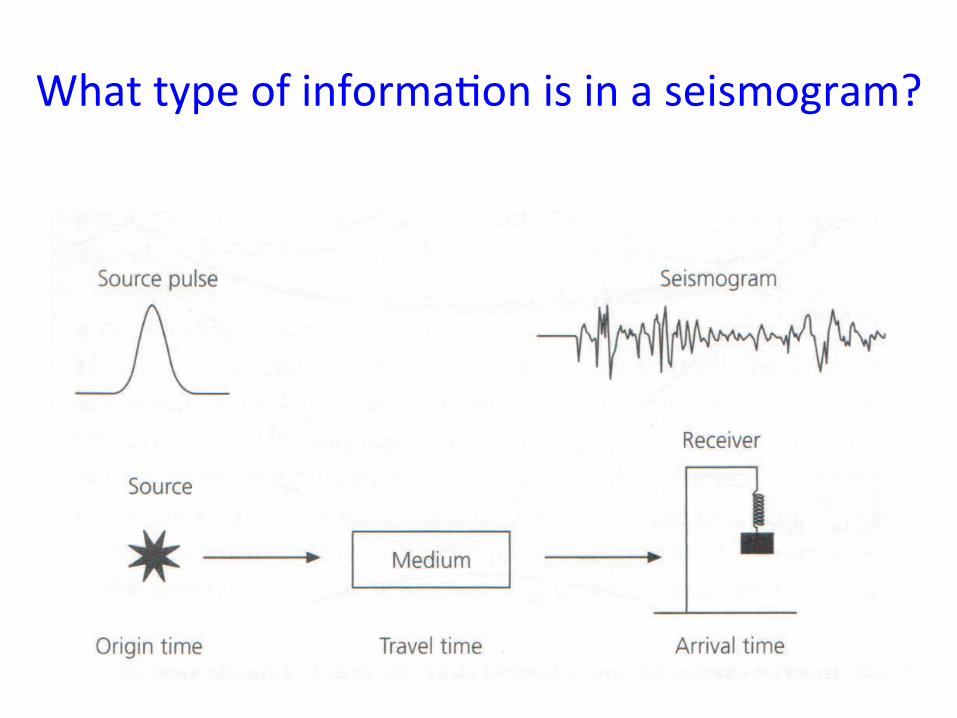
HI"$,(%E&%RIE),K
<"&
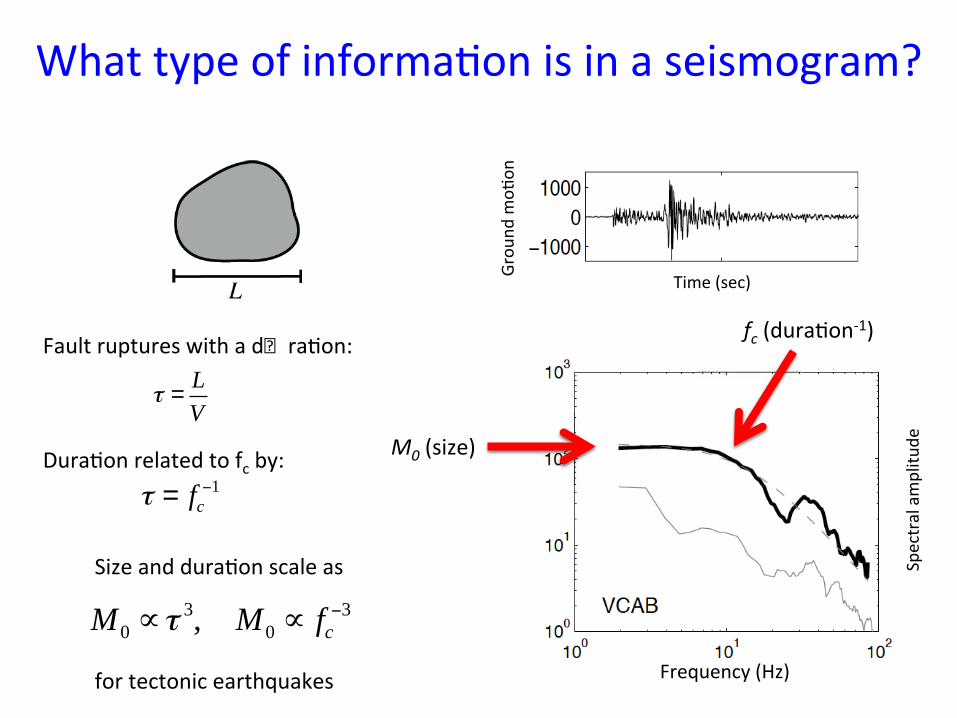
H)U"&%*<&<K(%S-*&;$%E"&%;&&&&J-(&,"$,-*)$&"%(,/LK%M";&&
M0 !!3, M0 ! fc
"3
V%KE,&(KI,K(";&W),/&%&<K(%S-*X&&&&0K(%S-*&("E%,"<&,-&J$&#QX&
&
! =LV
! = fc!1
?)R"&1;"$6&D(-K
*<&R-S
-*&
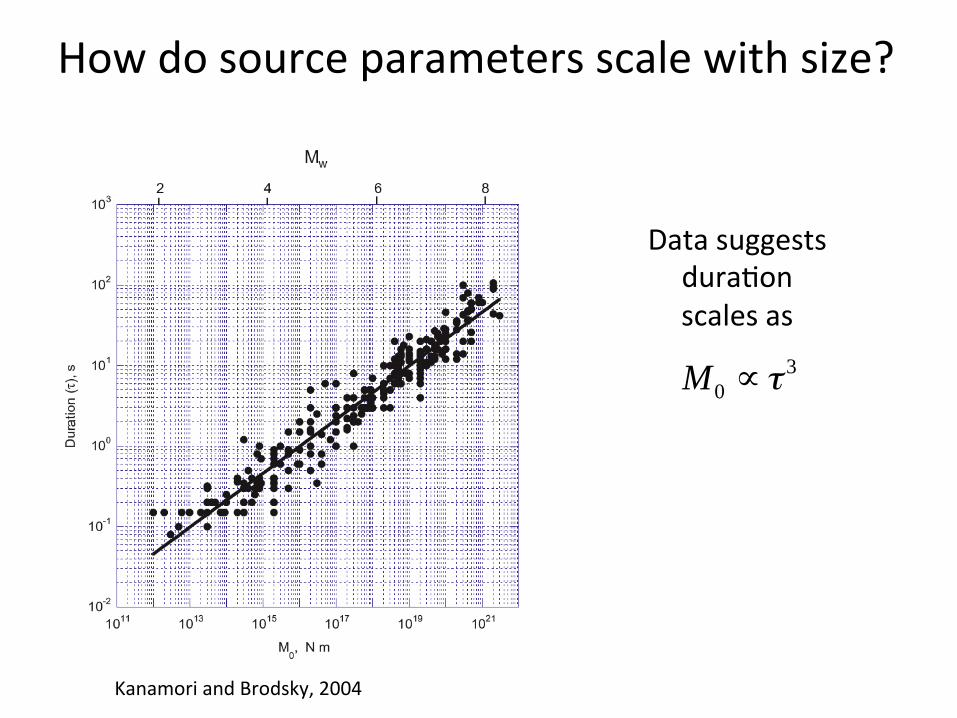
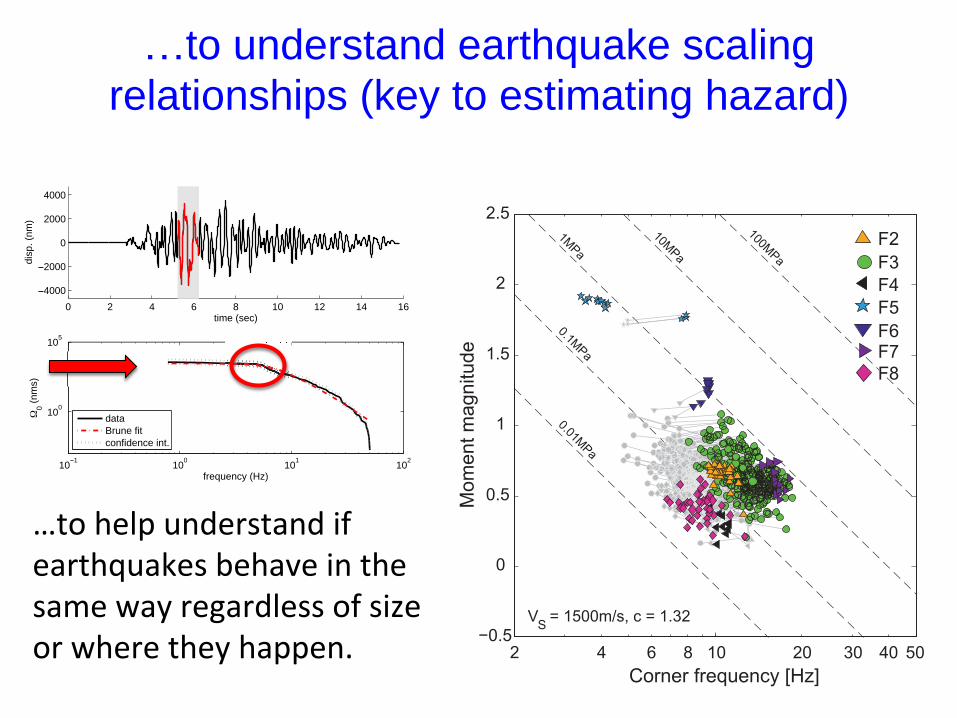
Howdosourceparametersscalewithsize?
KanamoriandBrodsky,2004
€
M0 ∝τ3
DatasuggestsduraSonscalesas
0 2 4 6 8 10 12 14 16!4000
!2000
0
2000
4000
disp
. (nm
)
time (sec)
10!1 100 101 102
100
105
frequency (Hz)
!0 (n
ms)
dataBrune fitconfidence int.
Z,-&/"EI&K*<"(;,%*<&)J&"%(,/LK%M";&#"/%["&)*&,/"&;%R"&W%Q&("+%(<E";;&-J&;)U"&-(&W/"("&,/"Q&/%II"*N&&
!to understand earthquake scaling relationships (key to estimating hazard)&&
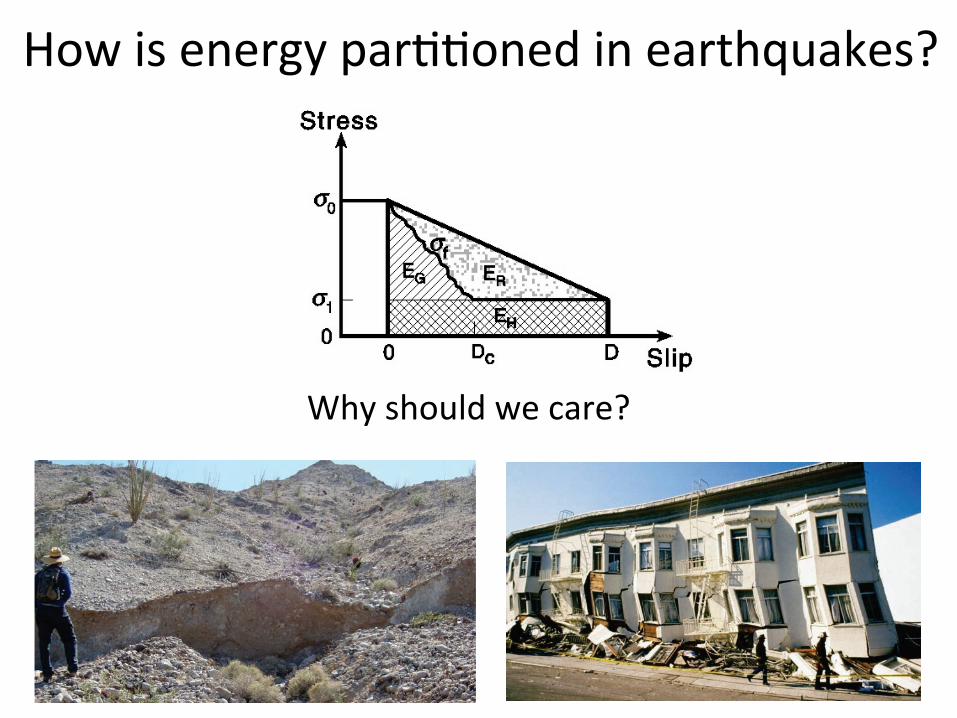
'-W&);&"*"(+Q&I%(SS-*"<&)*&"%(,/LK%M";T&&
P/Q&;/-KE<&W"&$%("T&&&
1464 H Kanamori and E E Brodsky
Figure 18. Illustration of simple stress release patterns during faulting. (a) ——: simple case ofimmediate stress drop. - - - -: general case without slip-weakening. (b) Slip-weakening model:hatched and cross-hatched areas indicate the fracture energy and frictional energy loss, respectively.(c) The energy budget: hatched, cross-hatched and dotted areas indicate the fracture energy, thermal(frictional) energy and radiated energy, in that order. All the figures are shown for unit area of thefault plane.
An earthquake is viewed as a stress release process on a fault surface S . The solid linesin figure 18(a) show the simplest case. At the initiation of an earthquake, the initial (beforean earthquake) shear stress on the fault plane σ0 drops to a constant dynamic friction σf , andstays there, i.e. σf = σ1. If the condition for instability is satisfied (Brace and Byerlee (1966),Scholz (2002), also section 6.1.1), rapid fault slip motion begins and eventually stops. At theend, the stress on the fault plane is σ1 (final stress) and the average slip (offset) is D. Thedifference "σs = σ0 − σ1 is the static stress drop. During this process, the potential energy(strain energy plus gravitational energy) of the system, W0, drops to W1 = W0 − "W where"W is the strain energy drop, and the seismic wave is radiated carrying an energy ER. Fromequation (3.14),
"W = σ̄DS, (4.32)
where σ̄ = (σ0 + σ1)/2 is the average stress during faulting (section 3.1.4). Graphically, "W
(for unit area) is given by the trapezoidal area shown in figure 18(c).The variation of stress during faulting can be more complex than shown by the solid lines
in figure 18(a). For example, the stress may increase to the yield stress σY in the beginning ofthe slip motion (curve (1) in figure 18(a)) because of loading caused by the advancing rupture(figure 15(e)), or of a specific friction law such as the rate- and state-dependent friction law(Dieterich 1979) (figure 17). In fact, some seismological inversion studies have shown this
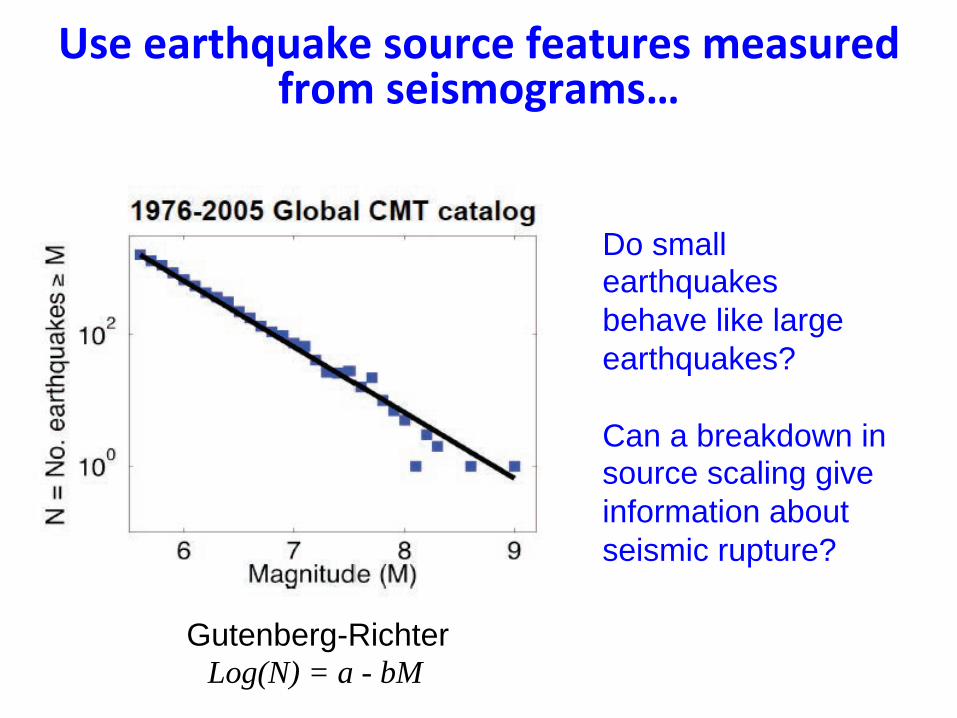
Gutenberg-Richter Log(N) = a - bM
Do small earthquakes behave like large earthquakes? Can a breakdown in source scaling give information about seismic rupture? &
&+*%*@$,#B"@C*%+/"$0*%:*@,"$*+%1*@+"$*<%:$/1%+*(+1/=$@1+D%
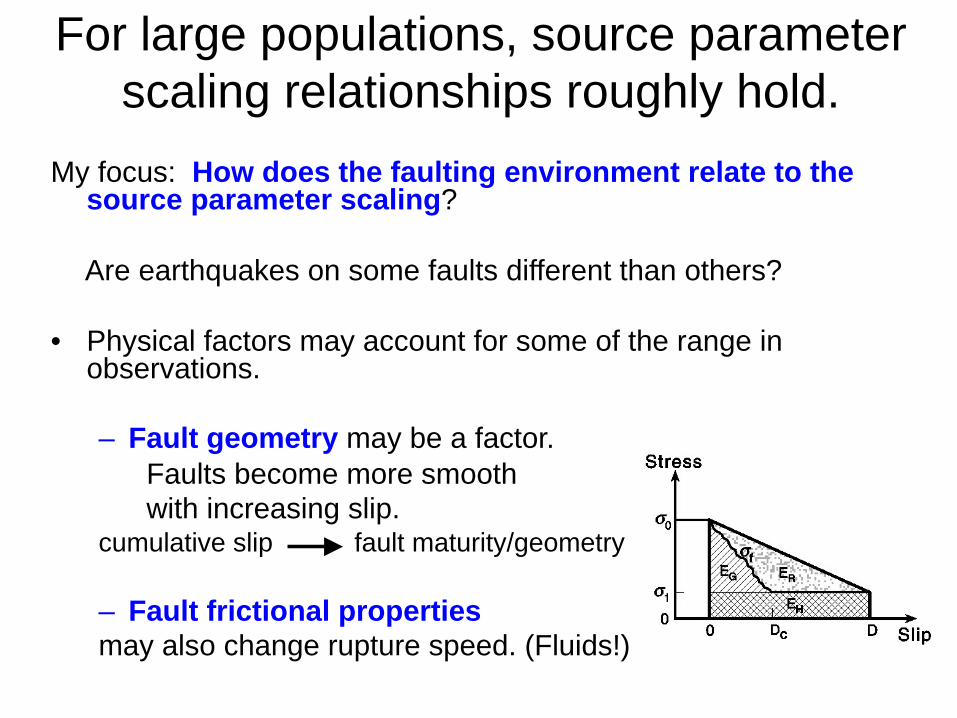
For large populations, source parameter scaling relationships roughly hold.
My focus: How does the faulting environment relate to the
source parameter scaling? Are earthquakes on some faults different than others?
• Physical factors may account for some of the range in observations.
– Fault geometry may be a factor. Faults become more smooth with increasing slip.
cumulative slip fault maturity/geometry
– Fault frictional properties may also change rupture speed. (Fluids!)
1464 H Kanamori and E E Brodsky
Figure 18. Illustration of simple stress release patterns during faulting. (a) ——: simple case ofimmediate stress drop. - - - -: general case without slip-weakening. (b) Slip-weakening model:hatched and cross-hatched areas indicate the fracture energy and frictional energy loss, respectively.(c) The energy budget: hatched, cross-hatched and dotted areas indicate the fracture energy, thermal(frictional) energy and radiated energy, in that order. All the figures are shown for unit area of thefault plane.
An earthquake is viewed as a stress release process on a fault surface S . The solid linesin figure 18(a) show the simplest case. At the initiation of an earthquake, the initial (beforean earthquake) shear stress on the fault plane σ0 drops to a constant dynamic friction σf , andstays there, i.e. σf = σ1. If the condition for instability is satisfied (Brace and Byerlee (1966),Scholz (2002), also section 6.1.1), rapid fault slip motion begins and eventually stops. At theend, the stress on the fault plane is σ1 (final stress) and the average slip (offset) is D. Thedifference "σs = σ0 − σ1 is the static stress drop. During this process, the potential energy(strain energy plus gravitational energy) of the system, W0, drops to W1 = W0 − "W where"W is the strain energy drop, and the seismic wave is radiated carrying an energy ER. Fromequation (3.14),
"W = σ̄DS, (4.32)
where σ̄ = (σ0 + σ1)/2 is the average stress during faulting (section 3.1.4). Graphically, "W
(for unit area) is given by the trapezoidal area shown in figure 18(c).The variation of stress during faulting can be more complex than shown by the solid lines
in figure 18(a). For example, the stress may increase to the yield stress σY in the beginning ofthe slip motion (curve (1) in figure 18(a)) because of loading caused by the advancing rupture(figure 15(e)), or of a specific friction law such as the rate- and state-dependent friction law(Dieterich 1979) (figure 17). In fact, some seismological inversion studies have shown this
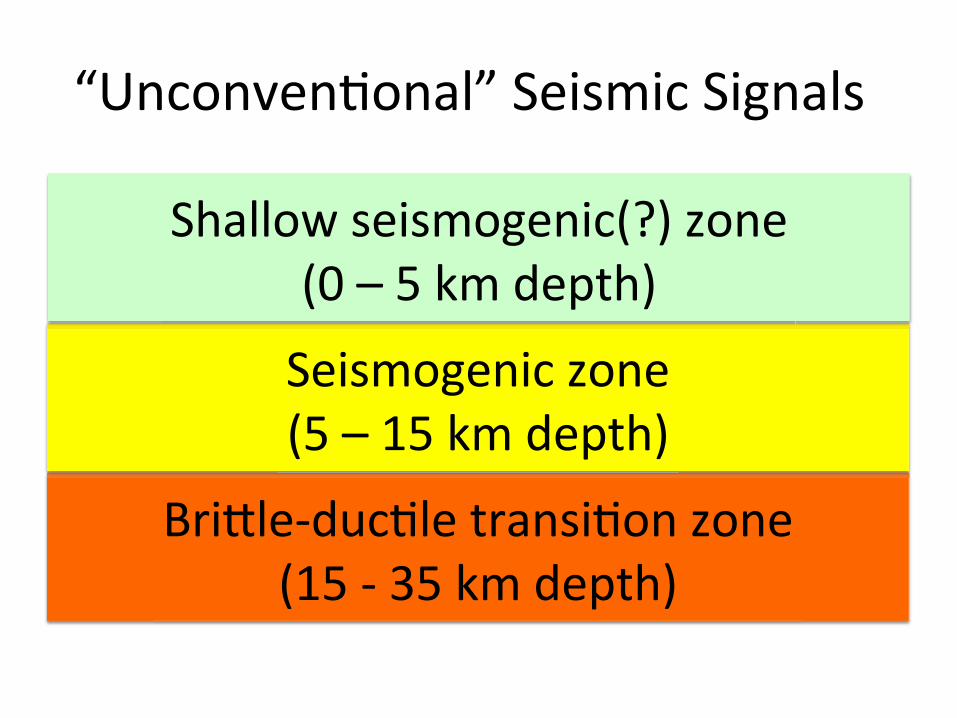
Y()\E"@<K$SE"&,(%*;)S-*&U-*"&&1A]&@&B]&MR&<"I,/6&
H");R-+"*)$&U-*"&1]&F&A]&MR&<"I,/6&
H/%EE-W&;");R-+"*)$1T6&U-*"&18&F&]&MR&<"I,/6&
^2*$-*["*S-*%E_&H");R)$&H)+*%E;&&
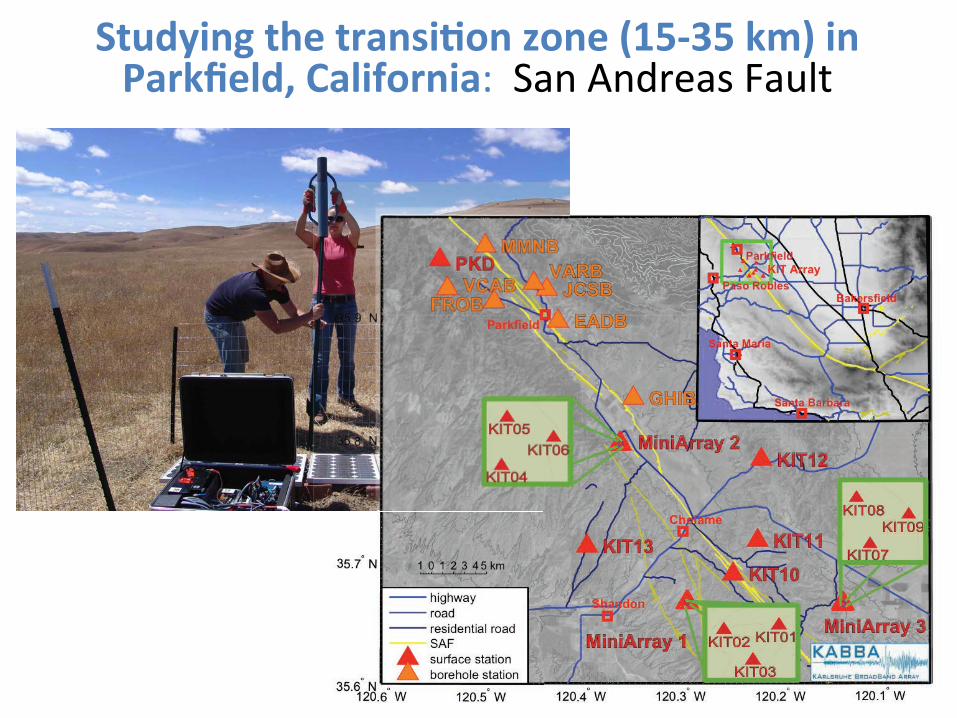
E,"<F('=%,#*%,$@'+(?/'%G/'*%H4I6JI%C1K%('%7@$CL*9<M%N@9(:/$'(@X&&H%*&5*<("%;&V%KE,&
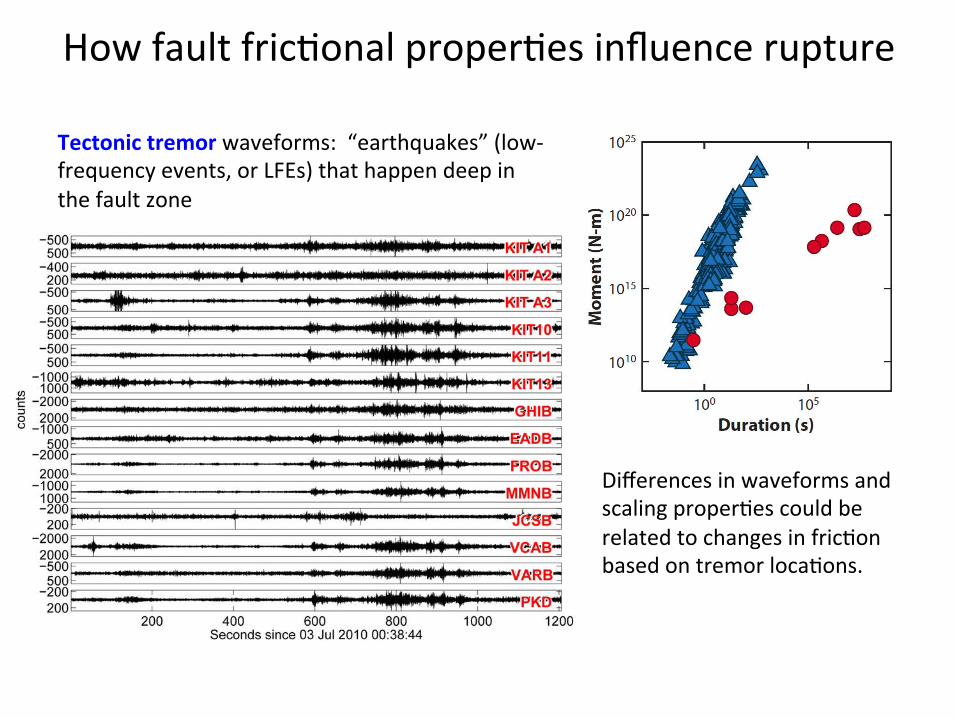
HowfaultfricSonalproperSesinfluencerupture
DifferencesinwaveformsandscalingproperSescouldberelatedtochangesinfricSonbasedontremorlocaSons.
Tectonictremorwaveforms:“earthquakes”(low-frequencyevents,orLFEs)thathappendeepinthefaultzone
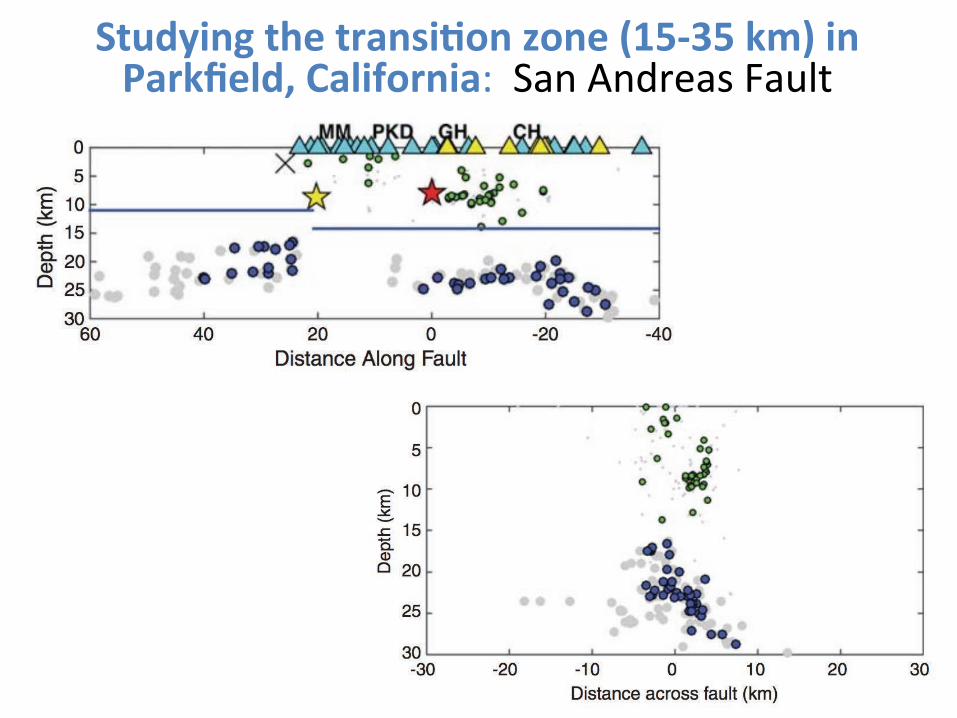
E,"<F('=%,#*%,$@'+(?/'%G/'*%H4I6JI%C1K%('%7@$CL*9<M%N@9(:/$'(@X&&H%*&5*<("%;&V%KE,&
H");R-+"*)$&c-*"&17@A]&MR6&>*,(%@IE%,"&"%(,/LK%M";&)*&,/"&3/%(E"[-)d&;");R)$&U-*"&
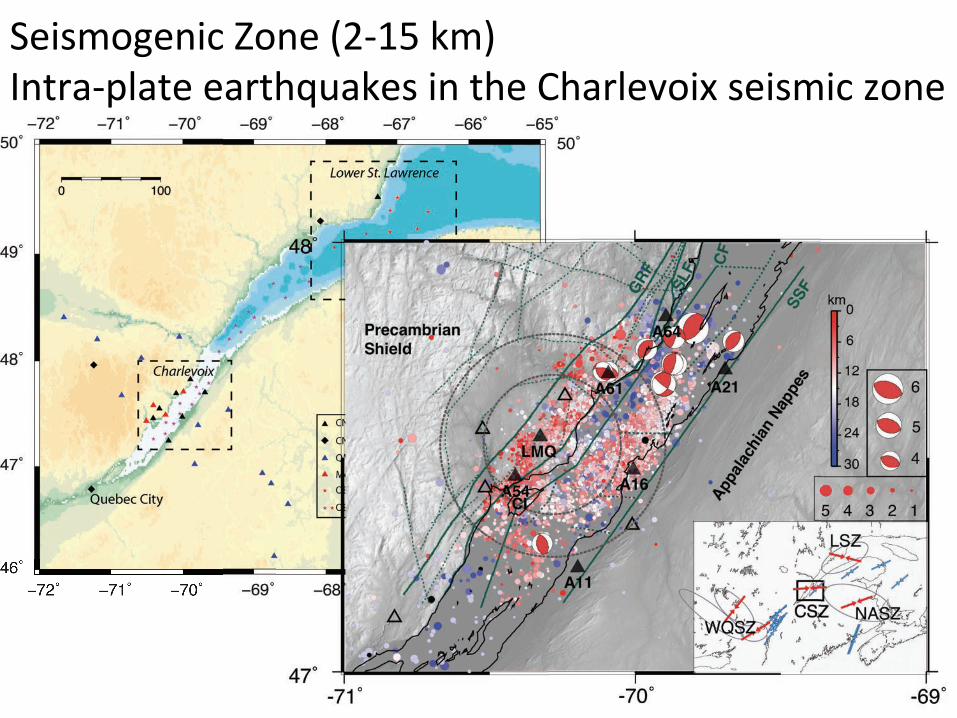
Theshallowseismogeniczone(<5km)
Roleoffluids?Usinginducedseismicity
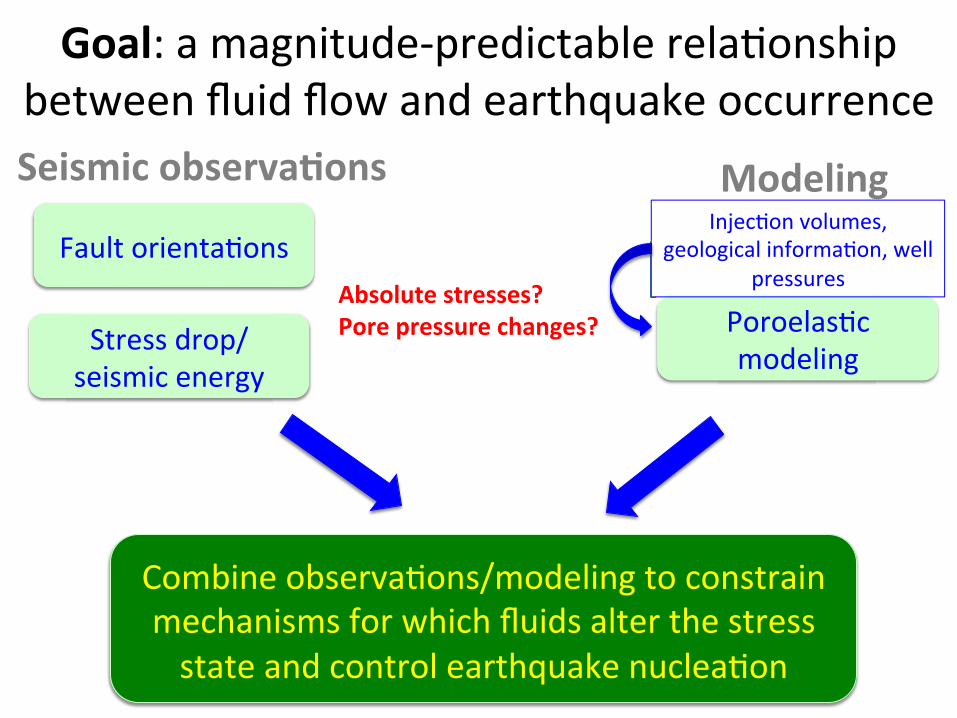
O/@9X&%&R%+*),K<"@I("<)$,%#E"&("E%S-*;/)I&#",W""*&`K)<&`-W&%*<&"%(,/LK%M"&-$$K(("*$"&
V%KE,&-()"*,%S-*;&
H,(";;&<(-If;");R)$&"*"(+Q&
PQ+/9",*%+,$*++*+R%7/$*%S$*++"$*%0#@'=*+R%%% .-(-"E%;S$&
R-<"E)*+&
3-R#)*"&-#;"([%S-*;fR-<"E)*+&,-&$-*;,(%)*&R"$/%*);R;&J-(&W/)$/&`K)<;&%E,"(&,/"&;,(";;&;,%,"&%*<&$-*,(-E&"%(,/LK%M"&*K$E"%S-*&&
E*(+1(0%/Q+*$)@?/'+% T/<*9('=%>*g"$S-*&[-EKR";:&
+"-E-+)$%E&)*J-(R%S-*:&W"EE&I(";;K(";&
7/$*%S$*++"$*%0#@'=*+R%%%
E,@?0%,$(==*$('=% UF'@1(0%,$(==*$('=%
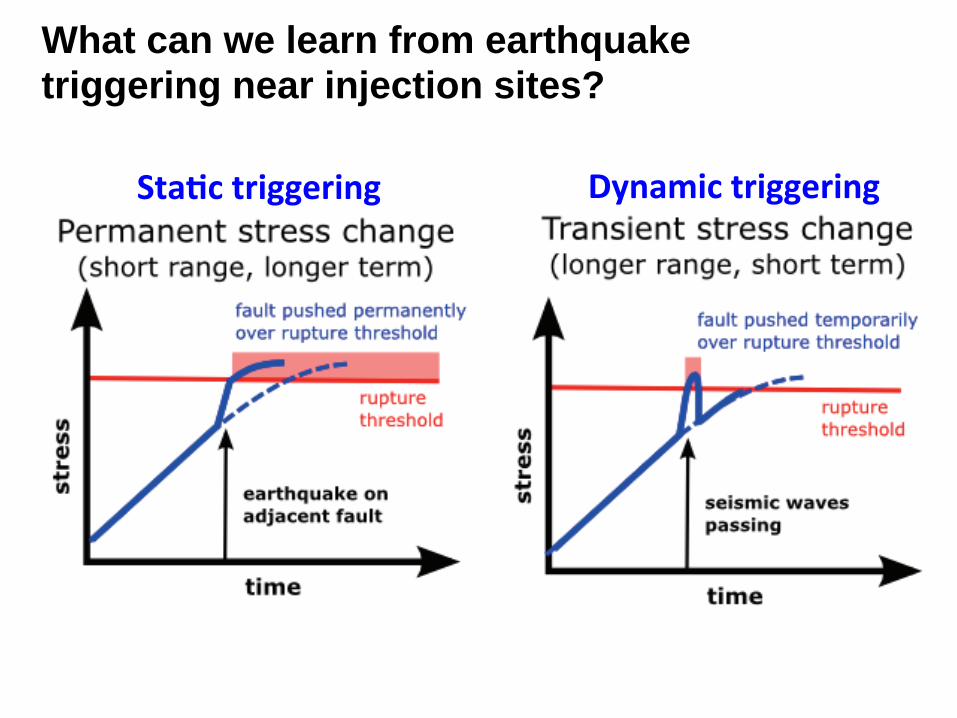
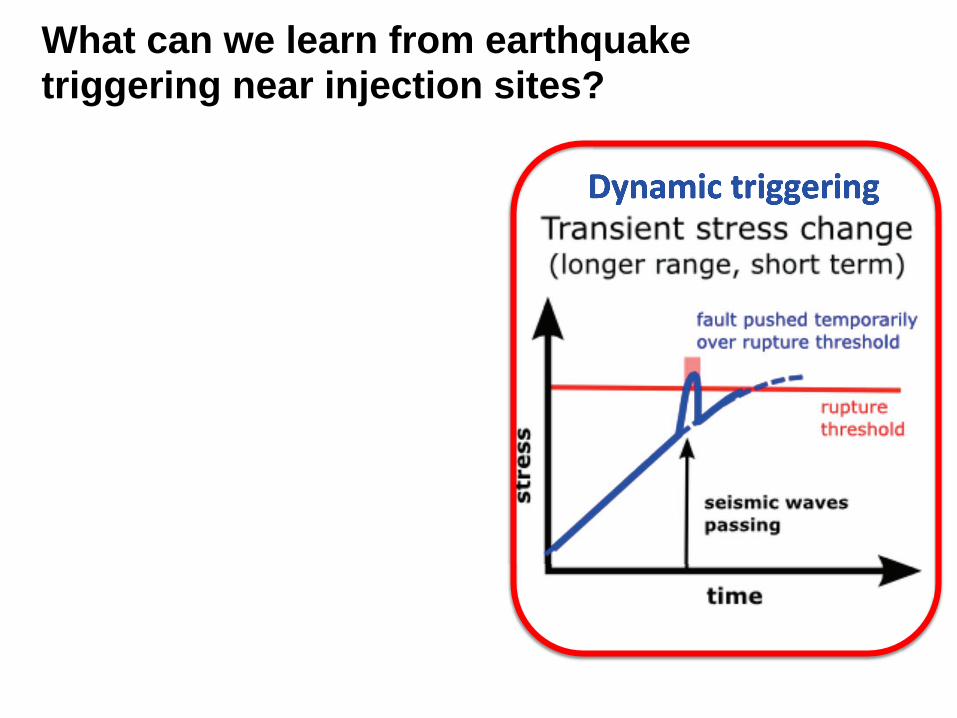
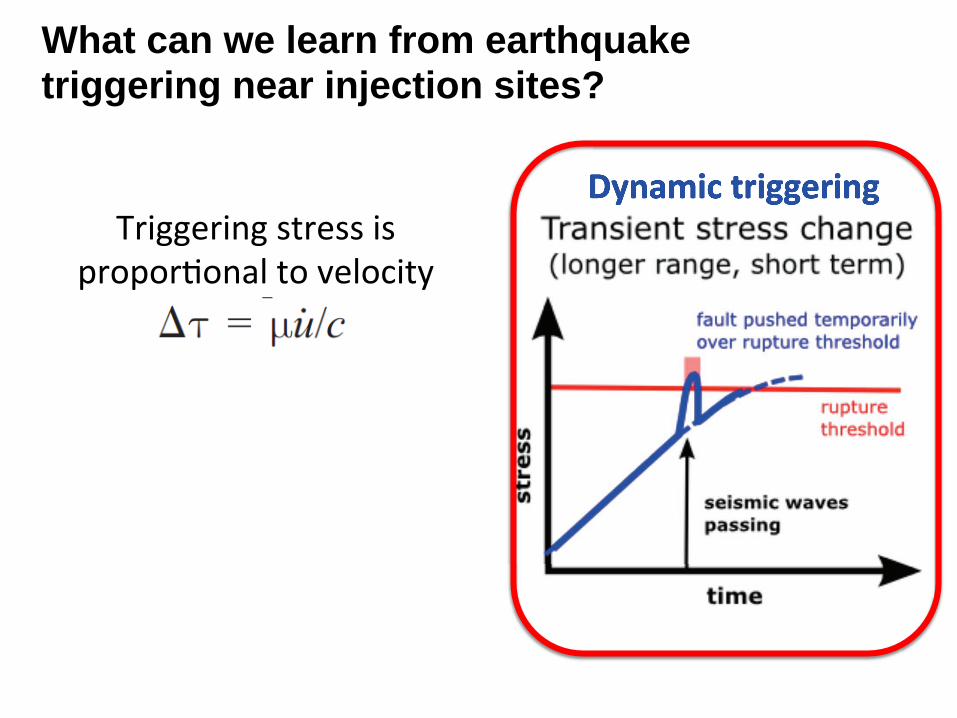
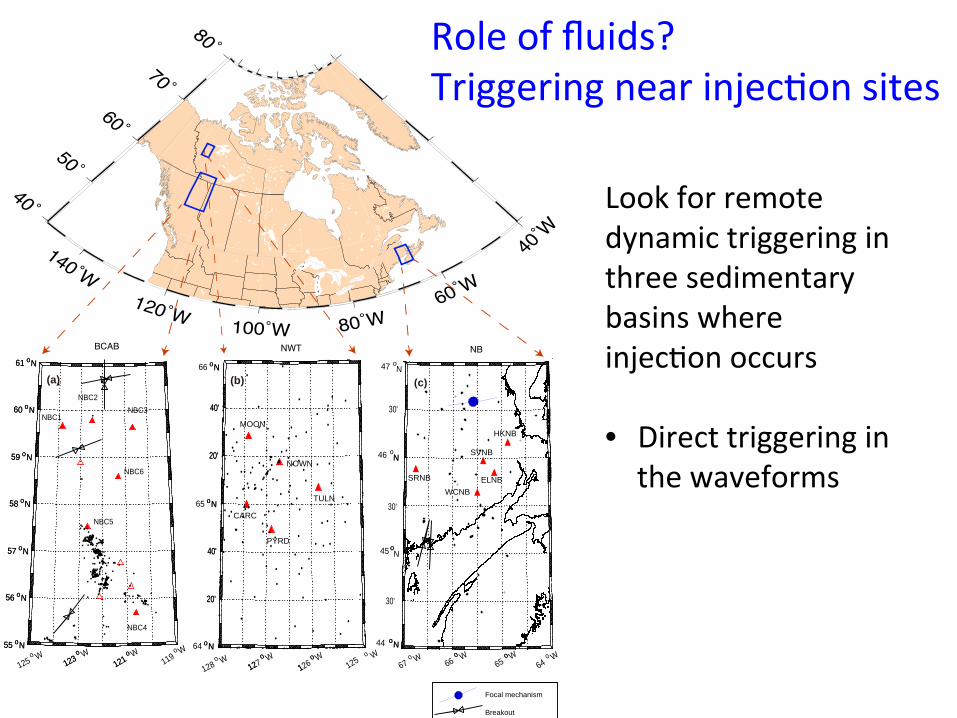
What can we learn from earthquake triggering near injection sites?
E,@?0%,$(==*$('=%UF'@1(0%,$(==*$('=%UF'@1(0%,$(==*$('=%UF'@1(0%,$(==*$('=%
What can we learn from earthquake triggering near injection sites?
E,@?0%,$(==*$('=%UF'@1(0%,$(==*$('=%UF'@1(0%,$(==*$('=%UF'@1(0%,$(==*$('=%
?()++"()*+&;,(";;&);&I(-I-(S-*%E&,-&["E-$),Q&
What can we learn from earthquake triggering near injection sites?
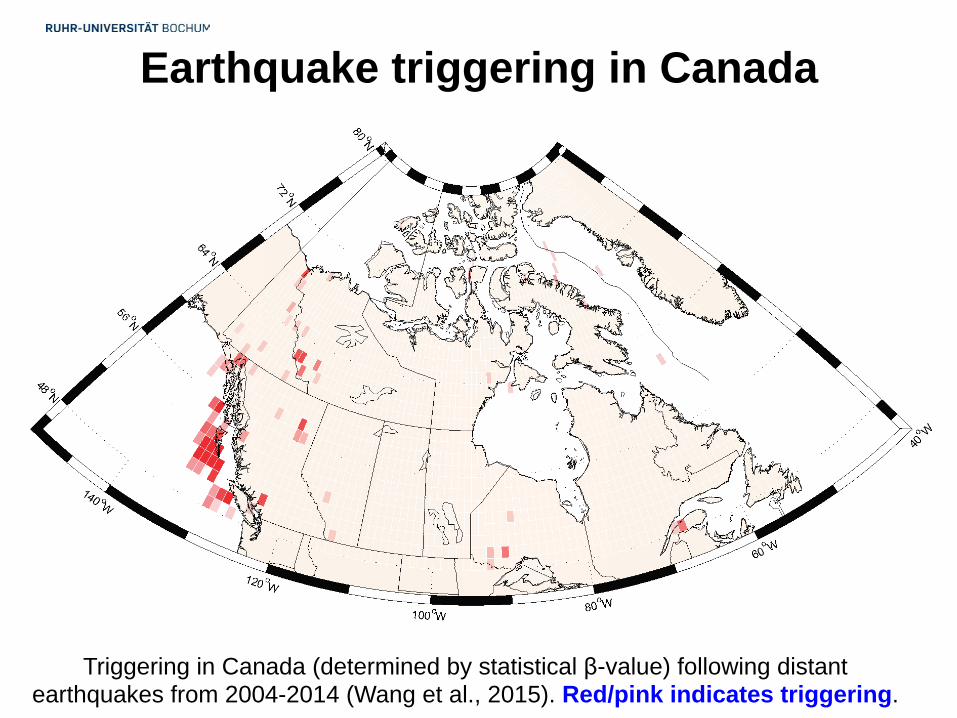
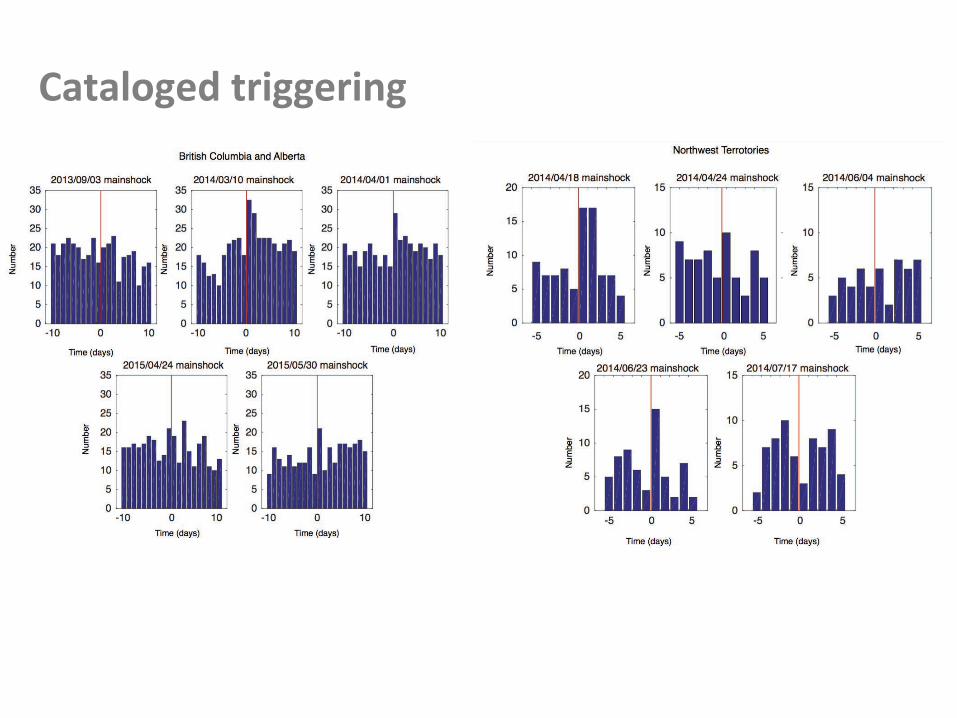
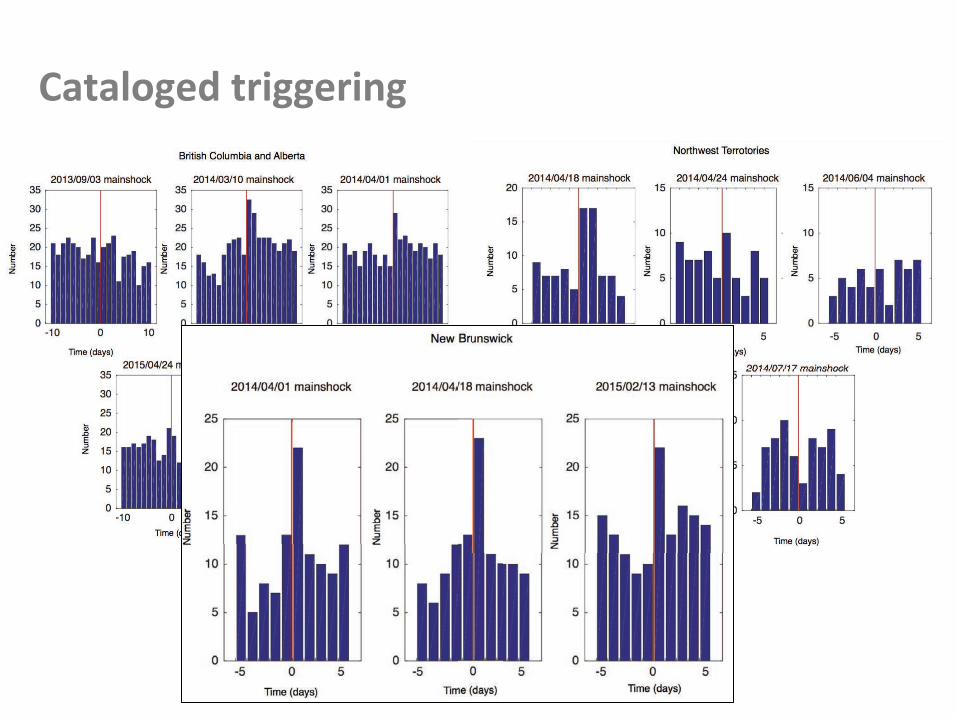
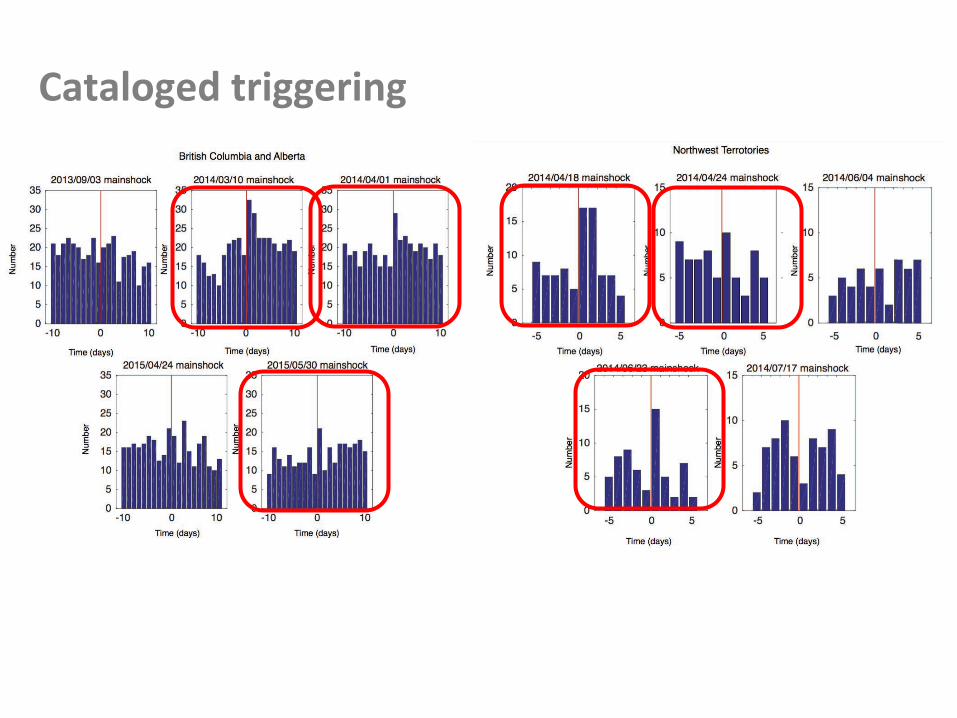
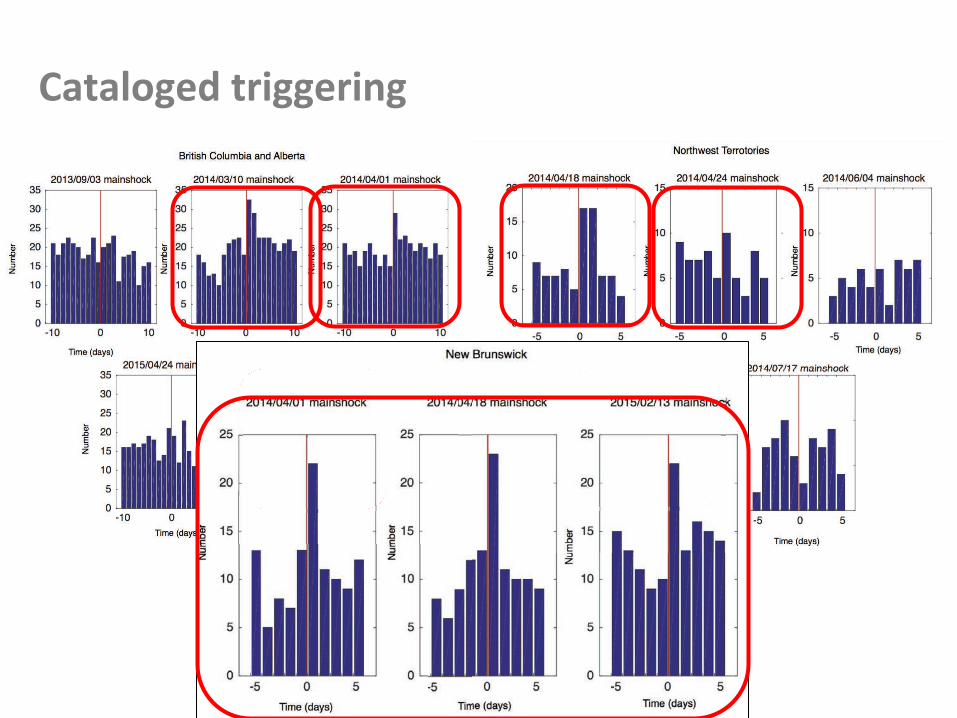
Earthquake triggering in Canada
Triggering in Canada (determined by statistical "-value) following distant earthquakes from 2004-2014 (Wang et al., 2015). Red/pink indicates triggering.
TriggeringinAlberta
Wangetal.,2015
Triggeringstresses~0.1kPa,
frequencydependent
30'
%&$% 1:7 1%
119o W
121o W
121o
123o W
123oW
125o
61 oN61 oN
60 oN60 oN
59 oN59 oN
58 oN58 oN
57 oN57 oN
56 oN56 oN
55 oN55 oN
NBC1
NBC2NBC3
NBC4
NBC5
NBC6
40' 40'
20' 20'
40' 40'
20' 20'
MOON
PYRD
TULN
NOWN
CARC
HKNB
WCNBELNBSRNB
SVNB
125o W
126o W
1o
127o W
12oW
128o
64o W o W
65oo W
66oW
67o
64 oNoN
65 oNoN
66 oNoN
44 oNoN
45 ooN
46 oNN
47 oN
30'
30'
(a) (b) (c)
Focal mechanism
Breakout
���Ý:���Ý:
���Ý: ��Ý:��Ý:
��Ý:
��Ý
��Ý
��Ý
��Ý
��Ý
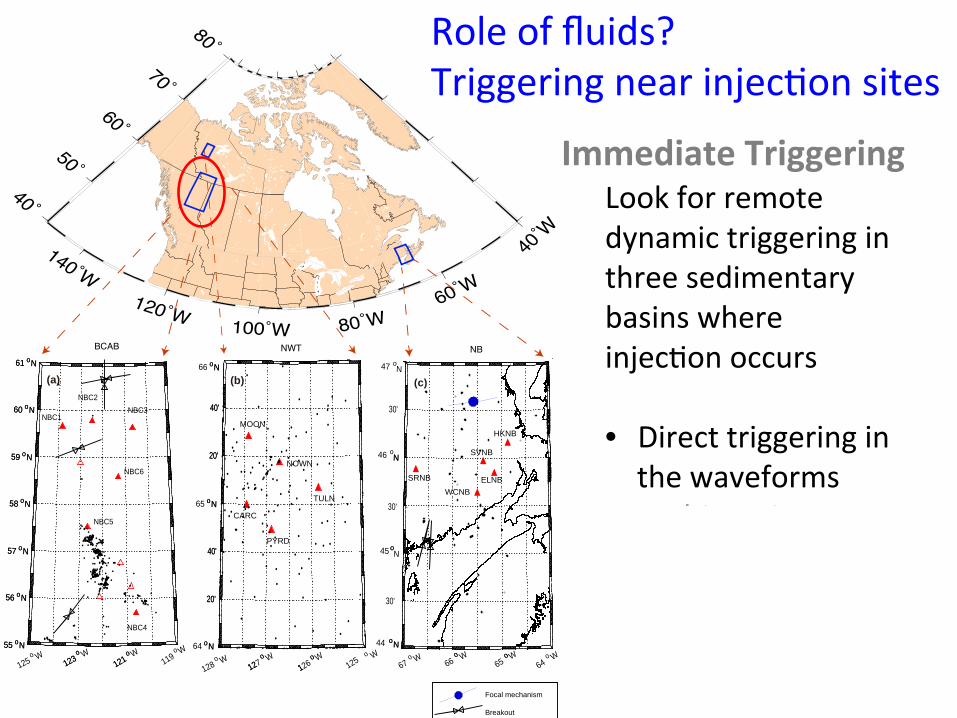
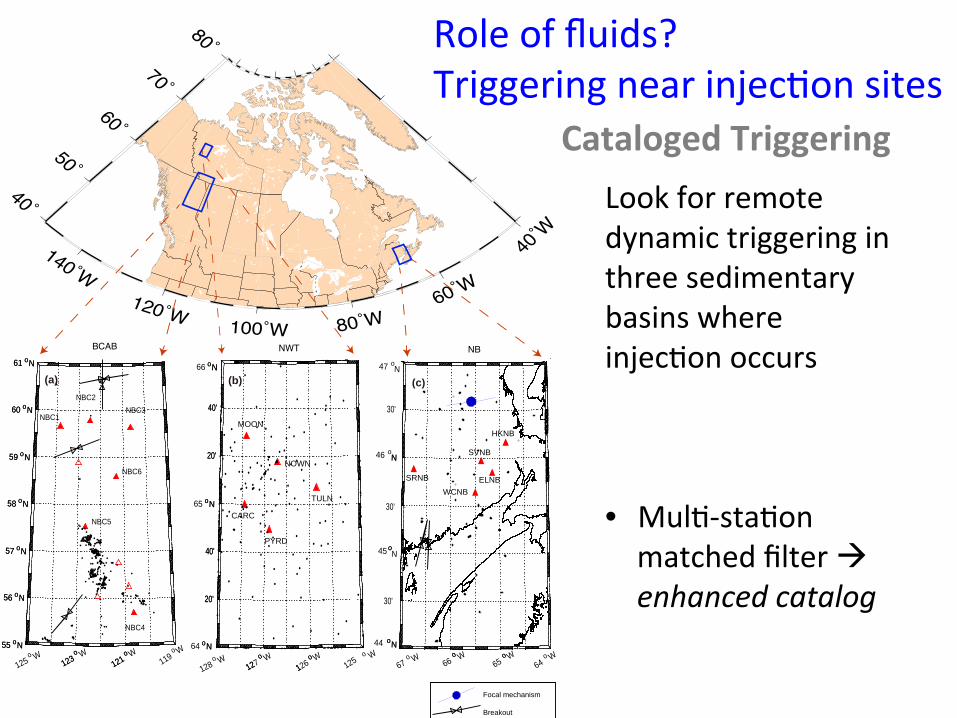
LookforremotedynamictriggeringinthreesedimentarybasinswhereinjecSonoccurs• Directtriggeringinthewaveforms
• MulS-staSonmatchedfilteràenhancedcatalog
Roleoffluids?TriggeringnearinjecSonsites
30'
%&$% 1:7 1%
119o W
121o W
121o
123o W
123oW
125o
61 oN61 oN
60 oN60 oN
59 oN59 oN
58 oN58 oN
57 oN57 oN
56 oN56 oN
55 oN55 oN
NBC1
NBC2NBC3
NBC4
NBC5
NBC6
40' 40'
20' 20'
40' 40'
20' 20'
MOON
PYRD
TULN
NOWN
CARC
HKNB
WCNBELNBSRNB
SVNB
125o W
126o W
1o
127o W
12oW
128o
64o W o W
65oo W
66oW
67o
64 oNoN
65 oNoN
66 oNoN
44 oNoN
45 ooN
46 oNN
47 oN
30'
30'
(a) (b) (c)
Focal mechanism
Breakout
���Ý:���Ý:
���Ý: ��Ý:��Ý:
��Ý:
��Ý
��Ý
��Ý
��Ý
��Ý
LookforremotedynamictriggeringinthreesedimentarybasinswhereinjecSonoccurs• Directtriggeringinthewaveforms
• MulS-staSonmatchedfilteràenhancedcatalog
ImmediateTriggering
Roleoffluids?TriggeringnearinjecSonsites
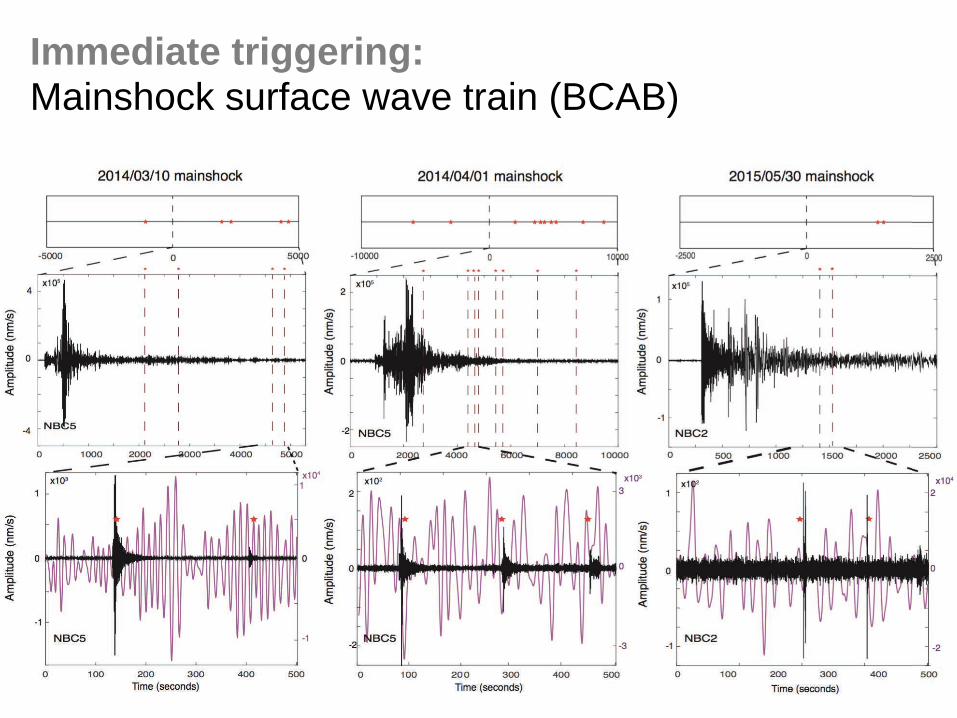
Immediate triggering: Mainshock surface wave train (BCAB)
30'
%&$% 1:7 1%
119o W
121o W
121o
123o W
123oW
125o
61 oN61 oN
60 oN60 oN
59 oN59 oN
58 oN58 oN
57 oN57 oN
56 oN56 oN
55 oN55 oN
NBC1
NBC2NBC3
NBC4
NBC5
NBC6
40' 40'
20' 20'
40' 40'
20' 20'
MOON
PYRD
TULN
NOWN
CARC
HKNB
WCNBELNBSRNB
SVNB
125o W
126o W
1o
127o W
12oW
128o
64o W o W
65oo W
66oW
67o
64 oNoN
65 oNoN
66 oNoN
44 oNoN
45 ooN
46 oNN
47 oN
30'
30'
(a) (b) (c)
Focal mechanism
Breakout
���Ý:���Ý:
���Ý: ��Ý:��Ý:
��Ý:
��Ý
��Ý
��Ý
��Ý
��Ý
LookforremotedynamictriggeringinthreesedimentarybasinswhereinjecSonoccurs• Directtriggeringinthewaveforms
• MulS-staSonmatchedfilteràenhancedcatalog
CatalogedTriggering
Roleoffluids?TriggeringnearinjecSonsites
N@,@9/=*<%,$(==*$('=%
N@,@9/=*<%,$(==*$('=%
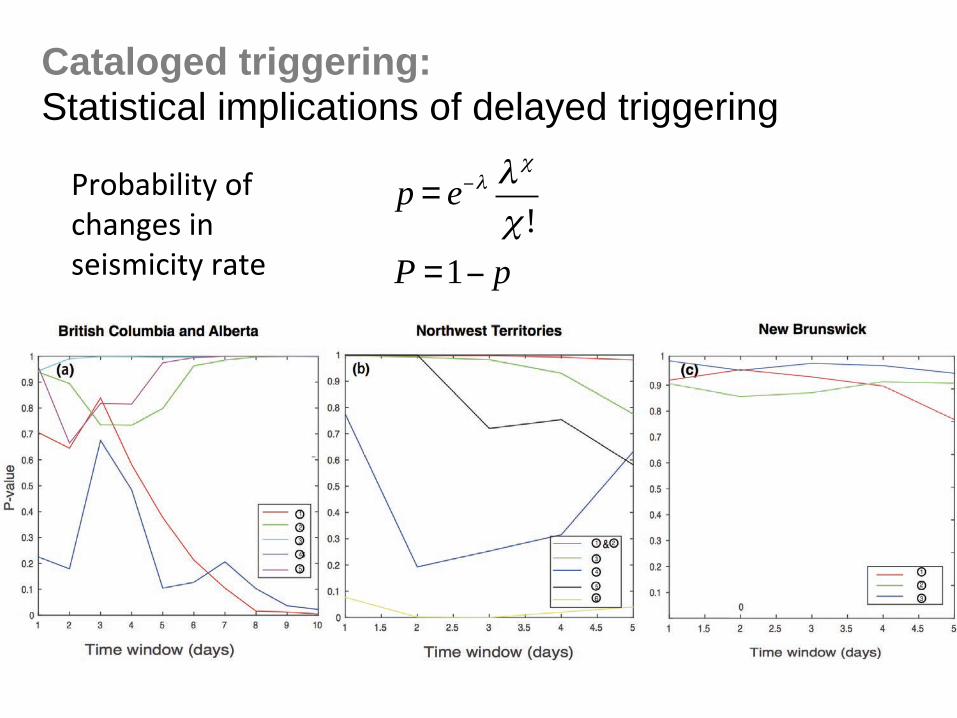
Cataloged triggering: Statistical implications of delayed triggering
p = e!! !"
" !P =1! p
.(-#%#)E),Q&-J&$/%*+";&)*&;");R)$),Q&(%,"&
N@,@9/=*<%,$(==*$('=%
N@,@9/=*<%,$(==*$('=%
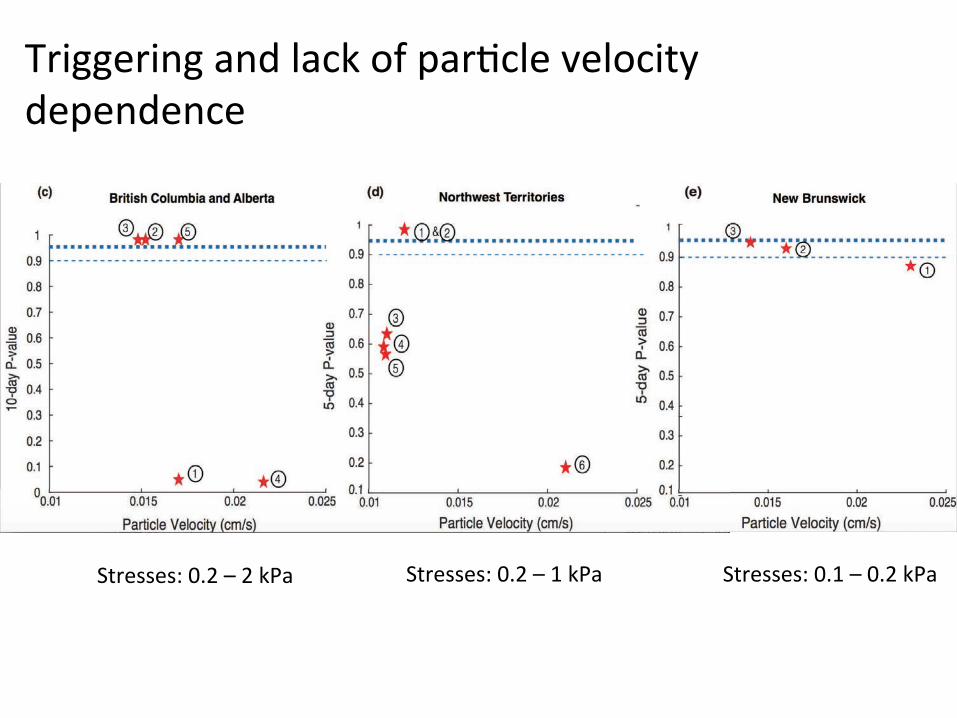
?()++"()*+&%*<&E%$M&-J&I%(S$E"&["E-$),Q&<"I"*<"*$"&&
H,(";;";X&8N7&F&A&M.%&H,(";;";X&8N7&F&7&M.%& H,(";;";X&8NA&F&8N7&M.%&
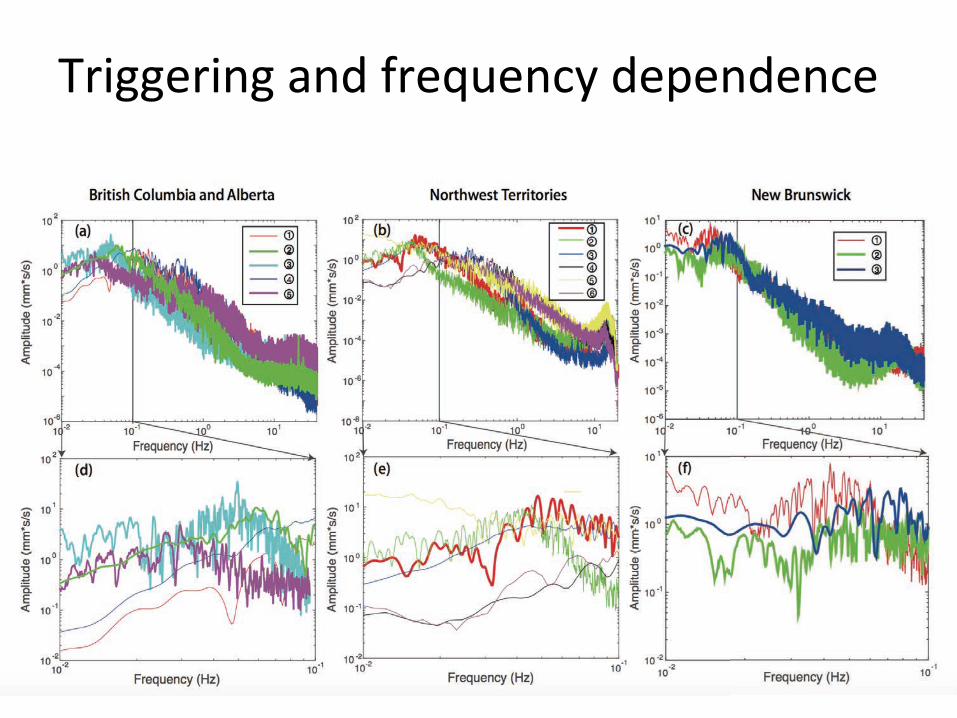
?()++"()*+&%*<&J("LK"*$Q&<"I"*<"*$"&
!118˚30' !118˚00' !117˚30' !117˚00'
54˚00'
54˚30'
CRANE network RAVEN network TD network CN networkHypoDD relocations Catalogue locations
M 1 M 2 M 3 M 4Wells Cities
Fox CreekJan 23, 2015
June 13, 2015
!120˚ !112˚
50˚
52˚
54˚
56˚
58˚
CRANE network RAVEN network TD network CN networkHypoDD relocations Catalogue locations
M 1 M 2 M 3 M 4Wells Cities
B.C.
U.S.A.
Alberta
Fox Creek
Edmonton
7$/S*$?*+%/:%*@$,#B"@C*+X&&&/Q<(%KE)$&J(%$,K()*+&)*<K$"<&"["*,;&
54˚00'
54˚30'
Fox Creek
June 13, 2015
CRANE network RAVEN network TD network CN networkCRANE network RAVEN network TD network CN networkCRANE network RAVEN network TD network CN networkHypoDD relocations Catalogue locationsHypoDD relocations Catalogue locationsHypoDD relocations Catalogue locations
M 1 M 2 M 3 M 4M 1 M 2 M 3 M 4M 1 M 2 M 3 M 4
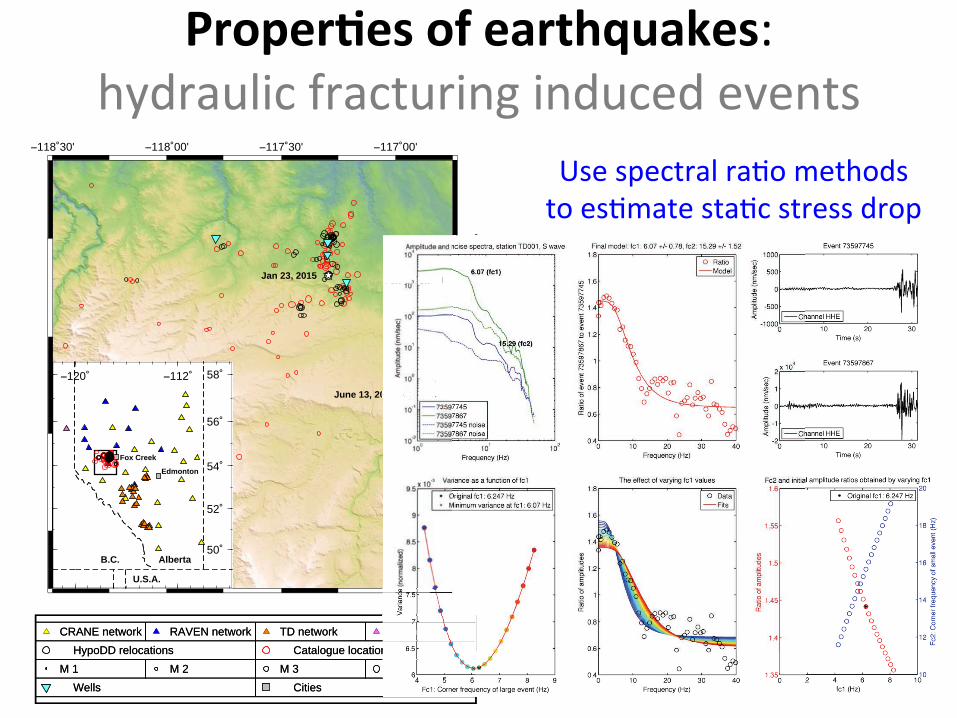
2;"&;I"$,(%E&(%S-&R",/-<;&,-&";SR%,"&;,%S$&;,(";;&<(-I&
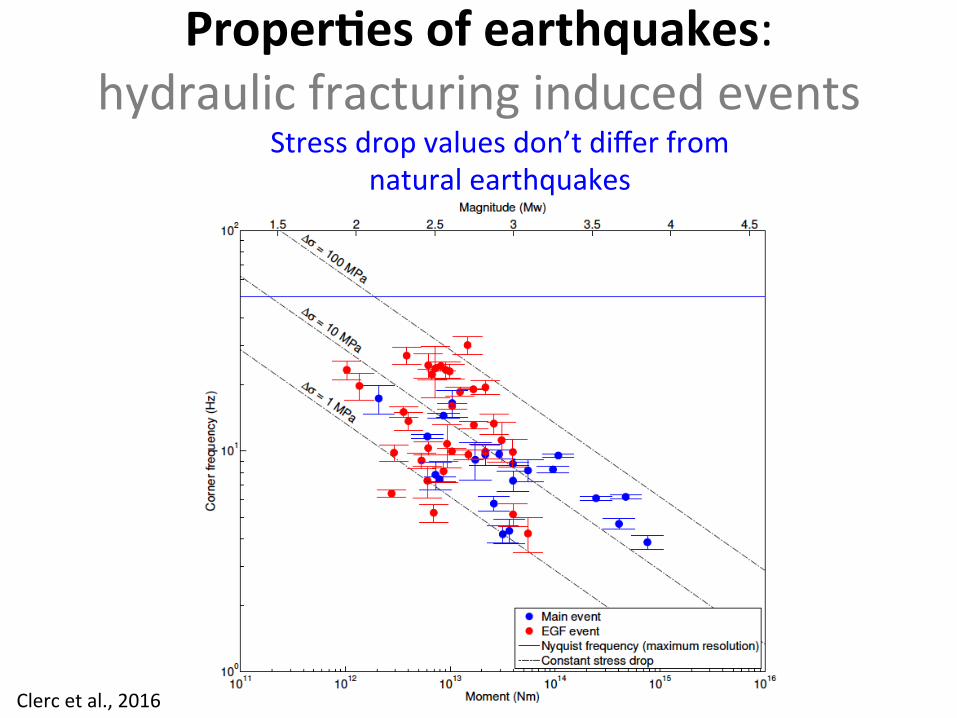
Proper?esofearthquakes:hydraulicfracturinginducedevents
Stressdropvaluesdon’tdifferfromnaturalearthquakes
Clercetal.,2016
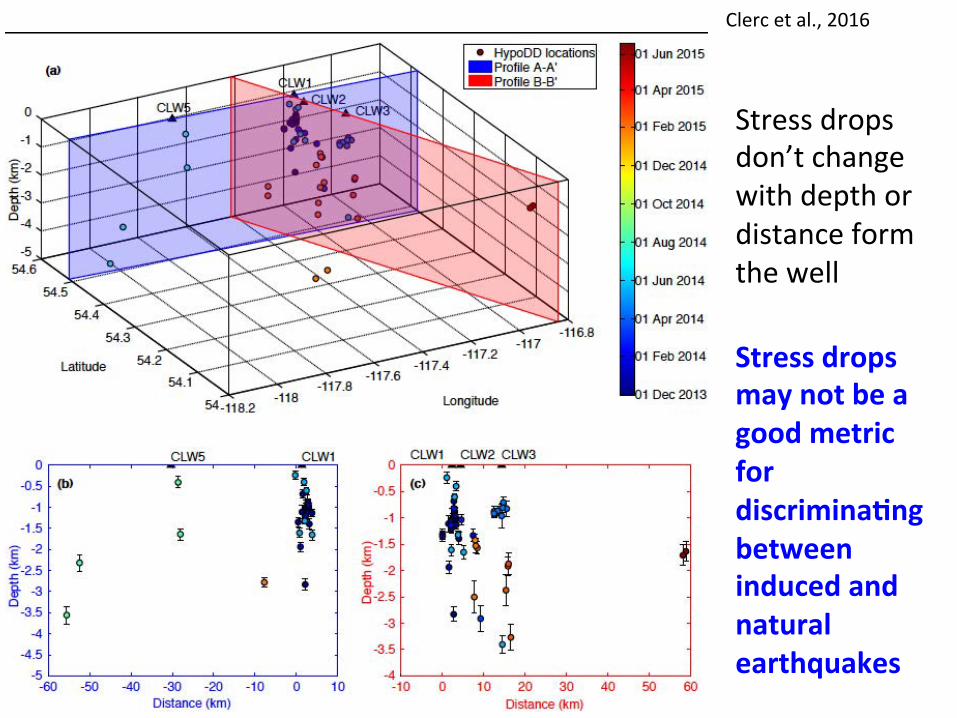
Stressdropsdon’tchangewithdepthordistanceformthewell
Stressdropsmaynotbeagoodmetricfordiscrimina?ngbetweeninducedandnaturalearthquakes
Clercetal.,2016
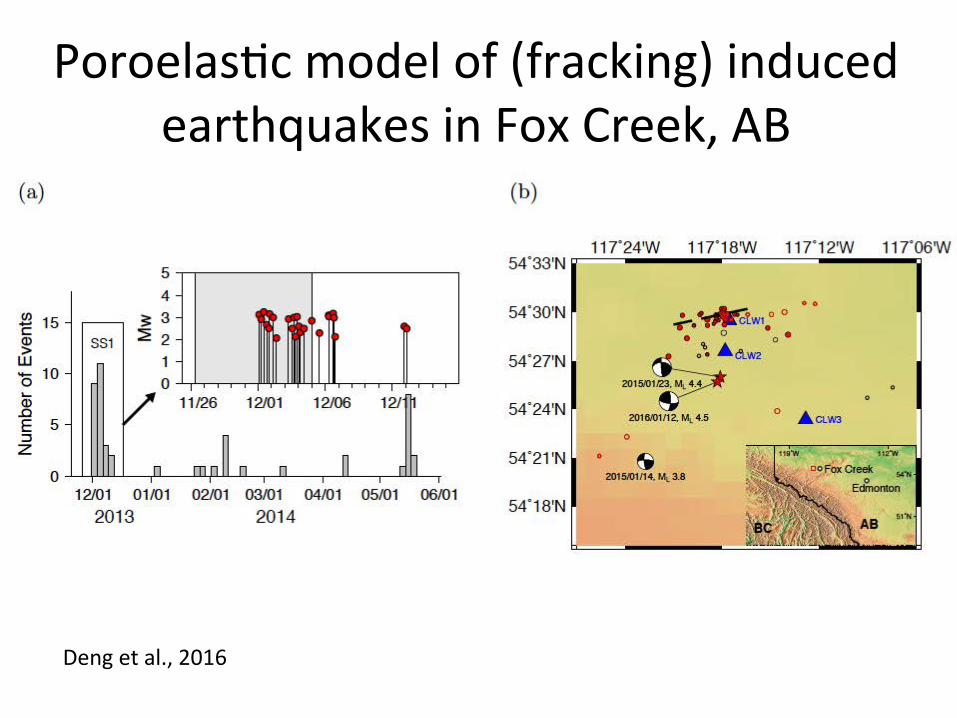
PoroelasScmodelof(fracking)inducedearthquakesinFoxCreek,AB
Dengetal.,2016
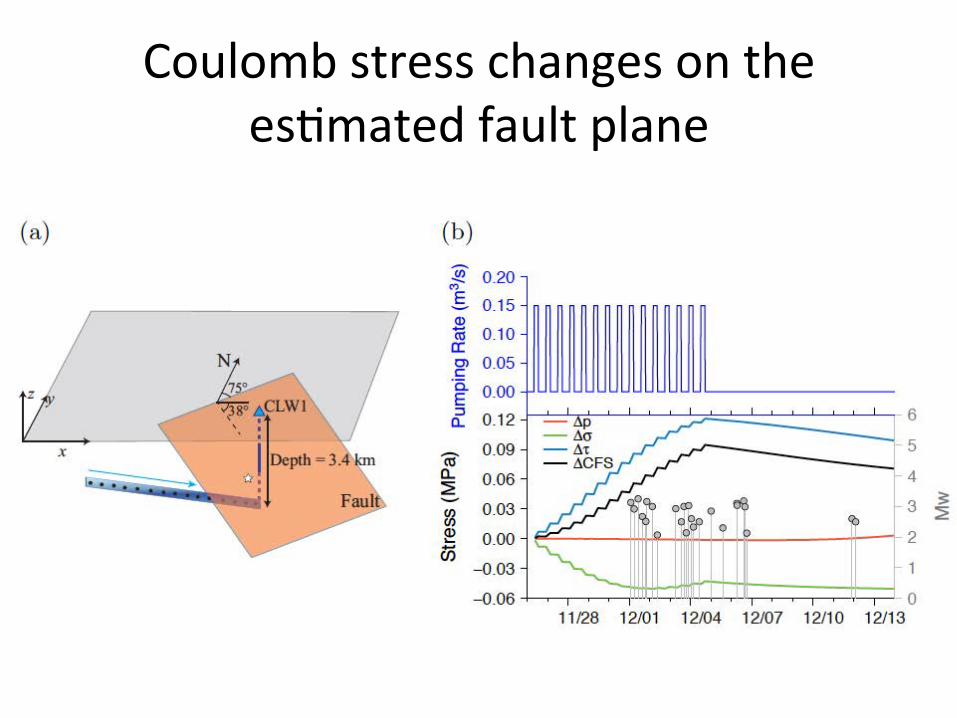
CoulombstresschangesontheesSmatedfaultplane
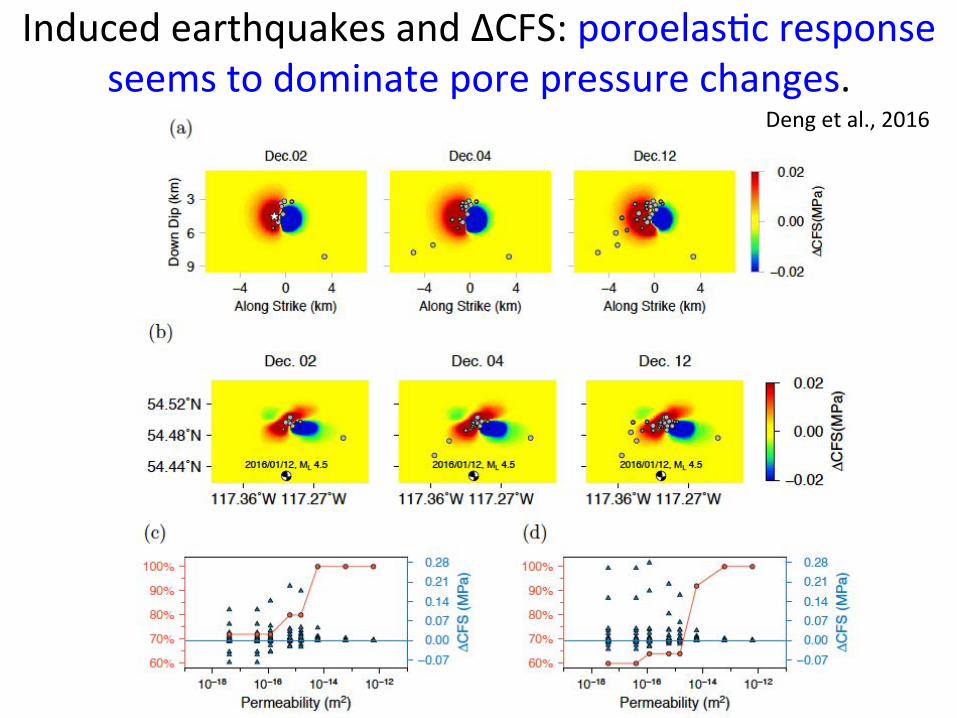
InducedearthquakesandΔCFS:poroelasScresponseseemstodominateporepressurechanges.
Dengetal.,2016
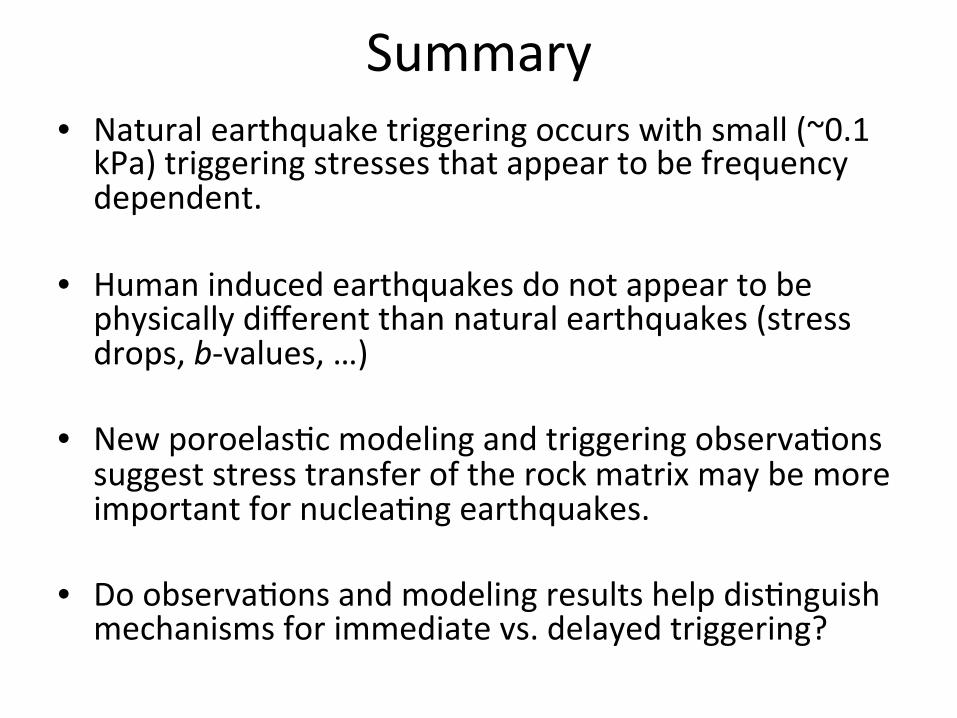
Summary• Naturalearthquaketriggeringoccurswithsmall(~0.1kPa)triggeringstressesthatappeartobefrequencydependent.
• Humaninducedearthquakesdonotappeartobephysicallydifferentthannaturalearthquakes(stressdrops,b-values,…)
• NewporoelasScmodelingandtriggeringobservaSonssuggeststresstransferoftherockmatrixmaybemoreimportantfornucleaSngearthquakes.
• DoobservaSonsandmodelingresultshelpdisSnguishmechanismsforimmediatevs.delayedtriggering?
&&
X/$C('=%/'%"'<*$+,@'<('=%#/W%Y"(<+%('Y"*'0*%$"S,"$*%@,%@99%<*S,#+%('%,#*%:@"9,%G/'*Z%,$*1/$%H<**SKM%*@$,#B"@C*+%H(',*$1*<(@,*%@'<%+#@99/WK[%!*9@,*%,/%=*/9/=(0@9%0#@$@0,*$(+?0+%,/%"'<*$+,@'<%
1*0#@'(0@9%S$/0*++[%%%!"#$%&'()&*+)%&,-'.%)$/".$%01\%
X/$C('=%/'%"'<*$+,@'<('=%#/W%
!*+"9,%/:%@==$*++()*9F%0"$(/"+%0/W+%