recap data part 2: requests
DESCRIPTION
ReCAP Data Part 2: Requests. Zack Lane ReCAP Coordinator July 2011. ReCAP Columbia University. Findings: Requests. Request volume grew each year from the opening of ReCAP until FY09 Since FY09 the total has grown very slowly Impact of mass digitization is unknown - PowerPoint PPT PresentationTRANSCRIPT

Zack LaneReCAP Coordinator
July 2011
ReCAPColumbia University

ReCAPColumbia University
Request volume grew each year from the opening of ReCAP until FY09
Since FY09 the total has grown very slowly Impact of mass digitization is unknown Monthly requests are in phase with the
academic calendar Net decline from busy to slow months is
approximately 33% Collections are increasingly renewed Average user requests follow 80/20 rule

The terms request and retrieval are used interchangeably in most ReCAP documentation
ReCAP tracks retrievals; CUL tracks requests
There is not a one-to-one correspondence Majority of data corresponds Since granular data is available only for
requests, ReCAP Coordinator uses it for analysis
ReCAPColumbia University
ReCAPColumbia University
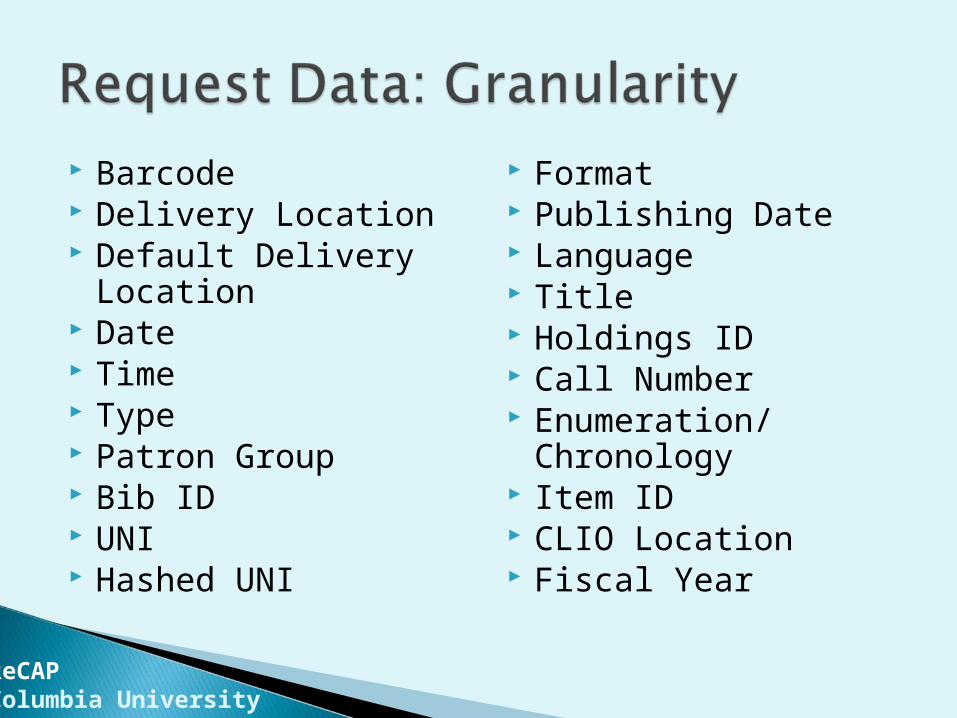
Barcode Delivery Location Default Delivery
Location Date Time Type Patron Group Bib ID UNI Hashed UNI
Format Publishing Date Language Title Holdings ID Call Number Enumeration/
Chronology Item ID CLIO Location Fiscal Year
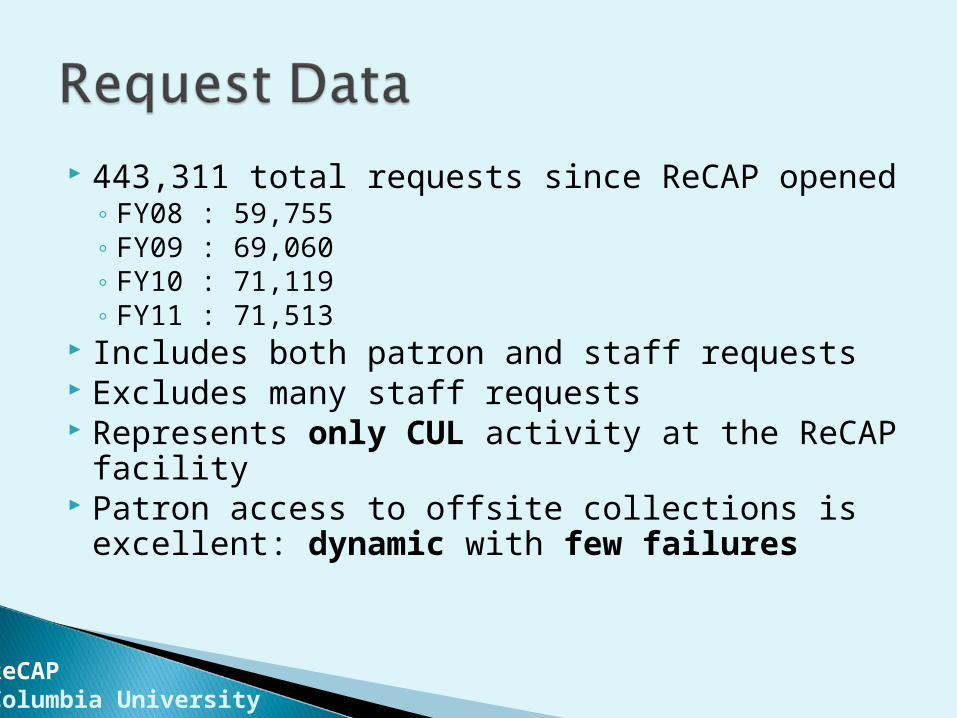
443,311 total requests since ReCAP opened◦ FY08 : 59,755◦ FY09 : 69,060◦ FY10 : 71,119◦ FY11 : 71,513
Includes both patron and staff requests Excludes many staff requests Represents only CUL activity at the ReCAP
facility Patron access to offsite collections is
excellent: dynamic with few failures
ReCAPColumbia University
ReCAPColumbia University

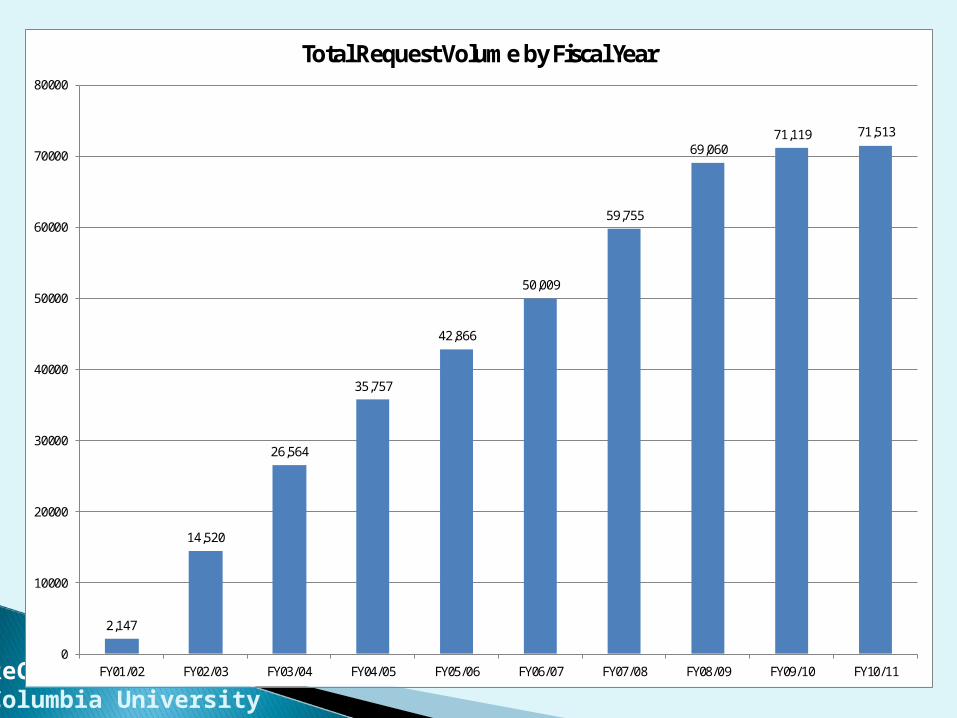
Every year CUL accessions more collections at ReCAP
With more collections at ReCAP, patrons have requested more items
Data does not include some staff requests and the Google Book Project
Volume did not significantly increase between FY09 and FY10
This may be attributable to increased renewal of offsite collections
ReCAPColumbia University
ReCAPColumbia University
2,147
14,520
26,564
35,757
42,866
50,009
59,755
69,06071,119 71,513
0
10000
20000
30000
40000
50000
60000
70000
80000
FY01/02 FY02/03 FY03/04 FY04/05 FY05/06 FY06/07 FY07/08 FY08/09 FY09/10 FY10/11
Total Request Volume by Fiscal Year

Chart compares total volume of charges to renewals for ReCAP collections
Graduate students and Faculty request more offsite collections than Undergraduates
Graduate students and especially Faculty have higher renewal/charge ratios
Over time, these two patron groups tend to renew more than charge
CUL may expect to see steady or decreasing request volume as a result
ReCAPColumbia University

ReCAPColumbia University
0
5000
10000
15000
20000
25000
30000
35000
40000
45000
FY03/04 FY04/05 FY05/06 FY06/07 FY07/08 FY08/09 FY09/10 FY10/11
Circulation of OFFSITE Collections: Charges vs Renewals
Offsite - - - Sum of CHARGES
Offsite - - - Sum of RENEWALS

Request volume is in phase with the academic calendar
Busiest months◦ Fall: October-November◦ Spring: February-April
Reduced volume between terms in Winter and Summer
In FY11 the busiest and slowest months were:◦ October: 7,195◦ May: 4,637
ReCAPColumbia University

ReCAPColumbia University
0
1000
2000
3000
4000
5000
6000
7000
80003/
1/20
02
6/1/
2002
9/1/
2002
12/1
/200
2
3/1/
2003
6/1/
2003
9/1/
2003
12/1
/200
3
3/1/
2004
6/1/
2004
9/1/
2004
12/1
/200
4
3/1/
2005
6/1/
2005
9/1/
2005
12/1
/200
5
3/1/
2006
6/1/
2006
9/1/
2006
12/1
/200
6
3/1/
2007
6/1/
2007
9/1/
2007
12/1
/200
7
3/1/
2008
6/1/
2008
9/1/
2008
12/1
/200
8
3/1/
2009
6/1/
2009
9/1/
2009
12/1
/200
9
3/1/
2010
6/1/
2010
9/1/
2010
12/1
/201
0
3/1/
2011
6/1/
2011
Monthly Request Volume: FY02-FY11

ReCAPColumbia University
32,965 patrons have placed at least one request
Most frequent requesters are staff, requesting for both patron and internal purpose
9.8 requests per user (excluding top staff) Dividing users into between 10+ and <10
◦ 10+ account for 17.3% of population and 78.3% of all requests
◦<10 account for 82.7% of population and 21.7% of all requests
More information about data sets can be found on the ReCAP Data Center website
Primary data categories include: accession, retrieval, delivery and circulation
Tailored data sets and analysis will be provided to staff via the ReCAP Coordinator
Please see the main ReCAP website for general information about CUL procedures and systems
ReCAPColumbia University