recapitulating muscle disease phenotypes with myotonic...
TRANSCRIPT

© 2018. Published by The Company of Biologists Ltd.
This is an Open Access article distributed under the terms of the Creative Commons Attribution License
(http://creativecommons.org/licenses/by/3.0), which permits unrestricted use, distribution and reproduction in any medium provided that the original work is properly attributed.
Recapitulating muscle disease phenotypes with myotonic dystrophy 1 iPS
cells: a tool for disease modeling and drug discovery
Ricardo Mondragon-Gonzalez1,2 and Rita C.R. Perlingeiro1*
1Lillehei Heart Institute, Department of Medicine, University of Minnesota, Minneapolis, MN, USA
2Departamento de Genética y Biología Molecular, Centro de Investigación y de Estudios
Avanzados del IPN (CINVESTAV-IPN), México, D.F
* Correspondence
Rita C.R. Perlingeiro PhD
Lillehei Heart Institute, University of Minnesota
4-128 CCRB, 2231 6th St. SE, Minneapolis, MN 55455, USA
E-mail address: [email protected]
Phone: 612 625 4984, Fax: 612 301 8298
D
isea
se M
ode
ls &
Mec
hani
sms
• D
MM
• A
ccep
ted
man
uscr
ipt
http://dmm.biologists.org/lookup/doi/10.1242/dmm.034728Access the most recent version at First posted online on 13 June 2018 as 10.1242/dmm.034728

Keywords:
Myotonic dystrophy, induced pluripotent stem (iPS) cells, skeletal myogenesis, muscular dystrophy, PAX7,
RNA foci
ABSTRACT
Myotonic Dystrophy 1 (DM1) is a multi-system disorder primarily affecting the central nervous system,
heart and skeletal muscle. It is caused by an expansion of the CTG trinucleotide repeats in the 3’
untranslated region of the DMPK gene. Although patient myoblasts have been used for studying the disease
in vitro, the invasiveness as well as the low accessibility to muscle biopsies motivate the development of
alternative reliable myogenic models. Here, we established two DM1 iPS cell lines from patient-
derived fibroblasts, and using the PAX7 conditional expression system, differentiated these into
myogenic progenitors, and subsequently, terminally differentiated myotubes. Both DM1 myogenic
progenitors and myotubes were found to express the intranuclear RNA foci exhibiting
sequestration of MBNL1. Moreover, we found the DM1-related mis-splicing, namely BIN1 exon
11 in DM1 myotubes. We use this model to test a specific therapy, antisense oligonucleotide
treatment, and find that this efficiently abolished RNA foci and rescued BIN1 mis-splicing in DM1
iPS cell-derived myotubes. Together, our results demonstrate that myotubes derived from DM1
iPS cells recapitulate the critical molecular features of DM1 and are sensitive to ASO treatment,
confirming that these cells can be used for in vitro disease modeling and candidate drug testing or
screening.
Dis
ease
Mo
dels
& M
echa
nism
s •
DM
M •
Acc
epte
d m
anus
crip
t

INTRODUCTION
Myotonic Dystrophy 1 (DM1) is an autosomal dominant multi-systemic disorder that causes
myotonia and progressive muscle weakness and wasting. DM1 is the most common type of adult-
onset muscular dystrophy worldwide (1/8,000) (Harper, 2001), and it is caused by a CTG triplet
repeat expansion within the 3’UTR of the dystrophia myotonica protein kinase (DMPK) gene on
chromosome 19 q13.3 (Mahadevan et al., 1992). Although the progression of the disease is
variable among patients, in general the severity of the symptoms is directly proportional to the
length of the CTG repeat expansion and inversely proportional to the age of onset (Yum et al.,
2017). Various molecular events related to the CTG repeat expansion have been associated with
the disease phenotype (Klesert et al., 2000, Reddy et al., 1996, Ho et al., 2005), but the most
relevant is a toxic RNA gain-of-function of the DMPK mutant transcripts (Mankodi et al., 2000).
mRNAs containing expanded CUG repeats fold into extended stem-loop structures that form RNA
foci (Taneja et al., 1995, Napierala and Krzyzosiak, 1997, Tian et al., 2000). These RNA foci are
retained in the nucleus and interact with RNA binding proteins, such as Staufen1, hnRNP H and
members of the MBNL family (Ravel-Chapuis et al., 2012, Paul et al., 2006, Miller et al., 2000).
Sequestration of the splicing factor MBNL1 by the RNA foci, which leads to splicing disruption
of MBNL1 target genes, is the main molecular feature associated with DM1 skeletal muscle
pathology (Meola and Cardani, 2015, Tang et al., 2012, Fugier et al., 2011). Yet, DM1 is a complex
disease that remains to be fully understood.
Myoblasts obtained from patient muscle biopsies have been widely used to study DM1 and
other muscular diseases in vitro (Arandel et al., 2017, Pantic et al., 2016). However, performing a
biopsy is an invasive procedure and samples are usually not easy to access. Thus, it has been of
Dis
ease
Mo
dels
& M
echa
nism
s •
DM
M •
Acc
epte
d m
anus
crip
t

major interest for the field to generate alternative myogenic models that can be reliably used for
in vitro disease modeling and/or drug screening purposes. Reprogramming of somatic cells to a
pluripotent state, known as induced pluripotent stem (iPS) cells, provides the possibility of
differentiating patient-specific iPS cells into multiple lineages (Takahashi et al., 2007), including
skeletal muscle (Darabi et al., 2012). Furthermore, iPS cells can be expanded indefinitely, which
makes them a robust cell source that overcomes the limited expansion potential of patient-derived
myoblasts or fibroblasts for high-throughput drug screening.
Reprogramming of DM1 patient-derived somatic cells to iPS cells has been previously
described to study the central nervous system (Ueki et al., 2017, Yanovsky-Dagan et al., 2015, Xia
et al., 2013, Du et al., 2013), but to date, studies aiming to model the DM1 skeletal muscle
pathology are still lacking. To fill this gap, here we reprogrammed DM1 patient fibroblasts into
iPS cells, and evaluated whether differentiation of DM1 iPS cells into the myogenic lineage would
recapitulate the molecular features of the disease. The results we show here demonstrate that this
is the case, and that DM1 iPS cells represent a valuable model to study DM1 muscle pathogenesis.
RESULTS
Characterization of DM1 patient-derived fibroblasts and iPS reprogramming
As a first step in assessing the potential of patient-specific iPS cell-derived myogenic derivatives
for the in vitro modeling of DM1, we reprogrammed skin fibroblast samples obtained from two
diagnosed DM1 patients into iPS cells. Sample DM1-1 was obtained from a 35-year-old male
patient bearing an expansion of 716 CTG repeats, whereas DM1-2 was obtained from an 18 year-
old-male patient with 473 CTG repeats, both in blood cells. The molecular features of DM1 were
Dis
ease
Mo
dels
& M
echa
nism
s •
DM
M •
Acc
epte
d m
anus
crip
t

characterized in both fibroblasts samples. Southern blot analysis showed an expansion of about
2,000 and 1,500 CTG repeats in DM1-1 and DM1-2, respectively (Fig. 1A), which suggests
mosaicism of the repeat length in somatic cells. Furthermore, RNA-FISH analysis using a Cy3-
labeled (CAG)7 probe showed the presence of typical intranuclear RNA foci (Fig. 1B-C).
We then reprogrammed DM1-1 and DM1-2 fibroblasts using the Sendai virus transduction
approach. Three weeks after transduction, iPS cell colonies showing typical embryonic stem cell-
like colony morphology were picked and expanded for 10 passages (Supplementary Fig. 1A). For
each patient-specific iPS cell line, three clones were selected for pluripotency characterization.
Gene expression analysis demonstrated that DM1 iPS cells display expression levels of the
endogenous pluripotency factors OCT3/4, SOX2 and NANOG similar to control ES cells
(Supplementary Fig. 1B). RNA levels for the reprogramming Sendai virus (SeV) were detected
only as a faint band on day 7 after transduction but were absent in expanded iPS cells, as expected
for this non-integrating vector. Expression of the endogenous pluripotency factors was confirmed
at the protein level (Supplementary Fig. 1C). The pluripotent capabilities of DM1-1 and DM1-2
iPS cells were validated by their ability to develop teratomas upon their subcutaneous injection
into immunodeficient mice (Supplementary Fig. 1D). Importantly, no karyotypic abnormalities
were found in generated DM1 iPS cells (Supplementary Fig. 1E). Using RNA FISH, we confirmed
the expression of the intranuclear RNA foci in both DM1 iPS cell lines (Fig. 1D-E).
Differentiation of DM1 iPS cells into skeletal myogenic progenitors
Next, we differentiated DM1-1 and DM1-2 iPS cells towards the myogenic lineage using the
doxycycline-inducible PAX7 system (iPAX7), as we have previously described (Darabi et al.,
2012). To confirm whether DM1 iPS cell-derived patient-specific myogenic progenitors represent
Dis
ease
Mo
dels
& M
echa
nism
s •
DM
M •
Acc
epte
d m
anus
crip
t

a valid model to study DM1-related features in vitro, we assessed the molecular phenotype of the
disease in these cells. RNA FISH analysis revealed the presence of intranuclear RNA foci in both
DM1-1 and DM1-2 myogenic progenitors (Fig. 2A). The average number of RNA foci per nucleus
was higher in DM1 myogenic progenitors than in fibroblasts and iPS cells for both patient-specific
cell lines (Fig. 2B). As discussed above, another key molecular feature of DM1 is the intranuclear
sequestration of MBNL1 by the RNA foci. To test whether DM1 iPS cell-derived myogenic
progenitors recapitulate this process, DM1-1- and DM1-2 iPS cell-derived myogenic progenitors
were evaluated for MBNL1 expression. We performed RNA FISH followed by immunostaining
with an antibody against MBNL1 in the myogenic progenitors. In control myogenic progenitors,
we observed a diffused distribution of MBNL1 throughout the nucleus and cytoplasm, whereas
DM1-1 and DM1-2 cells showed a pattern of staining that co-localized with the RNA foci,
confirming MBNL1 sequestration in DM1 myogenic progenitors (Fig. 2C). We also observed
RNA foci in the cytoplasm of these cells, in agreement with previous studies involving other
affected DM1 cell types (Pettersson et al., 2014, Dansithong et al., 2008).
Terminal differentiation of DM1 iPS cells-derived myogenic progenitors into myotubes
DM1-1 and DM1-2 iPS cell-derived myogenic progenitors were subsequently differentiated into
myotubes expressing myosin heavy chain (MYHC), a marker of myogenic terminal differentiation,
by culturing them to confluency, and then switching to a low nutrient medium (Supplementary
Fig. 2). RNA-FISH analysis of DM1-1 and DM1-2 myotubes showed the presence of intranuclear
RNA foci (Fig. 3A). The number of foci in the myotubes was higher compared to the cell stages
previously evaluated, particularly for DM1-2, in which we consistently found about 14 foci per
nucleus (Fig. 3B). Next, we analyzed the distribution of MBNL1 in DM1 myotubes and observed
Dis
ease
Mo
dels
& M
echa
nism
s •
DM
M •
Acc
epte
d m
anus
crip
t

co-localization between MBNL1 and the RNA foci, therefore confirming the sequestration of this
splicing factor (Fig. 3C).
Reversal of DM1 molecular phenotype by antisense oligonucleotide treatment of DM1 iPS
cells-derived myotubes
The generation of DM1 iPS cell-derived myotubes provides the possibility of using these cells as
an alternative to primary myoblasts for drug screening purposes. Therefore, we evaluated the
effectiveness of treating DM1-1 and DM1-2 myotubes with 2’-OMePT(CAG)7 antisense
oligonucleotides (ASO), which have been shown to abolish the RNA foci in myotubes
differentiated from primary myoblasts (Mulders et al., 2009). One day after ASO treatment, we
observed a significant reduction in the number of nuclei containing RNA foci in DM1-1 and DM1-
2 myotubes (Fig. 4A-B). Subsequently, we assessed whether this reduction was sufficient to rescue
the mis-splicing of BIN1 exon 11, which has been related to myopathy, T tubule alterations, and
was also found to be among the genes with higher splicing disruption in DM1(Thomas et al., 2017,
Fugier et al., 2011). We observed that upon ASO treatment of DM1-1 and DM1-2 myotubes, there
was a significant rescue in the inclusion of BIN1 exon 11, which correlated with the reduction of
RNA foci (Fig. 4C-D). Of note, ASO treatment had no effect on the ability of DM1-1 and DM1-2
myogenic progenitors to differentiate into myotubes (Supplementary Fig. 3A-B).
Overall, our results demonstrate that myogenic progenitors and myotubes differentiated
from patient-specific DM1 iPS cells through the iPAX7-EB protocol display the key molecular
features of DM1, such as intranuclear RNA foci, MBNL1 sequestration and subsequent splicing
disruption. Hence, these cells represent a myogenic model that can be used as an alternative to
primary myoblasts for studying the disease pathogenesis and/or drug screening purposes.
Dis
ease
Mo
dels
& M
echa
nism
s •
DM
M •
Acc
epte
d m
anus
crip
t

DISCUSSION
Patient-derived myoblasts have been widely used for in vitro modeling of muscular diseases.
However, expansion of muscle primary cells is limited by senescence and their terminal
differentiation capabilities decrease upon passaging. Although establishing patient-specific
immortalized myoblasts might overcome some of these hurdles, these have been modified to alter
their cell cycle, and thus this aspect of cell physiology is abnormal. The reprogramming of human
somatic cells into iPS cells by Yamanaka and colleagues (Takahashi et al., 2007) emerged as a
promising tool to recapitulate muscle diseases in the Petri dish since these cells can be expanded
indefinitely and are able to differentiate into several tissues, including skeletal muscle.
To date, several protocols have been established to promote the myogenic differentiation
of iPS cells. One of the main advantages of our method based on the conditional expression of
PAX7 is the generation of myogenic progenitors that can be robustly expanded in vitro (Darabi et
al., 2012), as opposed to protocols based on MYOD induction, which give rise directly to more
differentiated muscle cells, and accordingly, with limited proliferation ability (Tanaka et al., 2013).
Furthermore, iPAX7 myogenic progenitors can be frozen/thawed by conventional methods and
still efficiently differentiate into myotubes, which allows for the generation of large stocks of cells
from the same preparation for further experiments. This feature is highly relevant for a myogenic
model as it makes it a suitable source for high-throughput drug screening.
Dis
ease
Mo
dels
& M
echa
nism
s •
DM
M •
Acc
epte
d m
anus
crip
t

In this study, we differentiated DM1 patient-specific iPS cells into the myogenic lineage
(Darabi and Perlingeiro, 2016) to determine whether these cells could recapitulate the main
molecular events of DM1, and therefore be considered as a valuable alternative myogenic model
of the disease. DM1 patient-specific iPS cells efficiently differentiated into myogenic progenitors
able to terminally differentiate into MYHC+ myotubes. We found DM1 iPS cell-derived myotubes
to display typical expression of intranuclear RNA foci along with sequestration of MBNL1, which
is the main molecular event associated with DM1 phenotype. This was further corroborated by
identifying the splicing disruption of BIN1, a gene which mis-splicing has been related to DM1
myopathy (Fugier et al., 2011). An important aspect to be evaluated in a model is its ability to
validate previously tested drugs. In this regard, DM1 iPS cell-derived myotubes treated with ASO
showed a significant decrease in RNA foci along with a significant rescue of BIN1 exon 11
splicing.
An important aspect to be taken in consideration when studying DM1 in vitro and in vivo
is the instability of the CTG expansions as these may expand or contract depending on the cell
type or upon cell passaging in vitro (Musova et al., 2009, Nakamori et al., 2011, Monckton et al.,
1995, Wong et al., 1995). Two recent publications making use of DM1 iPS cells have focused on
this feature, and both concluded that despite increased instability of the repeats during the
reprogramming of fibroblasts into iPS cells, this is minimized upon differentiation of DM1 iPS cells into
specific lineages (Ueki et al., 2017, Du et al., 2013).
Taken together, we demonstrate the efficient differentiation of two newly reprogrammed
DM1 patient-specific iPS cell lines into skeletal myogenic progenitors and subsequent myotube
derivatives, which faithfully recapitulate key molecular events of DM1, making them suitable for
in vitro disease studies and drug testing.
Dis
ease
Mo
dels
& M
echa
nism
s •
DM
M •
Acc
epte
d m
anus
crip
t

MATERIAL AND METHODS
Patient samples
De-identified cryopreserved skin fibroblasts from two diagnosed DM1 patients (DM1-1 and DM1-
2) were obtained through the Paul and Sheila Wellstone Muscular Dystrophy Center at the
University of Minnesota, according to procedures approved by the Institutional Review Board of
the University of Minnesota. Cells were expanded in high-glucose DMEM medium containing
10% FBS, 1% GlutaMax, 1% Penicillin-Streptomicin, 1% Sodium pyruvate and 1% Non-essential
amino acids in under standard culture conditions.
Reprogramming
DM1 fibroblasts were reprogrammed into iPS cells using the CytoTuneTM -iPS 2.0 Sendai
Reprogramming kit (Thermo Fisher Scientific) using feeder-free conditions according to
manufacturer’s instructions. Three to four weeks following the transduction of pluripotency
factors, iPS cell colonies were picked, transferred to fresh dishes and expanded for 10 passages to
eliminate the non-integrative Sendai virus from the cultures. DM1 iPS cells were passaged with
ReLeSRTM (STEMCELL Technologies) and cultured on Matrigel-coated dishes using mTeSRTM1
medium (STEMCELL Technologies). For each patient-derived line (DM1-1 and DM1-2), three
clones showing classic pluripotent stem cell colony morphology were used for pluripotency
characterization, and one clone was used for subsequent studies.
Dis
ease
Mo
dels
& M
echa
nism
s •
DM
M •
Acc
epte
d m
anus
crip
t

Teratoma studies
Animal experiments were carried out according to protocols approved by the University of
Minnesota Institutional Animal Care and Use Committee. iPS cells were injected at 1.5x10^6 in
the quadriceps of 8 weeks old male NOD-scid IL2Rgnull (NSG – Jackson lab) mice. Before
injection, cells were resuspended in 1:1 solution DMEM-F12 and matrigel (final volume including
cells: 65µl).
Myogenic differentiation
DM1-1 and DM1-2 iPS cells were transduced with a doxycycline-inducible PAX7 system (iPAX7)
and differentiated towards the myogenic lineage as previously described (Darabi and Perlingeiro,
2016). DM1 iPAX7-iPS cells were dissociated with Accumax (Innovative Cell Technologies) and
1e6 cells were cultured in a 60 mm petri dish using mTeSRTM1 medium supplemented with 10 µM
Y-27632 (ROCK inhibitor) and incubated on a shaker (day 0). On day 2, medium was replaced
with EB differentiation medium (15% FBS, 10% Horse Serum, 1% KnockOut Serum
ReplacementTM (KOSR), 1% GlutaMax, 1% Penicillin-Streptomicin, 50 µg/ml ascorbid acid and
4.5 mM monothioglycerol in IMDM) supplemented with 10 µM Y-27632 and 10 µM
CHIR990217 (GSK3 inhibitor). Following incubation of EBs in suspension for three days, the
medium was replaced with fresh EB differentiation medium containing 10 µM Y-2763 to
withdraw GSK3i treatment. On day 7, EBs were collected and plated on gelatin-coated flasks to
promote their adhesion and expansion as monolayer using EB differentiation medium
supplemented with 10 ng/ml human basic fibroblast growth factor (bFGF). On day 10, medium
was replaced with fresh EB differentiation medium supplemented with 10 ng/ml human bFGF +
1 µg/ml Doxycycline to promote PAX7-GFP expression. On day 14, GFP+ cells (PAX7+,
Dis
ease
Mo
dels
& M
echa
nism
s •
DM
M •
Acc
epte
d m
anus
crip
t

myogenic progenitors) were sorted and expanded on gelatin coated flasks using the same medium.
DM1 or control iPS cell-derived myogenic progenitors were terminally differentiated into
myotubes by growing them to confluency and then switching to terminal differentiation medium
(20% KOSR, 1% GlutaMax, 1% Penicillin-Streptomicin in KnockOutTM DMEM). Myotube
characterization was performed after 5 days of terminal differentiation. Throughout the study, we
used a previously established and validated human iPAX7-iPS cell line(Darabi et al., 2012) as a
non-disease control.
Southern blot
To determine the approximate length of the CTG triplet repeat in the DM1 fibroblasts samples,
southern blot was performed. Briefly, genomic DNA was isolated from DM1-1, DM1-2 and
control cells using the PureLinkTM Genomic DNA Mini Kit (Invitrogen). Purified gDNA was
digested with BamHI, which generates a fragment of about 1.4 kb from the 3’ region of the DMPK
gene considering a normal allele containing 20 CTG repeats. Digested gDNA was run in a 1 %
agarose gel, denatured (1.5 M NaCl, 0.5 M NaOH), neutralized (1.5 M NaCl, 0.5 M Tris-HCl, pH
7.5), blotted to a positively charged nylon membrane by capillary transfer with 20 x SSC buffer,
and fixed to the membrane by UV-crosslinking. To detect the BamHI-digested fragment spanning
the CTG repeats, a probe was design using the following primers (Fwd: 5'-
TCCCCAACCTCGATTCCCCTC-3'; Rev: 5'- GGCCACCAACCCAATGCAGC-3'). Labelling
of the probe and detection were done following the DIG High Prime DNA Labeling and Detection
Starter Kit II (Roche).
Dis
ease
Mo
dels
& M
echa
nism
s •
DM
M •
Acc
epte
d m
anus
crip
t

RNA-FISH and immunofluorescence
To detect the intranuclear RNA foci, cells grown on coverslips were fixed with 4% PFA for 10
min, permeabilized with 0.3% Triton X-100 for 15 min, and incubated with pre-hybridization
buffer solution (2 x SSC and 30% formamide in DEPC water) for 10 min at room temperature
(RT). Cells were then incubated with hybridization solution (2x SSC, 30 % formamide, 0.02%
BSA, 2 mM ribonucleoside vanadyl complex, 66 µg/ml yeast tRNA and 0.1 ng/ul of a Cy3-labeled
(CAG)7 probe in DEPC water) for 2 h at 37 °C in a humid chamber. Cells were washed twice with
pre-hybridization buffer solution for 7 min at 42 °C and two more times with 1x SSC in DEPC
water for 5 min at RT. At this point, samples were either mounted on glass slides with ProLongTM
Gold antifade reagent with DAPI (Invitrogen) or processed for immunostaining. For the later,
samples were blocked with 3% BSA in PBS for 30 min and incubated overnight with proper
primary antibody at 4 °C. The following day, cells were washed three times with PBS for 5 min
and incubated with proper secondary antibody for 1 h at RT. Cells were washed again 3x with PBS
for 5 min and mounted on glass slides as described above. Samples were analyzed by confocal
microscopy (Nikon NiE C2 upright confocal microscope).
The following antibodies were used for immunofluorescence: anti-OCT3/4 (C-10, Santa Cruz
Biotechnology; 1:50), anti-SOX2 (Y-17, Santa Cruz Biotechnology; 1:50), anti-NANOG (H-2,
Santa Cruz Biotechnology; 1:50), anti-PAX7 (PAX7, Developmental Studies Hybridoma Bank
(DSHB); 1:50), anti-MBNL 1 (3A4, Santa Cruz Biotechnology; 1:75)), anti-MYHC (MF 20,
DSHB; 1:100), Alexa Fluor 488 goat anti-Mouse IgG (Invitrogen; 1:500), Alexa Fluor 555 goat
anti-Mouse IgG (Invitrogen; 1:500).
Dis
ease
Mo
dels
& M
echa
nism
s •
DM
M •
Acc
epte
d m
anus
crip
t

RT-PCR
Samples were collected with TRIzolTM Reagent (Invitrogen) and RNA was purified using the
Direct-zolTM RNA Miniprep Plus kit (Zymo Research) following manufacturer’s instructions.
Purified RNA was quantified with NanoDrop 2000 (Thermo Scientific) and retrotranscribed using
the SuperScript VILO cDNA Synthesis Kit (Invitrogen) following manufacturer’s instructions.
cDNA was used as template for PCR using GoTaq Flexi DNA polymerase (Promega). Previously
reported primers were used for pluripotency characterization of DM1 iPS cells(Chen et al., 2013)
and for splicing analysis of BIN1 exon 11 in DM1 iPS cell-derived myotubes(Fugier et al., 2011)
Antisense oligonucleotide treatment
DM1 iPS cell-derived myogenic progenitors were seeded onto gelatin-coated plates for terminal
differentiation. On day 4 (after switching to terminal differentiation medium), myotubes were
transfected with 2 µg/ml of 2-OMe-PT-(CAG)7 antisense oligonucleotides using RNAi Max
transfection reagent as previously described (Arandel et al., 2017). Twenty-four hours after
treatment, cells were processed for RNA-FISH or RT-PCR analysis. To test the effect of ASO
treatment on myotube differentiation, DM1-1 and DM1-2 iPS-derived myogenic progenitors were
transfected with 2-OMe-PT-(CAG)7 antisense oligonucleotides one day before switching to
terminal differentiation medium, using the protocol described above. After five days in terminal
differentiation conditions, cells were fixed and processed for MYHC immunofluorescence. Plates
were imaged using the BioTek™ Cytation™ 3 Cell Imaging Multi-Mode Reader, and images were
analyzed by quantifying the ratio of % MYHC area to % DAPI area using Fiji(Schindelin et al.,
2012)
Dis
ease
Mo
dels
& M
echa
nism
s •
DM
M •
Acc
epte
d m
anus
crip
t

Statistical analysis
Statistical comparisons were done using the Mann-Whitney test in Prism 7 software (GraphPad).
p values < 0.05 were considered significant.
ACKNOWLEDGEMENTS
This project was supported by funds from the LaBonte/Shawn family and NIH grant R01
AR055299 (R.C.R.P.). R.M-G. was funded by CONACyT-Mexico (#394378). The authors thank
Joline Dalton and Peter Karachunski from the Wellstone Muscular Dystrophy Center at the
University of Minnesota for patient samples and helpful discussion. Cytogenetic analyses were
performed in the Cytogenomics Shared Resource at the University of Minnesota with support from
the comprehensive Masonic Cancer Center NIH Grant #P30 CA077598-09. Confocal imaging
analysis was done using a Nikon NiE C2 upright confocal microscope and support from Mark
Sanders at the University of Minnesota – University Imaging Centers.
CONTRIBUTIONS
R.M-G. designed and performed the research, analyzed the data and wrote the manuscript;
R.C.R.P. contributed with experimental design, interpretation of the data and wrote the manuscript.
Dis
ease
Mo
dels
& M
echa
nism
s •
DM
M •
Acc
epte
d m
anus
crip
t

REFERENCES
Arandel, L., Polay Espinoza, M., Matloka, M., Bazinet, A., De Dea Diniz, D., Naouar, N.,
Rau, F., Jollet, A., Edom-Vovard, F., Mamchaoui, K., Tarnopolsky, M., Puymirat, J., Battail,
C., Boland, A., Deleuze, J. F., Mouly, V., Klein, A. F. & Furling, D. (2017). Immortalized
human myotonic dystrophy muscle cell lines to assess therapeutic compounds. Dis Model Mech,
10, 487-497.
Chen, I. P., Fukuda, K., Fusaki, N., Iida, A., Hasegawa, M., Lichtler, A. & Reichenberger,
E. J. (2013). Induced pluripotent stem cell reprogramming by integration-free Sendai virus vectors
from peripheral blood of patients with craniometaphyseal dysplasia. Cell Reprogram, 15, 503-13.
Dansithong, W., Wolf, C. M., Sarkar, P., Paul, S., Chiang, A., Holt, I., Morris, G. E., Branco,
D., Sherwood, M. C., Comai, L., Berul, C. I. & Reddy, S. (2008). Cytoplasmic CUG RNA foci
are insufficient to elicit key DM1 features. PLoS One, 3, e3968.
Darabi, R., Arpke, R. W., Irion, S., Dimos, J. T., Grskovic, M., Kyba, M. & Perlingeiro, R.
C. (2012). Human ES- and iPS-derived myogenic progenitors restore DYSTROPHIN and improve
contractility upon transplantation in dystrophic mice. Cell Stem Cell, 10, 610-9.
Darabi, R. & Perlingeiro, R. C. (2016). Derivation of Skeletal Myogenic Precursors from Human
Pluripotent Stem Cells Using Conditional Expression of PAX7. Methods Mol Biol, 1357, 423-39.
Du, J., Campau, E., Soragni, E., Jespersen, C. & Gottesfeld, J. M. (2013). Length-dependent
CTG.CAG triplet-repeat expansion in myotonic dystrophy patient-derived induced pluripotent
stem cells. Hum Mol Genet, 22, 5276-87.
Fugier, C., Klein, A. F., Hammer, C., Vassilopoulos, S., Ivarsson, Y., Toussaint, A., Tosch,
V., Vignaud, A., Ferry, A., Messaddeq, N., Kokunai, Y., Tsuburaya, R., de la Grange, P.,
Dembele, D., Francois, V., Precigout, G., Boulade-Ladame, C., Hummel, M. C., Lopez de
Munain, A., Sergeant, N., Laquerriere, A., Thibault, C., Deryckere, F., Auboeuf, D., Garcia,
L., Zimmermann, P., Udd, B., Schoser, B., Takahashi, M. P., Nishino, I., Bassez, G., Laporte,
J., Furling, D. & Charlet-Berguerand, N. (2011). Misregulated alternative splicing of BIN1 is
associated with T tubule alterations and muscle weakness in myotonic dystrophy. Nat Med, 17,
720-5.
Harper, P. S. (2001). Myotonic Dystrophy. London: Harcourt Publishers Ltd
Ho, T. H., Bundman, D., Armstrong, D. L. & Cooper, T. A. (2005). Transgenic mice expressing
CUG-BP1 reproduce splicing mis-regulation observed in myotonic dystrophy. Hum Mol Genet,
14, 1539-47.
Klesert, T. R., Cho, D. H., Clark, J. I., Maylie, J., Adelman, J., Snider, L., Yuen, E. C.,
Soriano, P. & Tapscott, S. J. (2000). Mice deficient in Six5 develop cataracts: implications for
myotonic dystrophy. Nat Genet, 25, 105-9.
Mahadevan, M., Tsilfidis, C., Sabourin, L., Shutler, G., Amemiya, C., Jansen, G., Neville, C.,
Narang, M., Barcelo, J., O'Hoy, K. & et al. (1992). Myotonic dystrophy mutation: an unstable
CTG repeat in the 3' untranslated region of the gene. Science, 255, 1253-5.
Mankodi, A., Logigian, E., Callahan, L., McClain, C., White, R., Henderson, D., Krym, M.
& Thornton, C. A. (2000). Myotonic dystrophy in transgenic mice expressing an expanded CUG
repeat. Science, 289, 1769-73.
Meola, G. & Cardani, R. (2015). Myotonic dystrophies: An update on clinical aspects, genetic,
pathology, and molecular pathomechanisms. Biochim Biophys Acta, 1852, 594-606.
Dis
ease
Mo
dels
& M
echa
nism
s •
DM
M •
Acc
epte
d m
anus
crip
t

Miller, J. W., Urbinati, C. R., Teng-Umnuay, P., Stenberg, M. G., Byrne, B. J., Thornton, C.
A. & Swanson, M. S. (2000). Recruitment of human muscleblind proteins to (CUG)(n) expansions
associated with myotonic dystrophy. EMBO J, 19, 4439-48.
Monckton, D. G., Wong, L. J., Ashizawa, T. & Caskey, C. T. (1995). Somatic mosaicism,
germline expansions, germline reversions and intergenerational reductions in myotonic dystrophy
males: small pool PCR analyses. Hum Mol Genet, 4, 1-8.
Mulders, S. A., van den Broek, W. J., Wheeler, T. M., Croes, H. J., van Kuik-Romeijn, P.,
de Kimpe, S. J., Furling, D., Platenburg, G. J., Gourdon, G., Thornton, C. A., Wieringa, B.
& Wansink, D. G. (2009). Triplet-repeat oligonucleotide-mediated reversal of RNA toxicity in
myotonic dystrophy. Proc Natl Acad Sci U S A, 106, 13915-20.
Musova, Z., Mazanec, R., Krepelova, A., Ehler, E., Vales, J., Jaklova, R., Prochazka, T.,
Koukal, P., Marikova, T., Kraus, J., Havlovicova, M. & Sedlacek, Z. (2009). Highly unstable
sequence interruptions of the CTG repeat in the myotonic dystrophy gene. Am J Med Genet A,
149A, 1365-74.
Nakamori, M., Pearson, C. E. & Thornton, C. A. (2011). Bidirectional transcription stimulates
expansion and contraction of expanded (CTG)*(CAG) repeats. Hum Mol Genet, 20, 580-8.
Napierala, M. & Krzyzosiak, W. J. (1997). CUG repeats present in myotonin kinase RNA form
metastable "slippery" hairpins. J Biol Chem, 272, 31079-85.
Pantic, B., Borgia, D., Giunco, S., Malena, A., Kiyono, T., Salvatori, S., De Rossi, A.,
Giardina, E., Sangiuolo, F., Pegoraro, E., Vergani, L. & Botta, A. (2016). Reliable and versatile
immortal muscle cell models from healthy and myotonic dystrophy type 1 primary human
myoblasts. Exp Cell Res, 342, 39-51.
Paul, S., Dansithong, W., Kim, D., Rossi, J., Webster, N. J., Comai, L. & Reddy, S. (2006).
Interaction of muscleblind, CUG-BP1 and hnRNP H proteins in DM1-associated aberrant IR
splicing. EMBO J, 25, 4271-83.
Pettersson, O. J., Aagaard, L., Andrejeva, D., Thomsen, R., Jensen, T. G. & Damgaard, C.
K. (2014). DDX6 regulates sequestered nuclear CUG-expanded DMPK-mRNA in dystrophia
myotonica type 1. Nucleic Acids Res, 42, 7186-200.
Ravel-Chapuis, A., Belanger, G., Yadava, R. S., Mahadevan, M. S., DesGroseillers, L., Cote,
J. & Jasmin, B. J. (2012). The RNA-binding protein Staufen1 is increased in DM1 skeletal muscle
and promotes alternative pre-mRNA splicing. J Cell Biol, 196, 699-712.
Reddy, S., Smith, D. B., Rich, M. M., Leferovich, J. M., Reilly, P., Davis, B. M., Tran, K.,
Rayburn, H., Bronson, R., Cros, D., Balice-Gordon, R. J. & Housman, D. (1996). Mice lacking
the myotonic dystrophy protein kinase develop a late onset progressive myopathy. Nat Genet, 13,
325-35.
Schindelin, J., Arganda-Carreras, I., Frise, E., Kaynig, V., Longair, M., Pietzsch, T.,
Preibisch, S., Rueden, C., Saalfeld, S., Schmid, B., Tinevez, J. Y., White, D. J., Hartenstein,
V., Eliceiri, K., Tomancak, P. & Cardona, A. (2012). Fiji: an open-source platform for
biological-image analysis. Nat Methods, 9, 676-82.
Takahashi, K., Tanabe, K., Ohnuki, M., Narita, M., Ichisaka, T., Tomoda, K. & Yamanaka,
S. (2007). Induction of pluripotent stem cells from adult human fibroblasts by defined factors.
Cell, 131, 861-72.
Tanaka, A., Woltjen, K., Miyake, K., Hotta, A., Ikeya, M., Yamamoto, T., Nishino, T., Shoji,
E., Sehara-Fujisawa, A., Manabe, Y., Fujii, N., Hanaoka, K., Era, T., Yamashita, S., Isobe,
K., Kimura, E. & Sakurai, H. (2013). Efficient and reproducible myogenic differentiation from
human iPS cells: prospects for modeling Miyoshi Myopathy in vitro. PLoS One, 8, e61540.
Dis
ease
Mo
dels
& M
echa
nism
s •
DM
M •
Acc
epte
d m
anus
crip
t
Taneja, K. L., McCurrach, M., Schalling, M., Housman, D. & Singer, R. H. (1995). Foci of
trinucleotide repeat transcripts in nuclei of myotonic dystrophy cells and tissues. J Cell Biol, 128,
995-1002.
Tang, Z. Z., Yarotskyy, V., Wei, L., Sobczak, K., Nakamori, M., Eichinger, K., Moxley, R.
T., Dirksen, R. T. & Thornton, C. A. (2012). Muscle weakness in myotonic dystrophy associated
with misregulated splicing and altered gating of Ca(V)1.1 calcium channel. Hum Mol Genet, 21,
1312-24.
Thomas, J. D., Sznajder, L. J., Bardhi, O., Aslam, F. N., Anastasiadis, Z. P., Scotti, M. M.,
Nishino, I., Nakamori, M., Wang, E. T. & Swanson, M. S. (2017). Disrupted prenatal RNA
processing and myogenesis in congenital myotonic dystrophy. Genes Dev, 31, 1122-1133.
Tian, B., White, R. J., Xia, T., Welle, S., Turner, D. H., Mathews, M. B. & Thornton, C. A. (2000). Expanded CUG repeat RNAs form hairpins that activate the double-stranded RNA-
dependent protein kinase PKR. RNA, 6, 79-87.
Ueki, J., Nakamori, M., Nakamura, M., Nishikawa, M., Yoshida, Y., Tanaka, A., Morizane,
A., Kamon, M., Araki, T., Takahashi, M. P., Watanabe, A., Inagaki, N. & Sakurai, H. (2017).
Myotonic dystrophy type 1 patient-derived iPSCs for the investigation of CTG repeat instability.
Sci Rep, 7, 42522.
Wong, L. J., Ashizawa, T., Monckton, D. G., Caskey, C. T. & Richards, C. S. (1995). Somatic
heterogeneity of the CTG repeat in myotonic dystrophy is age and size dependent. Am J Hum
Genet, 56, 114-22.
Xia, G., Santostefano, K. E., Goodwin, M., Liu, J., Subramony, S. H., Swanson, M. S.,
Terada, N. & Ashizawa, T. (2013). Generation of neural cells from DM1 induced pluripotent
stem cells as cellular model for the study of central nervous system neuropathogenesis. Cell
Reprogram, 15, 166-77.
Yanovsky-Dagan, S., Avitzour, M., Altarescu, G., Renbaum, P., Eldar-Geva, T.,
Schonberger, O., Mitrani-Rosenbaum, S., Levy-Lahad, E., Birnbaum, R. Y., Gepstein, L.,
Epsztejn-Litman, S. & Eiges, R. (2015). Uncovering the Role of Hypermethylation by CTG
Expansion in Myotonic Dystrophy Type 1 Using Mutant Human Embryonic Stem Cells. Stem Cell
Reports, 5, 221-31.
Yum, K., Wang, E. T. & Kalsotra, A. (2017). Myotonic dystrophy: disease repeat range,
penetrance, age of onset, and relationship between repeat size and phenotypes. Curr Opin Genet
Dev, 44, 30-37.
Dis
ease
Mo
dels
& M
echa
nism
s •
DM
M •
Acc
epte
d m
anus
crip
t

Figures
Figure 1. Molecular characterization of DM1 patient-derived fibroblasts and reprogrammed
DM1 iPS cells. (A) Southern blot analysis using a digoxigenin-labeled probe binding to the 3’
UTR of the DMPK gene to determine the length of CTG repeats in fibroblast samples from two
DM1 patients (referred as DM1-1 and DM1-2). Fibroblasts from an unaffected individual were
used as control. The DM1-1 sample showed an expansion of about 2,000 CTG repeats whereas
Dis
ease
Mo
dels
& M
echa
nism
s •
DM
M •
Acc
epte
d m
anus
crip
t
the DM1-2 contained about 1,500 CTG repeats. (B) Representative RNA-FISH images show foci
only in fibroblasts from DM1-1 and DM1-2 patients. A Cy3-labeled (CAG)7 probe was used to
detect the foci (in red) and DAPI to stain nuclei. Maximum projection of the Z sections is shown
using confocal microscopy. Scale bar is 20 μm. (C) Bar graph shows respective quantification of
foci (from B), represented as average number of foci per nucleus in 150 cells. Bars indicate S.D.
from three independent experiments. (D) Representative image of RNA-FISH (red) coupled with
immunostaining for the pluripotency marker Oct 3/4 (green) in DM1 iPS cells and control
pluripotent stem cells (PSC). Maximum projection of the Z sections is shown by confocal
microscopy. Scale bar is 20 μm. (E) Bar graph shows respective quantification of foci (from D),
represented as average number of foci per nucleus in 150 cells. Bars indicate S.D. from three
independent experiments.
Dis
ease
Mo
dels
& M
echa
nism
s •
DM
M •
Acc
epte
d m
anus
crip
t

Figure 2. Characterization of DM1 myogenic progenitors. (A) Representative images show
RNA-FISH of foci (red) co-stained with the myogenic transcription factor PAX7 (green) in
myogenic progenitors derived from control and DM1 iPS cells using confocal microscopy.
Maximum projection of the Z sections is shown. Scale bar is 20 μm. (B) Bar graph shows
respective quantification of foci (from A), represented as average number of foci per nuclei in 150
cells. Bar represents S.D. from three independent experiments. (C) Representative images show
Dis
ease
Mo
dels
& M
echa
nism
s •
DM
M •
Acc
epte
d m
anus
crip
t

RNA-FISH of foci (red) co-stained with the splicing factor MBNL1 (green) in myogenic
progenitors derived from control and DM1 iPS cells. Mid Z section is shown. Scale bar is 20 μm.
Dis
ease
Mo
dels
& M
echa
nism
s •
DM
M •
Acc
epte
d m
anus
crip
t
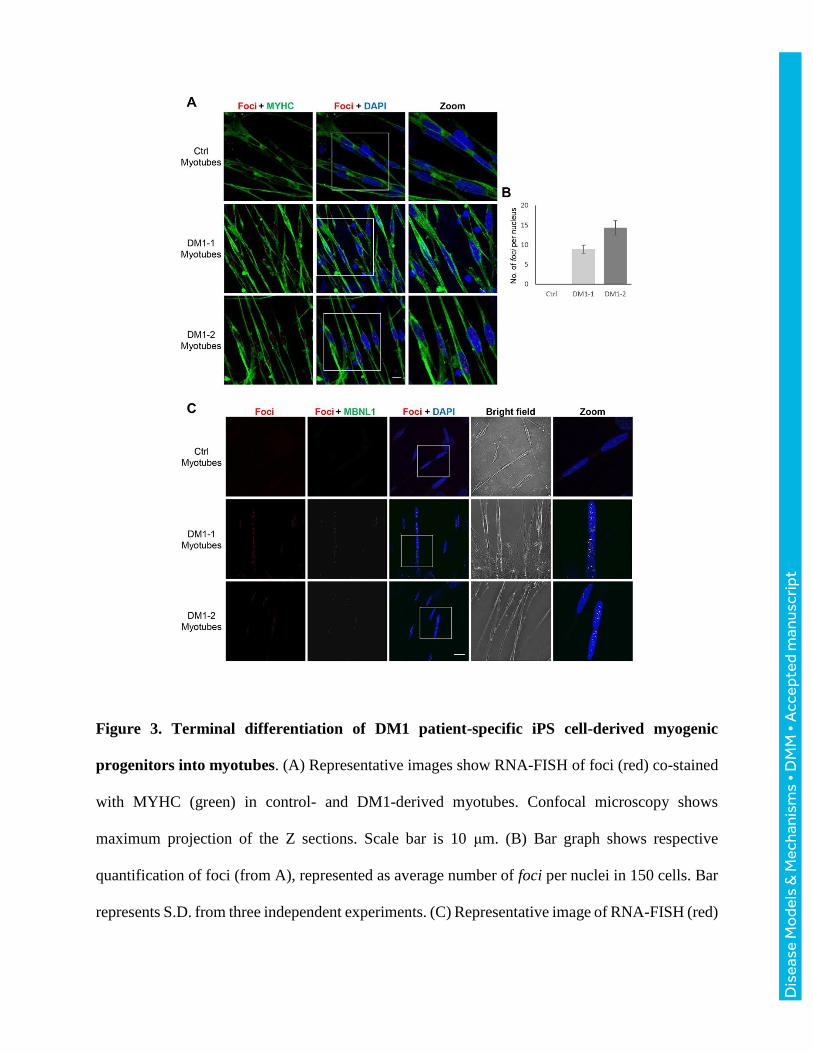
Figure 3. Terminal differentiation of DM1 patient-specific iPS cell-derived myogenic
progenitors into myotubes. (A) Representative images show RNA-FISH of foci (red) co-stained
with MYHC (green) in control- and DM1-derived myotubes. Confocal microscopy shows
maximum projection of the Z sections. Scale bar is 10 μm. (B) Bar graph shows respective
quantification of foci (from A), represented as average number of foci per nuclei in 150 cells. Bar
represents S.D. from three independent experiments. (C) Representative image of RNA-FISH (red)
Dis
ease
Mo
dels
& M
echa
nism
s •
DM
M •
Acc
epte
d m
anus
crip
t

coupled with immunostaining of the splicing factor MBNL1 (green) in Control, DM1-1 or DM1-
2 myotubes, analyzed by confocal microscopy. Mid Z section is shown. Scale bar is 20 μm.
Dis
ease
Mo
dels
& M
echa
nism
s •
DM
M •
Acc
epte
d m
anus
crip
t

Figure 4. Antisense oligonucleotide treatment reverses the molecular phenotype of DM1 iPS
cell-derived myotubes. (A) Representative images show RNA-FISH of foci (red) coupled with
immunostaining of MYHC (green) following 2’-OMePT(CAG)7 antisense oligonucleotide
treatment on DM1-1 or DM1-2 myotubes. Scale bar is 20 μm. (B) Bar graph represents the number
of nuclei showing RNA foci in three independent experiments (n=100). Data are shown as mean
+ SEM. Comparisons were done using the Mann-Whitney test ***p<0.001. (C) RT-PCR analysis
Dis
ease
Mo
dels
& M
echa
nism
s •
DM
M •
Acc
epte
d m
anus
crip
t

of BIN1 exon 11 following 2’-OMePT(CAG)7 antisense oligonucleotide treatment in Control,
DM1-1 or DM1-2 differentiated myotubes. (D) Bar graph represents respective percentage of BIN1
exon 11 inclusion (from C) from three independent replicates. Data are shown as mean + SEM.
Comparisons were done using the Mann-Whitney test ***p<0.001.
Dis
ease
Mo
dels
& M
echa
nism
s •
DM
M •
Acc
epte
d m
anus
crip
t

Disease Models & Mechanisms 11: doi:10.1242/dmm.034728: Supplementary information
Dis
ease
Mo
dels
& M
echa
nism
s •
Sup
plem
enta
ry in
form
atio
n

Supplementary Figure 1. Characterization of reprogrammed DM1-iPS cell lines. (A)
Representation of the typical colony morphology of DM1-1 and DM1-2 iPS cells compared to a
control iPS cell line. (B) RT-PCR analysis for pluripotency genes OCT3/4, SOX2, and NANOG,
as well as for the Sendai virus used for reprogramming (SeV) in DM1-1 and DM1-2 fibroblasts
(F), fibroblasts on D7 after transduction (T) and iPS cell colonies after 10 passages. (C)
Representative images show immunostaining for pluripotency markers OCT3/4, SOX2 and
NANOG (red) in DM1-1 and DM1-2 iPS cells. Scale bar is 200 μm. (D) Hematoxylin-eosin
staining of the teratoma induced by subcutaneous injection of DM1-1 and DM1-2 iPS cells in
immunodeficient mice. (E) Karyotype analysis of DM1-1 and DM1-2 iPS cells.
Disease Models & Mechanisms 11: doi:10.1242/dmm.034728: Supplementary information
Dis
ease
Mo
dels
& M
echa
nism
s •
Sup
plem
enta
ry in
form
atio
n
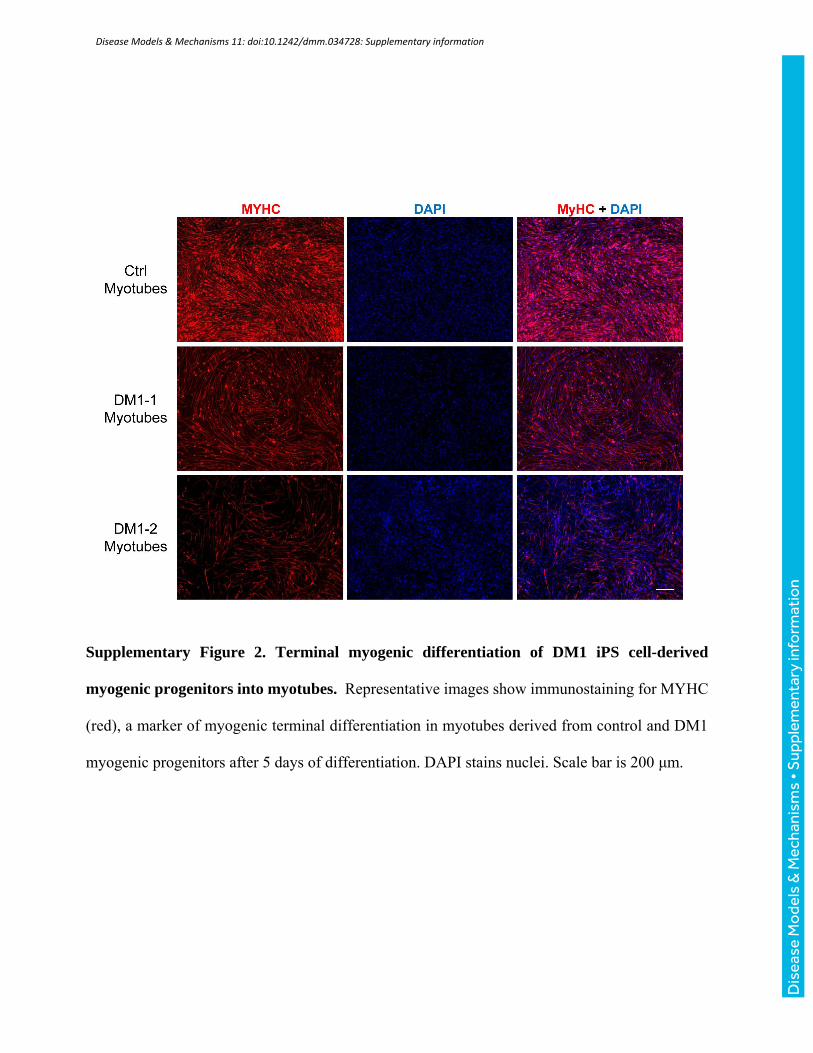
Supplementary Figure 2. Terminal myogenic differentiation of DM1 iPS cell-derived
myogenic progenitors into myotubes. Representative images show immunostaining for MYHC
(red), a marker of myogenic terminal differentiation in myotubes derived from control and DM1
myogenic progenitors after 5 days of differentiation. DAPI stains nuclei. Scale bar is 200 μm.
Disease Models & Mechanisms 11: doi:10.1242/dmm.034728: Supplementary information
Dis
ease
Mo
dels
& M
echa
nism
s •
Sup
plem
enta
ry in
form
atio
n
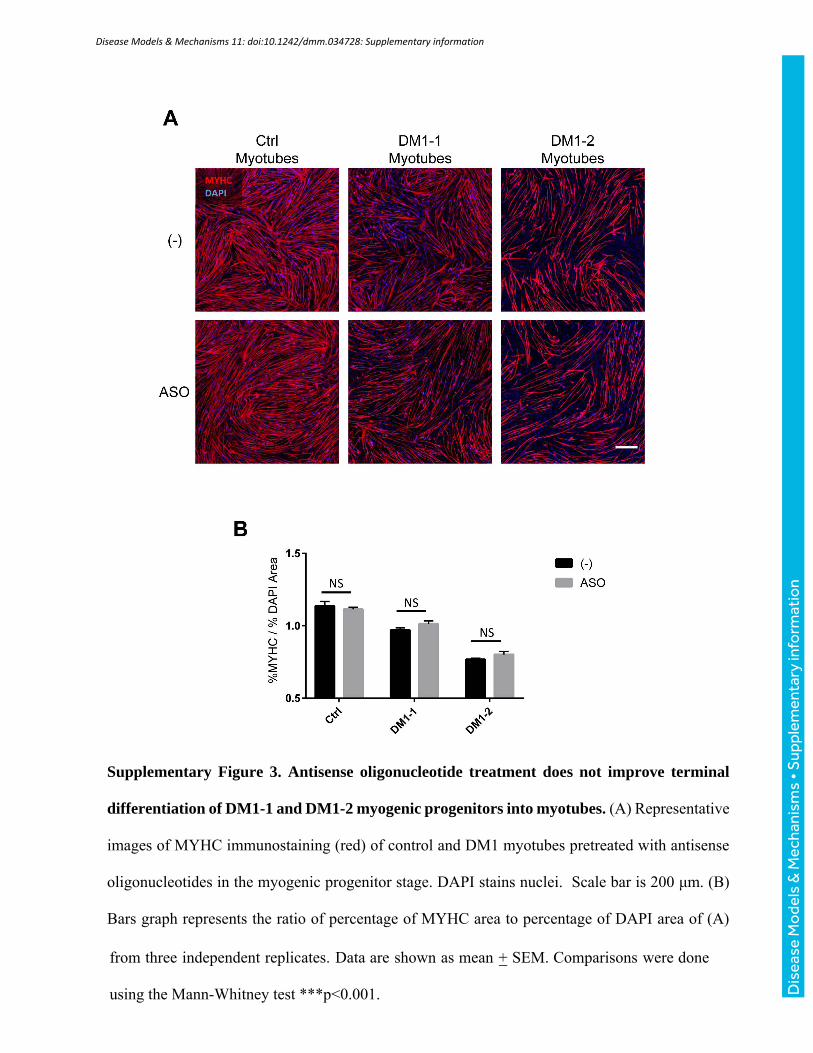
Supplementary Figure 3. Antisense oligonucleotide treatment does not improve terminal
differentiation of DM1-1 and DM1-2 myogenic progenitors into myotubes. (A) Representative
images of MYHC immunostaining (red) of control and DM1 myotubes pretreated with antisense
oligonucleotides in the myogenic progenitor stage. DAPI stains nuclei. Scale bar is 200 μm. (B)
Bars graph represents the ratio of percentage of MYHC area to percentage of DAPI area of (A)
from three independent replicates. Data are shown as mean + SEM. Comparisons were done
using the Mann-Whitney test ***p<0.001.
Disease Models & Mechanisms 11: doi:10.1242/dmm.034728: Supplementary information
Dis
ease
Mo
dels
& M
echa
nism
s •
Sup
plem
enta
ry in
form
atio
n