recent achievements in sizing and characterization of … · tofd technique is a non amplitude...
TRANSCRIPT
Recent achievements in sizing and characterization of weld defects with
Pulse echo, TOFD and Phased Array in the frame of ASME and EN
standards
Speaker’s name: Giuseppe Nardoni, I&T Nardoni Institute
Paper Details: P. Nardoni (1), D. Nardoni (2), M. Feroldi (3), M. Certo (4), L. Possenti (5), A. Filosi
(6), S. Quetti (7)
I&T Naroni Institute
ATB Riva Calzoni
ABSTRACT:
This paper highlights the results in sizing and characterization of discontinuities in heavy wall
thickness welds.
The results come from more than 50 years of experience in ultrasonic examination of welds.
The discover and application of the diffracted echo in Pulse echo and Phased Array has taken a
great advance in sizing discontinuities smaller than the crystal size with an accuracy ranging
between 0.2 to 0.5 mm.
In addition, the ratio between the diffracted echoes has been experimental demonstrated to be a
very helpful criteria to differentiate planar from volumetric discontinuities.
Two other items have been included in the paper.
The classification of the TOFD image to improve the reliability and POD (Probability of detection) of
TOFD technique and the importance of focusing in the near field of Phased Array probe.
To achieve and verify the focusing of the beam a new test block named IIW-V3/PA has been
designed with three path distances: 25, 50 and 100 mm.
KEYWORDS:
Sizing, Characterization, Planar, Volumetric, Phased Array, TOFD, Ultrasonic, Diffracted echo,
POD, Welds, Focusing
AUTHOR DETAILS:
Giuseppe Nardoni, I&T Nardoni Institute Director and Quality Manager, I&T Nardoni Institute,
Folzano (Brescia), Italy
Pietro Nardoni, I&T Nardoni Institute General Manager, I&T Nardoni Institute, Folzano (Brescia),
Italy
Diego Nardoni, I&T Nardoni Institute Managing Manager, I&T Nardoni Institute, Folzano (Brescia),
Italy
Mario Certo, Master Degree in Mathematics, Research Manager, I&T Nardoni Institute, Folzano
(Brescia), Italy
Luca Possenti, ATB Riva Calzoni, Brescia, Italy
Alessandro Filosi, Engineer, ATB Riva Calzoni, Brescia, Italy
Stefano Quetti, ATB Riva Calzoni, Brescia, Italy
Mor
e in
fo a
bout
this
art
icle
: ht
tp://
ww
w.n
dt.n
et/?
id=
1603
1

2
The last achievements in sizing and characterization of weld defects with
Pulse echo, TOFD, Phased Array and C-B scan in the frame of ASME and
EN standards
ULTRASONIC COMPUTERIZED TECHNIQUE
INTRODUCTION
In the nineties the ASME, through the Code Case 2335, introduced the possibility for the
manufacturer of pressure vessel to use ultrasonic examination in lieu of radiography.
This statement has opened great researches and experimental tests to set up computerized
equipment, scanners, software for scanning and data acquisition in terms of geometric data of the
findings and their characterization.
Mandatory to apply this Code Case to give for each relevant indication the size in term of metric unit
and not in terms of amplitude as indicated in Tab. 1 and Fig. 5.
After 15 years’ experience in applying these computerized system a great step in the ultrasonic advanced technique has been reached.
TOFD and Phased Array are the dominant techniques in this field.
TOFD TECHNIQUE
TOFD technique is a non amplitude based technique in evaluation of indications.
Through the software the height and length of indications can be estimated with an accuracy in the
height less than 0.5 mm and in the range of 2-5 mm for the length.
Fundamental in this technique is the quality of the image in terms of contrast phase and tip
resolution.
The contrast phase is depending from the correct choice of the scanning parameters; the tip
diffraction from the frequency.
In order to make comparable two TOFD results made on the same welds, a classification of phase
contrast has been introduced; class 1, good contrast, class 2 ,discrete contrast, class 3 where
the phase color (black and white) are no more distinguishable.
The sizing and detectability of the indications are compromised.
The second criteria we introduced is the tip resolution.
In the Fig. 23 and 24 examples of phase contrast of 1,2 and 3 class are represented together with
the tip resolution resolved and not resolved.
This data are fundamental in writing the procedure and in its validation.
Defining the depth zone it should be guaranteed the overlap of the detection capability.
The tip resolution is more depending on the frequency of the probe and it is a constant parameter for
a fixed frequency. It has to be determined experimentally during the validation test.
Following these simple criteria, TOFD results may be comparable giving the highest POD which is
proper for TOFD technique.
In Tab. 3 an example of a validation procedure applying this criteria of image classification is
presented.

3
PHASED ARRAY TECHNIQUE
Phased array technique is a multiple pulse-echo technique with different angles of incidence.
In the evaluation of the indications it has been an amplitude based technique.
To comply with the ASME request it was necessary to submit the height and not the amplitude of a
defect.
The research for size estimation in Phase Array started immediately and the first step was to apply
the echo dynamic curve represented in this technique by the extension of the images with its
different colors representing the reflection of the defect under different angles.
During this research we discovered that pulse echo technique generates, as in TOFD technique a
diffracted echo. The mechanism of the diffraction phenomena is different from planar to volumetric
indication.
From planar indications as cracks, lack of fusion or penetration, the diffraction is generated by
spherical waves when the wave hits the upper and lower tip of the planar discontinuity (see Fig. 13-
16).
The analytical formula to calculate the height of the indication become the following:
the height is determined directly measuring with the cursor the depth of the two diffracted echoes
(Fig. 11-12).
Height = depth tip2 - depth tip1
For volumetric indications, for example a cylindrical hole, the diffracted echo is generated by the
creeping wave that travels around the hole and returns as shear wave to the transducer (see Fig.
8-10).
In this case, the diameter (height) is determined by the difference of the diffracted path and the
direct path divided by 1.5 (half π )
(height) diameter = diffracted path - direct path
The accuracy in determining the diameter of cylindrical holes is in the range of 0.2 ÷ 0.5 mm.
Fig. 19 and 20 and Tab. 2 are example of sizing of 4 mm slit on 300 mm thickness weld.
Beam focalization in Phased Array
The near field is the zone where focusing is necessary to have a uniform beam to produce images
for the correct evaluation of the size of discontinuities.
In general according to the number of elements present in the different Phase Array probes we can
consider the near field in the maximum range of 100 mm.
In the far field it is not necessary the focalization, it comes automatically from the software.
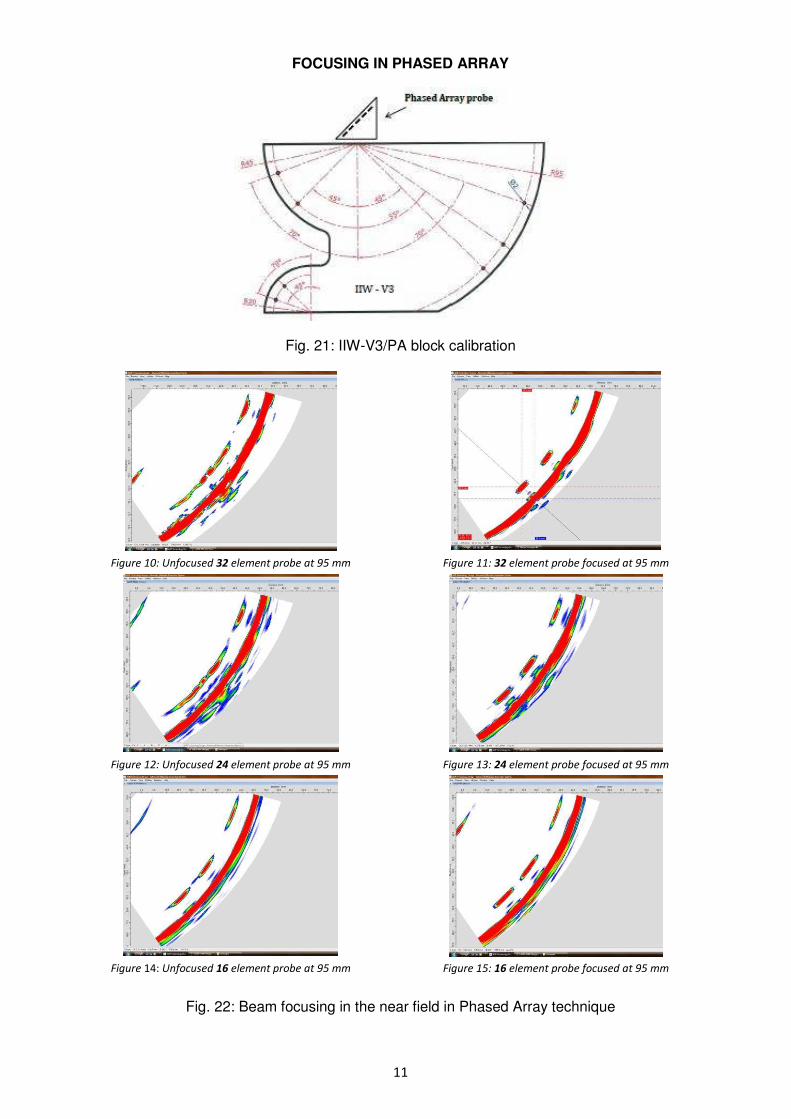
To adjust the ultrasonic beam in the near field at different depth: 25, 50, 100%, a special test block
has been set up , named V3-PA block with flat bottom holes positioned at different distances (20, 45
and 95 mm) as in Fig. 21.
Related to the focus distance requested, the focusing calibration can be verify on the side drilled
holes present in the block.
In Fig. 22 it is possible to see the differences between the image shapes of the hole for focused and
unfocused ultrasonic beam.

4
PLANAR AND VOLUMETRIC
The use of diffracted echo has introduced a new criteria to distinguish planar from volumetric
indications (see Fig. 7).
Experimental tests have been carried out on five different type of reflectors represented by a side
drilled hole and intermediate reflectors shaped gradually up to a crack like defect (see Fig. 17).
Plotting in a diagram (see Fig. 26) the ratio of the first and second diffracted echo versus the width
of each artificial reflectors, the results indicate that two families of reflectors can be identified:
a) Planar indications, with a ratio between 1 and 4
b) Full Volumetric indications between 7 and 13
5
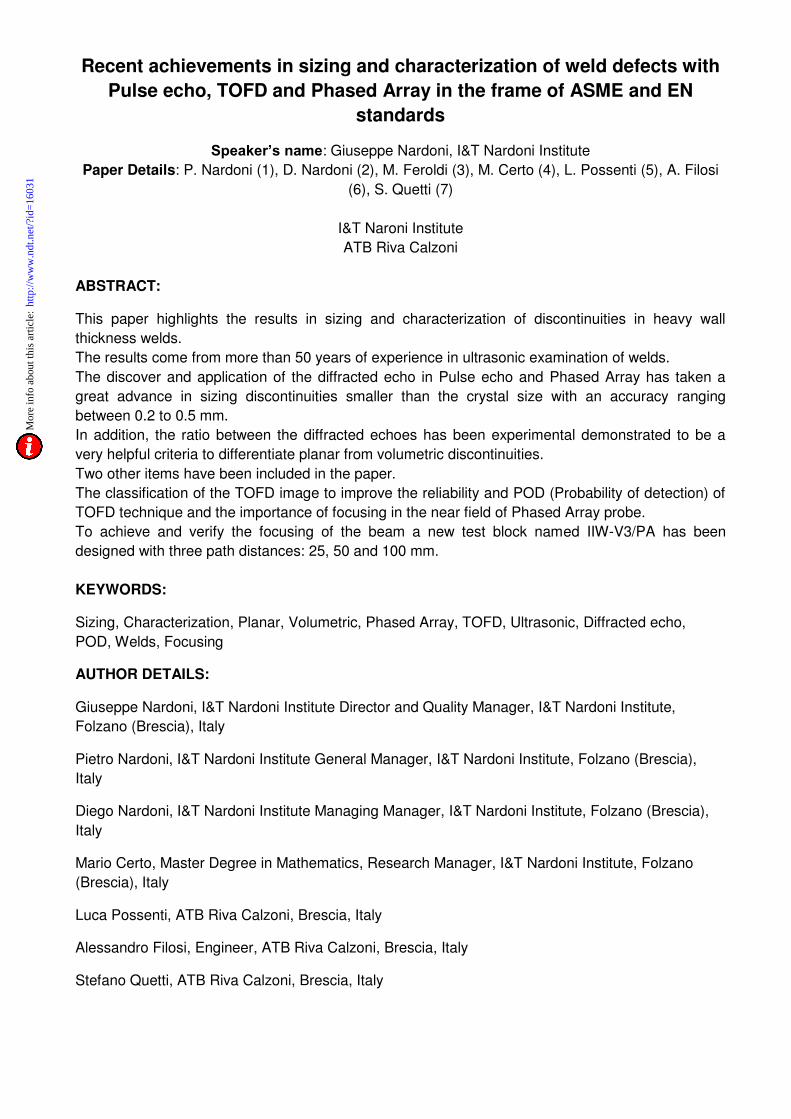
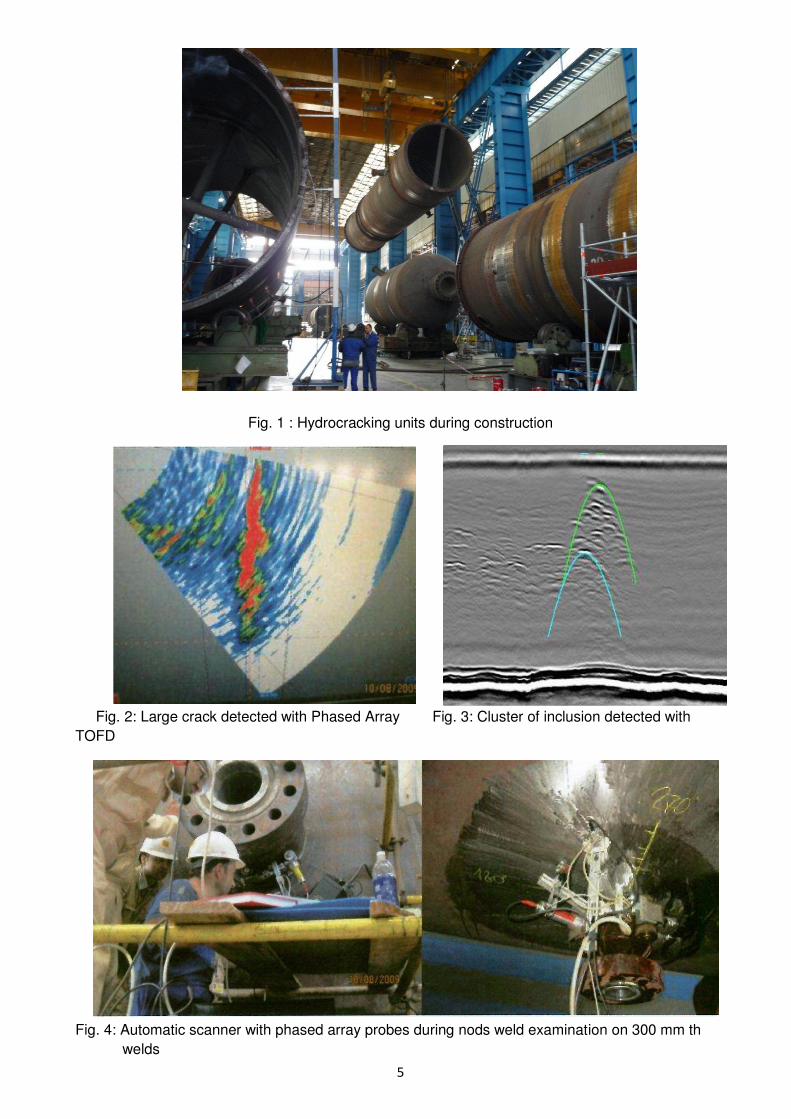
Fig. 1 : Hydrocracking units during construction
Fig. 2: Large crack detected with Phased Array Fig. 3: Cluster of inclusion detected with
TOFD
Fig. 4: Automatic scanner with phased array probes during nods weld examination on 300 mm th
welds

6
SIZING OF INDICATIONS
Tab. 1: size of indications detected by ultrasonic relevant to the thickness of the weld examined
Fig. 5: Examples of defect configuration to establish dimension (length and height)
Fig. 6: Example of acceptance criteria relevant to a thickness of to determine the length of the
indication depending on the height
0
5
10
15
20
25
30
a 1,33 1,505 1,715 1,995 2,31 2,73 3,15 3,675 4,305 5,005
l (m
m)
a (mm)
CODE CASE 2235-9 (subsurface flaw) DIAGRAM a/l for thickness 35mm

7
PLANAR AND VOLUMERTIC INDICATIONS
Fig. 7: Examples of volumetric defects (A-B-C) and planar defects (D-E-F) in welding
ASME 2010 SECTION VIII -DIVISION 1- APPENDIX 12 ULTRASONIC EXAMINATION OF WELDS (UT)
Indications characterized as cracks, lack of fusion, or incomplete penetration are unacceptable
regardless of length. Other imperfections are unacceptable if the indications exceed the reference level
amplitude and have lengths which exceed:
(1) ¼ i n . ( 6mm) f or t u p to ¾ i n . (1 9 m m) (2) 1/3 t for t from ¾ in. to 2 ¼ in. (19 mm to 57 mm) (3) ¾ in. (19mm) for t over 2 ¼ in. (57 mm). Where t is the thickness of the weld excluding any allowable reinforcement.
For a butt weld joining two members having different thickness at the weld, t is the thinner of these two
thicknesses. If a full penetration weld includes a fillet weld, the thickness of the throat of the fillet shall be
included in t.
A
D
B
E
C F

8
DIFFRACTED ECHO GENERATED BY VOLUMETRIC SIDE DRILLED HOLE (SDH) IN PHASED
ARRAY AND PULSE ECHO TECHNIQUES (VOLUMETRIC DICONTINUITIES)
Fig. 10: Image of direct reflected echo and diffracted echo from creeping waves with Phased Array
Fig. 11: Image of diffracted echo due to spherical waves generated at the tips with Phased Array
Fig. 12: Image of diffracted echo due to spherical waves generated at the tips with Pulse Echo
Fig. 8: Physical phenomena of diffraction on cylindrical hole generated by creeping wave
Fig. 9:Schematic drawing of a test block used for experiment with side drilled hole

9
DIFFRACTED ECHOES GENERATED BY SLIT
Fig. 13: Ultrasonic wave travelling versus the linear slit
Fig. 14: Diffracted spherical wave generated when wave hits upper tip
Fig. 15: diffracted spherical wave when the wave The incident lower tip
Fig. 16: Mode conversion when longitudinal beam reflects on the boundary: s=shear l=longitudinal
Fig. 17-18: Theoretical presentation of diffracted eco

10
SIZING IN PHASED ARRAY TECHNIQUE
Fig. 19: Beam focusing and calibration on 3 mm holes (SDH) for sizing the slit of test block in fig. 20
Fig. 20: Test block with calibration slits of 4 mm height to evaluate the sizing capability of Phased
Array technique.
defect ID
real data ultrasonic examination
center depth [mm]
position [mm]
channel num.
upper tip depth [mm]
lower tip depth [mm]
center depth [mm] position [mm] height [mm]
estimated error estimated error estimated error
1 4 725 - - - - - - - - -
2 30 680 1 31.8 36.5 34.15 +4.15 681.1 +1.1 3.7 -0.3
2 30 680 2 21.7 26.4 24.05 -5.95 674.5 -6.5 4.7 +0.7
3 60 635 1 62.6 66.6 64.6 +4.60 640.5 -5.5 4 0.0
3 60 635 2 60.1 63.6 61.85 +1.85 628.3 -5.7 3.5 -0.5
4 90 590 1 93.8 97.5 95.65 +5.65 592.9 -2.9 3.7 -0.7
4 90 590 2 91.4 95.5 93.45 +3.45 581.9 -9.1 4 0.0
5 120 545 1 131.0 134.8 132.9 +12.90 543.1 -1.9 3.9 -0.1
6 150 500 1 149.1 152.9 151 +1.00 502.8 -2.8 3.9 -0.1
7 180 455 1 187.9 191.9 189.9 +9.90 450.4 -4.6 4 0.0
8 210 410 1 212.3 216.3 214.3 +4.30 408.7 -2.3 4 0.0
9 240 365 1 242.4 246.6 244.5 +4.50 362.8 -3.2 4.2 +0.2
10 270 320 1 270.3 273.7 272 +2.00 319.1 -0.9 3.4 -0.6
11 294 284 1 295.7 298.6 297.15 +3.15 282.3 -1.7 3.1 -0.9
Tab. 2: estimated values of heights relevant to the slit in test block of Fig. 20
11
FOCUSING IN PHASED ARRAY
Fig. 21: IIW-V3/PA block calibration
Figure 10: Unfocused 32 element probe at 95 mm Figure 11: 32 element probe focused at 95 mm
Figure 12: Unfocused 24 element probe at 95 mm Figure 13: 24 element probe focused at 95 mm
Figure 14: Unfocused 16 element probe at 95 mm Figure 15: 16 element probe focused at 95 mm
Fig. 22: Beam focusing in the near field in Phased Array technique

12
TOFD TECHNIQUE
Tab. 3: Validation table relative to class of phase contrast and tip resolution
N of slits Probe 70° pcs 80 5 MHz Ø6mm
Probe 52°pcs160 3,5 MHz Ø18mm
Probe 45° pcs300 2,2 MHz Ø24mm
Probe 35°pcs370 2,2 MHz Ø24mm
Height Depth Image Height Depth Image Height Depth Image Height Depth Image
1 4,5 6 1-B - - 3-C - - NVI - - NVI
2 3,9 30 2-A 5,0 30 2-B - - 3-C - - NVI
3 - - NVI 4,2 60 1-A 5,2 60 2-C - - NVI
4 - - NVI - - NVI 4,8 90 1-A - - NVI
5 - - NVI - - NVI 3,8 120 1-A - - NVI
6 - - NVI - - NVI 4,1 150 1-A 3-C
7 - - NVI - - NVI 4,3 180 2-B 5,2 180 2-B
8 - - NVI - - NVI - - 3-C 4,5 210 2-B
9 - - NVI - - NVI - - NVI 4,2 240 1-A
10 - - NVI - - NVI - - NVI 4,0 270 1-A
11 - - NVI - - NVI - - NVI 3,2 294 1-B
phase contrast 1: Very good 2:Good 3: Poor
tips resolutions A: Good resolved B:Slightly resolved C: Not resolved
Example: best image: images 1-A worst image : 3-C (Sensitivity Not acceptable)
NVI. : Slit Image Not Visible

13
Fig. 23: TOFD MAP of lack of fusion; phase contrast class 2; tip not resolve
Fig. 24: TOFD MAP – A) Phase contrast class 1; tip resolved – B) and C) Phase contrast class 3; tip
not resolved.
Indication quality of image B and C are not acceptable
TIPS NOT RESOLVED
PHASE CONTRAST:
CLASS 2
C) PHASE CONTRAST:
CLASS 3
B) PHASE CONTRAST:
CLASS 3
A) TIPS RESOLUTION UPPER
AND LOWER TIPS RESOLVED
PHASE CONTRAST: CLASS 1

14
VOLUMETRIC AND PLANAR DEFECTS
Fig. 26: Diagram showing the behavior of planar and volumetric defects defined on the basis of
diffracted echo.
Fig. 17: Sketch of the test block used for the experimental work.
Fig. 27: A-scan presentation from a side drilled hole (SDH) using 45° angle beam.
A) Direct reflection echo: shear waves – shear waves
B) Diffracted Echo: shear waves - creeping waves – shear waves
Fig. 28: A-Scan from full planar indication.
A) Diffracted echo from upper tip
B) Diffracted echo from lower tip
PLANAR DEFECT VOLUMETRIC DEFECT
A
B
A B
R= Amplitude Ratio between
amplitude of echo A and
amplitude of echo B

15
ACKNOWLEDGMENTS
Special thanks to Dott. Prof. Laura Mattei for her help in preparing and editing this paper.
REFERENCES
[1] Sharp R. S., “Research Techniques in Non Destructive Testing”, Vol. IV, 1980
[2] Malcolm, J. Crocker, “ Encyclopedia of Acoustics”, Vol. One, 1997
[3] ASME Code Sec. V, art. 4, Code Case 2235.9. Use of Ultrasonic Examination in Lieu of
Radiography.
[4] Ichiro Komura, Taiji Hirasawa, Satoshi Nagai (Toshiba),Jun-ichi Takabayashi (Keihin), Katsuhiko
Naruse (Isogo Nuclear) “Crack Detection and Sizing Technique by Ultrasonic and Electromagnetic Methods”, Proceedings of the 25th MPA Seminar, MPA Stuttgart, Germany, October 7 - 8, 1999
[5] R/D Tech, “Introduction to Phased Array Ultrasonic Technology Applications: R/D Tech Guideline”, Quebec City, Canada, R/D Tech, 2004. [6] Lafontaine, G. and F. Cancre, "Potential of Ultrasonic Phased Arrays for Faster, Better and Cheaper Inspections," NDT.net, Vol. 5, No. 10, October 2000, <www.ndt.net/article/v05n10/lafont2/lafont2.htm>. [7] Nardoni G., “CB-Scan Technique with Phased Array Probe: Sizing procedures using diffracted
echoes”, Conference on ASME Code Case 2235.9: From acceptance criteria based on amplitude of
signal to acceptance criteria based on size, Moscow, 2008.
[8] Paul D. Wilcox, Caroline Holmes and Bruce W. Drinkwater “Advanced Reflector Characterization with Ultrasonic Phased arrays in NDE Applications”;
IEEE Transactions on Ultrasonics, ferroelectrics, and Frequency Control, Vol.54, N.8, August 2007
[9] ASME Code Case 2235.9.
[10] Nondestructive testing and diagnostics-Handbook .Edited by V.V. Klyuev
[11] Encyclopedia of Acoustics Edit by Malcolm J. Crocker
[12] Ultrasonic Testing of Materials – J. Krautkramer H. Krautkramer