recent applications in conveyor systems to...
TRANSCRIPT
RECENT APPLICATIONS IN
CONVEYOR SYSTEMS
TO
IMPROVE CONVEYOR PERFORMANCE
Presented by: Lawrence K. Nordell
President
Conveyor Dynamics, Inc.
July 28, 1999
- 2 -
1.0 INTRODUCTION
Belt conveyor performance improvements certainly can be discussed from many points
of view, as seen through the individual and distinguishing eyes of engineers,
manufacturers, operators and owners. Thus, it may be difficult to incorporate the
complete agendas of performance from these diverse assessors and their separate frames
of reference. I have tabulated a small, incomplete list defining the selection under which
I anguished to address this paper.
Possible Areas of Performance Improvements
1. Longer distances
2. Faster
3. Stronger = minimizing belt breaking strength = lower SF
4. Cheaper = minimizing installation; operation cost
5. Smaller = narrower belt and less structure
6. Negotiation of difficult terrain with improved convolution = curved belts
7. Safer with less risk — shock wave and transient force control
8. Longer life (influences of chute design and picking the right bearing L-10 value)
9. Enhanced environmental features - visual esthetics; less spillage, dust and noise
pollution
10. Puncture protection at impact station
11. Higher availability [Avail = MTBF / (MTBF+MTTR)] — maintenance idler
access
A number of these categories are commented on. A series of good and not so good drive
arrangements, which are the source of frequent trouble I’ve had with client consultants,
are illustrated. These drive concepts along with newer concepts on idler supports, will
hopefully gain greater acceptance based on their superior features.
2.0 TECHNICAL REVIEW
Two acronyms PSL and LCC best describe the two most significant measures on
performance improvements. PSL denotes Power, Strength and Life in service. LCC
denotes system Life Cycle Costs in Net Present Value (NPV) incorporating the total
expected service life of the conveyor system.
PSL improvement is driven by modern belt performance and cost related reductions. At
the last IIR conference [1] and through it predecessor [2], I presented ways engineers and
manufacturers are now seeking PSL improvements.
Life cycle costing (LCC) is defined as the sum of all project, operating, and maintenance
NPV costs totaled over the estimated mine or equipment life. We assume taxes,
depreciation, DCF, warranties, and the value of money are included. LCC is best applied
at the engineering and development stage of a new project where the economic impact
will be at its greatest in optimally selecting system components. Few, if any, large
consulting firms practice this procedure for general lack of interest or understanding.
They believe nobody (the client) cares. A 1940’s engineering mentality is still acceptable
- 3 -
to their clients. Big and beefy meets their comfort zone. As a consequence, millions of
dollars are squandered on major projects through ignorance, indifference and risk
aversion. Our industry will only make headway when clients demand better practices and
justification with a well documented LCC formula in hand. LCC implementation could
be the single most significant improvement to our industry today. It would weigh
technological influence and would force the belt suppliers and system engineers to make
the technology investment or perish. This would result in a fair measure of the value of
the bid.
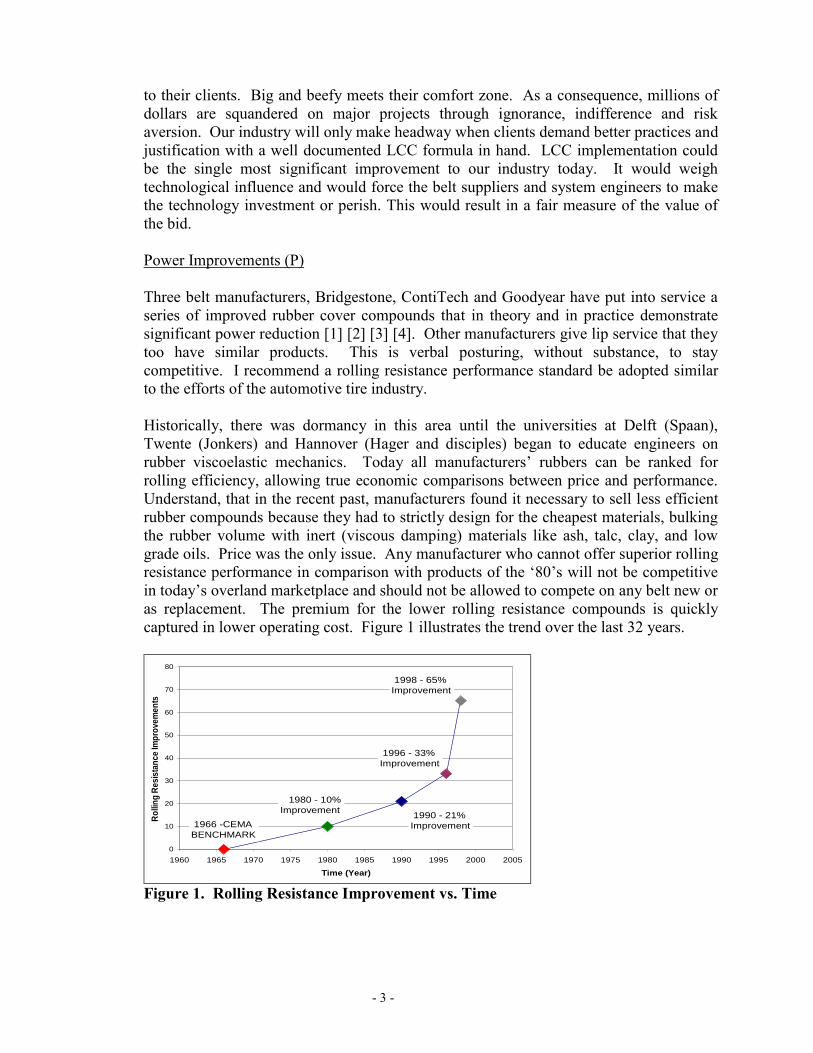
Power Improvements (P)
Three belt manufacturers, Bridgestone, ContiTech and Goodyear have put into service a
series of improved rubber cover compounds that in theory and in practice demonstrate
significant power reduction [1] [2] [3] [4]. Other manufacturers give lip service that they
too have similar products. This is verbal posturing, without substance, to stay
competitive. I recommend a rolling resistance performance standard be adopted similar
to the efforts of the automotive tire industry.
Historically, there was dormancy in this area until the universities at Delft (Spaan),
Twente (Jonkers) and Hannover (Hager and disciples) began to educate engineers on
rubber viscoelastic mechanics. Today all manufacturers’ rubbers can be ranked for
rolling efficiency, allowing true economic comparisons between price and performance.
Understand, that in the recent past, manufacturers found it necessary to sell less efficient
rubber compounds because they had to strictly design for the cheapest materials, bulking
the rubber volume with inert (viscous damping) materials like ash, talc, clay, and low
grade oils. Price was the only issue. Any manufacturer who cannot offer superior rolling
resistance performance in comparison with products of the ‘80’s will not be competitive
in today’s overland marketplace and should not be allowed to compete on any belt new or
as replacement. The premium for the lower rolling resistance compounds is quickly
captured in lower operating cost. Figure 1 illustrates the trend over the last 32 years.
0
10
20
30
40
50
60
70
80
1960 1965 1970 1975 1980 1985 1990 1995 2000 2005
Time (Year)
Ro
llin
g R
esis
tan
ce Im
pro
ve
me
nts
1966 -CEMA
BENCHMARK
1980 - 10%
Improvement 1990 - 21%
Improvement
1996 - 33%
Improvement
1998 - 65%
Improvement
Figure 1. Rolling Resistance Improvement vs. Time

- 4 -
We should encourage the further improvements in rubber rolling efficiency as we spend
upwards of $200 billion USD per year on rubber products worldwide. It is good for
everybody on the planet.
As rubber-rolling losses drop, idler drag loss will constitute a larger measure. Idler
alignment error will be come an issue. Optimization of idler roll diameter, spacing,
bearing, seal and lubricant system, and bearing rating must be considered in the power
equation and total capital cost assessment.
Figure 2. Rubber Compound Difference Power vs. Temperature
Figure 2 illustrates the power draw on 16 different belt manufacturers’ cover rubber
compounds for the two temperatures, 0o and 30
o C, and compares the results with CEMA.
The study was made on a 5.3 km, 9000 t/h conveyor for which CDI provided the design
and did field measurements. Six of 16 compounds have been separately verified by field
measurements having an accuracy of 93 - 98%. All compounds were evaluated by CDI
for viscoelastic properties and the rubber data analyzed by the CDI power equation
formulation. A number of notable points are evident:
a. Three compounds draw more power at 0o C and 13 compounds draw less power.
The best compound is 34% below CEMA.
b. At 30o C, 12 compounds draw less power than CEMA. Twelve drop in power as
the temperature increases. The best rolling efficient compound is now 54% below
CEMA. Four compounds are below the power draw of the best compound at 0o
C.
c. Three compounds increase in power as the temperature increases. The two
inefficient compounds, which exceed CEMA at both temperatures by 13-20%, are
from the same manufacturer.
- 5 -
It should be noted that most belts will draw less power with time in service as the
rubber is worked. We cannot predict, at this time, the rate of improvement and
therefore must design for the initial operating conditions. Channar, by example,
initially had a DIN equivalent friction factor of f = 0.011. Within five years, this
fell to below f = 0.009.
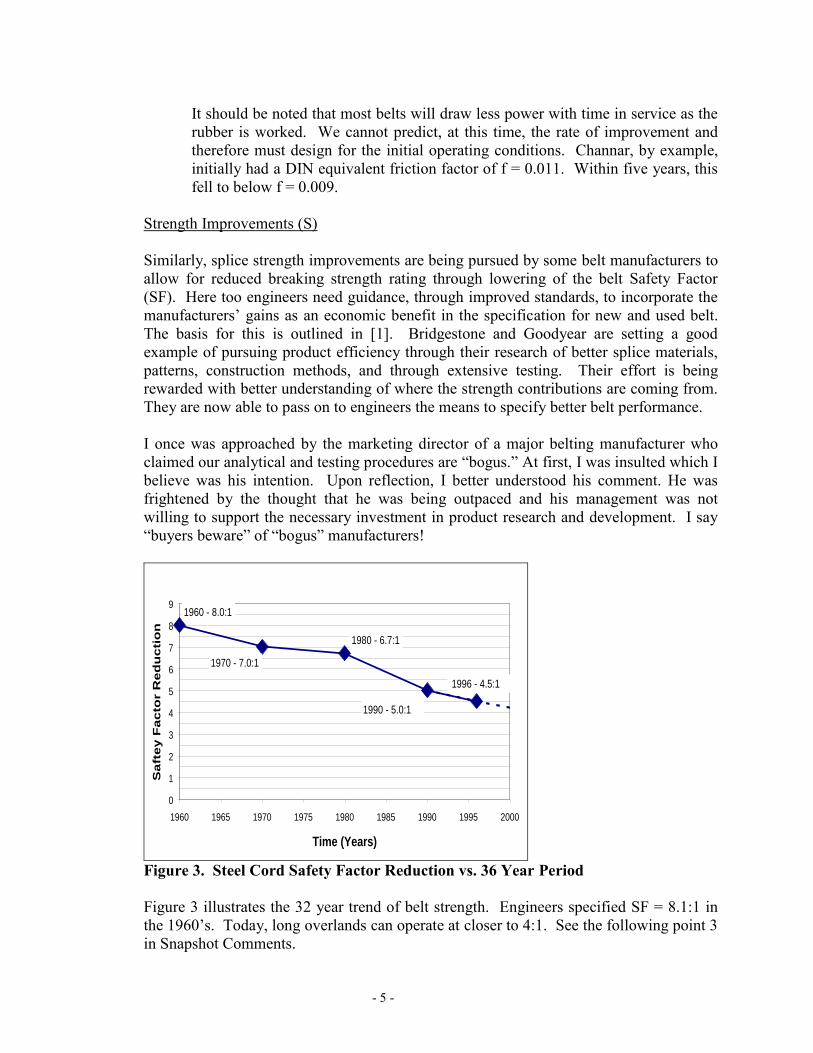
Strength Improvements (S)
Similarly, splice strength improvements are being pursued by some belt manufacturers to
allow for reduced breaking strength rating through lowering of the belt Safety Factor
(SF). Here too engineers need guidance, through improved standards, to incorporate the
manufacturers’ gains as an economic benefit in the specification for new and used belt.
The basis for this is outlined in [1]. Bridgestone and Goodyear are setting a good
example of pursuing product efficiency through their research of better splice materials,
patterns, construction methods, and through extensive testing. Their effort is being
rewarded with better understanding of where the strength contributions are coming from.
They are now able to pass on to engineers the means to specify better belt performance.
I once was approached by the marketing director of a major belting manufacturer who
claimed our analytical and testing procedures are “bogus.” At first, I was insulted which I
believe was his intention. Upon reflection, I better understood his comment. He was
frightened by the thought that he was being outpaced and his management was not
willing to support the necessary investment in product research and development. I say
“buyers beware” of “bogus” manufacturers!
0
1
2
3
4
5
6
7
8
9
1960 1965 1970 1975 1980 1985 1990 1995 2000
Time (Years)
Sa
ftey
Fa
cto
r R
ed
uc
tio
n
1960 - 8.0:1
1980 - 6.7:1
1996 - 4.5:1
1990 - 5.0:1
1970 - 7.0:1
Figure 3. Steel Cord Safety Factor Reduction vs. 36 Year Period
Figure 3 illustrates the 32 year trend of belt strength. Engineers specified SF = 8.1:1 in
the 1960’s. Today, long overlands can operate at closer to 4:1. See the following point 3
in Snapshot Comments.
- 6 -
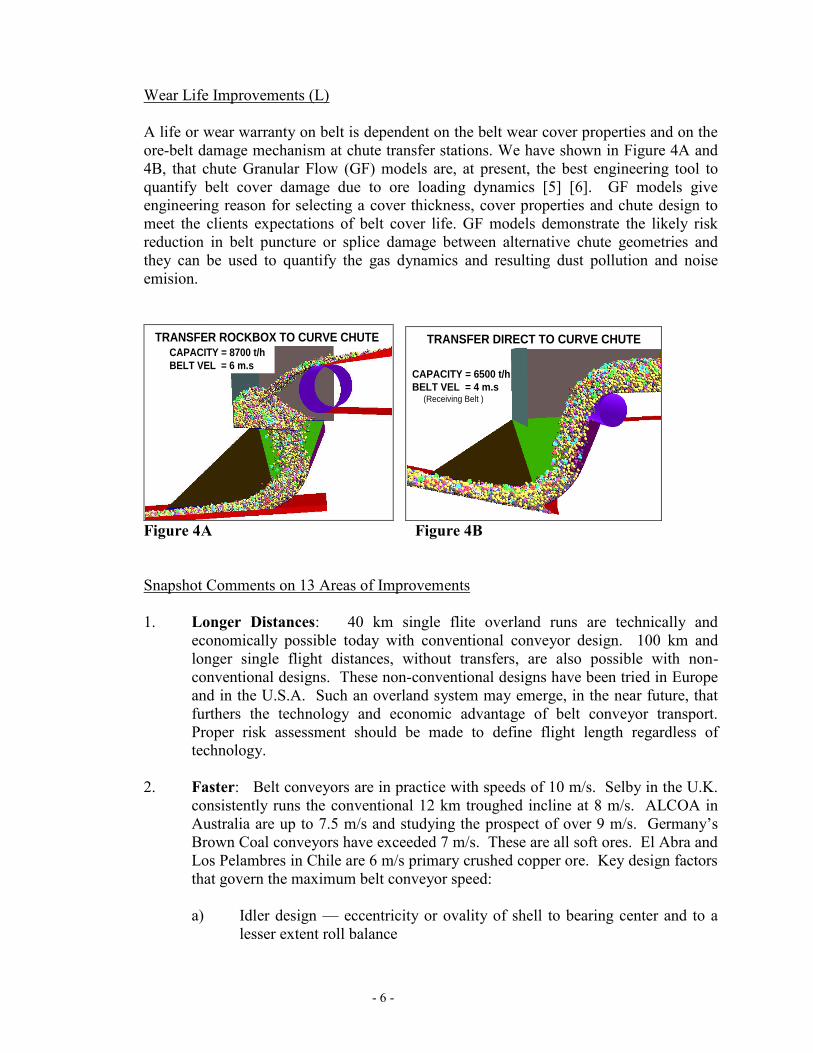
Wear Life Improvements (L)
A life or wear warranty on belt is dependent on the belt wear cover properties and on the
ore-belt damage mechanism at chute transfer stations. We have shown in Figure 4A and
4B, that chute Granular Flow (GF) models are, at present, the best engineering tool to
quantify belt cover damage due to ore loading dynamics [5] [6]. GF models give
engineering reason for selecting a cover thickness, cover properties and chute design to
meet the clients expectations of belt cover life. GF models demonstrate the likely risk
reduction in belt puncture or splice damage between alternative chute geometries and
they can be used to quantify the gas dynamics and resulting dust pollution and noise
emision.
CAPACITY = 8700 t/h
BELT VEL = 6 m.s
TRANSFER ROCKBOX TO CURVE CHUTE
CAPACITY = 6500 t/h
BELT VEL = 4 m.s (Receiving Belt )
TRANSFER DIRECT TO CURVE CHUTE
Figure 4A Figure 4B
Snapshot Comments on 13 Areas of Improvements
1. Longer Distances: 40 km single flite overland runs are technically and
economically possible today with conventional conveyor design. 100 km and
longer single flight distances, without transfers, are also possible with non-
conventional designs. These non-conventional designs have been tried in Europe
and in the U.S.A. Such an overland system may emerge, in the near future, that
furthers the technology and economic advantage of belt conveyor transport.
Proper risk assessment should be made to define flight length regardless of
technology.
2. Faster: Belt conveyors are in practice with speeds of 10 m/s. Selby in the U.K.
consistently runs the conventional 12 km troughed incline at 8 m/s. ALCOA in
Australia are up to 7.5 m/s and studying the prospect of over 9 m/s. Germany’s
Brown Coal conveyors have exceeded 7 m/s. These are all soft ores. El Abra and
Los Pelambres in Chile are 6 m/s primary crushed copper ore. Key design factors
that govern the maximum belt conveyor speed:
a) Idler design — eccentricity or ovality of shell to bearing center and to a
lesser extent roll balance
- 7 -
b) Vibration — operating outside of any critical or fundamental vibration
mode of belt and idler coupling where the idler acts as the forcing function
and belt flap between idlers becomes destructive
c) Transfer Station Dynamics — loading and discharging dynamics
controlling ore flow, dust generation, impact in transfer chute damage ore,
maintenance of liners, impact and wear on receiving belt
d) Airborne Pollution — As the belt’s surface speed increases it causes fines
of increasing quantity and size to be blown off the ore stream
3. Stronger: Overland conveyor strength is governed by the splice dynamic fatigue
strength and by the tensile member strength [7] [8]. Belts are usually overrated
by engineers to account for:
a) differences among manufacturers
b) to meet peak design conditions without regard to the peak design
frequency of operation
c) due to overestimating the power and belt tension necessary to meet the
design criteria without regard for rolling resistance efficiency differences
among manufacturers.
Steel cord splice dynamic fatigue strength was set many years ago in the German
Standard DIN 22101 at 36% of breaking strength for an arbitrary 10,000 load
cycles. This equated to SF = 6.7 : 1. We have tested the integrity of belts up to
ST-8800 N/mm achieving 50% dynamic splice efficiency. These tests used a
Bridgestone belt. Keys to this success included special fatigue efficient splice
core rubber, special rubber stripping procedure, special non-conventional splice
patterns, special rubber molds to control the cable pattern, eliminating solvents in
the splice, and having accurate vulcanizing equipment. Goodyear has recently
achieved significant improvements in steel cord splice dynamic ratings using
similar techniques. ContiTech and Rema Tip-Top, in Germany, have
experimented with the concept but to my knowledge don’t practice it today.
Rema has perfected and markets the stripping machine worldwide.
The steel wire cord design is becoming the limiting condition. Cord
manufacturers claim the cord achieves infinite life at 25% of its breaking strength
when subjected to full cyclic fatigue. Alternative cord designs are being studied
as well as the pulley diameter to increase the cord fatigue strength. The
conveyor’s length and speed or load cycle frequency and loading histogram are
key operating parameters in estimating the appropriate belt SF, more so than
starting and stopping dynamics. In addition, the pulley size, number, location or
proximity to each other, surface geometry irregularities, and alignment can
significantly alter the necessary SF.
CDI provided a large coal operator a design manual justifying the range of belt
SF’s. In-plant, conveyors with short cycle times and numerous bend pulleys,
required SF = 10 : 1. Well designed overlands beyond 10 km in length could use
an SF = 3.8 : 1. These recommendations are based on extensive dynamic testing
of rubber and cables in fatigue testing machines.
- 8 -
4. Cheaper: Providing the most price competitive design is usually handicapped by
the owner’s or owner’s consultant’s ability to evaluate expected performance
versus risk of failure between tenders. All too often the owner hires a consultant
who is out of date with the technology, whose management is risk adverse in the
extreme, and who cannot fairly evaluate newer design techniques. Repeated
success stories need to be publicly circulated in various forums to become
recognized as valid alternatives to the antiquated standards which are cited as the
design procedure. Ultimately, the owner pays the bill. He must be assured there
is no risk before the large cost reductions can be realized.
Switching to performance guarantees and life cycle cost assessments is a good
first step that targets the many different cost areas where efficiency evaluating
will in and of themselves produce cost benefits. The other 10 items on this list
then become relevant.
5. Smaller: How narrow can the belt be? Tonnage, material density, rock size and
belt speed are the most important criteria. As the comfort zone for higher speed
and better loading efficiency, at transfers, are accepted, belts will drop in width
and strength. As the belt width drops, idler spacing can be increased, belt strength
is lowered, splice efficiency improves, pulley diameters decrease, less power may
be required, less structural support is required, and the premium for efficient
rolling resistant rubber is reduced due to the reduced quantity required (See note
2).
6. Negotiation of Difficult Terrain: Horizontal curves are now quite
commonplace. Still some clients frown on their use.
We use side guide rolls to restrain the belt width lateral travel during
commissioning and with critical load conditions to negotiate difficult undulating
terrain. The conveyor must track near its center when fully loaded. This may
restrict banking the idler set for other operating conditions. Thus, for
extraordinary dynamic loads or conveyor material loading, the belt must be
restrained. We recommend using side guide rolls at the entry to the discharge and
into the tail pulley during commissioning to protect the belt edge from damage.
Special idler frames can allow further belt lateral motion that is not available in
conventional troughed designs. Their purpose is to maintain the central ore
position on the belt that would otherwise slough or slump.
7. Safer with Less Risk: Proper elastic dynamic analysis of the systems controls
guarantees that the starting and stopping behavior will operate within the design
parameters. Very few, if any, larger, high power, or overland conveyors are
engineered without an elastic dynamic analysis. All major “what if” conditions
associated with belt dynamics can be evaluated, in an operating state, which
includes simulating various equipment or instrument failures.
8. Longer Life:

- 9 -
Chute Design Influence:
I quoted a job in which the client and consulting engineer recommended 20 mm
top cover and 10 mm bottom cover using a conventional chute rockbox load
station. The conveyor is 3 km long, loaded on a gradual incline. We
demonstrated that a 14 mm top cover and 6 mm bottom cover were adequate
when a curved chute was applied and that Bridgestone and Goodyear pro rata
warranted the belt cover life for 20 years. In fact, the ore cover belt life would in
all likelihood have exceeded 30 years. This reduction in covers and associated
savings resulted in a $1,500.000 USD NPV savings. The testimonial of
Palabora’s curved chute [5], 1.1 km length, 16 degree load station, and 3 mm
wear in 5.5 years was not sufficient (Life = 12 mm available x 5.5 years / 3 mm =
22 years), the 16 degree slope load station and 1/3 cycle time (60 years)
notwithstanding. Go figure. Large consulting engineering firms hold great
power, waste great sums of money, and squander our precious resources. There is
no incentive to spend research money and engineer better methods if these
antiquated professionals or deaf clients are allowed to control or restrict
advancements in our trade.
The point is that we can design the loading chute and meet a specified belt life
with less belt resources than yesterday and have the support of the belt
manufacturers, and now at least one owner (Rio Tinto). Or, conversely, the belt
life can be significantly extended beyond present expectations again, by properly
engineering the conveyor’s load chute. Contitech, Bridgestone and Goodyear
have all supported using a GF model to provide the life expectancy due to ore
flow dynamics at the transfer. It is a good beginning.
Influence of Picking the Right Idler L-10 Hour Value:
Idlers, pulleys, reducers and motors all run on bearing assemblies where operating
life is calculated by some probability formula. The bearing L-10 formula states
that no more than 10% of the bearings will fail, within the given L-10 hours
specified, At 5 times the L-10 hours, there is an equal (50-50) chance of success
or failure. This is the mean time or average time between failures, often called
the MTBF. Most conveyor idler and pulley specifications have large values
specified for the L-10 hour rating, like 60,000 or 100,000 hours. What is an
appropriate rating? I submit that the L-10 value, say for idlers, should be set by
the owner’s maintenance department. Following is an example:
Say the maintenance manager wishes to replace no more than one carryside idler
roll per 160 hour week of scheduled operation. He has a 1000 m long conveyor
with 2 m idler spacing. Thus he has 500 3-roll assemblies. Assume the center
roll carries 2/3 of the load. Each wing roll then carries 1/6. Let’s say the lower
wing bearing carries all the wing roll load. The center roll has two bearings; each
can fail. Therefore, the center roll fails twice as often as each bearing. Since, the
wing carries half the center roll, then its one bearing fails at 1/8 frequency of the
center roll bearing. The 500 center rolls then look like 1000 individual units. The
- 10 -
1000 wing rolls which fail 1/8 as often look like 1000/8 = 125 units equivalent to
the center roll. Therefore, the MTBF (1 failed unit) = 1125 units x 160
hours/week = 180,000 hours. The MTBF = 5 x L-10 hours or L10 = MTBF/5 =
180,000/5 = 36,000 hours.
There is a bit more in the detail, like belt alignment, off-center loading, idler
irregularities, installation irregularities, etc. Aside from these conditions, and the
likelihood of a continuous design tonnage, 36,000 L-10 life seems reasonable to
control the failure rate to one roll per week. So why do engineers specify 100,000
hours L-10 life? How many idlers should the maintenance crew change each
week or every other week? The allocation of maintenance time should be based
on their schedule of preventive maintenance and other repair duties. A cost of
maintenance time versus the higher cost of L-10 hour bearing size or spacing
should be equated. I prefer to minimize the idler assemblies by maximizing the
spacing until the penalty of power, belt strength, and belt elastic dynamics are in
balance with the cost savings in idler spacing. This is part of the LCC equation.
9. Enhanced Environmental Features: Visual esthetics should also be considered
when designing in an area where the general populace may interface. A series of
five idler troughing assemblies are shown in Figures 5A – 5E that provide a
reduced streamline profile, while protecting the belt against idler steel support
damage in the event the idlers were to dislodge due to some mode of failure.
Quintette in 1986 suffered a 9 million dollar belt tear due to the idler supports
knifing the belt. This occurred when a belt dynamics stopping shock wave
removed over 100 rolls from their supports. Had the idler been supported as
shown below, this damage would likely not have occurred.
Idler Frame Arrangements
Figure 5A – 5E illustrates five idler frame arrangements with various thoughts on
how to accomplish fitting of a pipe cross-member assembly to support the three
roll troughing idler assembly.
The purposes of the pipe:
a) Carry the vertical and torsional load from the rollers to the stringer
b) Act as a structural stiffener for the stringer, reducing steel content
c) Protect the belt from sharp steel corners and edges if the roller were to
dislodge
d) Hold accurate alignment of the idler to the theoretical position
e) Minimize the conveyor profile elevation in cross-section
In all cases, the carry-side idler rolls are attached to the pipe with the two wing
rolls on the near side to the observer and the center roll on the far side with the
belt moving toward the viewer.
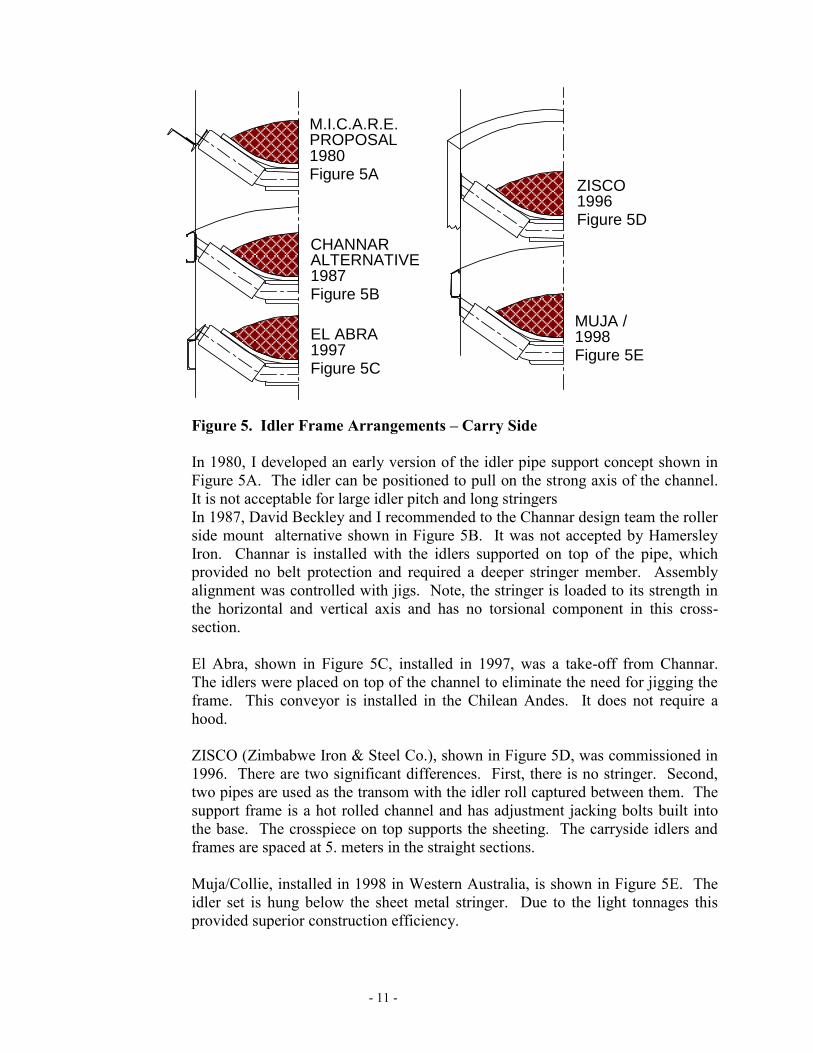
- 11 -
Figure 5. Idler Frame Arrangements – Carry Side
In 1980, I developed an early version of the idler pipe support concept shown in
Figure 5A. The idler can be positioned to pull on the strong axis of the channel.
It is not acceptable for large idler pitch and long stringers
In 1987, David Beckley and I recommended to the Channar design team the roller
side mount alternative shown in Figure 5B. It was not accepted by Hamersley
Iron. Channar is installed with the idlers supported on top of the pipe, which
provided no belt protection and required a deeper stringer member. Assembly
alignment was controlled with jigs. Note, the stringer is loaded to its strength in
the horizontal and vertical axis and has no torsional component in this cross-
section.
El Abra, shown in Figure 5C, installed in 1997, was a take-off from Channar.
The idlers were placed on top of the channel to eliminate the need for jigging the
frame. This conveyor is installed in the Chilean Andes. It does not require a
hood.
ZISCO (Zimbabwe Iron & Steel Co.), shown in Figure 5D, was commissioned in
1996. There are two significant differences. First, there is no stringer. Second,
two pipes are used as the transom with the idler roll captured between them. The
support frame is a hot rolled channel and has adjustment jacking bolts built into
the base. The crosspiece on top supports the sheeting. The carryside idlers and
frames are spaced at 5. meters in the straight sections.
Muja/Collie, installed in 1998 in Western Australia, is shown in Figure 5E. The
idler set is hung below the sheet metal stringer. Due to the light tonnages this
provided superior construction efficiency.
CHANNAR ALTERNATIVE 1987 Figure 5B
EL ABRA 1997 Figure 5C
M.I.C.A.R.E. PROPOSAL 1980 Figure 5A ZISCO
1996 Figure 5D
MUJA / COLLIE 1998 Figure 5E

- 12 -
Alternatives to these designs are being built today. While keeping the basic tenet
of protecting the belt and using the roller support integral with the idler
foundation system. The newer designs promise to be lighter, easier to install, and
requires less checking for alignment during installation.
10. Puncture Protection at Impact Stations: Granular Flow (GF) models can
identify the potentially damaging impact force of tramp metals, oversized rock or
other foreign bodies with the potential to puncture the belt or break its tensile
members (cables). The GF model must be combined with the belt’s impact
station design and support system to quantify damaging impact dynamics. Thus,
improved chute designs and impact tables can be identified / specified which can
protect against critical punctures and cable breaks. To date Rio Tinto is leading
the support in using GF models to design chutes in iron ore, bauxite, and copper
ore.
Palabora is a copper mine in South Africa. In 1994 they installed a curved chute
that feeds the primary crusher product (-250 mm) at 6500 t/h onto a 16 degree
slope belt. The curved chute was installed with a new belt. The old belt, fed by a
rockbox, wore down to the 12.4 mm diameter steel cords through an 18 mm top
cover in three years. The curved chute has protected the new belt from many
forms of damage. The present wear rate is 3 mm in more than 5 years. This is a
10:1 wear rate improvement. Crusher liners, shovel teeth, drill rods and other
open pit paraphernalia have been passed without belt damage. There has been
one incident where 9 cables were broken. Nobody knows what got onto the belt
at that time. There is no evidence it occurred at the chute. The old belt had many
such major tears, punctures and gouges. In summary, the curved chute has
virtually stopped major puncture damage as well as general wear. It’s probably
the best puncture protection you can buy.
11. Higher Availability: Higher availability comes from a) building stronger
components with longer MTBF, b) ease of operation with shorter MTTR (mean
time to repair), and c) having fewer components that can fail. Therefore, one
should weight the availability and reliability cost of adding components such as,
adding pulleys to gain better maintenance access.
Figures 6-8 illustrates some alternative pulley and belt arrangements around drive
stations, demonstrating the subjective influence of pulleys on availability.
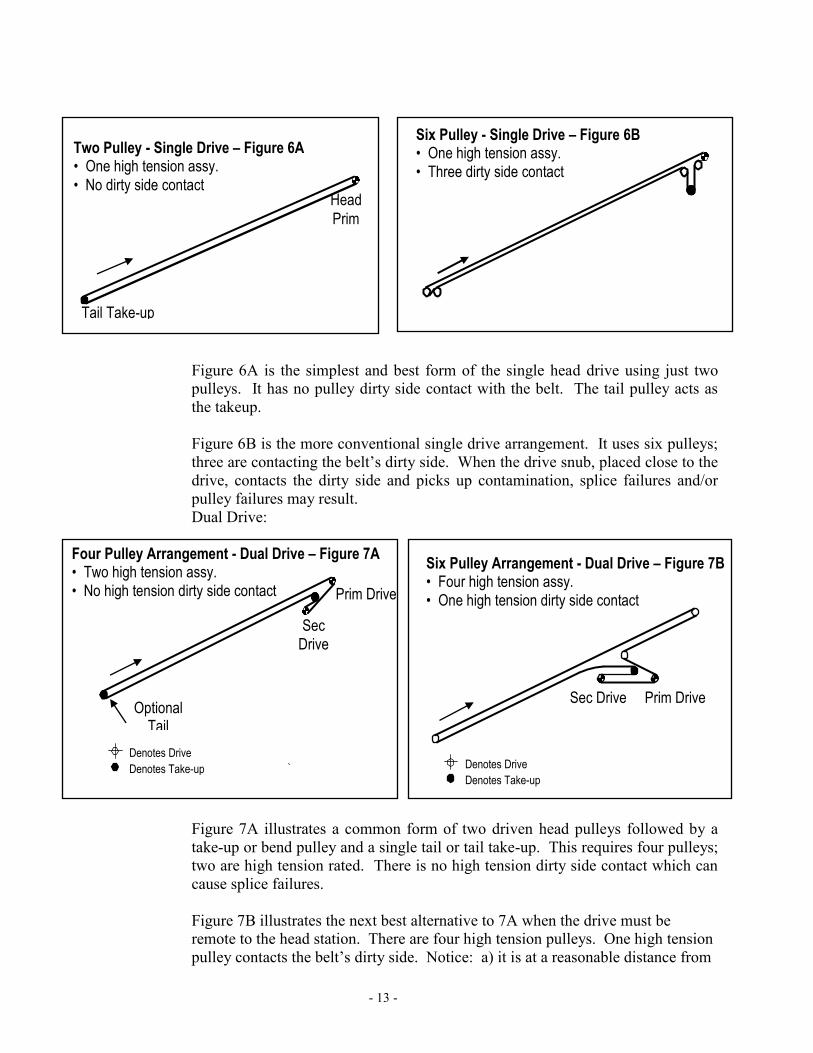
- 13 -
Figure 6A is the simplest and best form of the single head drive using just two
pulleys. It has no pulley dirty side contact with the belt. The tail pulley acts as
the takeup.
Figure 6B is the more conventional single drive arrangement. It uses six pulleys;
three are contacting the belt’s dirty side. When the drive snub, placed close to the
drive, contacts the dirty side and picks up contamination, splice failures and/or
pulley failures may result.
Dual Drive:
Figure 7A illustrates a common form of two driven head pulleys followed by a
take-up or bend pulley and a single tail or tail take-up. This requires four pulleys;
two are high tension rated. There is no high tension dirty side contact which can
cause splice failures.
Figure 7B illustrates the next best alternative to 7A when the drive must be
remote to the head station. There are four high tension pulleys. One high tension
pulley contacts the belt’s dirty side. Notice: a) it is at a reasonable distance from
Six Pulley - Single Drive – Figure 6B • One high tension assy. • Three dirty side contact
Head
Prim
Tail Take-up
Two Pulley - Single Drive – Figure 6A • One high tension assy.
• No dirty side contact
Four Pulley Arrangement - Dual Drive – Figure 7A • Two high tension assy. • No high tension dirty side contact
Optional Tail
Take-up
Sec Drive
Prim Drive
Denotes Take-up Denotes Drive
Six Pulley Arrangement - Dual Drive – Figure 7B • Four high tension assy. • One high tension dirty side contact
Sec Drive Prim Drive
Denotes Take-up Denotes Drive

- 14 -
the drive so that material buildup or lagging wear geometric influence on the
drive will be reduced due to the belt’s elastic strand length. b) the primary wrap
angle does not need to be 180o as will be discussed later, and c) foreign material
coming down the return strand from the head pulley will not be fed into the drive
or take-up station.
Figure 8A and 8B are drive systems we often see installed. Sometimes its not
avoidable, but the availability and reliability consequences are significant. Each
has 13 pulleys more than double the other alternatives. Six pulleys are high
tension not the 2 – 4 of Figure 7A & B. This can carry a cost penalty Three
pulleys are high tension dirty side contact not the 0 – 1 of Figure 7A & B. In total
8 pulleys contact the dirty side not the 1 – 2 of Figure 7A & B. Contaminants are
fed into the drive. Inverter power modules (VFD) must be deregulated to allow
for the local close proximity of irregular belt tension variations produced by the
dirty side bend pulleys.
Decreasing the high tension dirty side belt contact can exponentially reduce belt
splice failure rate and pulley shell failure.
13 Pulley Arrangement Dual Drive Alternative I – Figure 8A • Six high tension • Three high tension dirty side contacts
• Five mid and low tension dirty side controls
Major source of splice
and pulley failures
Prim Drive
Sec Drive
Take-up
13 Pulley Arrangement Dual Drive - Alternative II – Figure 8B • Six high tension • Three high tension dirty side contacts
• Five mid and low tension dirty side controls

- 15 -
3.0 CONCLUSION
I sincerely hope that some of these comments on improving efficiency find their way into
practice. And, that the number of points offered are added with the other offering of this
conference to fully make their efforts available.
I recommend the engineering community begin keeping a worldwide, electronically
accessible, running log of installations that all parties can access to obtain non-
proprietary information on world class installations to guide the decision process of
owners, consulting engineers, design engineers, constructors, and operators (similar in
concept to the free “on-line forum” of Bulk Solids Handling. A good project for a
university student? A simple form could be developed, in which the designer and owner
could fill out a specification sheet. The handler could program the information into
appropriate categories.
Figure 9 illustrates a condition that often confuses an engineer where the primary drive
pulley can satisfactorily operate with less belt wrap angle than the secondary drive.
The graph is a plot of the minimum required primary drive wrap angle, given:
a) secondary wrap angle (ranging from 150o to 230
o)
b) power ratio (primary : secondary)
c) drive pulley contact friction ranging from 0.2 to 0.4
d) secondary drive exit tension T3 is set to the minimum allowable to prevent slip
For Example, the graph shows that for a coefficient of friction of 0.30, secondary wrap of
190o, and a power ratio of 2:1 (worst case), the required primary wrap angle is 157
o, and
for a 1:1 power ratio, the required primary wrap angle is 88o. If the minimum T3 is raised
20%, this same primary wrap required would creep to 148o. Even with a secondary wrap
angle of 230o and a 2:1 power ratio, the primary wrap need only be 160
o.
Figure 9. Required Wrap Angle of Primary Drive

- 16 -
References:
[1] Nordell, L.K., “Improving Belt Conveyor Efficiencies: Power, Strength & Life,
W/Overland System Case Studies”, 4th
Annual Optimising Conveyor Performance in
Mining Conference, Australiasian Mining & Energy Taskforce, Perth & Sydney, Australia,
April 1998
[2] Nordell, L. K., "The Power of Rubber — Part 1" Bulk Solids Handling, Trans Tech
Publications, Vol. 16, No. 3, 1996.
[3] Goodyear, “Production Gone Flat” pp 34-36 Engineering Mining Journal, July 1999.
[4] Nordell, L. K., "The Channar 20 km Overland, A Flagship for Modern Belt Conveyor
Technology" Bulk Solids Handling, Trans Tech Publications, Vol. 11, No. 4, pp. 781-792,
November 1991.
[5] Nordell, L. K. and Van Heerden, J. J, “Technological Innovations Extend Life of
Palabora’s Main Slope Belt.” BELTCON 8 Conference, RSA, October 1995.
[6] Nordell, L. K., “Particle Flow Modeling: Transfer Chutes and Other Applications.”
BELTCON 9 conference, RSA, October 1997.
[7] Nordell, L. K., "Steel Cord Belt & Splice Construction: Modernizing Their Specifications;
Improving Their Economics" Bulk Solids Handling, Trans Tech Publications, Vol. 13, No.
4, 1993.
[8] Nordell, L. K., "Steel Cord Splice Design and Fabrication Techniques", AIME-SME
Annual Convention Reno, Nevada, February 1993.