recent applications of analytical techniques for ... · pdf filerecent applications of...
TRANSCRIPT

Recent applications of analytical techniques for quantitative
pharmaceutical analysis: a review
RUDY BONFILIO Departamento de Fármacos e Medicamentos, Faculdade de Ciências Farmacêuticas
Univ Estadual Paulista (UNESP) Rodovia Araraquara-Jaú, km 1, CEP 14801-902. Araraquara-SP
BRAZIL. [email protected] www.fcfar.unesp.br
MAGALI BENJAMIM DE ARAÚJO Faculdade de Ciências Farmacêuticas
Universidade Federal de Alfenas (UNIFAL-MG) Rua Gabriel Monteiro da Silva, 700, 37130-000. Alfenas-MG
BRAZIL. [email protected] http://www.unifal-mg.edu.br
HÉRIDA REGINA NUNES SALGADO
Departamento de Fármacos e Medicamentos, Faculdade de Ciências Farmacêuticas Univ Estadual Paulista (UNESP)
Rodovia Araraquara-Jaú, km 1, CEP 14801-902. Araraquara-SP BRAZIL.
[email protected] www.fcfar.unesp.br Abstract: The intension of this paper was to review and discuss some of the current quantitative analytical procedures which are used for quality control of pharmaceutical products. The selected papers were organized according to the analytical technique employed. Several techniques like ultraviolet/visible spectrophotometry, fluorimetry, titrimetry, electroanalytical techniques, chromatographic methods (thin-layer chromatography, gas chromatography and high-performance liquid chromatography), capillary electrophoresis and vibrational spectroscopies are the main techniques that have been used for the quantitative analysis of pharmaceutical compounds. In conclusion, although simple techniques such as UV/VIS spectrophotometry and TLC are still extensively employed, HPLC is the most popular instrumental technique used for the analysis of pharmaceuticals. Besides, a review of recent works in the area of pharmaceutical analysis showed a trend in the application of techniques increasingly rapid such as ultra performance liquid chromatography and the use of sensitive and specific detectors as mass spectrometers. Keywords: pharmaceutical analysis; pharmaceutical quality control; analytical techniques.
1 Introduction From an analytical point of view, methods for
pharmaceutical analysis are considerably less complex than methods for analysis of drugs and their metabolites in biological samples as blood, plasma, hair or urine. However, the unequivocal determination of a drug in pharmaceutical formulations is as important as determination in complex matrices, because the pharmaceutical product quality is directly related to patient health.
In the drug development and pharmaceutical control, chemical analysis plays a key role to ensure a high efficacy and safety for patients.
For this reason, appropriate methods of quality control (qualitative and quantitative analyses, purity testing, chiral separation, related substance and stoichiometric determination) are of paramount importance to the pharmaceutical industry [1].
Pharmaceutical research is developing increasingly complex molecules and drug formulations, and each novel and highly selective analytical technique is therefore of much potential interest [2]. Thus, the pharmaceutical quality control should ensure use of appropriate analytical methods, of which it is observed a trend to utilize
WSEAS TRANSACTIONS on BIOLOGY and BIOMEDICINE Rudy Bonfilio, Magali Benjamim De Araujo, Herida Regina Nunes Salgado
ISSN: 1109-9518 316 Issue 4, Volume 7, October 2010

faster and more efficient techniques with cost savings and reduction in solvent consumption.
Due to the importance of methods for pharmaceutical quality control and the need for fast, reliable and unequivocal analytical techniques, in the present work we reviewed some of the recent quantitative published analytical methods and their applications in pharmaceutical analysis, mainly from 2008 to 2010. The selected papers were organized according to the analytical technique employed. Several techniques like ultraviolet/visible (UV/VIS) spectrophotometry, fluorimetry, titrimetry, electroanalytical techniques (mainly voltammetry), chromatographic methods (thin-layer chromatography (TLC), gas chromatography (CG) and mainly high-performance liquid chromatography (HPLC)), capillary electrophoresis (CE) and vibrational spectroscopies are the main techniques that have been used for the quantitative analysis of pharmaceutical compounds.
2 Analytical methods for
pharmaceutical analysis
2.1 UV/VIS spectrophotometric methods Several UV/VIS spectrophotometric tests have
been widely developed to quantify pharmaceutical active ingredients. As most pharmaceuticals possess chromophore groups, they can be determined directly in the ultraviolet region without the need for a derivatization reaction. The common availability of the instrumentation, the simplicity of procedures, economy, speed, precision and accuracy of the technique still make spectrophotometric methods attractive [3].
However, direct UV/VIS spectrophotometric method is not suitable for simultaneous determination of drugs with spectral overlapping [3]. For this reason, derivative spectrophotometry offers an alternative approach to the enhancement of sensitivity and specificity in mixture analysis. This technique has been frequently used to extract information from overlapping bands of the analytes and interferences. It consists of calculating and plotting one of the mathematical derivatives of a spectral curve [4].
Other features to resolve overlapping bands are principal component regression (PCR) and partial least squares (PLS) calibration models. In PCR and PLS, the calibration involves correlating the data in the spectral matrix X with the data in the
concentration matrix Y. The X and the Y matrices are reduced to only a few factors using all available information [5]. A linear calibration model relating the multicomponent outputs of the spectrometer is then established [6]. Some recent examples of spectrophotometric applications in quantitative pharmaceutical analysis are described below.
Gujral, Haque and Shanker [7] developed and validated a simple UV spectrophotometric method for the determination of pregabalin (PGB) in bulk, pharmaceutical formulations and in human urine samples. The stock and work solutions were prepared in double distilled water. Absorbance was measured at 210 nm against the reagent blank. The authors concluded that the proposed method does not require any laborious clean up procedure before measurement and that no interference from the common excipients and additives was observed. The proposed method is simple, sensitive (detection and quantitation limits of 2.47 x 10⁻¹ and 8.15 x 10-
2 µg mL-1, respectively) and rapid. Because PGB is not yet listed in any pharmacopoeia, this method is useful in quality control laboratories, which can validate and apply it in routine analyses. Moreover, this presented low cost technique can help clinical laboratories to analyze unabsorbed PGB in urine, since most of the clinical laboratories do not have number of HPLC.
Moreira and coworkers [8] developed and validated two methods, based on HPLC and UV spectrophotometry for the quantitative determination of lumiracoxib in tablets. The UV method was based on absorbance at 275 nm, with ethanol as solvent. The authors concluded that the spectrophotometric method is a simple, cheap and less time-consuming method and they stated that the chromatographic method is selective for the determination of the degradation products of lumiracoxib. However, despite the chromatographic method is more complex, generate large amounts of waste, and is considered as more time-consuming, a separation between lumiracoxib and degradation products was obtained in less than five minutes by using HPLC method. The detection limits of the HPLC and spectrophotometric methods were 0.69 and 0.44 µg mL-1, showing that both methods are sufficiently sensitive. Moreover, there is no pharmacopoeial method reported for analysis of this drug. Therefore, both presented methods are useful to the area of pharmaceutical analysis.
El-Gindy, Emara, and Shaaban [9] published a chromatographic and two chemometric methods for the determination of two ternary mixtures containing drotaverine hydrochloride (DR) with
WSEAS TRANSACTIONS on BIOLOGY and BIOMEDICINE Rudy Bonfilio, Magali Benjamim De Araujo, Herida Regina Nunes Salgado
ISSN: 1109-9518 317 Issue 4, Volume 7, October 2010

caffeine and paracetamol (mixture 1) and DR with metronidazole and diloxanide furoate (mixture 2). The chemometric methods applied were PLS and PCR. These approaches were applied using information included in the UV absorption spectra of appropriate solutions in the wavelength range of 210–300 nm with 1 nm intervals. Calibration of PCR and PLS models was evaluated by internal validation, by crossvalidation and by external validation. The authors showed that the proposed methods were successfully applied for the determination of the two ternary combinations in laboratory-prepared mixtures and commercial tablets. Besides, according to the authors, the results of PLS and PCR methods were compared with the HPLC method, and a good agreement was found. All methods show adequate sensitivity for all analytes (detections limits less than 1.99 x 10⁻² µg mL-1). This paper also presents a novelty, because no United States, British, or European compendia analytical method has been reported for the simultaneous determination of the five drugs in the two studied ternary mixtures.
Storlarczyc [10] and coworkers used first and second order derivative spectrophotometric methods for individual determination of fluphenazine, pernazine, haloperidol and promazine using methanol as solvent at two wavelengths. The authors concluded that no interference of matrix constituents was observed and that the developed method can be useful for quality control of drugs and it is an option for commonly used expensive chromatographic methods. This method proved satisfactory, although poor sensitivity for all drugs (detections limits less than 3.23 µg mL-1). Although the authors present this method as a simple option to chromatographic methods, all drugs are listed in pharmacopoeias. The USP [11] and the British pharmacopoeia (BP) [12] describe methods for analysis of these drugs in tablets as titrimetry, direct and derivative spectrophotometry and HPLC. Therefore, this work does not present a novelty from an analytical point of view.
Although the described spectrophotometric methods show the advantages mentioned by the authors such as simplicity, low cost and speed of analysis, this technique frequently does not allow the analysis of related substances, which make it disadvantageous.
2.2 Fluorimetric methods Luminescence spectroscopy is an analytical tool
extremely sensitive and has been widely applied in solving problems that require low detection limits
[13]. This technique is applied for the analysis of concentrations in the ng mL-1 range and, sometimes, in the pg mL-1 range in complex matrices [14]. Thus, measurements of luminescence intensity have allowed the selective and sensitive quantitative determination of a variety of active pharmaceutical ingredients. However, despite all the advantages of luminescent methods, only certain classes of compounds exhibit luminescence native, as a consequence of the deactivation processes occurring in a molecule. Moreover, the effects of scattering and absorption limit the use of luminescent methods when compared to other analytical methods such as chromatography and UV/visible spectrophotometry [13]. Luminescence spectroscopy can be applied using three different processes: fluorescence, phosphorescence or chemiluminescence. However, fluorimetry is the most commonly luminescence method used in pharmaceutical analysis. Therefore, below are described relevant examples of fluorimetric methods applied to analysis of pharmaceuticals.
Abdel and Shaalan [15] developed spectrofluorimetric and spectrophotometric methods for the determination of pregabalin (PRG). In the spectrofluorimetric method, PRG was reacted with fluorescamine. The optimum conditions were ascertained and the spectrofluorimetric method was applied to the determination of the drug in capsules. According to the authors, no interference could be observed from the additives listed to be in capsules. Furthermore, the spectrofluorimetric method was extended to the in-vitro determination of pregabalin in spiked urine and interference from endogenous amino acids could be eliminated through selective complexation with copper acetate and co-administered drugs such as chlordiazepoxide, clonazepam, diazepam, nitrazepam and lamotrigine did not interfere with the assay. As the method cited in reference number 7, since there is no monograph for PGB in any pharmacopoeia, this work is relevant to quality control and clinical laboratories. Also, the concentration range was 20-280 ng mL-1 for spectrofluorimetric method and 1-7 µg mL-1 for spectrophotometry. The method proposed by Gujral, Haque and Shanker [7] was linear in the range of 0.5–5.0 µg mL-1. These results show that the spectrofluorimetric method is more sensitive than the mentioned spectrophotometric methods for determination of this drug.
El-Enany and coworkers [16] developed a second derivative fluorimetric method for the simultaneous analysis of binary mixture of chlorzoxazone (CLZ) and ibuprofen (IP). Because
WSEAS TRANSACTIONS on BIOLOGY and BIOMEDICINE Rudy Bonfilio, Magali Benjamim De Araujo, Herida Regina Nunes Salgado
ISSN: 1109-9518 318 Issue 4, Volume 7, October 2010

CLZ and IP exhibit native fluorescence, the method proposed by the authors was based on measurement of the synchronous fluorescence intensity of these drugs in methanol. However, both the excitation and emission spectra of CLZ and IP overlapped. Then, a second derivative fluorescence spectrum of CLZ and IP was derived from the normal synchronous spectra. The different experimental parameters affecting the fluorescence of the two drugs (∆λ selection, pH, type of the diluting solvent, stability time and ionic strength) were optimized. The authors stated that the high sensitivity attained by the proposed method allowed the determination of both drugs in their co-formulated dosage forms and biological fluids and real human plasma samples. USP [11] recommends spectrophotometric method for determination of CLZ in pure form and HPLC method for its determination in tablets. For IP, BP [12] recommended direct titration for analysis of raw material, while USP [11] recommends an HPLC technique. However, a method for simultaneous analysis of these drugs does not appear in pharmacopoeias, which shows an analytical advantage of the fluorimetric method. Besides, this method showed a high sensitivity with low quantitation limits (0.086 and 0.03 µg mL-1 for CLZ and IP, respectively), Walash and coworkers [17] developed two methods for the determination of rosiglitazone maleate (ROZ) in pure form, pharmaceutical preparations, and biological fluids. Method I was a spectrophotometry method. Method II was based on the spectrofluorimetric determination of ROZ through complex formation with Al+3 in acetate buffer of pH 5. The relative fluorescence of the drug was measured at 376 nm after excitation at 318 nm. Both methods were applied for the determination of ROZ in tablets. Furthermore, method II was applied for the determination of ROZ in spiked and real human plasma. The stability of the formed complexes in both methods was studied by the authors, and the proposed methods were found to be stability indicating ones. No United States [11], British [12] or European [18] compendia analytical method has been reported for analysis of ROZ. Moreover, the quantification limit of the spectrofluorimetric method was 0.02 µg ml-1 demonstrating the sensitivity of this technique to human plasma applications, making it attractive to laboratories lacking sophisticated separation techniques. Walash and coworkers [19] published a kinetic spectrofluorimetric method for the individual determination of verapamil
hydrochloride, diltiazem hydrochloride, nicardipine hydrochloride and flunarizine using water as diluting solvent. The method was based on oxidation of the studied drugs with cerium ammonium sulphate in acidic medium. The fluorescence of the produced Ce was measured at 365 nm after excitation at 255 nm. The different experimental parameters affecting the development and stability of the reaction product (Ce concentration, type of acid and its concentration, heating time, temperature and diluting solvents) were individually optimized. The method was applied to the analysis of commercial tablets and the authors concluded that the proposed method is simple, rapid and inexpensive. Both BP [12] and USP [11] recommend non-aqueous titration for analysis of verapamil hydrochloride raw material, the USP describes a HPLC method for analysis in tablets and the BP recommends spectrophotometric method for its formulations. Regarding diltiazem hydrochloride, the BP recommends HPLC for related substances, non-aqueous titration for assay of raw material and the USP recommends HPLC method for the raw material and for its formulations. Nicardipine and flunarizine are not yet listed in Pharmacopoeias, making the proposed method more attractive for the later two drugs. Also, the method showed good sensitivity for all drugs. Marques, da Cunha and Aucélio [20] developed a fluorimetric method to quantify camptothecin (CPT) in irinotecan (CPT-11) and in topotecan (TPT) based anti-cancer drugs. For samples containing TPT, detection was made at 368 nm; whereas, in samples containing CPT-11, the detection was made at 267 nm isodifferential wavelength, using the second derivative of the synchronized spectrum. The authors concluded that in practical terms, determinations using spectrofluorimetry were made in a faster, cheaper, and simpler way when compared to the ones made using HPLC. This work is relevant because no USP [11], BP [12], or European Pharmacopoeia (EP) [18] has been reported a method for the determination of these drugs. Besides, the method was sensitive, with limits of detection of about 9 ng mL-1, making this method an interesting alternative to chromatographic techniques.
Omar [21] developed spectrophotometric and spectrofluorimetric methods for the determination of hydrochlorothiazide, indapamide and xipamide based on ternary complex formation with eosin and lead in the presence of methylcellulose as surfactant. The fluorescence method was investigated for the purpose of enhancing the
WSEAS TRANSACTIONS on BIOLOGY and BIOMEDICINE Rudy Bonfilio, Magali Benjamim De Araujo, Herida Regina Nunes Salgado
ISSN: 1109-9518 319 Issue 4, Volume 7, October 2010

sensitivity of the determination. According to the author, both methods have been fully validated and successfully applied for the determination of the studied drugs in their pharmaceutical tablets. Moreover, common excipients used as additives in tablets do not interfere with the proposed methods. The USP [11] describes HPLC method for hydrochlorothiazide raw material and for tablets. BP [12] recommends titration for raw material and spectrophotometry for tablets. Regarding indapamide, both USP and BP recommend a HPLC method for raw material and for tablets. No United States, British or European compendia analytical method has been reported for ximpamide. The positives of these methods are the simplicity (prior extraction is not necessary), good sensitivity (quantitation limits less than 0.15 µg mL-1), and possibility of application to pharmaceutical tablets.
Rahman, Siddiqui and Azmi [22] developed a spectrofluorimetric method for the determination of doxepin hydrochloride in commercial dosage forms. The method was based on the fluorescent ion pair complex formation of the drug with eosin in the presence of sodium acetate–acetic acid buffer solution of pH 4.52. The extracted complex showed fluorescence intensity at 567 nm after excitation at 464 nm. According to the authors, the method has been successfully applied to the determination of doxepin hydrochloride in commercial dosage forms. USP [11] recommends HPLC method for determination of doxepin hydrochloride in pure form and capsules. The BP [12] recommends titration for assay of doxepin hydrochloride raw material and there is no monograph for its formulations. This method has the advantage of having simple operation and high sensitivity (limit of quantitation of 8.93 ng mL-1).
The spectrofluorimetric methods cited in this paper have the advantage of being highly sensitive in comparison with spectrophotometric methods and even when compared with chromatographic techniques. Moreover, due the fact that few molecules present luminescence native, these methods are considerably selective, allowing the quantitation of some drugs in biological matrices. However, the limitations of this technique are the possibility of analyzing only luminescent compounds or the need for derivatization reactions, which make the analysis more complex and time consuming. Another interesting factor is that fluorimetric methods generally do not allow the analysis of related substances, limiting this technique in quality control applications.
2.3 Titrimetric methods Although titrimetry has already been
extensively used in past years, a literature search reveals that there are few recent methods that employ this technique for analysis of pharmaceuticals. Some of the advantages of titrimetry are short time of analysis and low cost of equipment required. However, titrimetric methods show lack of selectivity when compared to modern separation techniques such as HPLC or capillary electrophoresis, which probably led to the current disuse of titrimetric techniques. Below are listed some recent applications of this technique in pharmaceutical analysis.
Basavaiah and coworkers [23] developed and optimized four methods for the determination of stavudine (STV) in bulk drug and in dosage forms by titrimetry and spectrophotometry. In titrimetry, aqueous solution of STV was treated with a known excess of bromate-bromide in HCl medium followed by estimation of unreacted bromine by iodometric back titration. Calculations in titrimetry were based on a 1:0.666 (STV: KBrO3) stoichiometry. According to the authors, the methods when applied to the determination of STV in tablets and capsules were found to give satisfactory results. USP [11] and BP [12] recommend HPLC method for assay and related substance of STV in pure form. Also, USP recommends HPLC method for its formulations. Although the titrimetric method is simple, rapid and cost-effective, it does not have analytical advantages over HPLC and spectrophotometric methods, when considering the sensitivity and specificity. However, the titrimetric method was able to quantify STV in drug formulations, which may not be possible in other cases by using this simple analytical technique.
Mostafa and AlGohani [24] described a spectrophotometric method and two titrimetric methods for the determination of nordiazepam. According to the authors, these methods depend on the reaction of nordiazepam with potassium bismuth iodide which give an orange precipitate. Determination of nordiazepam by titrimety in the precipitated complex is done iodometrically using standard potassium iodate solution or complexometrically using standard EDTA solution and xylenol orange indicator. The proposed methods were applied by the authors for the determination of nordiazepam in tablets and the validity of the proposed methods was assessed by applying the standard addition technique. No USP [11], BP [12], or EP [18] has been reported a method for the determination of nordiazem.
WSEAS TRANSACTIONS on BIOLOGY and BIOMEDICINE Rudy Bonfilio, Magali Benjamim De Araujo, Herida Regina Nunes Salgado
ISSN: 1109-9518 320 Issue 4, Volume 7, October 2010
Therefore, the presented methods, although simple, can be used in analytical laboratories that have limited resources.
Rajendraprasad, Kanakapura and Vinay [25] developed two titrimetric methods for the determination of hydroxyzine dihydrochloride (HDH) in pure form and in tablets. The methods were based on acid–base reactions in which the hydrochloride content of the drug was determined by titrating with an aqueous standardized NaOH solution either visually using phenolphthalein as indicator or potentiometrically using glass-calomel electrode system. The procedures were also applied for the determination of HDH in its dosage forms and, according to the authors, the results were found to be in good agreement with those obtained by the reference method. USP [11] method for assay and related substance for this drug in pure form and its formulations is by HPLC. BP [12] recommends potentiometric titration for assay of raw material. Therefore, this method, although it was applied in tablets, presents no novelty from an analytical point of view. Ramesh and coworkers [26] described one titrimetric and two spectrophotometric methods for the determination of doxycycline hyclate (DCH) in bulk drug and in its formulations. In titrimetry, DCH was treated with a known excess of bromate-bromide mixture in acid medium and the residual bromine is back titrated iodometrically after the reaction between DCH and in situ bromine. The authors concluded that the proposed titrimetric procedure is far simpler than the published methods since it is free from critical working conditions and does not use any expensive instrumentation. USP [11] and BP [12] methods for assay and related substance for this drug in pure form and its formulations are by HPLC. The authors compared statistically the obtained results with the official BP method and no significant difference existed between the proposed methods and the reference method. Furthermore, the authors compared the sensitivity of the methods with those reported in the literature and show that the proposed methods are one of the most sensitive ever reported for DCH. So, the proposed methods are interesting alternatives to laboratories that do not have HPLC equipments.
De Sousa and Cavalheiro [27] described a titrimetric procedure for the determination of minoxidil using KMnO4 as oxidizing agent. The best conditions were optimized considering the H2SO4, KMnO4 and minoxidil concentrations, the temperature of the system and the order of addition of the reactants. A comparison with a
chromatographic procedure reveled relative errors of -1.00 to - 5.26 %. The authors concluded that the method was relatively fast, easy to perform and can be a low cost alternative for pharmaceutical samples in which minoxidil concentration is relatively high. USP [11] method for assay and related substance for minoxidil in pure form and its formulations is by HPLC. BP [12] recommends potentiometric titration for assay of raw material. Thus, this method, although showed similar results when compared to a chromatographic technique, presents no analytical novelty.
As can been seem in this subsection, titrimetric methods are cost-effective, require simple instrumentation, are quick and easy to perform. Indeed, due to its lack of selectivity, this technique is falling into disuse. For this reason, recent papers that employ titrimetry are rarely found in international journals. Consequently, several citations that employing titrimetry have been published in local journals.
2.4 Electroanalytical Methods Electrochemical techniques provide high
sensitivity, low detection limits, associated with the use of simple and inexpensive instrumentation [28]. Electrogravimetry, coulometry, conductometry, potentiometry, polarography, voltammetry and amperometry are electrochemical techniques that have been employed for drug analysis in dosage forms. However, voltammetric techniques are by far the most employed electrochemical techniques and the literature brings comprehensive reviews about their use for drug analysis in dosage forms [28]. The following will describe some examples of electroanalytical methods applied in pharmaceutical analysis.
Babaei, Afrasiabi and Babazadeh [29] constructed a new chemically modified electrode based on multiwalled carbon nanotube/chitosan modified glassy carbon electrode (MWCNTs-CHT/GCE) for simultaneous determination of acetaminophen (ACT) and mefenamic acid (MEF) in aqueous buffered media. The measurements were carried out by application of differential pulse voltammetry (DPV), cyclic voltammetry (CV) and chronoamperometry (CA) methods. According to the authors, the analytical performance of DPV method has been evaluated for detection of ACT and MEF in human serum, human urine and a pharmaceutical preparation with satisfactory results. USP [11] recommends spectrophotometry for determination of ACT in pure form and HPLC for its determination in pharmaceutical dosage
WSEAS TRANSACTIONS on BIOLOGY and BIOMEDICINE Rudy Bonfilio, Magali Benjamim De Araujo, Herida Regina Nunes Salgado
ISSN: 1109-9518 321 Issue 4, Volume 7, October 2010

forms. BP [12] recommends HPLC for analysis of related substances of ACT, titration for assay of raw material and suppositories, spectrophotometry for assay of tablets, and HPLC for assay of capsules and oral suspension. For MEF, USP method for related substance and assay of raw material and drug formulations is by HPLC. BP recommends thin-layer chromatography for related substances analysis, titration for assay of raw material and HPLC for analysis of its dosage forms. Although combinations of MEF and ACT are frequently prescribed, a monograph for simultaneous analysis of these two drugs was not found. Therefore, the proposed method is relevant, also is simple, inexpensive, quick and sensitive (detections limits of 0.66 µmol L-1 and 0.46 µmol L-1 for MEF and ACT, respectively). Besides, the authors demonstrated the method’s applicability in human serum, human urine and drug samples. Thus, this method is an interesting alternative to described methods.
Campestrini and coworkers [30] employed a bismuth-film electrode for use in to quantify sulfadiazine in pharmaceutical formulations. The bismuth film was deposited ex situ onto a glassy carbon substrate. Analysis of two sulfa drugs was carried out by differential-pulse voltammetry in 0.05 mol L−1 Britton–Robinson pH 4.5 solution. The authors concluded that the bismuth-film electrode was demonstrated to be suitable for direct cathodic voltammetric determination of sulfadiazine. USP [11] method for assay of this drug in pure form and its formulations is by HPLC. BP [12] recommends thin-layer chromatography for related substances analysis, and titration for assay of raw material and its dosage forms. The authors compared the precision of the proposed method to the BP standard titration method through statistical examination and they showed that the results are equivalent. The positives of this method are the simplicity, good sensitivity (detection limit of 2.1 µmol L-1), low-cost and possibility of application to pharmaceuticals.
Jain and coworkers [31] studied electroreduction and adsorption of cefixime in phosphate buffer by cyclic voltammetry (CV), differential pulse cathodic adsorptive stripping voltammetry (DPCAdSV), and square-wave cathodic adsorptive stripping voltammetry (SWCAdSV) at hanging mercury drop electrode (HMDE). These voltammetric procedures were applied for the trace determination of the bulk drug in pharmaceutical formulations and in human urine using the follows experimental parameters: accumulation potential = -0.1 V (vs. Ag/AgCl, 3
MKCl), accumulation time = 50 s, frequency = 140 Hz, pulse amplitude = 0.07 V, and scan increment = 10 mV in phosphate buffer (pH 2.6). The authors concluded that the principal advantages of the proposed voltammetric method are its rapidity and simplicity. USP [11] and EP [18] method for assay of cefixime in raw material and its formulations is by HPLC. Also, EP describes a HPLC method for analysis of related substances of this drug. An interesting point is that the authors applied the method to determine cefixime in pharmaceutical formulation and spiked human urine. The positives of this method are the simplicity, rapidity, it involves no cleanup procedures and has a good sensitivity (detection limit of 3.99 ng mL-1).
Lima-Neto and coworkers [32] developed an electroanalytical procedure for determination of nitrofurantoin (NFT) and investigated the influence of the boron-doping levels in boron-doped diamond film electrodes on the electrochemical response of NFT. The investigations were carried out using the techniques of cyclic voltammetry and square wave voltammetry. The authors stated that the level of boron-doping in the diamond film electrodes influenced the electrochemical reduction of NFT. The appropriate cyclic voltammetric response of NFT was obtained with Britton–Robinson buffer at pH 4 and for diamond films doped with 10 000 and 20 000 mgL−1 of boron. The authors tested the applicability of the proposed procedure using a commercial pharmaceutical formulation of NFT and concluded that the method presents the advantage of eliminating mercury waste and minimizing the adsorptive problems related to the use of other electrodic solid surfaces. USP [11] method for assay of NFT in raw material and its formulations is by HPLC. BP [12] recommends thin-layer chromatography for related substances analysis and spectrofotometry for assay of raw material, oral suspension and tablets. The advantages of this method are that it did not require complex preparations or renovation of the electrode surface; it is environmentally friendly and sensitive (quantitation limit of 0.021 µg mL-1). However, the method was not applied to biological matrices, as seen in other reported electroanalytical methods.
Sartori and coworkers [33] described the independent determination of propranolol (PROP) and atenolol (ATN) in pharmaceutical formulations using square-wave voltammetry and a cathodically pretreated borondoped diamond electrode. The electroanalytical determinations of propranolol or atenolol were carried out in 0.1 mol L−1 H2SO4 or 0.5 mol L−1 NaNO3 (pH 1.0, adjusted with concentrated HNO3), respectively. According to the
WSEAS TRANSACTIONS on BIOLOGY and BIOMEDICINE Rudy Bonfilio, Magali Benjamim De Araujo, Herida Regina Nunes Salgado
ISSN: 1109-9518 322 Issue 4, Volume 7, October 2010
authors, the proposed method was successfully applied in the determination of both drugs in several pharmaceutical formulations (tablets), with results in close agreement at a 95% confidence level with those obtained using official spectrophotometric methods. USP [11] method for assay of PROP in raw material and its formulations is by HPLC. EP [18] recommends HPLC for analysis of related substances and tritation for assay of raw material. For ATN, EP describes a HPLC method for analysis of related substances and tritation for assay of raw material. BP [12] recommends HPLC for analysis of related substances, titration for assay of raw material, spectrophotometry for quantitation of ATN injection, HPLC for assay of oral solution and spectrophotometry for tablets. The presented methods are interesting alternatives to pharmacopoeial methods, because the simultaneous determination of these drugs is not described in USP, BP or EP. Additionally, the reported methods are sensitive (low detections limits for two drugs), simple, rapid, and dispenses any use of organic reagents or expensive apparatus. However, the authors do not consider an application of the method to biological matrices.
Veiga and coworkers [34] used a multi-walled carbon nanotubes (MWCNTs) film-coated glassy carbon electrode (GCE) for the voltammetric determination of carbamazepine (CBZ). According to the authors, the voltammetric response of CBZ at this film-modified electrode increased significantly when compared with that at a bare glassy carbon electrode and the sensor response was reproducible. The proposed method was applied to the quantification of CBZ in wastewater samples, collected in a municipal wastewater treatment plant, and in pharmaceutical formulations. The authors stated that the developed methodology yields results in accord with those obtained by chromatographic techniques. USP [11] method for assay of CBZ in raw material and its formulations is by HPLC. BP [12] recommends HPLC method for analysis of related substances and for assay of raw material and tables. The method described by Veiga and coworkers is a relevant alternative to pharmacopoeial methods, because is simple, rapid, low cost and highly sensitive (limits of detection and quantification of 40 and 140 nMol L-1, respectively). Moreover, the authors applied the proposed method to the quantification of CBZ in commercially available medicinal tablets and in wastewater samples and compared the method with those obtained by HPLC–UV and LC–MS
techniques, showing that the results are in accordance.
From these examples, it can be seen that electroanalytical methods are a good alternative to HPLC methods for assay of drugs formulations. The advantages of electrochemical techniques (mainly voltammetry) are good sensitivity, reasonable speed, minimal sample pre-treatment, satisfactory selectivity, wide applicability, and low cost of instrumentation and maintenance. In this subsection, we cited applications in environmental analysis and in biological matrices, which demonstrates the usefulness of this technique. However, much work is required before voltammetry can be adopted as a routine analytical method. Besides, this technique is not often used in analysis of related substances, as is observed with powerful separation techniques such as HPLC and capillary electrophoresis.
2.5 Chromatographic methods
2.5.1 Thin-layer chromatography
Thin-layer chromatography (TLC) is a simple, moderately sensitive, rapid, and inexpensive technique that is employed for the analysis of pharmaceutical products. TLC has been shown in many publications to provide excellent separation and qualitative and quantitative analysis of a wide range of organic and metal-organic compounds [35]. In pharmaceutical analysis, TLC is predominantly used in its semiquantitative mode, where spots of reference tests solutions are visually against the impurity spots in a chromatogram of the test sample. However, most of the TLC procedures are considered an obsolete form of impurity testing. In addition, the progress in sorbent layers and instrumentation has led to an improvement of the reliability of quantitative planar chromatography, making this technique an economical alternative that competes with and complements HPLC [36]. Below are listed some recent examples of TLC applications in the field of pharmaceutical analysis.
Abdel-Fattah and coworkers [37] developed three stability-indicating assay methods for the determination of tropisetron in a pharmaceutical dosage form in the presence of its degradation products. The proposed techniques were HPLC, TLC, and first-derivative spectrophotometry. The authors carried out an acid degradation, separated the degradation products by TLC and identified by IR, NMR, and MS techniques. The TLC method was based on the separation of tropisetron and its acid-induced degradation products, followed by
WSEAS TRANSACTIONS on BIOLOGY and BIOMEDICINE Rudy Bonfilio, Magali Benjamim De Araujo, Herida Regina Nunes Salgado
ISSN: 1109-9518 323 Issue 4, Volume 7, October 2010

densitometric measurement of the intact spot at 285 nm. The separation was carried out on silica gel 60 F254 aluminum sheets using methanol–glacial acetic acid (22:3, v/v) mobile phase. According to the authors, the suggested methods were successfully applied for the determination of the drug in bulk powder, laboratory-prepared mixtures, and a commercial sample. BP [12] recommends HPLC for analysis of related substances of tropisetron and potentiometric titration for assay of raw material. TLC shows to be a good alternative to HPLC and spectrophotometric methods, as well as the methods proposed by BP because this method provided simple, accurate, and sensitive quantitative determination of tropisetron in pharmaceutical formulations. Moreover, the method was compared with a HPLC reported method and the results were statistically the same.
Kadukar and coworkers [38] developed and validated a densitometric method for quantitative determination of olmesartan medoxomil (OM) and hydrochlorothiazide (HTZ) in combined tablet dosage forms. Separation of the drugs was carried out using chloroform–methanol–toluene 6:4:5 (v/v/v) as mobile phase on precoated silica gel 60 F254 plates. The detection of bands was carried out at 258 nm. According to the authors, the method can be used for routine analysis of these drugs in combined tablet dosage forms in quality control laboratories. As already mentioned, several analytical techniques are described in pharmacopoeias for analysis of HTZ. However, no USP [11], BP [12], or EP [18] has been reported a method for the determination of OM and for simultaneous analysis of HTZ and OM. Therefore, the presented method, although simple, can be used in analytical laboratories that have limited resources.
Kakde, Satone, and Bawane [39] developed a high-performance thin-layer chromatographic (HPTLC) method for simultaneous quantitative analysis of escitalopram oxalate (ESC) and clonazepam (CLO) in pharmaceutical preparations. Separation was achieved on a aluminum HPTLC plates coated with 0.2 mm layers of silica gel 60 F254 with methanol–toluene–triethylamine 1:3.5:0.1 (v/v) as mobile phase. Densitometric quantification was performed at 253 nm by reflectance scanning. The authors concluded that the method can be applied for routine quality-control analysis of ESC and CLO in pharmaceutical preparations and it is suitable for detection of degradation products of clonazepam in bulk and pharmaceutical preparations. USP [11] recommends HPLC for analysis of related substances, raw material, oral
suspension and tablets of CLO. BP [12] describes HPLC for analysis of related substances, potentiometric titration for assay of raw material and spectrophotometry for assay of CLO injection. The method cited above seems to be a good alternative to reported methods, because it provides to be simple, rapid and sensitive for simultaneous analysis of both drugs and their degradation products in pharmaceutical preparations.
Maślanka, Krzek and Stolarczyk [40] developed a chromatographic and densitometric method for identification and quantitative analysis of hydrochlorothiazide, triamterene, furosemide, and spironolactone in drugs used to treat hypertension. For separation, silica gel F254 plates were used with hexane–ethyl acetate–methanol–water–acetic acid 8.4:8:3:0.4:0.2 (v/v) as mobile phase. Densitometric measurements were performed at 264 nm. The authors stated that the method is suitable for use in analytical laboratories. Although several methods have been reported in pharmacopoeias for analysis of these drugs, a method for its simultaneous quantitative determination was not found in the official compendium surveyed.
Mehta and Morge [41] developed a HPTLC method for quantitative analysis of candesartan cilexetil and hydrochlorothiazide in their tablet dosage forms. Chromatography was performed on silica gel 60 GF254 plates with acetone–chloroform–ethyl acetate–methanol 3:3:3:0.5 (v/v) as mobile phase. Detection was performed at 280 nm. This method has advantages because no pharmacopoeia monograph is described for simultaneous analysis of these active substances. Furthermore, the method was properly validated and shows satisfactory sensitivity.
Miracor and coworkers [42] developed an HPTLC method using an internal standard for analysis of colchicine in a pharmaceutical formulation. The analyte and internal standard were separated on aluminum plates precoated with silica gel 60 F254; the mobile phase was ethyl acetate–acetonitrile–water–formic acid 8.0:1.0:0.5:0.5 (v/v). Quantification was by densitometric scanning at 358 nm. According to the authors, the established method enabled accurate, precise, and rapid analysis of colchicine in the pharmaceutical formulation. USP [11] method for analysis of colchicines raw material and its drugs formulations is by HPLC. BP [12] recommends HPLC method for analysis of related substances, potentiometric titration for assay of raw material and spectrophotometry for tablets. Although the cited
WSEAS TRANSACTIONS on BIOLOGY and BIOMEDICINE Rudy Bonfilio, Magali Benjamim De Araujo, Herida Regina Nunes Salgado
ISSN: 1109-9518 324 Issue 4, Volume 7, October 2010
method is a simple and cheap alternative, no analytical advantage is demonstrated.
From the revised studies that employ thin layer chromatography for pharmaceutical analysis, it was seen that advantages of this technique include fast analyses, low cost, and less organic solvent usage. Indeed, the authors could have used the potential of this separation technique for analysis of impurities or degradations products of the pharmaceuticals.
2.5.2 Gas chromatography
Gas chromatography (GC) and especially GC-MS is a sensitive, accurate, reproducible, quantitative, and versatile tool well adapted for the analysis of complex mixtures and this technique plays important role in the analysis of drugs and pharmaceutical products. However, the use of CG is limited to volatile and thermally stable compounds or to molecules that may undergo derivatization reactions to form thermally stable products. Below are exemplified some important applications of this technique in the field of pharmaceutical analysis.
Farajzadeh and coworkers [43] developed a method for the extraction of valproic acid (VPA) by hollow-fiber coated wire as a lab-made solid-phase microextraction (SPME) fiber and its determination by capillary gas chromatography in human serum and pharmaceutical formulations. The authors used a piece of copper wire coated by polypropylene hollow-fiber membrane as a SPME fiber, and its efficiency for the extraction of VPA was evaluated. The microextraction process was optimized by the authors and the chromatographic conditions were set as follows: Initial column temperature maintained at 80ºC for 1 min, and then raised at 20 ºC min-1 to 240 ºC and held for 5 min. Nitrogen was used as carried and make up gas with flow rates of 1.2 and 45 mL min-1, respectively. The temperatures of the inject port and the detector were set at 150 and 250ºC, respectively. Injections were carried out in splitless mode. The authors stated that the low detection limit, wide linear dynamic range, good repeatability and higher mechanical durability due to its metallic base are some of the most important advantages of the proposed fiber. USP [11] recommends GC for analysis of VPA drug substance and for its formulations. BP [12] recommends GC for related substances and potentiometric titration for assay of drug substance. In comparison with pharmacopoeial methods, the microextraction procedure seems to be easy to perform. Moreover, the method was compared with a previously
reported and the authors demonstrated a considerably higher sensitivity. Also, the application of the proposed method for the monitoring VPA in human serum is very useful for clinical laboratories.
Yilmaz [44] developed a gas chromatography–mass spectrometry (GC-MS) method for simultaneous determination of estradiol valerate (EV) and medroxyprogesterone acetate (MPA) in a tablet formulation. Chromatographic analysis was carried out on an HP-5 MS column with 0.25 µm film thickness (30 m × 0.25 mm). Splitless injection was used and the carrier gas was helium at a flow rate of 2 mL min-1. The injector and detector temperatures were 25 ºC. The MS detector parameters were transfer line temperature 28 ºC, solvent delay 3 min and electron energy 70 eV. The oven temperature program was held at 15 ºC for 1.5 min, increased to 26 ºC at a rate of 50 ºC min-1 for 1 min and then increased to 270 ºC at a rate of 10 ºC min-1 for 3.3 min. The author concluded that the method can be used for the routine QC analysis of simultaneous determination of EV and MPA pharmaceutical preparations in a total time of 12 min. For these two drugs, USP [11] recommends HPLC method for analysis of drug substance and its drug formulations. BP [12] method for related substances of EV is by HPLC and for assay of drug substance is by spectrophotometry. For MPA, BP [12] recommends HPLC method for related substances, spectrophotometry for assay of drug substance and HPLC for assay of drug formulations. Therefore, the advantage of this method is the application for simultaneous analysis of both drugs. Moreover, it shows to be sensitive (detection limit of 15 and 25 ng mL-1 for EV and MPA, respectively) and selective from impurities and excipients peaks.
From these reviewed papers, it may be noted that although gas chromatography is an analytical technique that serves a broad range of pharmaceuticals, this technique suffers from a major limitation in that a relatively small range of volatile and thermally stable compounds that are amenable for analysis.
2.5.3 High and ultra performance liquid
chromatography
High performance liquid chromatography (HPLC) is the most popular instrumental technique used for the analysis of pharmaceuticals [45] and reversed-phase HPLC (RP-HPLC) is by far the most popular LC technique for pharmaceutical analysis [46]. Below are exemplified some recent application of HPLC in pharmaceutical analysis.
WSEAS TRANSACTIONS on BIOLOGY and BIOMEDICINE Rudy Bonfilio, Magali Benjamim De Araujo, Herida Regina Nunes Salgado
ISSN: 1109-9518 325 Issue 4, Volume 7, October 2010

Casagrande and coworkers [47] validated a HPLC method for the quantitative evaluation of quercetin in topical emulsions. Chromatography was performed on a Hypersil® BDS-CPS C18 column (5 µm; 250 x 4.6 mm i.d.) with a mobile phase of methanol: water (35:65; v/v) containing 2% acetic acid and flow rate of 1 mL/min. The volume injected was 20 µL with detection at 254 nm. The authors evaluated the Physico-chemical stability and showed that the raw material and anionic emulsion, but not non-ionic emulsion, were stable in all storage conditions for one year. The authors concluded that the present work reports a fast and reliable HPLC technique useful for routine quality control for quercetin determination in topical formulations. No USP [11], BP [12], or EP [18] has been reported a method for the determination of quercetin. Thus, this method is useful for routine quality control analysis because it was demonstrated a short analysis time (approximately 8.9 minutes) and a high sensitivity (18 and 29 ng mL-1 for detection and quantitation limits, respectively).
Chopra and coworkers [48] published a comparative study of different detectors for the liquid chromatographic analysis of tobramycin. Due to the absence of a significant UV-chromophore in the structure of tobramycin, the authors made a comparison between the analytical performance of different brands of pulsed electrochemical detectors (PED) and two different evaporative light scattering detectors (ELSD) from the same manufacturer. Different PED waveforms (triple, quadruple and six potential–time waveforms (TPW QPW and SPW, respectively)) were also examined for the detection of tobramycin. USP [11] recommends a HPLC method using a derivatization procedure for analysis of tobramycin drug substance and its formulations. BP [12] and EP [18] prescribe a LC–PED method for assay of drug substance and a microbiological test for assay of tobramycin injection. As starting point, the LC–PED method of the EP was taken by the authors. This paper has a contribution to literature, because it presents alternative detection methods to derivatization procedure proposed by USP and it compares the sensitivity of the considered detectors, showing that PED with SPW has the best analytical performance.
D’Hondt and coworkers [49] developed and validated an HPLC method for the assay and degradation of salmon calcitonin formulated at low concentrations (400 ppm) in a bioadhesive nasal powder containing polymers. The sample preparation step was optimized using Plackett–
Burman and Onion experimental designs. The authors used an HPLC-UV/MS method with a reversed-phase C18 column in a gradient system based on aqueous acid and acetonitrile. UV detection, using trifluoroacetic acid in the mobile phase, was used for the assay of calcitonin and related degradants. Electrospray ionization (ESI) ion trap mass spectrometry, using formic acid in the mobile phase, was implemented for the confirmatory identification of degradation products. The authors states that for the first time, a complete quality control of salmon calcitonin in a solid pharmaceutical powder was performed. BP [12] and EP [18] recommend HPLC method for analysis of related substance and for assay of raw material. However, a method for analysis of this drug in bioadhesive nasal powder was not found in the surveyed pharmacopoeias. Therefore, this method is useful to control quality laboratories. Moreover, the authors demonstrated a satisfactory sensitivity for degradations products of calcitonin (detection limits ranging between 0.5 and 2.4%, compared to main calcitonin peak).
Davydova and coworkers [50] developed and validated a dissolution test method and an analytical procedure by HPLC for evaluation of the dissolution behavior of dietary supplements tablets containing vitamin A. Seven different commercially available products containing retinyl acetate or retinyl palmitate were studied. Chromatographic analysis was carried out on a Waters Alliance HPLC system using Zorbax NH2, 15 cm ×4.6 mm, 5 µm column. Hexane was used as mobile phase with a flow rate of 2 mL min-1. Injection volume was 40 microliters with UV detection at 325 nm. EP [18], BP [12], and USP [11] have general chapters for dissolution, but these pharmacopeias do not have monographs with specifications for vitamin A in tablets. Therefore, the dissolution test described could be proposed as a pharmacopoeial standard to assess the performance of tablet formulations containing vitamin A. Moreover, the authors demonstrated a satisfactory analysis time (15 min). But, although the authors state that this method is sensitive, the detection and quantitation limits were not demonstrated.
Mone and Chandrasekhar [51] studied degradation profile of pentoxifylline, which was subjected to various stress conditions. A stability indicating liquid chromatographic separation method was developed for pentoxifylline and its three degradation products using 1.8 µm, C18 reverse phase column and UPLC. According to the authors, baseline separation was achieved with a
WSEAS TRANSACTIONS on BIOLOGY and BIOMEDICINE Rudy Bonfilio, Magali Benjamim De Araujo, Herida Regina Nunes Salgado
ISSN: 1109-9518 326 Issue 4, Volume 7, October 2010

run time of 4 min. Under oxidative stress conditions the drug substance underwent distinct transformation to give rise to a single major degradation product which was elucidated using 1D, 2D NMR spectroscopy and high resolution mass spectrometry (Q-TOF LC/MS). The authors concluded that in this study, it was successfully used sub 2 µ reverse phase column technology, with UPLC system for the development of efficient and robust method for the separation of closely related compounds of pentoxifylline. USP [11] recommends HPLC for analysis of pentoxifylline drug substance and its formulations. BP [12] and EP [18] describe HPLC method for related substances and potentiometric titration for assay of raw material. However, the novelty of this method was the elucidation of a new degradation product of this drug. The detections and quantitation limits for this degradation product were found to be 0.5 and 2 µg mL−1, respectively, showing satisfactory method sensitivity. Moreover, although UPLC technique requires expensive instrumentation, it is considerably faster and generates less waste, when compared with HPLC techniques.
Rao and coworkers [52] studied forced degradation of ritonavir (RTV) under the conditions of hydrolysis (acidic, basic and neutral), oxidation, photolysis and thermal stress using a LC–MS/MS method. Eight degradation products were formed and their separation was accomplished on Waters XTerra® C18 column (250 mm× 4.6mm, 5 µm) using water:methanol:acetonitrile (40:20:40, v/v/v) as mobile phase. According to the authors, no previous reports were found in the literature regarding the characterization of degradation products of RTV. USP [11], BP [12] and EP [18] recommend HPLC for analysis of related substances and for assay of drug substance. The novelty of the proposed method is that the authors extended the method to LC–MS/MS for characterization of the degradation products and for proposition of the pathways of decomposition of RTV. Moreover, in comparison with the pharmacopoeial methods, the chromatographic running time of this method was significantly lower. The limits of detection and quantification were found to be 10 and 30 ng mL-1, respectively, showing good method sensitivity.
Zanitti and coworkers [53] proposed an analytical and semipreparative HPLC enantioseparation of omeprazole (OME) and its potential organic chiral impurities on the immobilised-type Chiralpak IA chiral stationary phase (CSP) under both polar organic and normal-phase conditions. The (S)-enantiomers were
isolated with a purity of >99% and their absolute configuration were empirically assigned by circular dichroism (CD) spectroscopy. The method used a mixture methyl tert-butylether (MtBE)–ethyl acetate (EA)–ethanol (EtOH)–diethylamine (DEA) 60:40:5:0.1 (v/v/v/v) as a mobile phase. The authors concluded that the proposed method fulfils the EP requirements for the routine check of enantiomeric purity in raw material and pharmaceutical preparations. Although USP [11], BP [12] and EP [18] already describe HPLC methods for analysis of OMP, the novelty of this work is a semipreparative enantioseparation of this drug and its chiral related substances. The detection and quantitation limits were estimated to be 169 and 513 ng mL-1 for (S)-OME enantiomer, showing the method sensitivity.
The papers cited in this subsection demonstrate the applicability of this automated technique, which allows analysis of related substances, elucidation of degradation products, stability studies, quantitation of samples from dissolution tests, chiral separations, determination of drugs in biological matrices, and a multitude of other applications. Moreover, the wide varieties of detections systems and chromatographic columns available make possible the analysis of virtually all pharmaceutical compounds. However, there is a high cost for equipment needed to conduct HPLC and this technique can generate large amount of waste. The problem of waste disposal, however, is being reduced with the use of chromatographic columns packed with smaller particles, resulting in significantly faster analyses with consequent reduction in generation of waste.
2.6 Capillary electrophoresis
Capillary electrophoresis is an efficient
separation technique that can be applied to large and small molecules. Among its many applications, quantitation of pharmaceuticals deserves to be cited. This technique has high efficiency of separation enabling difficult separations, low analysis time, rapid development of methods, low sample and solvent consumption, and automated and simple instrumentation [54]. The instrumentation of CE consists of electrodes, a sample introduction system, a capillary, a high-voltage power supply, a detector, and a data output and handling device [1]. There are
WSEAS TRANSACTIONS on BIOLOGY and BIOMEDICINE Rudy Bonfilio, Magali Benjamim De Araujo, Herida Regina Nunes Salgado
ISSN: 1109-9518 327 Issue 4, Volume 7, October 2010

several techniques that can help separate analytes with a capillary electrophoresis system. These include non-aqueous CE (NACE), microemulsion electrokinetic chromatography (MEEKC), capillary isotachophoresis (CITP), capillary electrochromatography (CEC) and immunoaffinity capillary electrophoresis (IACE). Moreover, different means of detection (MS, light-emitting diode, fluorescence, chemiluminescence and contactless conductivity (C4D) detectors) are used, giving versatility and sensitivity to CE [1]. The following are some applications of this technique for pharmaceutical analysis.
Sánchez-Hernández and coworkers [55] developed a capillary electrophoresis–electrospray ionization-tandem mass spectrometry to the determination of l- and d-carnitine in pharmaceutical formulations. A sample treatment procedure consisting of the use of a dilution or an extraction step with water was employed prior to derivatization with 9-fluorenylmethoxycarbonyl (FMOC). Eleven pharmaceutical formulations were analyzed including ampoules, oral solutions, sachets, and tablets. Results showed contents for carnitine comprised between 77 and 101% with respect to the labeled ones in the case of those formulations marketed with the racemate, and from 97 to 102% in those cases where the single enantiomer (l-carnitine) was employed as active ingredient. USP [11] recommends titration with perchloric acid for assay of l-carnitine raw material, and HPLC for assay of its drug formulations. BP [12] and EP [18] describe an HPLC method for analysis of related substances and titration with perchloric acid for assay of l-carnitine raw material. However, only an optical purity control of l-carnitine as raw material is required, which lacks of sensitivity. Therefore, there is a potential of the proposed method to be applied in quality control of pharmaceutical formulations containing carnitine. Moreover, the detection limit of 10 ng mL−1 (0.002%) in drug product was considerably lower than the limit established for any impurity (0.1%), showing the method sensitivity.
Azzam, Saad and Aboul-Enein [56] developed a capillary zone electrophoresis method for the simultaneous determination of atenolol, chlorthalidone and amiloride in pharmaceutical formulations in less than 4 min. The separation was effected in an uncoated fused-silica capillary (75 µm i.d. × 52 cm) and a background electrolyte of 25 mm H3PO4 adjusted with 1 mol L-1 NaOH solution (pH 9.0) and detection at 198 nm. Normal polarity mode at 25°C, 25 kV and hydrodynamic injection (10 s) were used. According to the
authors, the method was successfully applied to the simultaneous determination of tested drugs in various pharmaceutical tablets formulations. USP [11], BP [12] and EP [18] describe methods for individual analysis of AT, CD and AM as HPLC, TLC, titration and spectrophotometry. However, a method for the simultaneous determination of these drugs has not been reported by the above-mentioned pharmacopoeias. Therefore, the proposed method is useful and can be adopted as a quality control protocol in pharmaceutical industries. Moreover, the method shows a short run time for separation of the drugs (about 3.5 min) and adequate sensitivity (the limits of quantitation for AT, CD and AM were 2.36, 1.43 and 4.97 µg mL-1, respectively.
Kika and coworkers [57] developed a capillary zone electrophoretic (CZE) method for the determination of mitoxantrone (MTX) in pharmaceutical formulations. Separation was achieved with 25mM ammonium acetate at an apparent pH value of 5.0 in 50% v/v acetonitrile, applied voltage of +30 kV, and capillary temperature of 25 ºC. Detection was carried out at 242 nm. Mitoxantrone and doxorubicin (DOX) (used as internal standard, ISTD) were completely separated in less than 7 min. The proposed method was applied for the determination of MTX in its injectable pharmaceutical formulation. According to the USP [11], BP [12] and EP [18], an ion-pair HPLC method is recommended for the quality control of the MTX drug substance and in injectable form. However, the drawbacks of ion-pairing chromatography are prolonged equilibration times, difficult regeneration of the column, and irreproducible retention times. Therefore, this method is an interesting alternative to pharmacopoeial method. Moreover, the method provided adequate, although low sensitivity (detection limit of 5 µg mL-1).
Rambla-Alegre and coworkers [58] developed a capillary electrophoresis (CE) procedure combined with UV detection for the quantification of ethylendiamine, ethanolamine, propylamine, piperazine and other derivative groups in serum samples and pharmaceuticals. The optimised parameters for the determination of antihistamines were a 24 cm capillary, UV detection at 214 nm, 20 mMol L-1 phosphate running buffer at pH 2.0, 2 psi s−1 injection pressure and 5 kV applied voltage. Under these conditions, the analysis time was below 10 min. This is an interesting work from an analytical point of view because no USP [11], BP [12] or EP [18] describes a method for simultaneous analysis of these drugs. Also, the
WSEAS TRANSACTIONS on BIOLOGY and BIOMEDICINE Rudy Bonfilio, Magali Benjamim De Araujo, Herida Regina Nunes Salgado
ISSN: 1109-9518 328 Issue 4, Volume 7, October 2010

method shows a high sensitivity for all analyzed compounds (detections limits ranging from 4 to 28 pg mL−1) and it was suitable for the practical determination of antihistamines in serum samples and pharmaceuticals.
Zhu and coworkers [59] described the separation of the sibutramine enantiomers by capillary zone electrophoresis using substituted cyclodextrins as chiral selectors. Separation of enantiomers on an unmodified fused silica capillary (effective length 45 cm) was achieved using a mixed buffer of 20 mMol L-1 phosphate and 10 mMol L-1 citrate containing either 5 mMol L-1 methyl-β-cyclodextrin (pH 4.3) or 5 mMol L-1 carboxymethyl-β-cyclodextrin (pH 6.5). Samples were injected with a pressure of 50 mbar for 5 s and were detected at a wavelength of 223 nm. No USP [11], BP [12] or EP [18] describes a monograph for sibutramine. Although the Agency’s Committee for Medicinal Products for Human Use recommended the suspension of the marketing authorization for medicines containing sibutramine throughout Europe, sibutramine is still extensively commercialized in different countries. Therefore, this is an important work. The optimized method was successfully applied to the determination of sibutramine enantiomers in commercial drug formulations and it proved to be economical and convenient. However, the authors did not demonstrated the detection and quantitation limits.
From the papers cited in this subsection, it was concluded that capillary electrophoresis offers significant advantages in terms of small sample volumes, fast analysis, high separation efficiency, low consumption of reagents (mostly aqueous solutions) and low waste generation. However, this technique frequently has low sensitivity, due to the shorter path length of the flow cell.
2.7 Vibrational spectroscopies Vibrational spectroscopic methods consist of
three main tools: mid-IR spectroscopy, more commonly named Fourier transform IR (FTIR) spectroscopy, near-IR (NIR) spectroscopy, and Raman spectroscopy. Some applications of this technique in pharmaceutical analysis are illustrated below.
Li and coworkers [60] developed a method based on Fourier transform near infrared (FT-NIR) spectroscopy and partial least squares (PLS) algorithm for quantitative analysis of four kinds of Tanreqing injection intermediates. The NIR spectra of 120 samples were collected in transflective mode. The concentrations of chlorogenic acid, caffeic acid, luteoloside, baicalin, ursodesoxycholic
acid (UDCA), and chenodeoxycholic acid (CDCA) were determined with the HPLC–DAD/ELSD as reference method. The established models were used for the liquid preparation process analysis of Tanreqing injection in three batches. As no pharmacopoeial method is described for the analyzed compounds, this is a relevant work. Moreover, the method shows satisfactory sensitivity (detections limits ranging from 0.285 to 95.8 ng). The main advantage demonstrated in this work is that the proposed method is rapid and non-destructive to analyze the intermediates of Tanreqing injection.
Oh and coworkers [61] published a method for measurement of TiO2 concentration in a cream formulation using Raman spectroscopy without further sample pretreatments. According to the authors, the distribution of TiO2 particles in a highly viscous cream may not be homogeneous on a microscopic scale and local aggregation of the particles is possible; therefore, acquisition of Raman spectra capable of representing the whole sample identity. A wide area illumination (WAI) scheme, applying 6 mm diameter laser illumination area on a sample, was used to achieve representative sample presentation and improved accuracy. BP [12] and EP [18] recommend titration with 0.1 M ammonium and cerium nitrate for analysis of TiO2. The proposed method would be advantageous over the conventional titration method that requires destructive incineration of the organic cream matrix, as well as a higher consumption of chemical reagents. But, the sensitivity of the method is not presented by the authors.
Talebpour and coworkers [62] proposed a method for the simultaneous determination of penicillin G salts in pharmaceutical mixture via FT-IR spectroscopy combined with chemometrics. The authors state that the mixture of penicillin G salts is a complex system due to similar analytical characteristics of components. Partial least squares (PLS) and radial basis function-partial least squares (RBF-PLS) were used to develop the linear and nonlinear relation between spectra and components, respectively. The orthogonal signal correction (OSC) preprocessing method was used to correct unexpected information, such as spectral overlapping and scattering effects. The chemometric models were tested on an external dataset and applied to the analysis commercialized injection product of penicillin G salts. Because no pharmacopoeia describes a monograph for simultaneous analysis of studied penicillin G salts (potassium penicillin G, benzathine penicillin G,
WSEAS TRANSACTIONS on BIOLOGY and BIOMEDICINE Rudy Bonfilio, Magali Benjamim De Araujo, Herida Regina Nunes Salgado
ISSN: 1109-9518 329 Issue 4, Volume 7, October 2010

and procaine penicillin G), this is an interesting approach. However, the sensitivity of the method is not presented.
Hu and coworkers [63] reported the simultaneous quantitative analysis of sulfathiazole polymorphs (forms I, III and V) in ternary mixtures by attenuated total reflectance-infrared (ATR-IR), near-infrared (NIR) and Raman spectroscopy combined with multivariate analysis. To reduce the effect of systematic variations, four different data pre-processing methods; multiplicative scatter correction (MSC), standard normal variate (SNV), first and second derivatives were applied and their performance was evaluated using their prediction errors. According to the authors, it was possible to derive a reliable calibration model for the three polymorphic forms, in powder ternary mixtures, using a partial least squares (PLS) algorithm with SNV pre-processing, which predicted the concentration of polymorphs I, III and V. The USP [11] method for assay of sulfathiazole drug substance is titration with 0.1M sodium nitrite. BP [12] and EP [18] recommend TLC for related substances and titration with 0.1M sodium nitrite for assay of drug substance. However, these pharmacopoeial methods are not able to quantify different polymorphic phases. Since polymorphs of a pharmaceutical solid may have different physicochemical properties, this work is quite relevant. The detection and quantitation limits for the NIR analyses were 3.6 and 10.9% for form I, 5.8 and 17.6% for form III and 6.3 and 19.0% for form V. According to the authors, these results are in the same range as those reported for other ternary polymorph analyses.
Ziémons and coworkers [64] developed a near infrared (NIR) calibration model to determine the acetaminophen content of a low-dose syrup formulation (2%, w/v). A prediction model was built using partial least square (PLS) regression. First derivative followed by standard normal variate (SNV) were chosen as signal pre-processing. The NIR model was used to monitor in real time the API concentration while mixing syrups containing various amounts of API and, according to the authors, a good agreement was found between the NIR method and the theoretical concentrations. For acetaminophen, several pharmacopoeial methods are described including HPLC, titration and spectrophotometry. However, the advantage of the method proposed by Ziémons and coworkers is that the NIR measurements could
be performed off-line, at-line, on-line or in-line to check the conformity of the pharmaceutical syrups during the manufacturing and/or before the final packaging stage. Furthermore, the method presented a high, but adequate sensitivity (lower quantitation limit of 15.9 mg mL-1)
From the above-mentioned vibrational spectroscopy methods, it was noted that the usefulness of this technique is mainly attributed to its speed and economy against other analytical techniques. Additionally, it offers the possibility to perform on-line analysis. The analytical targets are mainly powdered solids and the modes of NIR measurement are mainly diffused reflection. However, as to the sample of solutions, transmission or transflective mode is adopted. This technique allows the use of deriving information from complex samples because of the development of chemometrics. But, not being a technique that allows separation of the analytes, its application in analysis of related substances is limited. Moreover, one of the main drawbacks of NIR spectroscopy is its relatively low sensitivity.
3 Conclusion In this paper, recent analytical methods
employed for quantitative analysis of pharmaceutical formulations were reviewed. Several techniques like UV/VIS spectrophotometry, fluorimetry, titrimetry, electroanalytical techniques (mainly voltammetry), chromatographic methods (TLC, CG and mainly HPLC), CE, and vibrational spectroscopies are the main techniques that have been used, of which it is observed a trend to utilize faster techniques with cost savings and reduction in solvent consumption. Table 1 presents a summary of cited methods for the quantitative analysis of pharmaceuticals. From this work, it was observed a trend in the application of techniques increasingly rapid such as ultra performance liquid chromatography and the use of sensitive and specific detectors as mass spectrometers.
Acknowledgements The authors are grateful to FAPESP, CNPq and
PADC/FCF/UNESP for research fellowships.
WSEAS TRANSACTIONS on BIOLOGY and BIOMEDICINE Rudy Bonfilio, Magali Benjamim De Araujo, Herida Regina Nunes Salgado
ISSN: 1109-9518 330 Issue 4, Volume 7, October 2010
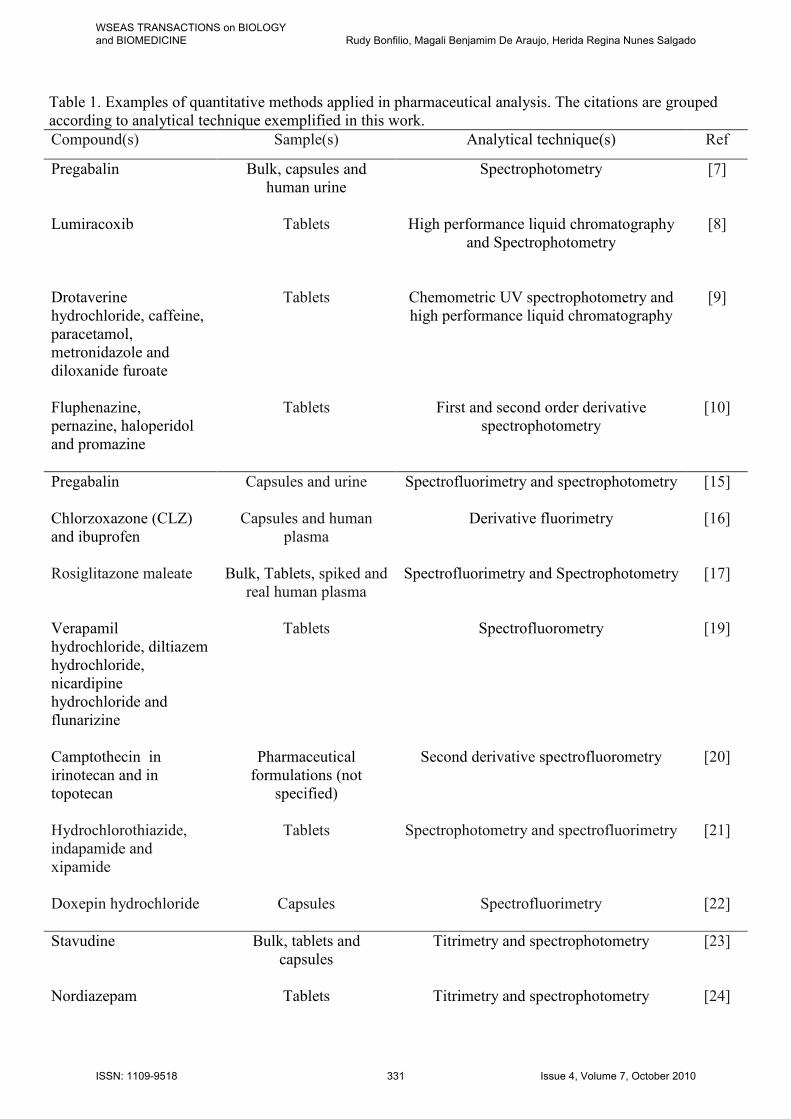
Table 1. Examples of quantitative methods applied in pharmaceutical analysis. The citations are grouped according to analytical technique exemplified in this work. Compound(s) Sample(s) Analytical technique(s) Ref
Pregabalin Bulk, capsules and human urine
Spectrophotometry [7]
Lumiracoxib Tablets High performance liquid chromatography and Spectrophotometry
[8]
Drotaverine hydrochloride, caffeine, paracetamol, metronidazole and diloxanide furoate
Tablets Chemometric UV spectrophotometry and high performance liquid chromatography
[9]
Fluphenazine, pernazine, haloperidol and promazine
Tablets First and second order derivative spectrophotometry
[10]
Pregabalin Capsules and urine Spectrofluorimetry and spectrophotometry
[15]
Chlorzoxazone (CLZ) and ibuprofen
Capsules and human plasma
Derivative fluorimetry [16]
Rosiglitazone maleate Bulk, Tablets, spiked and real human plasma
Spectrofluorimetry and Spectrophotometry
[17]
Verapamil hydrochloride, diltiazem hydrochloride, nicardipine hydrochloride and flunarizine
Tablets Spectrofluorometry [19]
Camptothecin in irinotecan and in topotecan
Pharmaceutical formulations (not
specified)
Second derivative spectrofluorometry [20]
Hydrochlorothiazide, indapamide and xipamide
Tablets Spectrophotometry and spectrofluorimetry [21]
Doxepin hydrochloride
Capsules Spectrofluorimetry [22]
Stavudine
Bulk, tablets and capsules
Titrimetry and spectrophotometry [23]
Nordiazepam
Tablets Titrimetry and spectrophotometry [24]
WSEAS TRANSACTIONS on BIOLOGY and BIOMEDICINE Rudy Bonfilio, Magali Benjamim De Araujo, Herida Regina Nunes Salgado
ISSN: 1109-9518 331 Issue 4, Volume 7, October 2010

Hydroxyzine dihydrochloride
Pure form and tablets
Titrimetry [25]
Doxycycline hyclate
Bulk drug and tablets
Titrimetry and spectrophotometry [26]
Minoxidil
Topical formulations
Titrimetry [27]
Acetaminophen and mefenamic acid
Human serum, human urine, tylenol tablet and mefenamic acid capsule
Voltammetry and amperometry [29]
Sulfadiazine
Tablets Voltammetry [30]
Cefixime Bulk drug, tablets and human urine
Voltammetry [31]
Nitrofurantoin
Capsules Voltammetry [32]
Propranolol and atenolol
Tablets Voltammetry [33]
Carbamazepine
Tablets and wastewater samples
Voltammetry [34]
Tropisetron Bulk powder, laboratory-prepared mixtures, and
capsules
High performance liquid chromatography, thin layer chromatography and first-
derivative spectrophotometry
[37]
Olmesartan medoxomil and hydrochlorothiazide
Tablets Thin layer chromatography [38]
Escitalopram oxalate and clonazepam
Bulk and tablets High performance thin layer chromatography
[39]
Hydrochlorothiazide, triamterene, furosemide, and spironolactone
Tablets Thin layer chromatography [40]
Candesartan cilexetil and hydrochlorothiazide
Tablets High performance thin layer chromatography
[41]
Colchicine Tablets High performance thin layer chromatography
[42]
Valproic acid Human serum, tablets and syrup
Gas chromatography [43]
Estradiol valerate and medroxyprogesterone acetate
Tablets Gas chromatography-mass spectrometry [44]
WSEAS TRANSACTIONS on BIOLOGY and BIOMEDICINE Rudy Bonfilio, Magali Benjamim De Araujo, Herida Regina Nunes Salgado
ISSN: 1109-9518 332 Issue 4, Volume 7, October 2010

Quercetin Topical emulsions High performance liquid chromatography
[47]
Tobramycin Pure form High performance liquid chromatography
[48]
Salmon calcitonin bioadhesive nasal powder
High performance liquid chromatography
[49]
Retinyl acetate and retinyl palmitate
Tablets High performance liquid chromatography [50]
Pentoxifylline Tablets Ultra performance liquid chromatography and Liquid chromatography coupled to hybrid quadrupole time-of-flight mass
spectrometry
[51]
Ritonavir Pure form Liquid chromatography/tandem mass spectrometry
[52]
Omeprazole Raw material and tablets
High performance liquid chromatography
[53]
l-carnitine and d-carnitine
Ampoules, oral solutions, sachets, and tablets
Capillary electrophoresis coupled to mass spectrometry
[55]
Atenolol, chlorthalidone and amiloride
Tablets Capillary zone electrophoresis [56]
Mitoxantrone Injectable pharmaceutical formulation
Capillary zone electrophoresis [57]
Ethylendiamine, ethanolamine, propylamine, piperazine
Serum samples, capsules, powders, oral solutions,
oral suspensions and syrups
Capillary electrophoresis [58]
Sibutramine Capsules Capillary electrophoresis
[59]
Chlorogenic acid, caffeic acid, luteoloside, baicalin, ursodesoxycholic acid and chenodeoxycholic acid
Injectable pharmaceutical formulation
Fourier transform infrared spectroscopy and High-performance liquid
chromatography coupled with photo diode array detection and evaporative light
scattering detection
[60]
TiO2
Crem formulation
Raman spectroscopy
[61]
Penicillin G salts Pharmaceutical mixture
Fourier transform infrared spectroscopy
[62]
Sulfathiazole polymorphs
Pharmaceutical mixture Attenuated total reflectance-infrared, near-infrared and Raman spectroscopy
[63]
WSEAS TRANSACTIONS on BIOLOGY and BIOMEDICINE Rudy Bonfilio, Magali Benjamim De Araujo, Herida Regina Nunes Salgado
ISSN: 1109-9518 333 Issue 4, Volume 7, October 2010

Acetaminophen Syrup Near infrared spectroscopy
[64]
Tablet: a medicinal formulation made of a compressed powdered substance containing active drugs and excipients. Capsule: a solid dosage form in which the drug is enclosed in a hard or soft soluble container, usually of a form of gelatin.
WSEAS TRANSACTIONS on BIOLOGY and BIOMEDICINE Rudy Bonfilio, Magali Benjamim De Araujo, Herida Regina Nunes Salgado
ISSN: 1109-9518 334 Issue 4, Volume 7, October 2010

References:
[1] L. Suntornsuk, Recent advances of capillary
electrophoresis in pharmaceutical analysis, Analytical and Bioanalytical Chemistry, Vol.398, No.1, 2010, pp. 29-52.
[2] A. Pluym, W.V. Ael, and M. De Smet, Capillary electrophoresis in chemical/pharmaceutical quality control, Trends in Analytical Chemistry, Vol.11, No.1, 1992, pp. 27-32.
[3] F.S. Rojas, and C.B. Ojeda, Recent development in derivative ultraviolet/visible absorption spectrophotometry: 2004–2008: A review, Analytica Chimica Acta, Vol.635, No.1, 2009, pp. 22-44.
[4] C.B. Ojeda, and F.S. Rojas, Recent developments in derivative ultraviolet/visible absorption spectrophotometry, Analytica
Chimica Acta, Vol.518, No.1-2, 2004, pp. 1-24.
[5] C. Bodson, E. Rozet, E. Ziemons, B. Evrard, P. Hubert, and L. Delattre, Validation of manufacturing process of diltiazem HCl tablets by NIR spectrophotometry (NIRS), Journal of Pharmaceutical and Biomedical
Analysis, Vol.45, No.2, 2007, pp. 356-361. [6] B.-Y. Li, S. Kasemsumran, Y. Hu, Y.-Z. Liang,
and Y. Ozaki, Comparison of performance of partial least squares regression, secured principal component regression, and modified secured principal component regression for determination of human serum albumin, γ-globulin and glucose in buffer solutions and in vivo blood glucose quantification by near-infrared spectroscopy, Analytical and
Bioanalytical Chemistry, Vol.387, No.2, 2007, pp. 603-611. 7
[7] R.S. Gujral, S.M. Haque, and P. Shanker, Development and validation of pregabalin in bulk, pharmaceutical formulations and in human urine samples by UV spectrophotometry, International Journal of
Biomedical Sciences, Vol.5, No.2, 2009, pp. 175-180.
[8] T.S. Moreira, M.B.R. Pierre, C.A.M. Fraga, and V.P. Sousa, Development and validation of HPLC and UV spectrophotometric methods for the determination of lumiracoxib in tablets, Revista de Ciências Farmacêuticas Básica e
Aplicada, Vol.29, No.3, 2008, pp. 267-275. [9] A. El-Gindy, S. Emara, and H. Shaaban,
Validation and application of chemometrics-assisted spectrophotometry and liquid chromatography for simultaneous
determination of two ternary mixtures containing drotaverine hydrochloride, Journal
of AOAC international, Vol.93, No.2, 2010, pp. 536-548.
[10] M. Stolarczyk, A. Apola, J. Krzek, and A. Sajdak, Validation of derivative spectrophotometry method for determination of active ingredients from neuroleptics in pharmaceutical preparations, Acta Poloniae
Pharmaceutica, Drug Research, Vol.66, No.4, 2009, pp. 351-356.
[11] The United States Pharmacopoeia, 32th ed., United States Pharmacopoeial Convection, Rockville, 2009.
[12] The British Pharmacopoeia, vol. I & II, The Stationary Office Ltd, London, 2009.
[13] M.D.P.T. Sotomayor, I.L.T. Dias, M.R.V. Lanza, A.B. Moreira, and L.T. Kubota, Application and advances in the luminescence spectroscopy in pharmaceutical analyses, Quimica Nova, Vol.31, No.7, 2008, pp. 1755-1774.
[14] A.A. Eiroa, G. de-Armas, J.M. Estela, and V. Cerdà, Critical approach to synchronous spectrofluorimetry. I, Trends in Analytical
Chemistry, Vol.29, No.8, 2010, pp. 885-901. [15] R. Abdel, and A. Shaalan, Spectrofluorimetric
and Spectrophotometric Determination of Pregabalin in Capsules and Urine Samples, International Journal of Biomedical Sciences, Vol.6, No.3, 2010, pp. 260-267.
[16] N. El-Enany, F. Belal, Y. El-Shabrawy, and M. Rizk, Second derivative synchronous fluorescence spectroscopy for the Simultaneous determination of chlorzoxazone and ibuprofen in pharmaceutical preparations and biological fluids, International Journal of
Biomedical Sciences, Vol.5, No.2, 2009, pp. 136-145.
[17] M.I. Walash, A. El-Brashy, N. El-Enany, and M.E. Kamel, Spectrofluorimetric and spectrophotometric determination of rosiglitazone maleate in pharmaceutical preparations and biological fluids, Pharmaceutical Chemistry Journal, Vol.43, No.12, 2009, pp. 697-709.
[18] European Pharmacopeia, 6th ed., Council of Europe, Strasbourg, 2008.
[19] M.I. Walash, F. Belal, N. El-Enany, and A.A. Abdelal, Kinetic Spectrofluorometric determination of certain calcium channel blockers via oxidation with cerium (IV) in pharmaceutical preparations, International
Journal of Biomedical Sciences, Vol.5, No.2, 2009, pp. 146-157.
WSEAS TRANSACTIONS on BIOLOGY and BIOMEDICINE Rudy Bonfilio, Magali Benjamim De Araujo, Herida Regina Nunes Salgado
ISSN: 1109-9518 335 Issue 4, Volume 7, October 2010

[20] F.F. de C. Marques, A.L.M.C. da Cunha, and R.Q. Aucélio, Selective spectrofluorimetric method and uncertainty calculation for the determination of camptothecin in the presence of irinotecan and topotecan, Analytical Letters, Vol.43, No.3, 2010, pp. 520-531.
[21] M.A. Omar, Spectrophotometric and spectrofluorimetric determination of certain diuretics through ternary complex formation with eosin and lead (II), Journal of
Fluorescence, Vol.20, No.1, 2010, pp. 275-281.
[22] N. Rahman, S. Siddiqui, and S.N.H Azmi, Spectrofluorimetric method for the determination of doxepin hydrochloride in commercial dosage forms, AAPS
Pharmaceutical Science and Technology, Vol.10, No.4, 2009, pp. 1381-1387.
[23] K. Basavaiah, V. Ramakrihna, C. Somashekar, and U.R.A. Kumar, Sensitive and rapid titrimetric and spectrophotometric methods for the determination of stavudine in pharmaceuticals using bromate-bromide and three dyes, Annals of the Brazilian Academy of
Sciences, Vol.80, No.2, 2008, pp. 253-262. [24] N.M. Mostafa, and E.H. AlGohani,
Spectrophotometric and titrimetric methods for the determination of nordiazepam in pure and pharmaceutical dosage form, Journal of
Saudi Chemical Society, Vol.14, No.1, 2010, pp. 9-13.
[25] N. Rajendraprasad, B. Kanakapura, and K.B. Vinay, Acid-base titrimetric assay of hydroxyzine dihydrochloride in pharmaceutical samples, Chemical Industry &
Chemical Engineering Quarterly, Vol.16, No.2, 2010, pp. 127-132.
[26] P.J. Ramesh, K. Basavaiah, M.R. Divya, N. Rajendraprasad, and K.B. Vinay, Titrimetric and spectrophotometric determination of doxycycline hyclate using bromate bromide, methyl orange and indigo carmine, Chemical
Industry & Chemical Engineering Quarterly, Vol.16, No.2, 2010, pp. 139-148.
[27] R.A. De Sousa, and É.T.G. Cavalheiro, Determination of minoxidil in pharmaceutical formulations using a permanganometric tirimetric procedure, Eclética Química, Vol.34, No.3, 2009, pp. 41-49.
[28] A.L. Santos, R.M. Takeuchi, and N.R. Stradiotto, Electrochemical, spectrophotometric and liquid chromatographic approaches for analysis of tropical disease drugs, Current
Pharmaceutical Analysis, Vol.5, No.1, 2009, pp. 69-88.
[29] A. Babaei, M. Afrasiabi, and M. Babazadeh, A glassy carbon electrode modified with multiwalled carbon nanotube/chitosan composite as a new sensor for simultaneous determination of acetaminophen and mefenamic acid in pharmaceutical preparations and biological samples, Electroanalysis, Vol.22, No.15, 2010, pp. 1743-1749.
[30] I. Campestrini, O.C. de Braga, I.C. Vieira, and A. Spinelli, Application of bismuth-film electrode for cathodic electroanalytical determination of sulfadiazine, Electrochimica
Acta, Vol.55, No.17, 2010, pp. 4970-4975. [31] R. Jain, V.K. Gupta, N. Jadon, and K.
Radhapyari, Voltammetric determination of cefixime in pharmaceuticals and biological fluids, Analytical Biochemistry, Vol.407, No.1, 2010, pp. 79-88.
[32] P. de Lima-Neto, A.N. Correia, R.R. Portela, M.S. Juliao, G.F. Linhares-Junior, and J.E.S. de Lima, Square wave voltammetric determination of nitrofurantoin in pharmaceutical formulations on highly boron-doped diamond electrodes at different boron-doping contents, Talanta, Vol.80, No.5, 2010, pp. 1730-1736.
[33] E.R. Sartori, R.A. Medeiros, R.C.R. Filho, and O.F. Filho, Square-wave voltammetric determination of propranolol and atenolol in pharmaceuticals using a boron-doped diamond electrode, Talanta, Vol.81, No.4-5, 2010, pp. 1418-1424.
[34] A. Veiga, A. Dordio, A.J.P. Carvalho, D.M. Teixeira, and J.G. Teixeira, Ultra-sensitive voltammetric sensor for trace analysis of carbamazepine, Analytica Chimica Acta, Vol.674, No.2, 2010, pp. 182-189.
[35] J. Sherma, Modern thin-layer chromatography, Journal of AOAC International, Vol.91, No.5, 2008, pp. 1142-1144.
[36] K. Ferenczi-Fodor, Z. Végh, A. Nagy-Turák, B. Renger, and M. Zeller, Validation and quality assurance of planar chromatographic procedures in pharmaceutical analysis, Journal
of AOAC International, Vol.84, No.4, 2001, pp. 1265-1276.
[37] L.S. Abdel-Fattah, Z.A. El-Sherif, K.M. Kilani, and D.A. El-Haddad, HPLC, TLC, and first-derivative spectrophotometry stability- indicating methods for the determination of tropisetron in the presence of its acid
WSEAS TRANSACTIONS on BIOLOGY and BIOMEDICINE Rudy Bonfilio, Magali Benjamim De Araujo, Herida Regina Nunes Salgado
ISSN: 1109-9518 336 Issue 4, Volume 7, October 2010

degradates, Journal of AOAC International, Vol.93, No.4, 2010, pp. 1180-1191.
[38] S.S. Kadukar, S.V. Gandhi, P.N. Ranjane, and S.S. Ranher, HPTLC analysis of olmesartan medoxomil and hydrochlorothiazide in combination tablet dosage forms, Journal of
Planar Chromatography, Vol.22, No.6, 2009, pp. 425-428.
[39] R. Kakde, D. Satone, and N. Bawane, HPTLC method for simultaneous analysis of escitalopram oxalate and clonazepam in pharmaceutical preparations, Journal of
Planar Chromatography, Vol.22, No.6, 2009, pp. 417-420.
[40] A. Maślanka, J. Krzek, and M. Stolarczyk, Simultaneous analysis of hydrochlorothiazide, triamterene, furosemide, and spironolactone by densitometric TLC, Journal of Planar
Chromatography, Vol.22, No.6, 2009, pp. 405-410.
[41] B.H. Mehta, and S.B. Morge, HPTLC–densitometric analysis of candesartan cilexetil and hydrochlorothiazide in Tablets, Journal of
Planar Chromatography, Vol.21, No.3, 2008, pp. 173-176.
[42] V. Mirakor, V. Vaidya, S. Menon, P. Champanerker, and A. Laud, HPTLC method for determination of colchicine in a pharmaceutical formulation, Journal of Planar
Chromatography, Vol., No., 200, pp. -.21 (2008) 3, 187–189
[43] M.A. Farajzadeh, K. Farhadi, A.A. Matin, P. Hashemi, and A. Jouyban, Headspace solid-phase microextraction-gas chromatography method for the determination of valproic acid in human serum, and formulations using hollow-fiber coated wire, Analytical Sciences, Vol.25, No.7, 2009, pp. 875-879.
[44] B. Yilmaz, Simultaneous Determination of estradiol valerate and medroxyprogesterone acetate in a tablet formulation by gas chromatography–mass spectrometry, Analytical Sciences, Vol.26, No.3, 2010, pp. 391-393.
[45] R. Martino, M. Malet-Martino, V. Gilard, and S. Balayssac, Counterfeit drugs: analytical techniques for their identification, Analytical
and Bioanalytical Chemistry, Vol., No., 200, pp. -. (2010) 398:77–92.
[46] B. Dejaegher, and Y.V. Heyden, HILIC methods in pharmaceutical analysis, Journal
of Separation Science, Vol.33, No.6-7, 2010, pp. 698-715.
[47] R. Casagrande, M.M. Baracat, S.R. Georgetti, W.A.V. Junior, F.T.M.C. Vicentini, J.A.
Rafael, J.R. Jabor, and M.J.V. Fonseca, Method validation and stability study of quercetin in topical emulsions, Quimica Nova,
Vol.32, No.7, 2009, pp. 1939-1942. [48] S. Chopra, G. Vanderheyden, J. Hoogmartens,
A.V. Schepdael, and E. Adams, Comparative study on the analytical performance of different detectors for the liquid chromatographic analysis of tobramycin, Journal of Pharmaceutical and Biomedical
Analysis, Vol.53, No.2, 2010, pp. 151-157. [49] M. D’Hondt, S.V. Dorpe, E. Mehuys, D.
Deforce, and B.D. Spiegeleer, Quality analysis of salmon calcitonin in a polymeric bioadhesive pharmaceutical formulation: Sample preparation optimization by DOE, Journal of Pharmaceutical and Biomedical
Analysis, Vol.53, No.4, 2010, pp. 939-945. [50] N. Davydova, E. Stippler, P. Jin, and G.
Giancaspro, Development and validation of a dissolution test method for vitamin A in dietary supplement tablets, Journal of
Pharmaceutical and Biomedical Analysis, Vol.53, No.3, 2010, pp. 295-301.
[51] M.K. Mone, and K.B. Chandrasekhar, Degradation studies of pentoxifylline: Isolation and characterization of a novel gem-dihydroperoxide derivative as major oxidative degradation product, Journal of
Pharmaceutical and Biomedical Analysis, Vol.53, No.3, 2010, pp. 335-342.
[52] R.N. Rao, B. Ramachandra, R.M. Vali, S.S. Raju, LC–MS/MS studies of ritonavir and its forced degradation products, Journal of
Pharmaceutical and Biomedical Analysis, Vol.53, No.4, 2010, pp. 833-842.
[53] L. Zanitti, R. Ferretti, B. Gallinella, F.L. Torre, M.L. Sanna, A. Mosca, and R. Cirilli, Direct HPLC enantioseparation of omeprazole and its chiral impurities: Application to the determination of enantiomeric purity of esomeprazole magnesium trihydrate, Journal
of Pharmaceutical and Biomedical Analysis, Vol.52, No.5, 2010, pp. 665-671.
[54] J.L. Veuthey, Capillary electrophoresis in pharmaceutical and biomedical analysis, Analytical and Bioanalytical Chemistry, Vol.381, No.1, 2005, pp. 93-95.
[55] L. Sánchez-Hernández, C. García-Ruiz, A.L. Crego, and M.L. Marina, Sensitive determination of d-carnitine as enantiomeric impurity of levo-carnitine in pharmaceutical formulations by capillary electrophoresis–tandem mass spectrometry, Journal of
WSEAS TRANSACTIONS on BIOLOGY and BIOMEDICINE Rudy Bonfilio, Magali Benjamim De Araujo, Herida Regina Nunes Salgado
ISSN: 1109-9518 337 Issue 4, Volume 7, October 2010
Pharmaceutical and Biomedical Analysis, Vol.53, No.5, 2010, pp. 1217-1223.
[56] K.M.A. Azzam, B. Saad, and H.Y. Aboul-Enein, Simultaneous determination of atenolol, chlorthalidone and amiloride in pharmaceutical preparations by capillary zone electrophoresis with ultraviolet detection, Biomedical Chromatography, Vol.24, No.9, 2010, pp. 977-981.
[57] F.S. Kika, C.K. Zacharis, G.A. Theodoridis, and A.N. Voulgaropoulos, Validated assay for the determination of mitoxantrone in pharmaceuticals using capillary zone electrophoresis, Analytical Letters, Vol.42, No.6, 2009, pp. 842-855.
[58] M. Rambla-Alegre, J. Peris-Vicente, J. Esteve-Romero, M.-E. Capella-Peiró, and D. Bose, Capillary electrophoresis determination of antihistamines in serum and pharmaceuticals, Analytica Chimica Acta, Vol.666, No.1-2, 2010, pp. 102-109.
[59] H. Zhu, E. Wu, J. Chen, C. Men, Y.-S. Jang, W. Kang, J.K. Choi, W. Lee, and J.S. Kang, Enantioseparation and determination of sibutramine in pharmaceutical formulations by capillary electrophoresis, Bulletin of
the Korean Chemical Society, Vol.31, No.6, 2010, pp. 1496-1500.
[60] W. Li, L. Xing, L. Fang, J. Wang, and H. Qu, Application of near infrared spectroscopy for rapid analysis of intermediates of Tanreqing
injection, Journal of Pharmaceutical and
Biomedical Analysis, Vol.53, No.3, 2010, pp. 350-358.
[61] C. Oh, S. Yoon, E. Kim, J. Han, H. Chung, and H.-J. Jeong, Non-destructive determination of TiO2 concentration in cream formulation using Raman spectroscopy, Journal of Pharmaceutical and Biomedical
Analysis, Vol.53, No.3, 2010, pp. 762-766. [62] Z. Talebpour, R. Tavallaie, S.H. Ahmadi, and
A. Abdollahpour, Simultaneous determination of penicillin G salts by infrared spectroscopy: Evaluation of combining orthogonal signal correction with radial basis function-partial least squares regression, Spectrochimica Acta
Part A, Vol.76, No.5, 2010, pp. 452-457. [63] Y. Hu, A. Erxleben, A.G. Ryder, and P.
McArdle, Quantitative analysis of sulfathiazole polymorphs in ternary mixtures by attenuated total reflectance infrared, near-infrared and Raman spectroscopy, Journal of
Pharmaceutical and Biomedical Analysis, Vol.53, No.3, 2010, pp. 412-420.
[64] E. Ziémonsa, J. Mantanus, P. Lebrun, E. Rozet, B. Evrard, and P. Hubert, Acetaminophen determination in low-dose pharmaceutical syrup by NIR spectroscopy, Journal of Pharmaceutical and Biomedical
Analysis, Vol.53, No.3, 2010, pp. 510-516.
WSEAS TRANSACTIONS on BIOLOGY and BIOMEDICINE Rudy Bonfilio, Magali Benjamim De Araujo, Herida Regina Nunes Salgado
ISSN: 1109-9518 338 Issue 4, Volume 7, October 2010